Zip Codes with the Highest Percentage of Households with Income Below $10,000 in Hartford, CT
RELATED REPORTS & OPTIONS
Household Income | $0-10k
Hartford
Compare Zip Codes
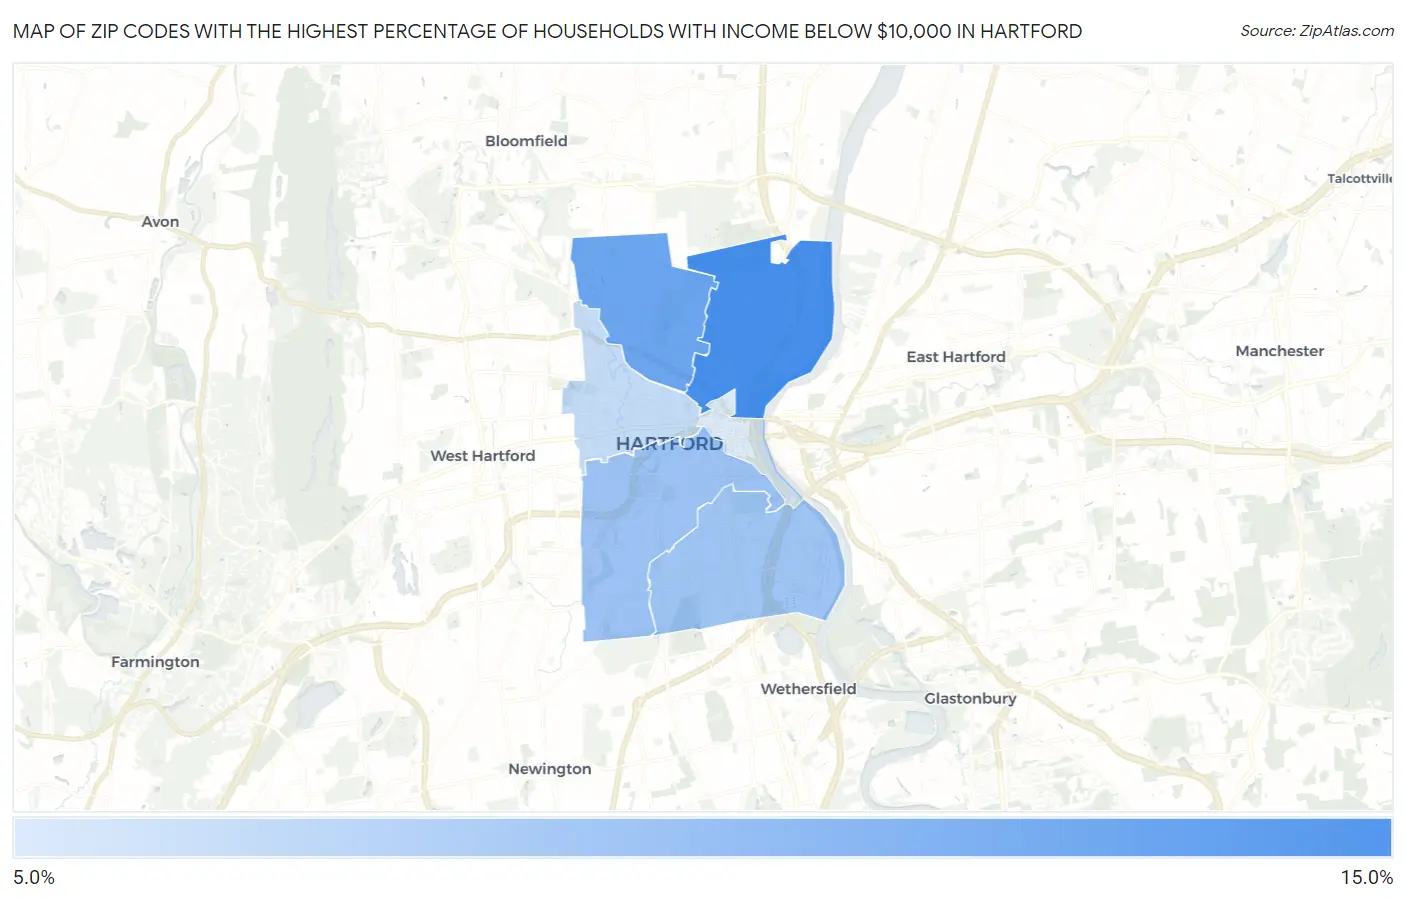
Map of Zip Codes with the Highest Percentage of Households with Income Below $10,000 in Hartford
7.5%
14.8%
Zip Codes with the Highest Percentage of Households with Income Below $10,000 in Hartford, CT
| Zip Code | Households with Income < $10k | vs State | vs National | |
| 1. | 06120 | 14.8% | 4.3%(+10.5)#9 | 4.9%(+9.90)#1,564 |
| 2. | 06112 | 13.0% | 4.3%(+8.70)#10 | 4.9%(+8.10)#2,067 |
| 3. | 06106 | 10.7% | 4.3%(+6.40)#11 | 4.9%(+5.80)#3,113 |
| 4. | 06114 | 10.5% | 4.3%(+6.20)#12 | 4.9%(+5.60)#3,232 |
| 5. | 06105 | 8.7% | 4.3%(+4.40)#22 | 4.9%(+3.80)#4,735 |
| 6. | 06103 | 7.5% | 4.3%(+3.20)#34 | 4.9%(+2.60)#6,277 |
1
Common Questions
What are the Top 5 Zip Codes with the Highest Percentage of Households with Income Below $10,000 in Hartford, CT?
Top 5 Zip Codes with the Highest Percentage of Households with Income Below $10,000 in Hartford, CT are:
What zip code has the Highest Percentage of Households with Income Below $10,000 in Hartford, CT?
06120 has the Highest Percentage of Households with Income Below $10,000 in Hartford, CT with 14.8%.
What is the Percentage of Households with Income Below $10,000 in Hartford, CT?
Percentage of Households with Income Below $10,000 in Hartford is 11.0%.
What is the Percentage of Households with Income Below $10,000 in Connecticut?
Percentage of Households with Income Below $10,000 in Connecticut is 4.3%.
What is the Percentage of Households with Income Below $10,000 in the United States?
Percentage of Households with Income Below $10,000 in the United States is 4.9%.