Zip Codes with the Highest Percentage of Population Employed in Architecture & Engineering in New Britain, CT
RELATED REPORTS & OPTIONS
Architecture & Engineering
New Britain
Compare Zip Codes
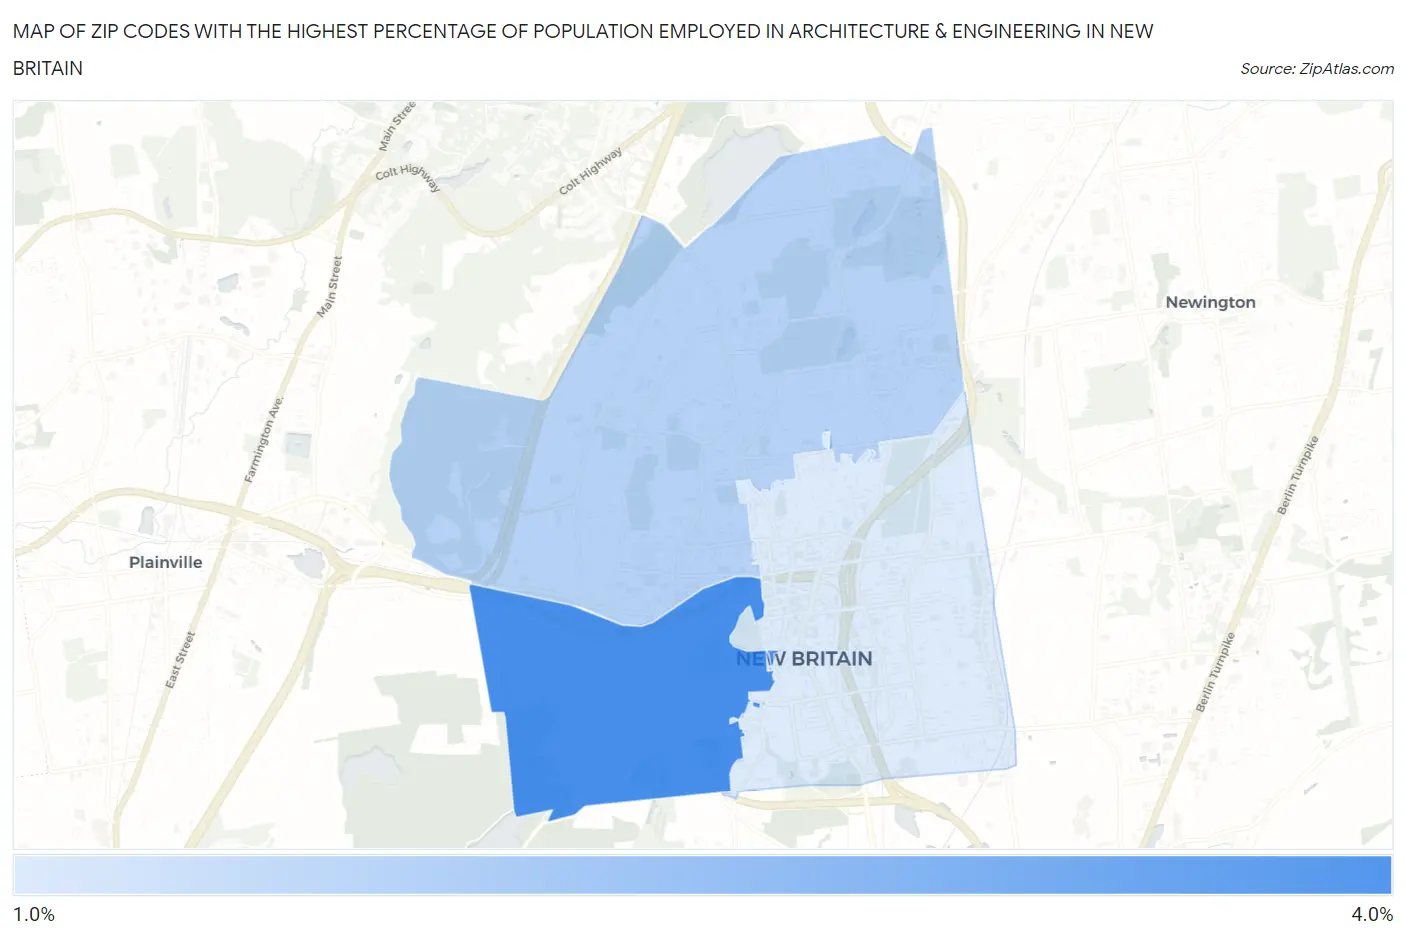
Map of Zip Codes with the Highest Percentage of Population Employed in Architecture & Engineering in New Britain
1.1%
3.2%
Zip Codes with the Highest Percentage of Population Employed in Architecture & Engineering in New Britain, CT
| Zip Code | % Employed | vs State | vs National | |
| 1. | 06052 | 3.2% | 2.6%(+0.651)#84 | 2.1%(+1.08)#4,395 |
| 2. | 06053 | 1.7% | 2.6%(-0.910)#166 | 2.1%(-0.483)#11,725 |
| 3. | 06051 | 1.1% | 2.6%(-1.45)#204 | 2.1%(-1.02)#15,650 |
1
Common Questions
What are the Top Zip Codes with the Highest Percentage of Population Employed in Architecture & Engineering in New Britain, CT?
Top Zip Codes with the Highest Percentage of Population Employed in Architecture & Engineering in New Britain, CT are:
What zip code has the Highest Percentage of Population Employed in Architecture & Engineering in New Britain, CT?
06052 has the Highest Percentage of Population Employed in Architecture & Engineering in New Britain, CT with 3.2%.
What is the Percentage of Population Employed in Architecture & Engineering in New Britain, CT?
Percentage of Population Employed in Architecture & Engineering in New Britain is 1.6%.
What is the Percentage of Population Employed in Architecture & Engineering in Connecticut?
Percentage of Population Employed in Architecture & Engineering in Connecticut is 2.6%.
What is the Percentage of Population Employed in Architecture & Engineering in the United States?
Percentage of Population Employed in Architecture & Engineering in the United States is 2.1%.