Zip Codes with the Highest Percentage of Households with Income Above $200,000 in New Britain, CT
RELATED REPORTS & OPTIONS
Household Income | $200k+
New Britain
Compare Zip Codes
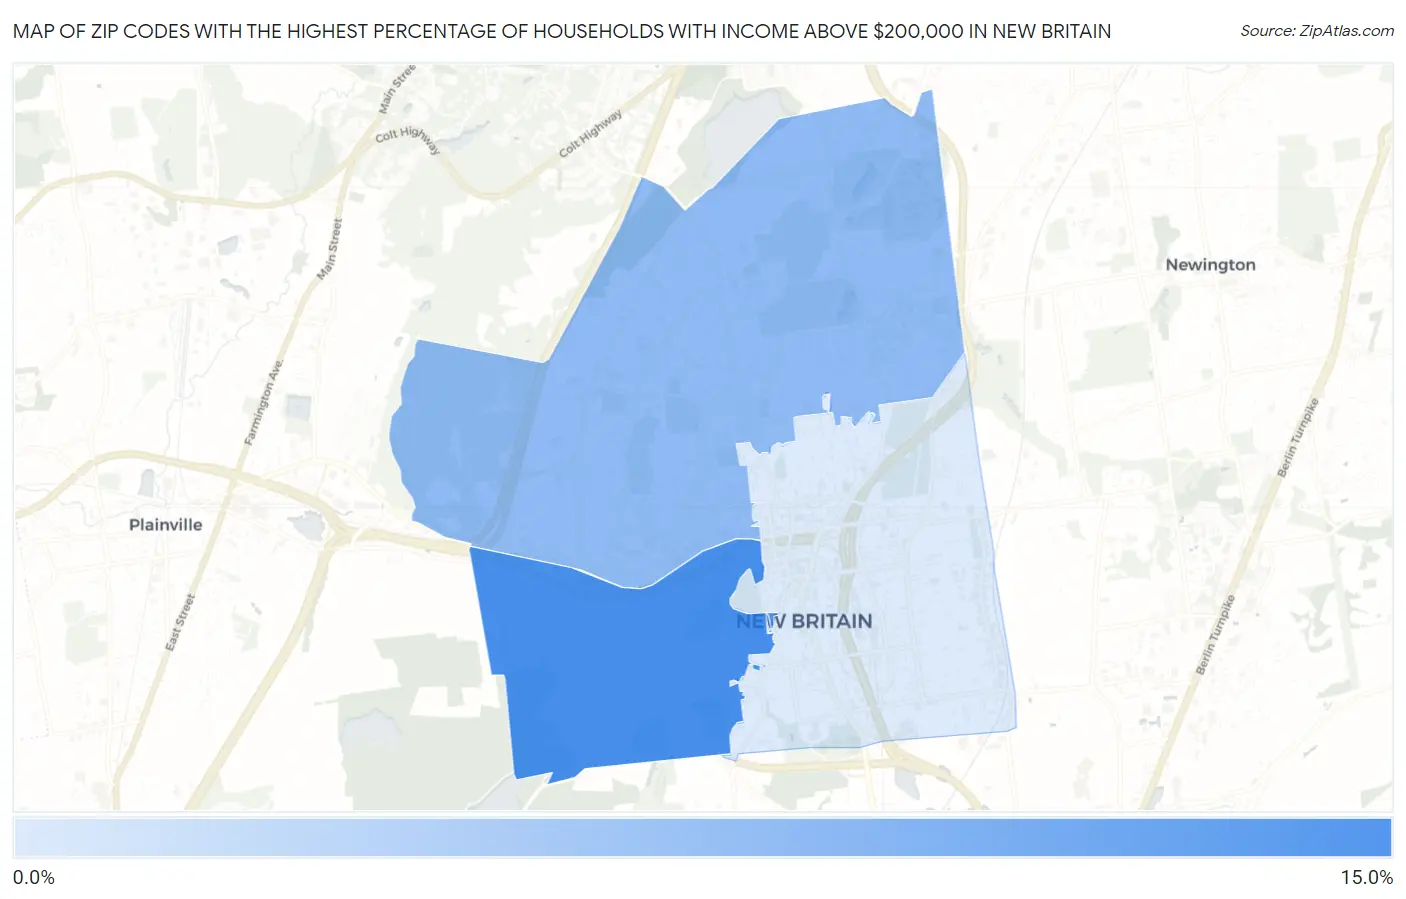
Map of Zip Codes with the Highest Percentage of Households with Income Above $200,000 in New Britain
2.1%
10.2%
Zip Codes with the Highest Percentage of Households with Income Above $200,000 in New Britain, CT
| Zip Code | Households with Income > $200k | vs State | vs National | |
| 1. | 06052 | 10.2% | 17.0%(-6.80)#202 | 11.4%(-1.20)#8,076 |
| 2. | 06053 | 6.3% | 17.0%(-10.7)#240 | 11.4%(-5.10)#12,907 |
| 3. | 06051 | 2.1% | 17.0%(-14.9)#266 | 11.4%(-9.30)#23,456 |
1
Common Questions
What are the Top Zip Codes with the Highest Percentage of Households with Income Above $200,000 in New Britain, CT?
Top Zip Codes with the Highest Percentage of Households with Income Above $200,000 in New Britain, CT are:
What zip code has the Highest Percentage of Households with Income Above $200,000 in New Britain, CT?
06052 has the Highest Percentage of Households with Income Above $200,000 in New Britain, CT with 10.2%.
What is the Percentage of Households with Income Above $200,000 in New Britain, CT?
Percentage of Households with Income Above $200,000 in New Britain is 4.9%.
What is the Percentage of Households with Income Above $200,000 in Connecticut?
Percentage of Households with Income Above $200,000 in Connecticut is 17.0%.
What is the Percentage of Households with Income Above $200,000 in the United States?
Percentage of Households with Income Above $200,000 in the United States is 11.4%.