Zip Codes with the Highest Percentage of Population Employed in Farming, Fishing & Forestry in New Britain, CT
RELATED REPORTS & OPTIONS
Farming, Fishing & Forestry
New Britain
Compare Zip Codes
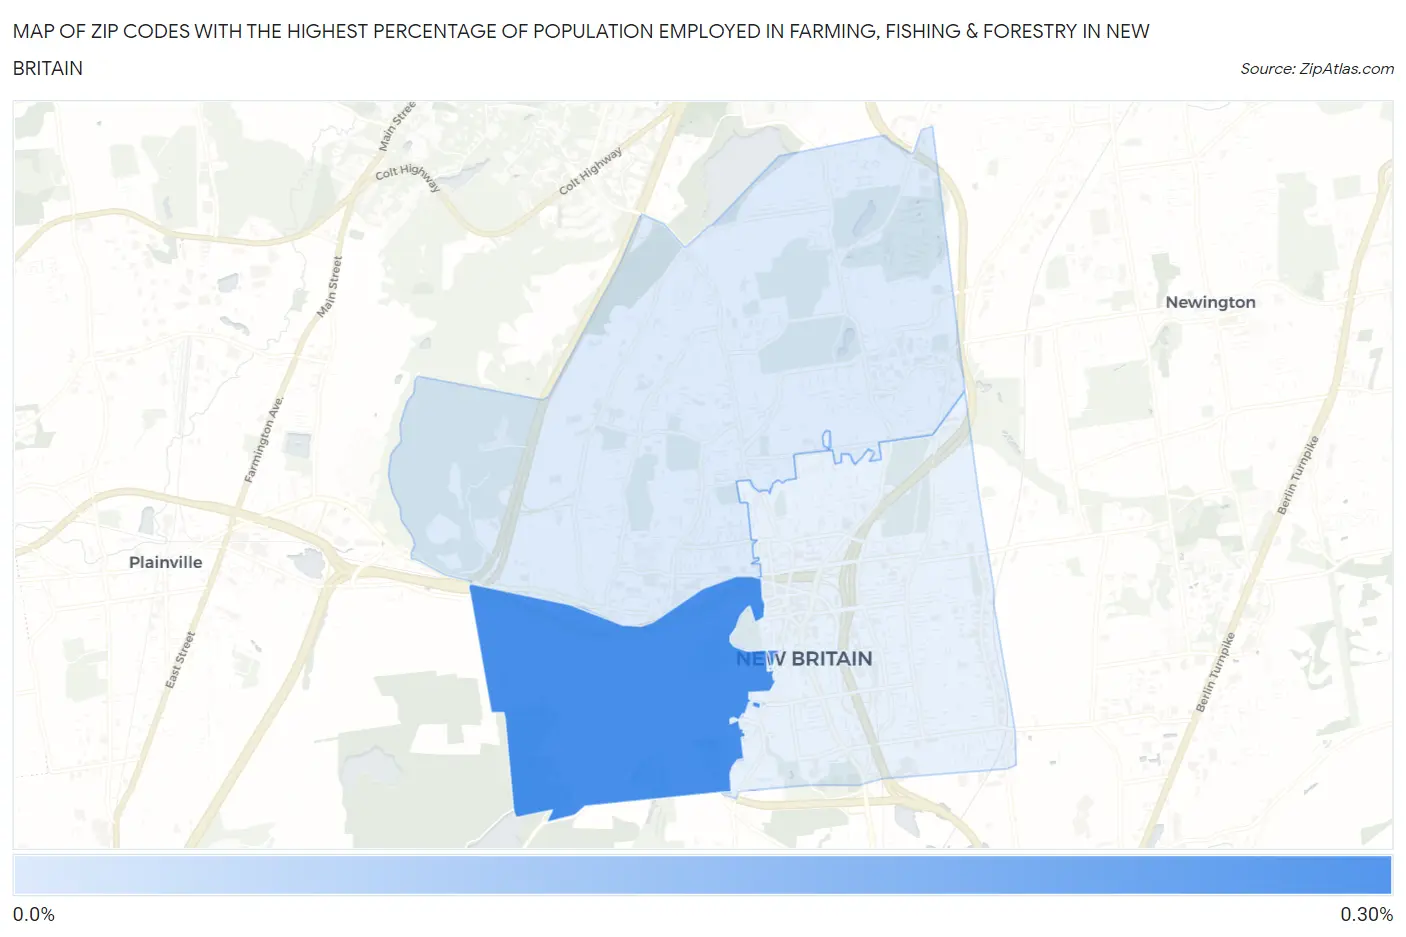
Map of Zip Codes with the Highest Percentage of Population Employed in Farming, Fishing & Forestry in New Britain
0.057%
0.26%
Zip Codes with the Highest Percentage of Population Employed in Farming, Fishing & Forestry in New Britain, CT
| Zip Code | % Employed | vs State | vs National | |
| 1. | 06052 | 0.26% | 0.18%(+0.085)#63 | 0.61%(-0.343)#15,248 |
| 2. | 06053 | 0.057% | 0.18%(-0.121)#107 | 0.61%(-0.549)#18,537 |
1
Common Questions
What are the Top Zip Codes with the Highest Percentage of Population Employed in Farming, Fishing & Forestry in New Britain, CT?
Top Zip Codes with the Highest Percentage of Population Employed in Farming, Fishing & Forestry in New Britain, CT are:
What zip code has the Highest Percentage of Population Employed in Farming, Fishing & Forestry in New Britain, CT?
06052 has the Highest Percentage of Population Employed in Farming, Fishing & Forestry in New Britain, CT with 0.26%.
What is the Percentage of Population Employed in Farming, Fishing & Forestry in New Britain, CT?
Percentage of Population Employed in Farming, Fishing & Forestry in New Britain is 0.060%.
What is the Percentage of Population Employed in Farming, Fishing & Forestry in Connecticut?
Percentage of Population Employed in Farming, Fishing & Forestry in Connecticut is 0.18%.
What is the Percentage of Population Employed in Farming, Fishing & Forestry in the United States?
Percentage of Population Employed in Farming, Fishing & Forestry in the United States is 0.61%.