Zip Codes with the Highest Percentage of Population Employed in Food Preparation & Serving in Hartford, CT
RELATED REPORTS & OPTIONS
Food Preparation & Serving
Hartford
Compare Zip Codes
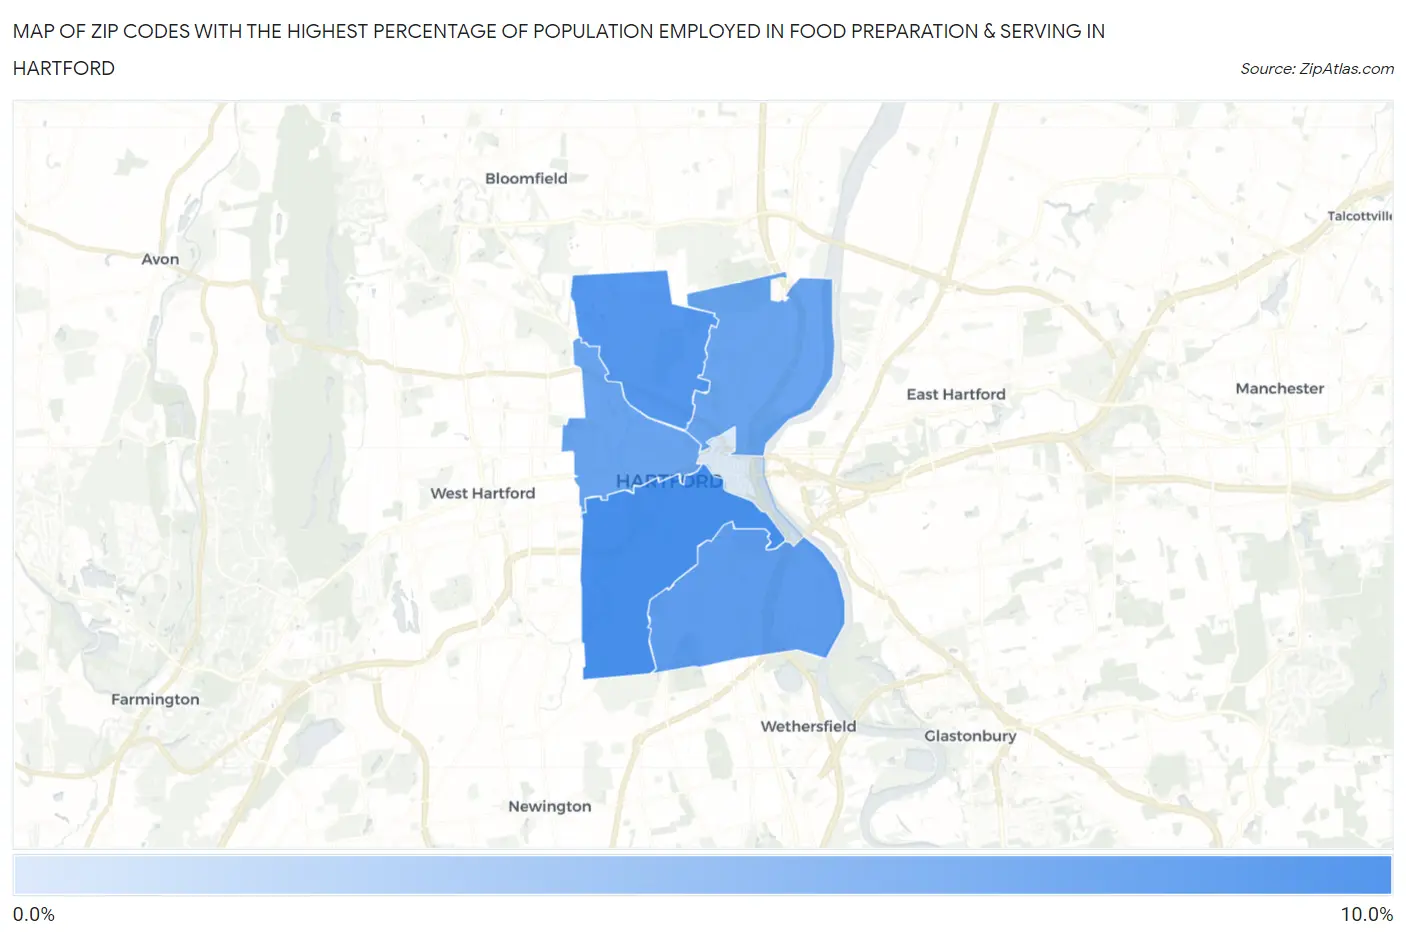
Map of Zip Codes with the Highest Percentage of Population Employed in Food Preparation & Serving in Hartford
1.1%
8.0%
Zip Codes with the Highest Percentage of Population Employed in Food Preparation & Serving in Hartford, CT
| Zip Code | % Employed | vs State | vs National | |
| 1. | 06106 | 8.0% | 4.7%(+3.36)#28 | 5.3%(+2.76)#4,660 |
| 2. | 06112 | 7.4% | 4.7%(+2.75)#38 | 5.3%(+2.15)#5,676 |
| 3. | 06114 | 6.9% | 4.7%(+2.26)#45 | 5.3%(+1.66)#6,707 |
| 4. | 06105 | 6.4% | 4.7%(+1.75)#56 | 5.3%(+1.15)#8,045 |
| 5. | 06120 | 6.4% | 4.7%(+1.72)#57 | 5.3%(+1.12)#8,127 |
| 6. | 06103 | 1.1% | 4.7%(-3.61)#244 | 5.3%(-4.21)#26,855 |
1
Common Questions
What are the Top 5 Zip Codes with the Highest Percentage of Population Employed in Food Preparation & Serving in Hartford, CT?
Top 5 Zip Codes with the Highest Percentage of Population Employed in Food Preparation & Serving in Hartford, CT are:
What zip code has the Highest Percentage of Population Employed in Food Preparation & Serving in Hartford, CT?
06106 has the Highest Percentage of Population Employed in Food Preparation & Serving in Hartford, CT with 8.0%.
What is the Percentage of Population Employed in Food Preparation & Serving in Hartford, CT?
Percentage of Population Employed in Food Preparation & Serving in Hartford is 7.1%.
What is the Percentage of Population Employed in Food Preparation & Serving in Connecticut?
Percentage of Population Employed in Food Preparation & Serving in Connecticut is 4.7%.
What is the Percentage of Population Employed in Food Preparation & Serving in the United States?
Percentage of Population Employed in Food Preparation & Serving in the United States is 5.3%.