Zip Codes with the Highest Percentage of Population Employed in Agriculture, Fishing & Hunting in Hartford, CT
RELATED REPORTS & OPTIONS
Agriculture, Fishing & Hunting
Hartford
Compare Zip Codes
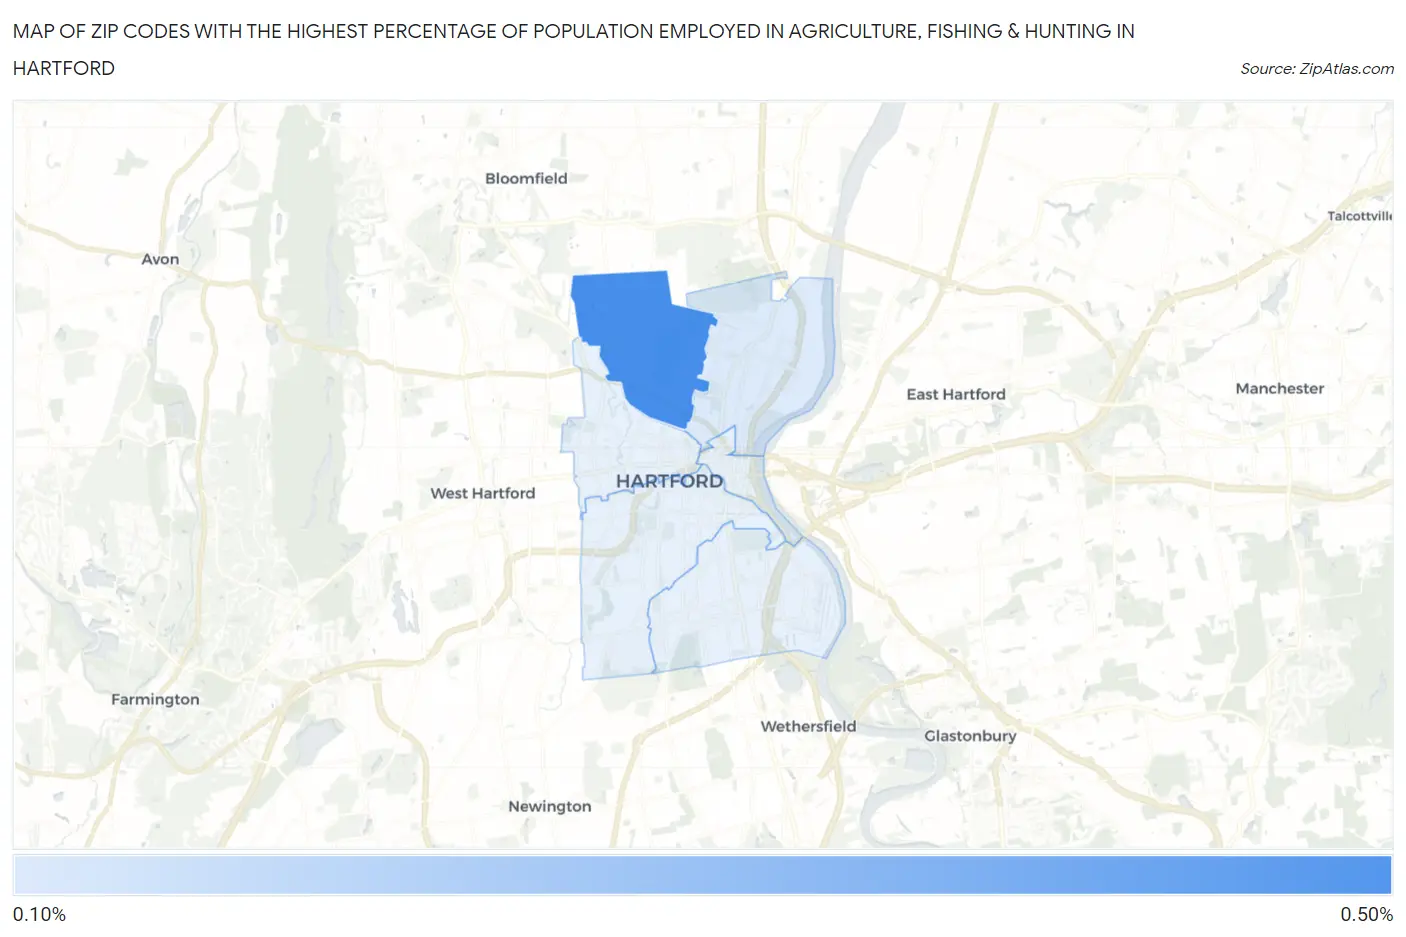
Map of Zip Codes with the Highest Percentage of Population Employed in Agriculture, Fishing & Hunting in Hartford
0.15%
0.42%
Zip Codes with the Highest Percentage of Population Employed in Agriculture, Fishing & Hunting in Hartford, CT
| Zip Code | % Employed | vs State | vs National | |
| 1. | 06112 | 0.42% | 0.36%(+0.060)#94 | 1.2%(-0.783)#20,009 |
| 2. | 06120 | 0.15% | 0.36%(-0.204)#144 | 1.2%(-1.05)#22,975 |
1
Common Questions
What are the Top 5 Zip Codes with the Highest Percentage of Population Employed in Agriculture, Fishing & Hunting in Hartford, CT?
Top 5 Zip Codes with the Highest Percentage of Population Employed in Agriculture, Fishing & Hunting in Hartford, CT are:
What zip code has the Highest Percentage of Population Employed in Agriculture, Fishing & Hunting in Hartford, CT?
06112 has the Highest Percentage of Population Employed in Agriculture, Fishing & Hunting in Hartford, CT with 0.42%.
What is the Percentage of Population Employed in Agriculture, Fishing & Hunting in Hartford, CT?
Percentage of Population Employed in Agriculture, Fishing & Hunting in Hartford is 0.086%.
What is the Percentage of Population Employed in Agriculture, Fishing & Hunting in Connecticut?
Percentage of Population Employed in Agriculture, Fishing & Hunting in Connecticut is 0.36%.
What is the Percentage of Population Employed in Agriculture, Fishing & Hunting in the United States?
Percentage of Population Employed in Agriculture, Fishing & Hunting in the United States is 1.2%.