Zip Codes with the Highest Percentage of Population with a Degree in Visual and Performing Arts in Hartford, CT
RELATED REPORTS & OPTIONS
Visual and Performing Arts
Hartford
Compare Zip Codes
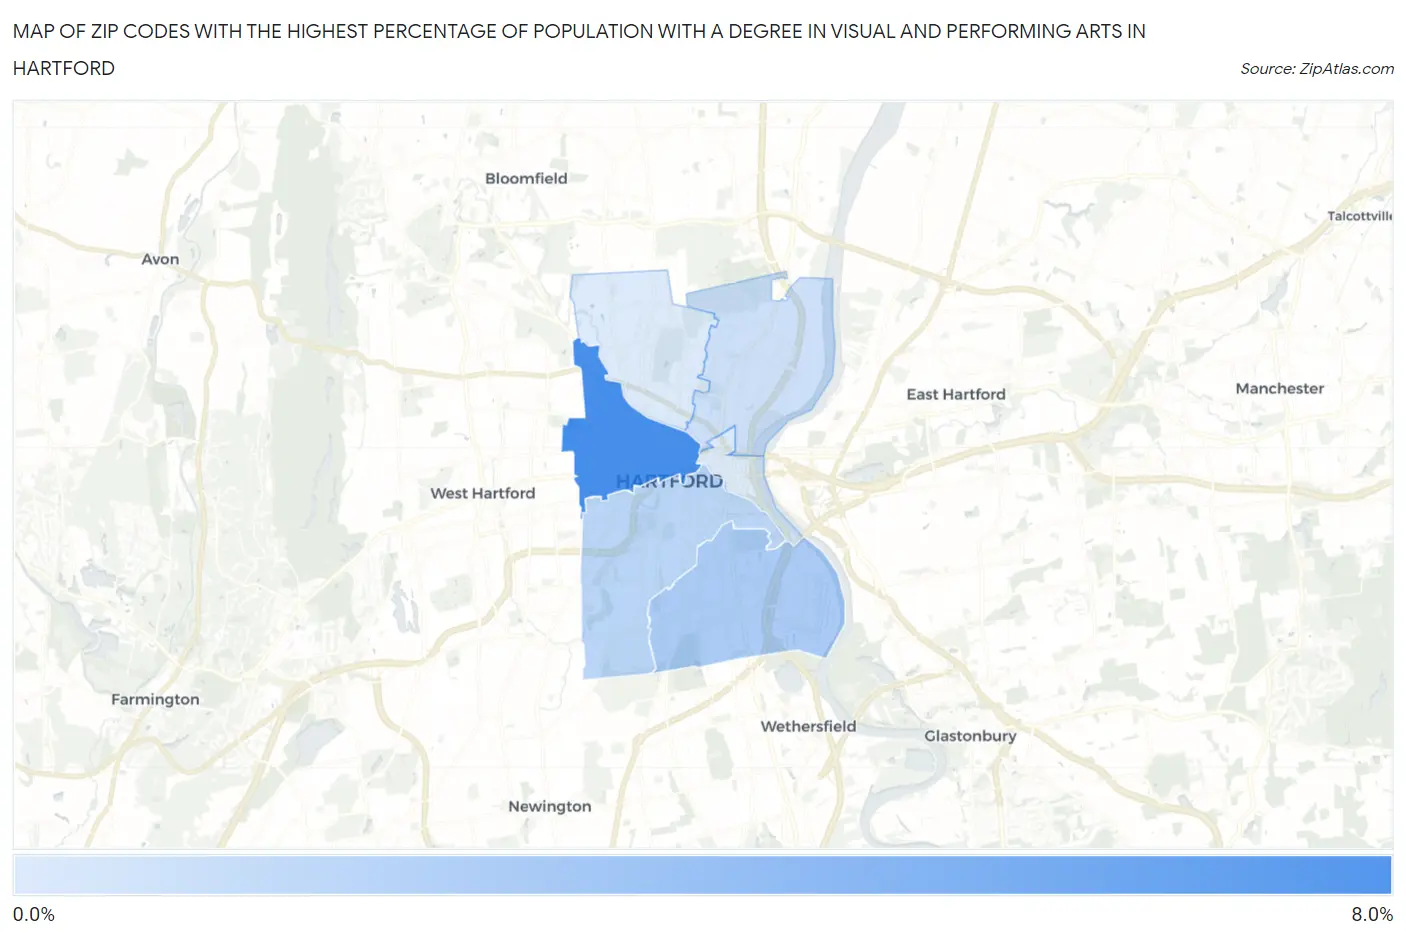
Map of Zip Codes with the Highest Percentage of Population with a Degree in Visual and Performing Arts in Hartford
0.99%
6.9%
Zip Codes with the Highest Percentage of Population with a Degree in Visual and Performing Arts in Hartford, CT
| Zip Code | % Graduates | vs State | vs National | |
| 1. | 06105 | 6.9% | 4.7%(+2.17)#55 | 4.3%(+2.63)#3,777 |
| 2. | 06114 | 2.9% | 4.7%(-1.81)#196 | 4.3%(-1.34)#13,060 |
| 3. | 06106 | 2.3% | 4.7%(-2.40)#215 | 4.3%(-1.93)#15,311 |
| 4. | 06120 | 1.6% | 4.7%(-3.09)#239 | 4.3%(-2.62)#17,725 |
| 5. | 06103 | 1.0% | 4.7%(-3.70)#249 | 4.3%(-3.24)#19,626 |
| 6. | 06112 | 0.99% | 4.7%(-3.73)#250 | 4.3%(-3.26)#19,687 |
1
Common Questions
What are the Top 5 Zip Codes with the Highest Percentage of Population with a Degree in Visual and Performing Arts in Hartford, CT?
Top 5 Zip Codes with the Highest Percentage of Population with a Degree in Visual and Performing Arts in Hartford, CT are:
What zip code has the Highest Percentage of Population with a Degree in Visual and Performing Arts in Hartford, CT?
06105 has the Highest Percentage of Population with a Degree in Visual and Performing Arts in Hartford, CT with 6.9%.
What is the Percentage of Population with a Degree in Visual and Performing Arts in Hartford, CT?
Percentage of Population with a Degree in Visual and Performing Arts in Hartford is 3.2%.
What is the Percentage of Population with a Degree in Visual and Performing Arts in Connecticut?
Percentage of Population with a Degree in Visual and Performing Arts in Connecticut is 4.7%.
What is the Percentage of Population with a Degree in Visual and Performing Arts in the United States?
Percentage of Population with a Degree in Visual and Performing Arts in the United States is 4.3%.