Cities with the Highest Percentage of Self-Employed / Not Incorporated in Connecticut
RELATED REPORTS & OPTIONS
Self-Employed / Not Incorporated
Connecticut
Compare Cities
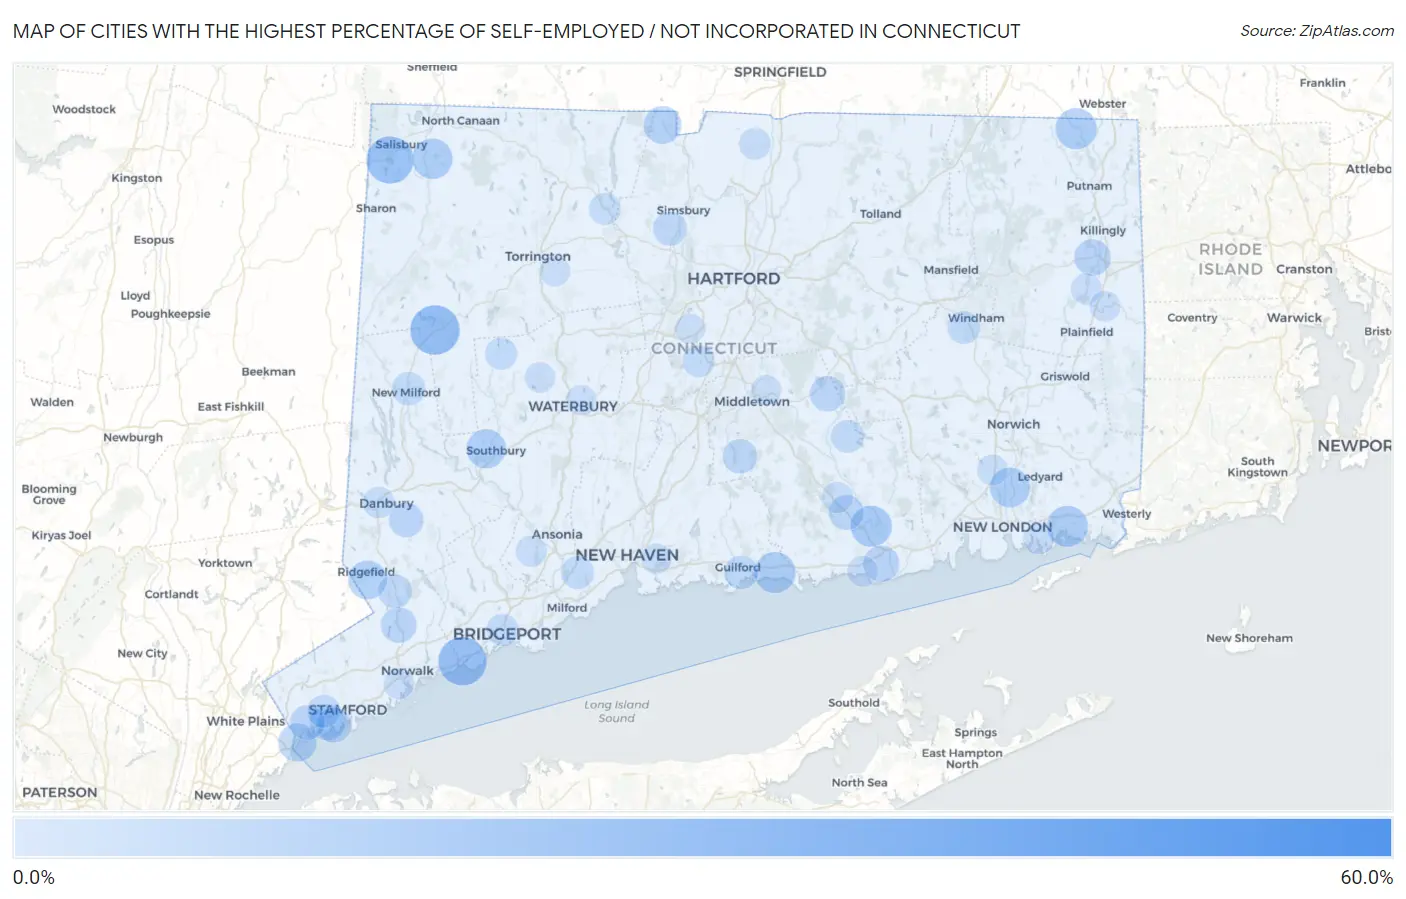
Map of Cities with the Highest Percentage of Self-Employed / Not Incorporated in Connecticut
0.0%
60.0%
Cities with the Highest Percentage of Self-Employed / Not Incorporated in Connecticut
| City | % Self-Employed / Not Incorporated | vs State | vs National | |
| 1. | Riverton | 53.3% | 6.1%(+47.2)#1 | 5.8%(+47.5)#206 |
| 2. | Pleasant Valley | 43.2% | 6.1%(+37.1)#2 | 5.8%(+37.4)#326 |
| 3. | Cornwall Bridge | 30.9% | 6.1%(+24.8)#3 | 5.8%(+25.0)#609 |
| 4. | New Preston | 26.1% | 6.1%(+20.1)#4 | 5.8%(+20.3)#866 |
| 5. | Southport | 25.0% | 6.1%(+19.0)#5 | 5.8%(+19.2)#938 |
| 6. | Candlewood Isle | 24.3% | 6.1%(+18.3)#6 | 5.8%(+18.5)#1,008 |
| 7. | Lakeville | 23.7% | 6.1%(+17.6)#7 | 5.8%(+17.9)#1,060 |
| 8. | Fenwick Borough | 23.5% | 6.1%(+17.5)#8 | 5.8%(+17.7)#1,080 |
| 9. | Plattsville | 23.4% | 6.1%(+17.3)#9 | 5.8%(+17.6)#1,091 |
| 10. | Lakeside Woods | 22.3% | 6.1%(+16.2)#10 | 5.8%(+16.5)#1,207 |
| 11. | Lakes East | 21.4% | 6.1%(+15.3)#11 | 5.8%(+15.6)#1,322 |
| 12. | Route 7 Gateway | 20.8% | 6.1%(+14.7)#12 | 5.8%(+14.9)#1,403 |
| 13. | Oronoque | 19.2% | 6.1%(+13.2)#13 | 5.8%(+13.4)#1,638 |
| 14. | Coleytown | 19.1% | 6.1%(+13.0)#14 | 5.8%(+13.3)#1,656 |
| 15. | Sail Harbor | 18.9% | 6.1%(+12.9)#15 | 5.8%(+13.1)#1,689 |
| 16. | Taylor Corners | 18.5% | 6.1%(+12.5)#16 | 5.8%(+12.7)#1,754 |
| 17. | Essex Village | 17.6% | 6.1%(+11.5)#17 | 5.8%(+11.8)#1,945 |
| 18. | Quinebaug | 17.5% | 6.1%(+11.5)#18 | 5.8%(+11.7)#1,948 |
| 19. | Madison Center | 17.3% | 6.1%(+11.2)#19 | 5.8%(+11.5)#2,016 |
| 20. | Mystic | 17.2% | 6.1%(+11.1)#20 | 5.8%(+11.4)#2,042 |
| 21. | Cornwall | 17.1% | 6.1%(+11.1)#21 | 5.8%(+11.3)#2,055 |
| 22. | Falls Village | 16.7% | 6.1%(+10.6)#22 | 5.8%(+10.9)#2,130 |
| 23. | Gales Ferry | 16.1% | 6.1%(+10.1)#23 | 5.8%(+10.3)#2,304 |
| 24. | Heritage Village | 15.5% | 6.1%(+9.40)#24 | 5.8%(+9.64)#2,485 |
| 25. | Ridgefield | 14.8% | 6.1%(+8.69)#25 | 5.8%(+8.94)#2,727 |
| 26. | Byram | 14.4% | 6.1%(+8.34)#26 | 5.8%(+8.58)#2,833 |
| 27. | Stonington Borough | 14.3% | 6.1%(+8.20)#27 | 5.8%(+8.44)#2,905 |
| 28. | Bigelow Corners | 14.1% | 6.1%(+8.02)#28 | 5.8%(+8.26)#2,961 |
| 29. | South Wilton | 14.0% | 6.1%(+7.94)#29 | 5.8%(+8.19)#2,991 |
| 30. | Weston | 13.9% | 6.1%(+7.84)#30 | 5.8%(+8.09)#3,038 |
| 31. | Candlewood Knolls | 13.9% | 6.1%(+7.83)#31 | 5.8%(+8.07)#3,045 |
| 32. | West Cornwall | 13.9% | 6.1%(+7.83)#32 | 5.8%(+8.07)#3,050 |
| 33. | North Granby | 13.9% | 6.1%(+7.81)#33 | 5.8%(+8.05)#3,056 |
| 34. | Indian Field | 13.8% | 6.1%(+7.74)#34 | 5.8%(+7.98)#3,085 |
| 35. | Compo | 12.8% | 6.1%(+6.70)#35 | 5.8%(+6.94)#3,573 |
| 36. | East Brooklyn | 12.7% | 6.1%(+6.62)#36 | 5.8%(+6.86)#3,616 |
| 37. | Murray | 12.5% | 6.1%(+6.48)#37 | 5.8%(+6.73)#3,674 |
| 38. | Old Saybrook Center | 12.4% | 6.1%(+6.30)#38 | 5.8%(+6.54)#3,810 |
| 39. | Riverside | 12.1% | 6.1%(+6.04)#39 | 5.8%(+6.28)#3,955 |
| 40. | Wilton Center | 11.9% | 6.1%(+5.82)#40 | 5.8%(+6.06)#4,088 |
| 41. | East Hampton | 11.6% | 6.1%(+5.58)#41 | 5.8%(+5.82)#4,244 |
| 42. | Botsford | 11.2% | 6.1%(+5.18)#42 | 5.8%(+5.42)#4,512 |
| 43. | Deep River Center | 11.1% | 6.1%(+5.06)#43 | 5.8%(+5.30)#4,578 |
| 44. | Old Hill | 11.1% | 6.1%(+5.01)#44 | 5.8%(+5.25)#4,644 |
| 45. | Old Greenwich | 11.1% | 6.1%(+5.00)#45 | 5.8%(+5.24)#4,648 |
| 46. | Greenwich | 11.0% | 6.1%(+4.91)#46 | 5.8%(+5.15)#4,723 |
| 47. | Bethel | 10.8% | 6.1%(+4.74)#47 | 5.8%(+4.98)#4,849 |
| 48. | Durham | 10.6% | 6.1%(+4.55)#48 | 5.8%(+4.79)#5,001 |
| 49. | Westport | 10.4% | 6.1%(+4.36)#49 | 5.8%(+4.61)#5,168 |
| 50. | Weatogue | 10.2% | 6.1%(+4.11)#50 | 5.8%(+4.35)#5,386 |
| 51. | Witches Woods | 10.0% | 6.1%(+3.94)#51 | 5.8%(+4.18)#5,516 |
| 52. | Jewett City Borough | 9.9% | 6.1%(+3.86)#52 | 5.8%(+4.10)#5,631 |
| 53. | Georgetown | 9.8% | 6.1%(+3.78)#53 | 5.8%(+4.02)#5,709 |
| 54. | Guilford Center | 9.8% | 6.1%(+3.73)#54 | 5.8%(+3.97)#5,760 |
| 55. | New Milford | 9.5% | 6.1%(+3.49)#55 | 5.8%(+3.73)#6,034 |
| 56. | Cos Cob | 9.1% | 6.1%(+3.07)#56 | 5.8%(+3.31)#6,465 |
| 57. | Moodus | 9.1% | 6.1%(+3.04)#57 | 5.8%(+3.28)#6,489 |
| 58. | South Windham | 9.1% | 6.1%(+3.02)#58 | 5.8%(+3.26)#6,544 |
| 59. | Orange | 9.0% | 6.1%(+2.91)#59 | 5.8%(+3.15)#6,660 |
| 60. | Branchville | 8.7% | 6.1%(+2.64)#60 | 5.8%(+2.88)#6,995 |
| 61. | Staples | 8.7% | 6.1%(+2.60)#61 | 5.8%(+2.85)#7,030 |
| 62. | Bridgeport | 8.4% | 6.1%(+2.32)#62 | 5.8%(+2.57)#7,414 |
| 63. | Bridgewater | 8.3% | 6.1%(+2.28)#63 | 5.8%(+2.52)#7,503 |
| 64. | Kensington | 8.3% | 6.1%(+2.26)#64 | 5.8%(+2.51)#7,522 |
| 65. | Groton Long Point Borough | 8.3% | 6.1%(+2.24)#65 | 5.8%(+2.48)#7,552 |
| 66. | Bethlehem Village | 8.3% | 6.1%(+2.24)#66 | 5.8%(+2.48)#7,556 |
| 67. | Quasset Lake | 8.3% | 6.1%(+2.22)#67 | 5.8%(+2.46)#7,594 |
| 68. | Lordship | 8.2% | 6.1%(+2.13)#68 | 5.8%(+2.37)#7,706 |
| 69. | Suffield Depot | 8.0% | 6.1%(+1.95)#69 | 5.8%(+2.19)#7,969 |
| 70. | Noroton | 8.0% | 6.1%(+1.91)#70 | 5.8%(+2.15)#8,026 |
| 71. | Brookfield Center | 7.9% | 6.1%(+1.88)#71 | 5.8%(+2.12)#8,075 |
| 72. | New Hartford Center | 7.9% | 6.1%(+1.85)#72 | 5.8%(+2.09)#8,118 |
| 73. | Candlewood Shores | 7.8% | 6.1%(+1.70)#73 | 5.8%(+1.94)#8,361 |
| 74. | Noroton Heights | 7.7% | 6.1%(+1.60)#74 | 5.8%(+1.84)#8,521 |
| 75. | Ball Pond | 7.6% | 6.1%(+1.54)#75 | 5.8%(+1.78)#8,624 |
| 76. | Danbury | 7.6% | 6.1%(+1.53)#76 | 5.8%(+1.77)#8,641 |
| 77. | Litchfield Borough | 7.6% | 6.1%(+1.50)#77 | 5.8%(+1.75)#8,696 |
| 78. | Woodmont Borough | 7.5% | 6.1%(+1.43)#78 | 5.8%(+1.67)#8,843 |
| 79. | Sacred Heart University | 7.4% | 6.1%(+1.34)#79 | 5.8%(+1.58)#9,008 |
| 80. | Chester Center | 7.4% | 6.1%(+1.30)#80 | 5.8%(+1.54)#9,067 |
| 81. | Shelton | 7.1% | 6.1%(+1.00)#81 | 5.8%(+1.24)#9,618 |
| 82. | Poquonock Bridge | 7.0% | 6.1%(+0.970)#82 | 5.8%(+1.21)#9,680 |
| 83. | Saugatuck | 6.9% | 6.1%(+0.874)#83 | 5.8%(+1.12)#9,877 |
| 84. | Rock Ridge | 6.9% | 6.1%(+0.855)#84 | 5.8%(+1.10)#9,902 |
| 85. | Oxoboxo River | 6.9% | 6.1%(+0.842)#85 | 5.8%(+1.08)#9,924 |
| 86. | Norwalk | 6.8% | 6.1%(+0.764)#86 | 5.8%(+1.01)#10,097 |
| 87. | Saybrook Manor | 6.8% | 6.1%(+0.761)#87 | 5.8%(+1.00)#10,103 |
| 88. | Wauregan | 6.8% | 6.1%(+0.752)#88 | 5.8%(+0.994)#10,131 |
| 89. | Moosup | 6.8% | 6.1%(+0.712)#89 | 5.8%(+0.954)#10,224 |
| 90. | Lake Chaffee | 6.7% | 6.1%(+0.659)#90 | 5.8%(+0.901)#10,336 |
| 91. | Watertown | 6.7% | 6.1%(+0.644)#91 | 5.8%(+0.886)#10,367 |
| 92. | Naugatuck Borough | 6.6% | 6.1%(+0.581)#92 | 5.8%(+0.823)#10,509 |
| 93. | East Haven | 6.5% | 6.1%(+0.487)#93 | 5.8%(+0.729)#10,712 |
| 94. | Northford | 6.5% | 6.1%(+0.474)#94 | 5.8%(+0.716)#10,744 |
| 95. | Tashua | 6.4% | 6.1%(+0.336)#95 | 5.8%(+0.578)#11,067 |
| 96. | Portland | 6.4% | 6.1%(+0.302)#96 | 5.8%(+0.544)#11,144 |
| 97. | Northwest Harwinton | 6.4% | 6.1%(+0.293)#97 | 5.8%(+0.535)#11,162 |
| 98. | Waterbury | 6.3% | 6.1%(+0.240)#98 | 5.8%(+0.482)#11,283 |
| 99. | New Britain | 6.3% | 6.1%(+0.229)#99 | 5.8%(+0.471)#11,310 |
| 100. | New Canaan | 6.2% | 6.1%(+0.135)#100 | 5.8%(+0.377)#11,545 |
Common Questions
What are the Top 10 Cities with the Highest Percentage of Self-Employed / Not Incorporated in Connecticut?
Top 10 Cities with the Highest Percentage of Self-Employed / Not Incorporated in Connecticut are:
#1
26.1%
#2
25.0%
#3
23.7%
#4
17.6%
#5
17.5%
#6
17.3%
#7
17.2%
#8
16.7%
#9
16.1%
#10
15.5%
What city has the Highest Percentage of Self-Employed / Not Incorporated in Connecticut?
New Preston has the Highest Percentage of Self-Employed / Not Incorporated in Connecticut with 26.1%.
What is the Percentage of Self-Employed / Not Incorporated in the State of Connecticut?
Percentage of Self-Employed / Not Incorporated in Connecticut is 6.1%.
What is the Percentage of Self-Employed / Not Incorporated in the United States?
Percentage of Self-Employed / Not Incorporated in the United States is 5.8%.