Colchester, CT Map & Demographics
Colchester Map
Colchester Overview
$40,669
PER CAPITA INCOME
$96,300
AVG FAMILY INCOME
$74,035
AVG HOUSEHOLD INCOME
32.9%
WAGE / INCOME GAP [ % ]
67.1¢/ $1
WAGE / INCOME GAP [ $ ]
0.39
INEQUALITY / GINI INDEX
4,868
TOTAL POPULATION
2,333
MALE POPULATION
2,535
FEMALE POPULATION
92.03
MALES / 100 FEMALES
108.66
FEMALES / 100 MALES
45.9
MEDIAN AGE
2.8
AVG FAMILY SIZE
2.2
AVG HOUSEHOLD SIZE
2,281
LABOR FORCE [ PEOPLE ]
56.3%
PERCENT IN LABOR FORCE
8.0%
UNEMPLOYMENT RATE
Colchester Zip Codes
Colchester Area Codes
Income in Colchester
Income Overview in Colchester
Per Capita Income in Colchester is $40,669, while median incomes of families and households are $96,300 and $74,035 respectively.
| Characteristic | Number | Measure |
| Per Capita Income | 4,868 | $40,669 |
| Median Family Income | 1,334 | $96,300 |
| Mean Family Income | 1,334 | $107,054 |
| Median Household Income | 2,129 | $74,035 |
| Mean Household Income | 2,129 | $88,853 |
| Income Deficit | 1,334 | $0 |
| Wage / Income Gap (%) | 4,868 | 32.88% |
| Wage / Income Gap ($) | 4,868 | 67.12¢ per $1 |
| Gini / Inequality Index | 4,868 | 0.39 |
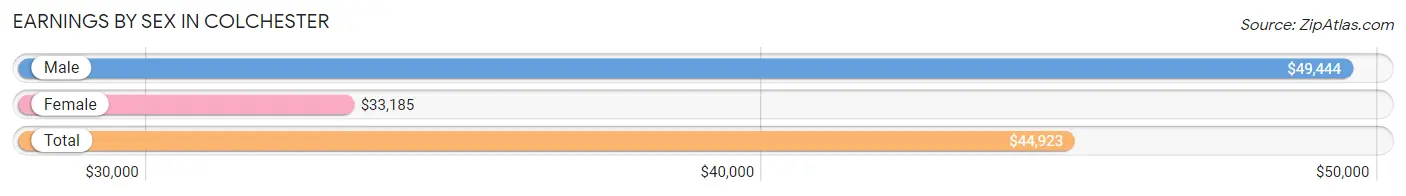
Earnings by Sex in Colchester
Average Earnings in Colchester are $44,923, $49,444 for men and $33,185 for women, a difference of 32.9%.
| Sex | Number | Average Earnings |
| Male | 1,416 (58.9%) | $49,444 |
| Female | 989 (41.1%) | $33,185 |
| Total | 2,405 (100.0%) | $44,923 |
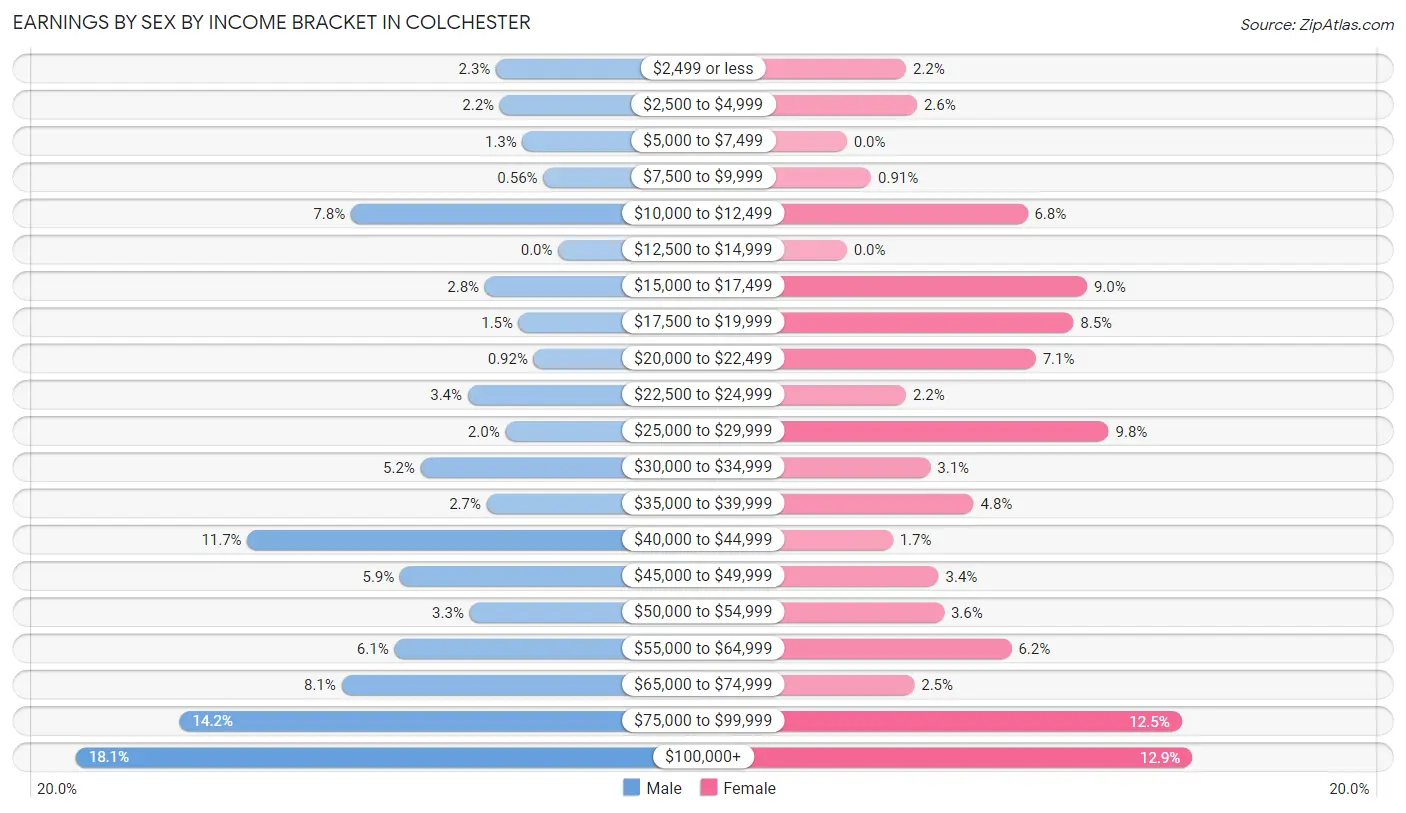
Earnings by Sex by Income Bracket in Colchester
The most common earnings brackets in Colchester are $100,000+ for men (256 | 18.1%) and $100,000+ for women (128 | 12.9%).
| Income | Male | Female |
| $2,499 or less | 33 (2.3%) | 22 (2.2%) |
| $2,500 to $4,999 | 31 (2.2%) | 26 (2.6%) |
| $5,000 to $7,499 | 19 (1.3%) | 0 (0.0%) |
| $7,500 to $9,999 | 8 (0.6%) | 9 (0.9%) |
| $10,000 to $12,499 | 110 (7.8%) | 67 (6.8%) |
| $12,500 to $14,999 | 0 (0.0%) | 0 (0.0%) |
| $15,000 to $17,499 | 39 (2.8%) | 89 (9.0%) |
| $17,500 to $19,999 | 21 (1.5%) | 84 (8.5%) |
| $20,000 to $22,499 | 13 (0.9%) | 70 (7.1%) |
| $22,500 to $24,999 | 48 (3.4%) | 22 (2.2%) |
| $25,000 to $29,999 | 28 (2.0%) | 97 (9.8%) |
| $30,000 to $34,999 | 73 (5.2%) | 31 (3.1%) |
| $35,000 to $39,999 | 38 (2.7%) | 47 (4.8%) |
| $40,000 to $44,999 | 165 (11.7%) | 17 (1.7%) |
| $45,000 to $49,999 | 84 (5.9%) | 34 (3.4%) |
| $50,000 to $54,999 | 47 (3.3%) | 36 (3.6%) |
| $55,000 to $64,999 | 87 (6.1%) | 61 (6.2%) |
| $65,000 to $74,999 | 115 (8.1%) | 25 (2.5%) |
| $75,000 to $99,999 | 201 (14.2%) | 124 (12.5%) |
| $100,000+ | 256 (18.1%) | 128 (12.9%) |
| Total | 1,416 (100.0%) | 989 (100.0%) |
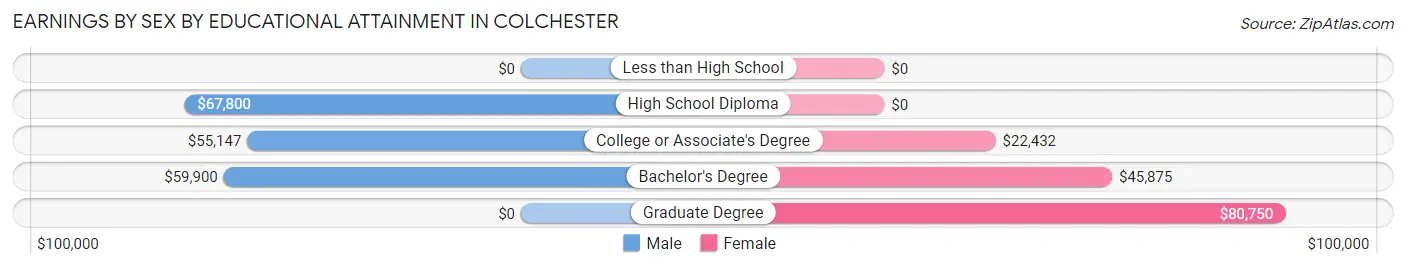
Earnings by Sex by Educational Attainment in Colchester
Average earnings in Colchester are $58,065 for men and $35,250 for women, a difference of 39.3%. Men with an educational attainment of high school diploma enjoy the highest average annual earnings of $67,800, while those with college or associate's degree education earn the least with $55,147. Women with an educational attainment of graduate degree earn the most with the average annual earnings of $80,750, while those with college or associate's degree education have the smallest earnings of $22,432.
| Educational Attainment | Male Income | Female Income |
| Less than High School | - | - |
| High School Diploma | $67,800 | $0 |
| College or Associate's Degree | $55,147 | $22,432 |
| Bachelor's Degree | $59,900 | $45,875 |
| Graduate Degree | - | - |
| Total | $58,065 | $35,250 |
Family Income in Colchester
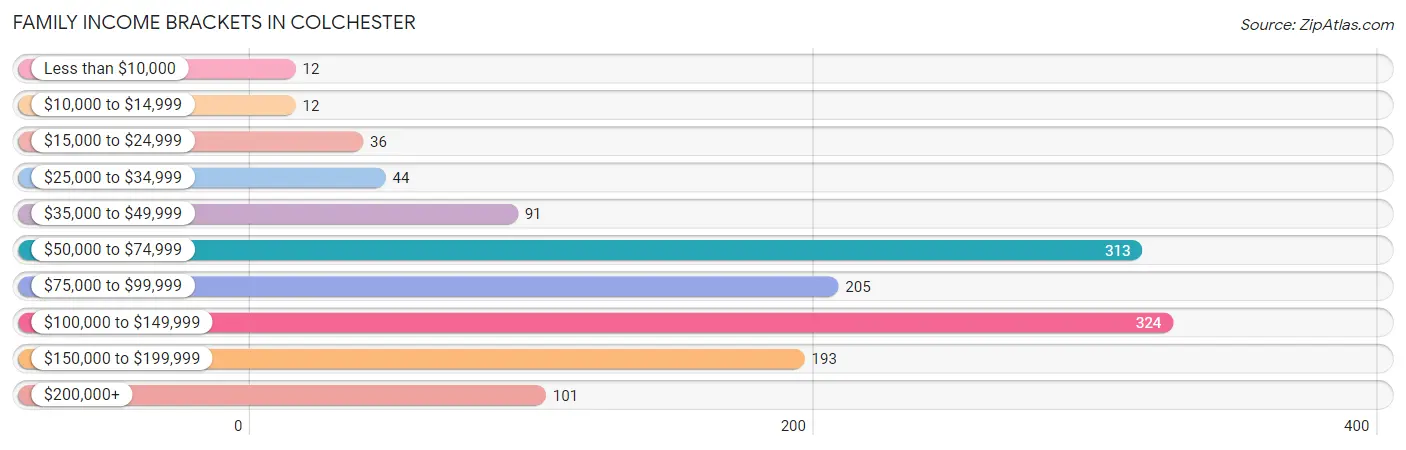
Family Income Brackets in Colchester
According to the Colchester family income data, there are 324 families falling into the $100,000 to $149,999 income range, which is the most common income bracket and makes up 24.3% of all families. Conversely, the less than $10,000 income bracket is the least frequent group with only 12 families (0.9%) belonging to this category.
| Income Bracket | # Families | % Families |
| Less than $10,000 | 12 | 0.9% |
| $10,000 to $14,999 | 12 | 0.9% |
| $15,000 to $24,999 | 36 | 2.7% |
| $25,000 to $34,999 | 44 | 3.3% |
| $35,000 to $49,999 | 91 | 6.8% |
| $50,000 to $74,999 | 313 | 23.5% |
| $75,000 to $99,999 | 205 | 15.4% |
| $100,000 to $149,999 | 324 | 24.3% |
| $150,000 to $199,999 | 193 | 14.5% |
| $200,000+ | 101 | 7.6% |
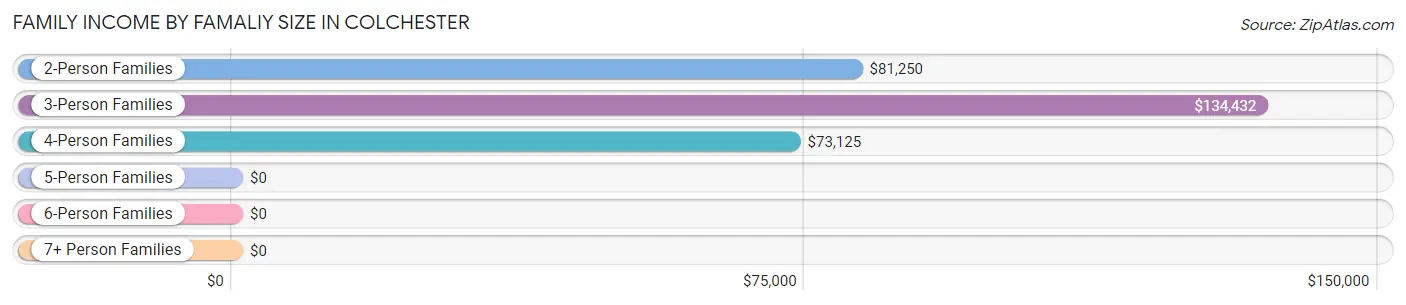
Family Income by Famaliy Size in Colchester
3-person families (201 | 15.1%) account for the highest median family income in Colchester with $134,432 per family, while 3-person families (201 | 15.1%) have the highest median income of $44,811 per family member.
| Income Bracket | # Families | Median Income |
| 2-Person Families | 810 (60.7%) | $81,250 |
| 3-Person Families | 201 (15.1%) | $134,432 |
| 4-Person Families | 248 (18.6%) | $73,125 |
| 5-Person Families | 62 (4.6%) | $0 |
| 6-Person Families | 13 (1.0%) | $0 |
| 7+ Person Families | 0 (0.0%) | $0 |
| Total | 1,334 (100.0%) | $96,300 |
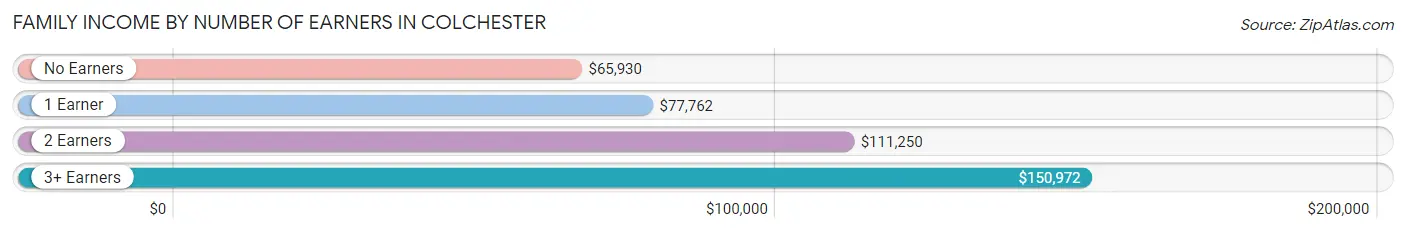
Family Income by Number of Earners in Colchester
The median family income in Colchester is $96,300, with families comprising 3+ earners (83) having the highest median family income of $150,972, while families with no earners (302) have the lowest median family income of $65,930, accounting for 6.2% and 22.6% of families, respectively.
| Number of Earners | # Families | Median Income |
| No Earners | 302 (22.6%) | $65,930 |
| 1 Earner | 387 (29.0%) | $77,762 |
| 2 Earners | 562 (42.1%) | $111,250 |
| 3+ Earners | 83 (6.2%) | $150,972 |
| Total | 1,334 (100.0%) | $96,300 |
Household Income in Colchester
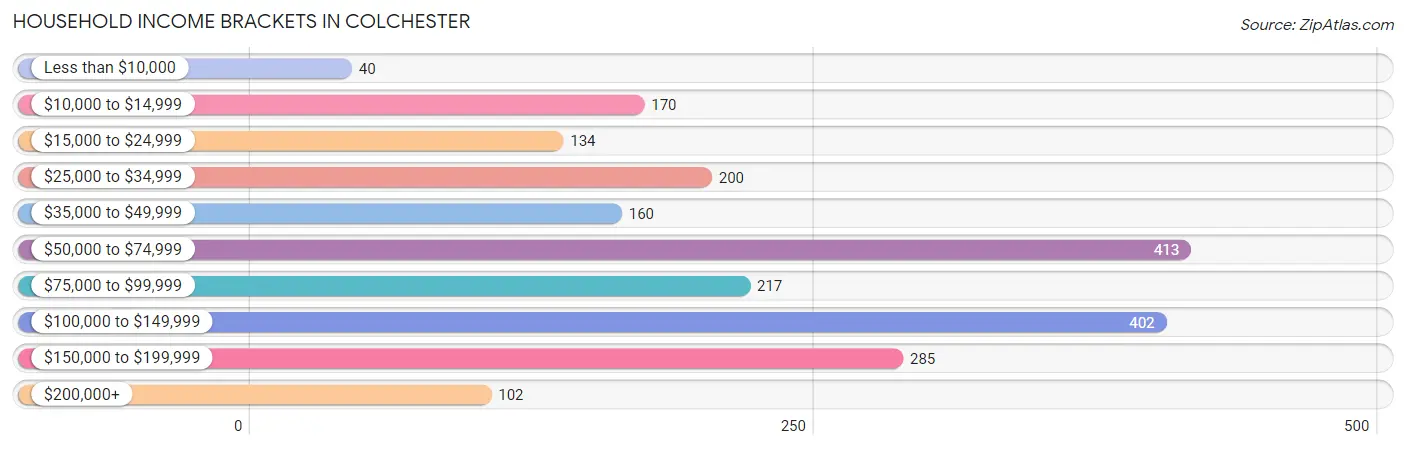
Household Income Brackets in Colchester
With 413 households falling in the category, the $50,000 to $74,999 income range is the most frequent in Colchester, accounting for 19.4% of all households. In contrast, only 40 households (1.9%) fall into the less than $10,000 income bracket, making it the least populous group.
| Income Bracket | # Households | % Households |
| Less than $10,000 | 40 | 1.9% |
| $10,000 to $14,999 | 170 | 8.0% |
| $15,000 to $24,999 | 134 | 6.3% |
| $25,000 to $34,999 | 200 | 9.4% |
| $35,000 to $49,999 | 160 | 7.5% |
| $50,000 to $74,999 | 413 | 19.4% |
| $75,000 to $99,999 | 217 | 10.2% |
| $100,000 to $149,999 | 402 | 18.9% |
| $150,000 to $199,999 | 285 | 13.4% |
| $200,000+ | 102 | 4.8% |
Household Income by Householder Age in Colchester
The median household income in Colchester is $74,035, with the highest median household income of $121,250 found in the 25 to 44 years age bracket for the primary householder. A total of 523 households (24.6%) fall into this category. Meanwhile, the 15 to 24 years age bracket for the primary householder has the lowest median household income of $33,363, with 115 households (5.4%) in this group.
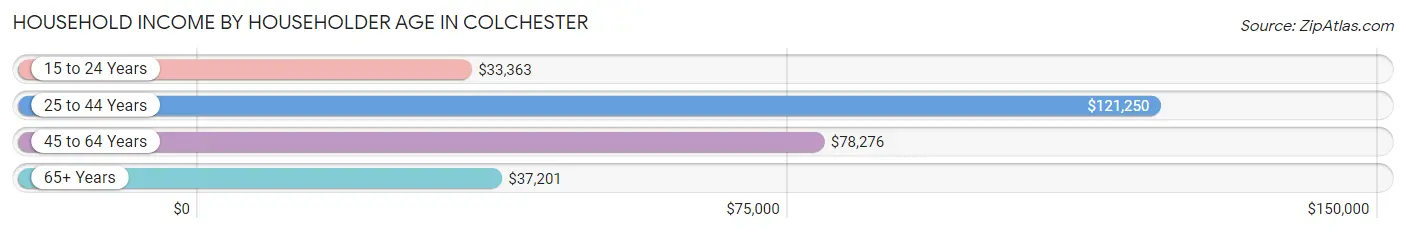
| Income Bracket | # Households | Median Income |
| 15 to 24 Years | 115 (5.4%) | $33,363 |
| 25 to 44 Years | 523 (24.6%) | $121,250 |
| 45 to 64 Years | 756 (35.5%) | $78,276 |
| 65+ Years | 735 (34.5%) | $37,201 |
| Total | 2,129 (100.0%) | $74,035 |
Poverty in Colchester
Income Below Poverty by Sex and Age in Colchester
With 9.9% poverty level for males and 8.2% for females among the residents of Colchester, 5 year old males and 18 to 24 year old females are the most vulnerable to poverty, with 25 males (100.0%) and 43 females (40.9%) in their respective age groups living below the poverty level.
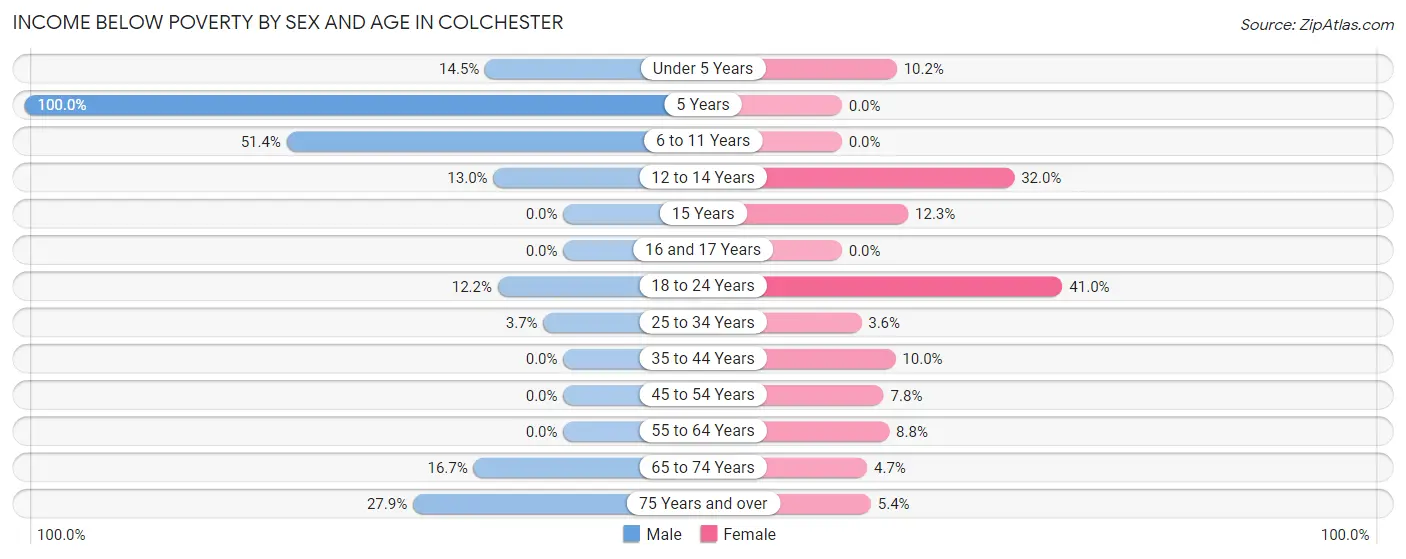
| Age Bracket | Male | Female |
| Under 5 Years | 28 (14.5%) | 16 (10.2%) |
| 5 Years | 25 (100.0%) | 0 (0.0%) |
| 6 to 11 Years | 19 (51.3%) | 0 (0.0%) |
| 12 to 14 Years | 17 (13.0%) | 16 (32.0%) |
| 15 Years | 0 (0.0%) | 8 (12.3%) |
| 16 and 17 Years | 0 (0.0%) | 0 (0.0%) |
| 18 to 24 Years | 28 (12.2%) | 43 (40.9%) |
| 25 to 34 Years | 12 (3.7%) | 10 (3.6%) |
| 35 to 44 Years | 0 (0.0%) | 19 (10.0%) |
| 45 to 54 Years | 0 (0.0%) | 24 (7.8%) |
| 55 to 64 Years | 0 (0.0%) | 27 (8.8%) |
| 65 to 74 Years | 38 (16.7%) | 17 (4.7%) |
| 75 Years and over | 60 (27.9%) | 18 (5.4%) |
| Total | 227 (9.9%) | 198 (8.2%) |
Income Above Poverty by Sex and Age in Colchester
According to the poverty statistics in Colchester, males aged 16 and 17 years and females aged 5 years are the age groups that are most secure financially, with 100.0% of males and 100.0% of females in these age groups living above the poverty line.
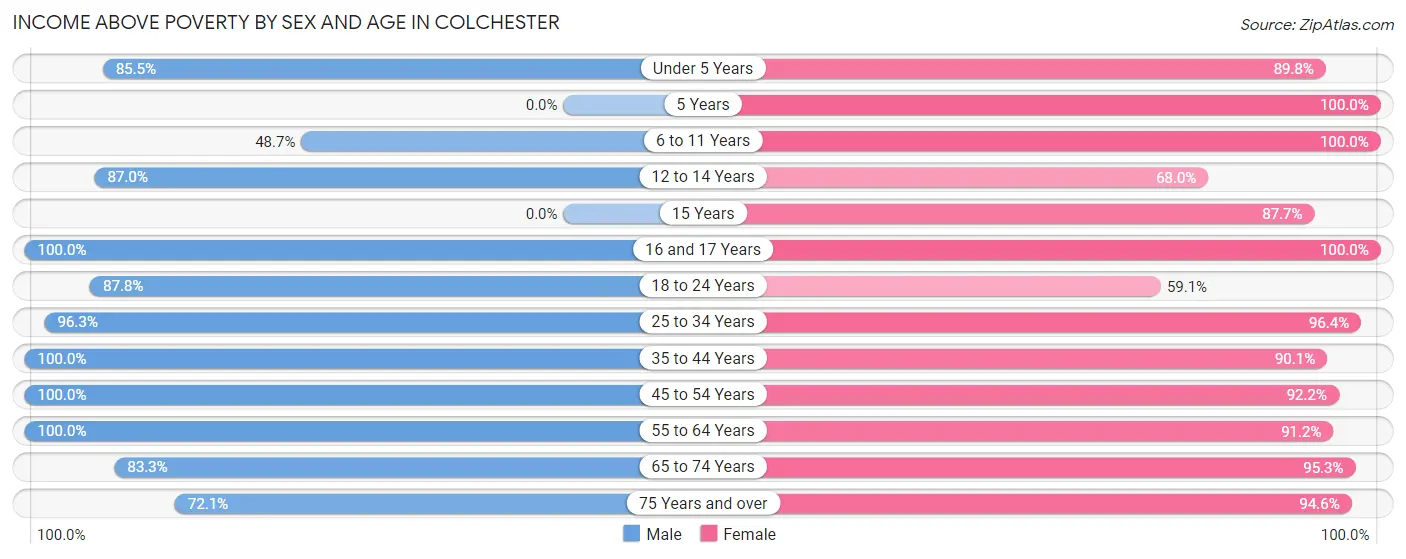
| Age Bracket | Male | Female |
| Under 5 Years | 165 (85.5%) | 141 (89.8%) |
| 5 Years | 0 (0.0%) | 34 (100.0%) |
| 6 to 11 Years | 18 (48.6%) | 124 (100.0%) |
| 12 to 14 Years | 114 (87.0%) | 34 (68.0%) |
| 15 Years | 0 (0.0%) | 57 (87.7%) |
| 16 and 17 Years | 14 (100.0%) | 102 (100.0%) |
| 18 to 24 Years | 202 (87.8%) | 62 (59.1%) |
| 25 to 34 Years | 312 (96.3%) | 266 (96.4%) |
| 35 to 44 Years | 321 (100.0%) | 172 (90.0%) |
| 45 to 54 Years | 177 (100.0%) | 285 (92.2%) |
| 55 to 64 Years | 389 (100.0%) | 280 (91.2%) |
| 65 to 74 Years | 190 (83.3%) | 345 (95.3%) |
| 75 Years and over | 155 (72.1%) | 316 (94.6%) |
| Total | 2,057 (90.1%) | 2,218 (91.8%) |
Income Below Poverty Among Married-Couple Families in Colchester
The poverty statistics for married-couple families in Colchester show that 0.7% or 8 of the total 1,095 families live below the poverty line. Families with no children have the highest poverty rate of 1.1%, comprising of 8 families. On the other hand, families with 1 or 2 children have the lowest poverty rate of 0.0%, which includes 0 families.
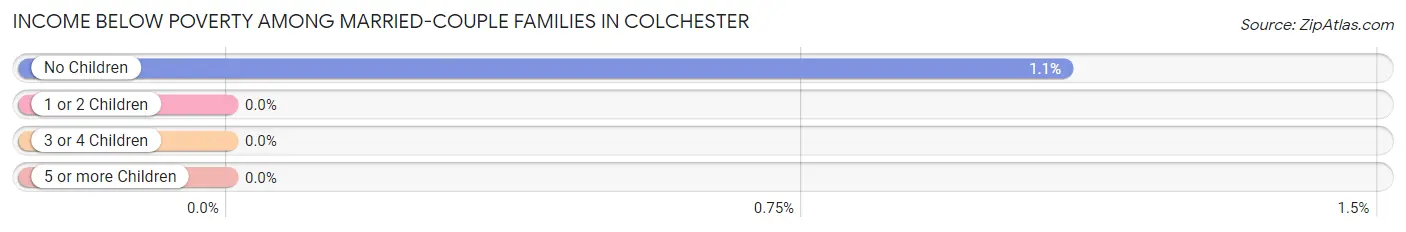
| Children | Above Poverty | Below Poverty |
| No Children | 729 (98.9%) | 8 (1.1%) |
| 1 or 2 Children | 337 (100.0%) | 0 (0.0%) |
| 3 or 4 Children | 21 (100.0%) | 0 (0.0%) |
| 5 or more Children | 0 (0.0%) | 0 (0.0%) |
| Total | 1,087 (99.3%) | 8 (0.7%) |
Income Below Poverty Among Single-Parent Households in Colchester
According to the poverty data in Colchester, 23.1% or 12 single-father households and 21.9% or 41 single-mother households are living below the poverty line. Among single-father households, those with 1 or 2 children have the highest poverty rate, with 12 households (29.3%) experiencing poverty. Likewise, among single-mother households, those with 3 or 4 children have the highest poverty rate, with 6 households (100.0%) falling below the poverty line.
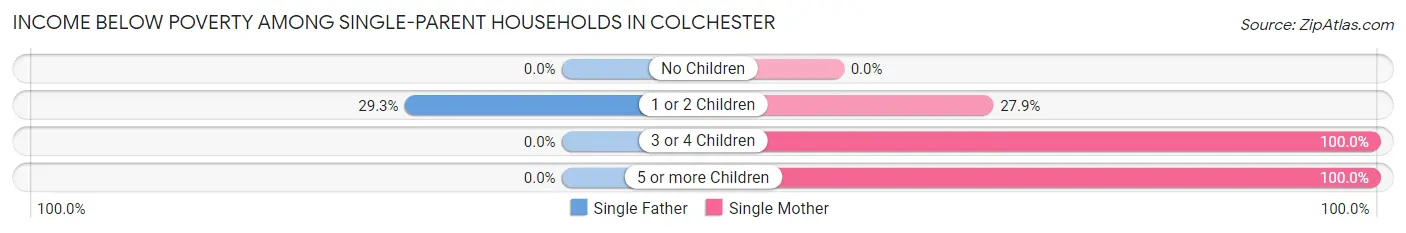
| Children | Single Father | Single Mother |
| No Children | 0 (0.0%) | 0 (0.0%) |
| 1 or 2 Children | 12 (29.3%) | 22 (27.9%) |
| 3 or 4 Children | 0 (0.0%) | 6 (100.0%) |
| 5 or more Children | 0 (0.0%) | 13 (100.0%) |
| Total | 12 (23.1%) | 41 (21.9%) |
Income Below Poverty Among Married-Couple vs Single-Parent Households in Colchester
The poverty data for Colchester shows that 8 of the married-couple family households (0.7%) and 53 of the single-parent households (22.2%) are living below the poverty level. Within the married-couple family households, those with no children have the highest poverty rate, with 8 households (1.1%) falling below the poverty line. Among the single-parent households, those with 3 or 4 children have the highest poverty rate, with 6 household (100.0%) living below poverty.
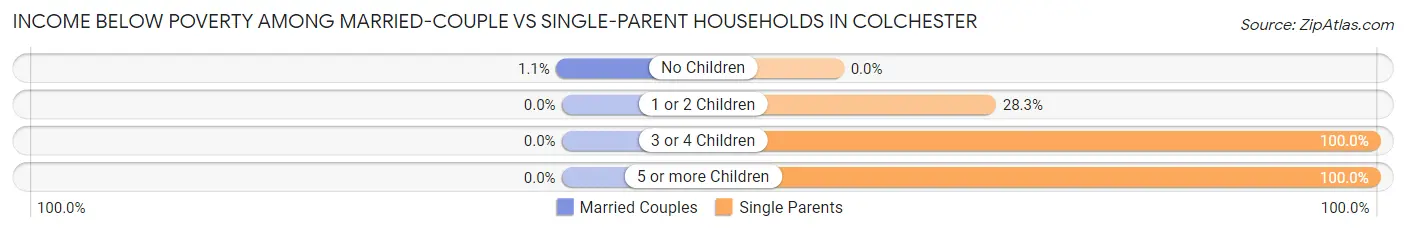
| Children | Married-Couple Families | Single-Parent Households |
| No Children | 8 (1.1%) | 0 (0.0%) |
| 1 or 2 Children | 0 (0.0%) | 34 (28.3%) |
| 3 or 4 Children | 0 (0.0%) | 6 (100.0%) |
| 5 or more Children | 0 (0.0%) | 13 (100.0%) |
| Total | 8 (0.7%) | 53 (22.2%) |
Race in Colchester
The most populous races in Colchester are White / Caucasian (4,485 | 92.1%), Hispanic or Latino (213 | 4.4%), and Some other Race (157 | 3.2%).
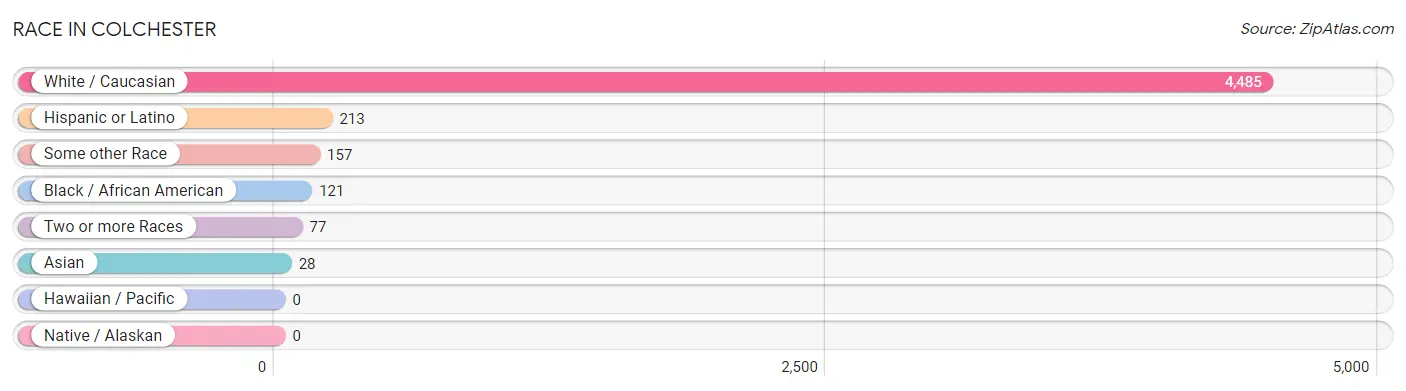
| Race | # Population | % Population |
| Asian | 28 | 0.6% |
| Black / African American | 121 | 2.5% |
| Hawaiian / Pacific | 0 | 0.0% |
| Hispanic or Latino | 213 | 4.4% |
| Native / Alaskan | 0 | 0.0% |
| White / Caucasian | 4,485 | 92.1% |
| Two or more Races | 77 | 1.6% |
| Some other Race | 157 | 3.2% |
| Total | 4,868 | 100.0% |
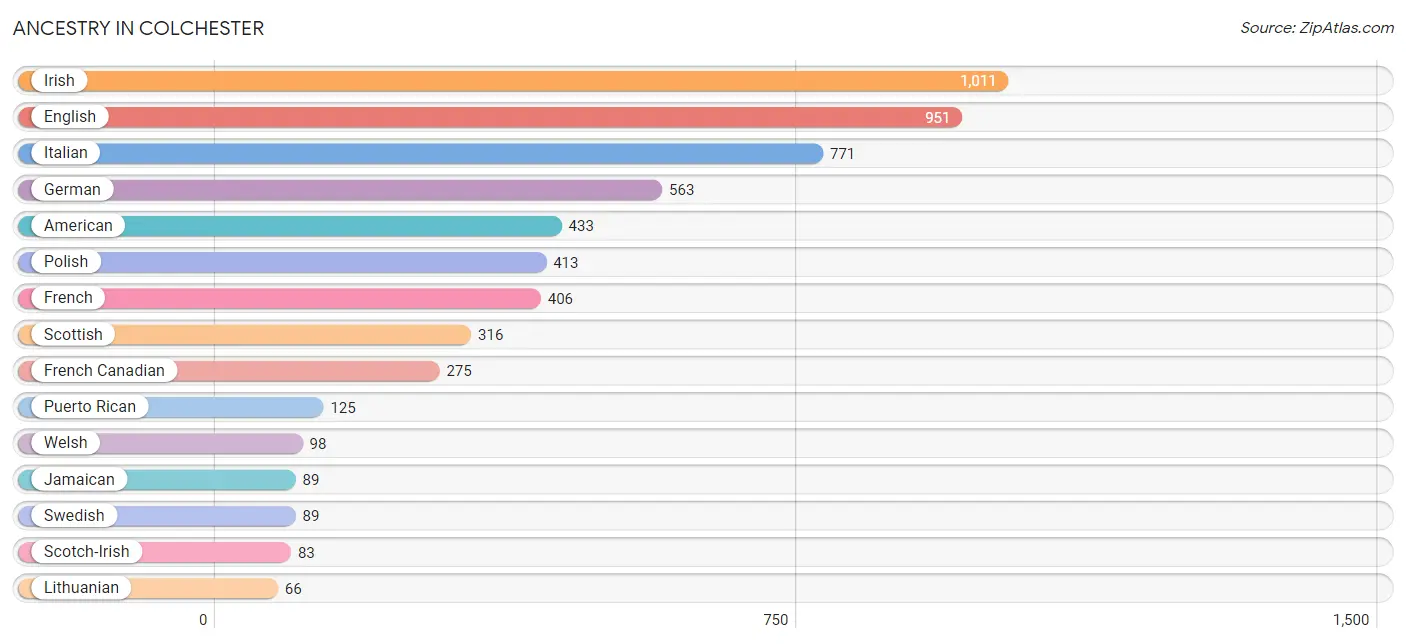
Ancestry in Colchester
The most populous ancestries reported in Colchester are Irish (1,011 | 20.8%), English (951 | 19.5%), Italian (771 | 15.8%), German (563 | 11.6%), and American (433 | 8.9%), together accounting for 76.6% of all Colchester residents.
| Ancestry | # Population | % Population |
| American | 433 | 8.9% |
| Austrian | 29 | 0.6% |
| Bahamian | 17 | 0.4% |
| Brazilian | 30 | 0.6% |
| British | 36 | 0.7% |
| Canadian | 7 | 0.1% |
| Danish | 53 | 1.1% |
| Dominican | 43 | 0.9% |
| Dutch | 59 | 1.2% |
| Eastern European | 37 | 0.8% |
| Ecuadorian | 11 | 0.2% |
| English | 951 | 19.5% |
| European | 9 | 0.2% |
| Finnish | 11 | 0.2% |
| French | 406 | 8.3% |
| French Canadian | 275 | 5.7% |
| German | 563 | 11.6% |
| Indian (Asian) | 37 | 0.8% |
| Irish | 1,011 | 20.8% |
| Italian | 771 | 15.8% |
| Jamaican | 89 | 1.8% |
| Korean | 1 | 0.0% |
| Lithuanian | 66 | 1.4% |
| Northern European | 16 | 0.3% |
| Norwegian | 61 | 1.3% |
| Peruvian | 19 | 0.4% |
| Polish | 413 | 8.5% |
| Portuguese | 49 | 1.0% |
| Puerto Rican | 125 | 2.6% |
| Russian | 20 | 0.4% |
| Scotch-Irish | 83 | 1.7% |
| Scottish | 316 | 6.5% |
| Slovak | 7 | 0.1% |
| Slovene | 34 | 0.7% |
| South American | 30 | 0.6% |
| Spaniard | 15 | 0.3% |
| Swedish | 89 | 1.8% |
| Swiss | 22 | 0.4% |
| Ukrainian | 29 | 0.6% |
| Welsh | 98 | 2.0% |
| Yugoslavian | 25 | 0.5% | View All 41 Rows |
Immigrants in Colchester
The most numerous immigrant groups reported in Colchester came from Latin America (167 | 3.4%), Caribbean (139 | 2.9%), Jamaica (67 | 1.4%), Dominican Republic (43 | 0.9%), and Europe (43 | 0.9%), together accounting for 9.4% of all Colchester residents.
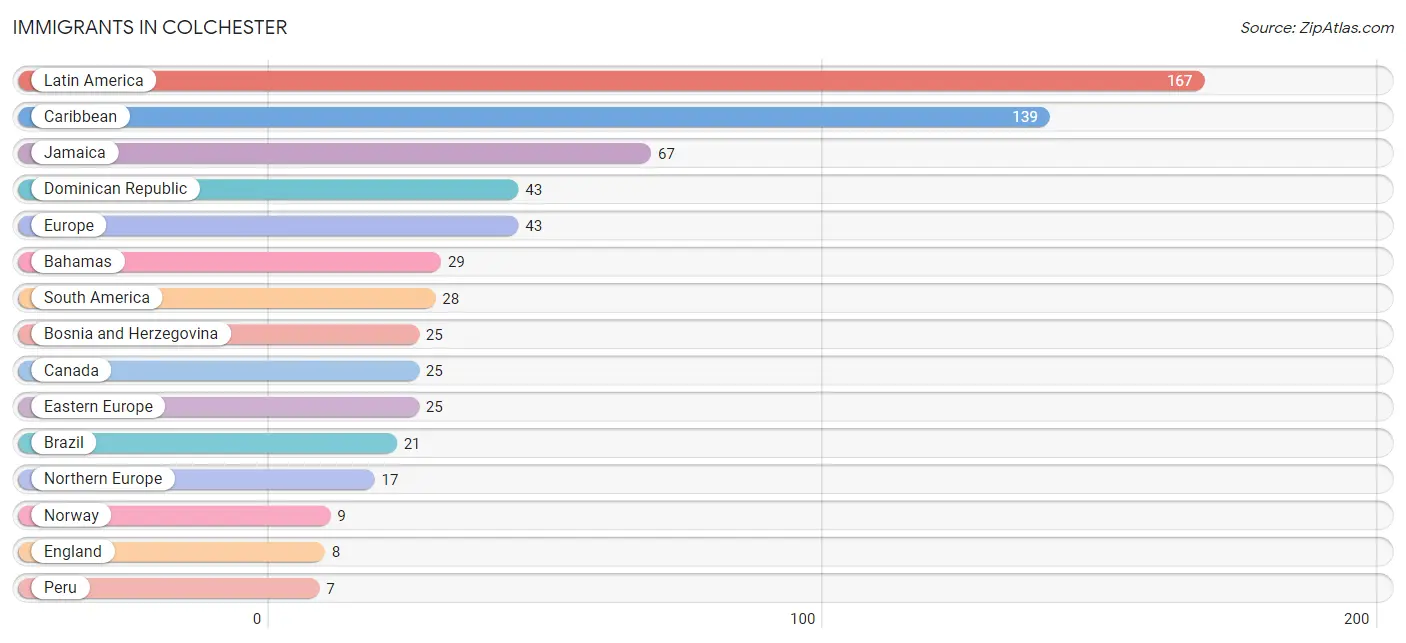
| Immigration Origin | # Population | % Population |
| Asia | 1 | 0.0% |
| Bahamas | 29 | 0.6% |
| Bosnia and Herzegovina | 25 | 0.5% |
| Brazil | 21 | 0.4% |
| Canada | 25 | 0.5% |
| Caribbean | 139 | 2.9% |
| Dominican Republic | 43 | 0.9% |
| Eastern Europe | 25 | 0.5% |
| England | 8 | 0.2% |
| Europe | 43 | 0.9% |
| Jamaica | 67 | 1.4% |
| Latin America | 167 | 3.4% |
| Northern Europe | 17 | 0.4% |
| Norway | 9 | 0.2% |
| Peru | 7 | 0.1% |
| Philippines | 1 | 0.0% |
| Portugal | 1 | 0.0% |
| South America | 28 | 0.6% |
| South Eastern Asia | 1 | 0.0% |
| Southern Europe | 1 | 0.0% | View All 20 Rows |
Sex and Age in Colchester
Sex and Age in Colchester
The most populous age groups in Colchester are 55 to 59 Years (228 | 9.8%) for men and 70 to 74 Years (253 | 10.0%) for women.
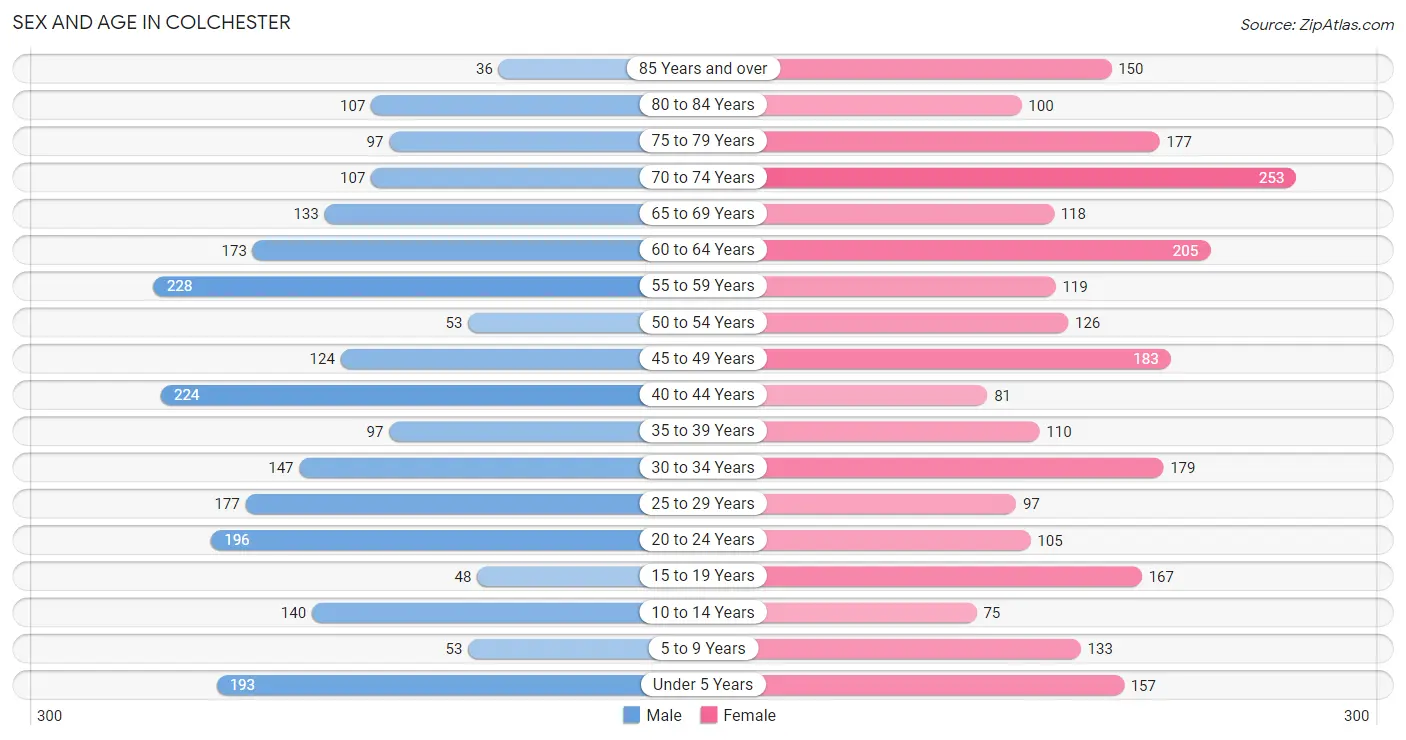
| Age Bracket | Male | Female |
| Under 5 Years | 193 (8.3%) | 157 (6.2%) |
| 5 to 9 Years | 53 (2.3%) | 133 (5.2%) |
| 10 to 14 Years | 140 (6.0%) | 75 (3.0%) |
| 15 to 19 Years | 48 (2.1%) | 167 (6.6%) |
| 20 to 24 Years | 196 (8.4%) | 105 (4.1%) |
| 25 to 29 Years | 177 (7.6%) | 97 (3.8%) |
| 30 to 34 Years | 147 (6.3%) | 179 (7.1%) |
| 35 to 39 Years | 97 (4.2%) | 110 (4.3%) |
| 40 to 44 Years | 224 (9.6%) | 81 (3.2%) |
| 45 to 49 Years | 124 (5.3%) | 183 (7.2%) |
| 50 to 54 Years | 53 (2.3%) | 126 (5.0%) |
| 55 to 59 Years | 228 (9.8%) | 119 (4.7%) |
| 60 to 64 Years | 173 (7.4%) | 205 (8.1%) |
| 65 to 69 Years | 133 (5.7%) | 118 (4.6%) |
| 70 to 74 Years | 107 (4.6%) | 253 (10.0%) |
| 75 to 79 Years | 97 (4.2%) | 177 (7.0%) |
| 80 to 84 Years | 107 (4.6%) | 100 (3.9%) |
| 85 Years and over | 36 (1.5%) | 150 (5.9%) |
| Total | 2,333 (100.0%) | 2,535 (100.0%) |
Families and Households in Colchester
Median Family Size in Colchester
The median family size in Colchester is 2.81 persons per family, with married-couple families (1,095 | 82.1%) accounting for the largest median family size of 2.83 persons per family. On the other hand, single male/father families (52 | 3.9%) represent the smallest median family size with 2.42 persons per family.
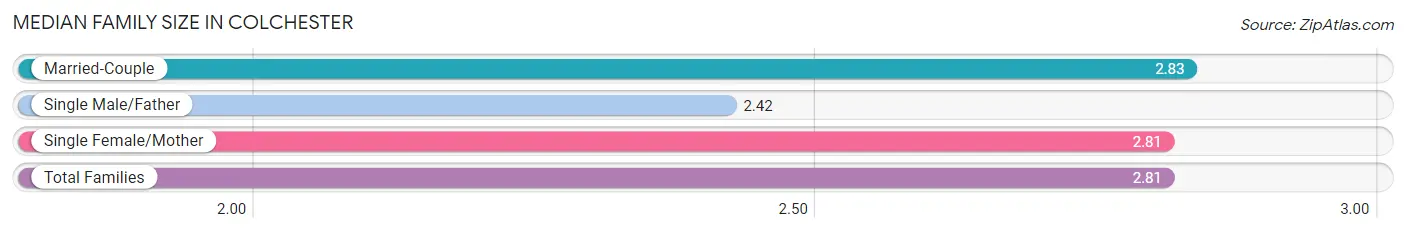
| Family Type | # Families | Family Size |
| Married-Couple | 1,095 (82.1%) | 2.83 |
| Single Male/Father | 52 (3.9%) | 2.42 |
| Single Female/Mother | 187 (14.0%) | 2.81 |
| Total Families | 1,334 (100.0%) | 2.81 |
Median Household Size in Colchester
The median household size in Colchester is 2.21 persons per household, with single female/mother households (187 | 8.8%) accounting for the largest median household size of 3.01 persons per household. non-family households (795 | 37.3%) represent the smallest median household size with 1.08 persons per household.
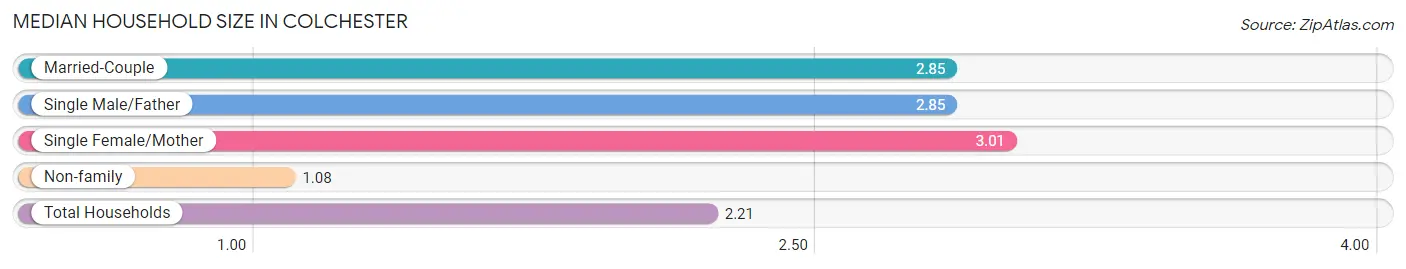
| Household Type | # Households | Household Size |
| Married-Couple | 1,095 (51.4%) | 2.85 |
| Single Male/Father | 52 (2.4%) | 2.85 |
| Single Female/Mother | 187 (8.8%) | 3.01 |
| Non-family | 795 (37.3%) | 1.08 |
| Total Households | 2,129 (100.0%) | 2.21 |
Household Size by Marriage Status in Colchester
Out of a total of 2,129 households in Colchester, 1,334 (62.7%) are family households, while 795 (37.3%) are nonfamily households. The most numerous type of family households are 2-person households, comprising 739, and the most common type of nonfamily households are 1-person households, comprising 734.
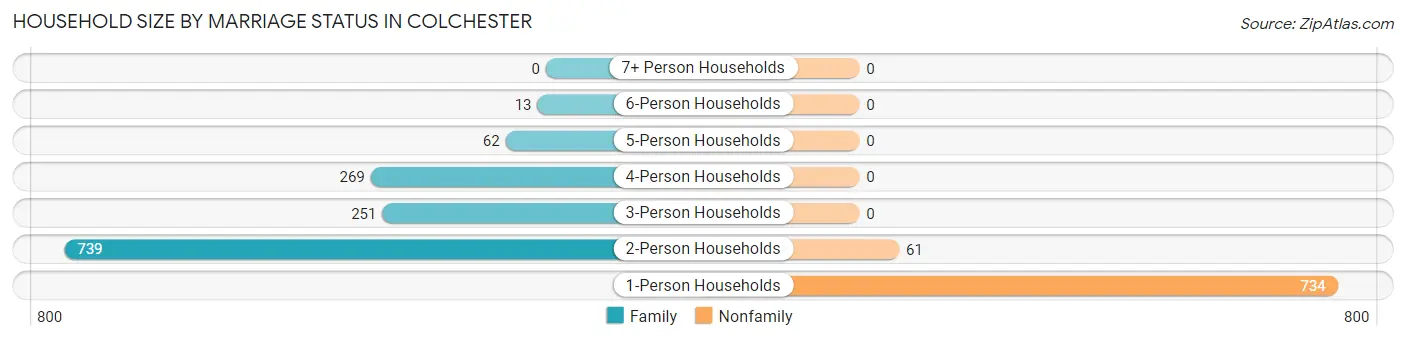
| Household Size | Family Households | Nonfamily Households |
| 1-Person Households | - | 734 (34.5%) |
| 2-Person Households | 739 (34.7%) | 61 (2.9%) |
| 3-Person Households | 251 (11.8%) | 0 (0.0%) |
| 4-Person Households | 269 (12.6%) | 0 (0.0%) |
| 5-Person Households | 62 (2.9%) | 0 (0.0%) |
| 6-Person Households | 13 (0.6%) | 0 (0.0%) |
| 7+ Person Households | 0 (0.0%) | 0 (0.0%) |
| Total | 1,334 (62.7%) | 795 (37.3%) |
Female Fertility in Colchester
Fertility by Age in Colchester
Average fertility rate in Colchester is 81.0 births per 1,000 women. Women in the age bracket of 35 to 50 years have the highest fertility rate with 106.0 births per 1,000 women. Women in the age bracket of 35 to 50 years acount for 53.9% of all women with births.
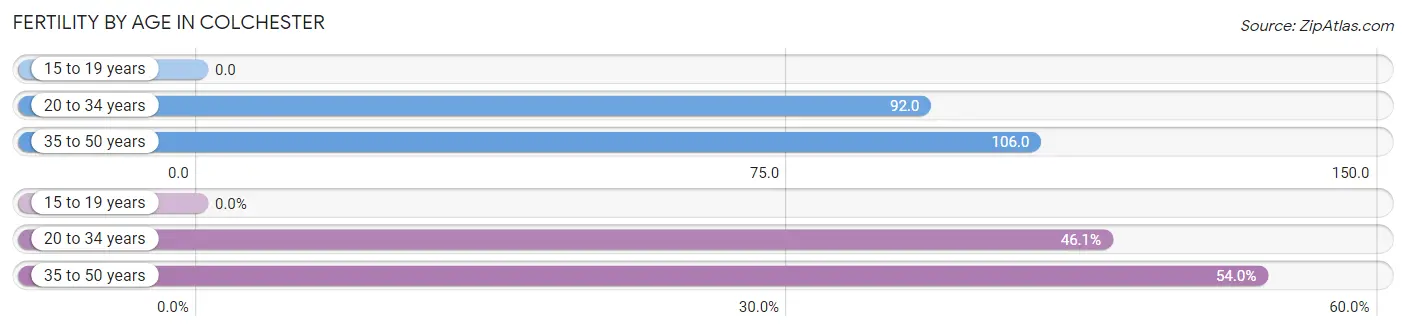
| Age Bracket | Women with Births | Births / 1,000 Women |
| 15 to 19 years | 0 (0.0%) | 0.0 |
| 20 to 34 years | 35 (46.1%) | 92.0 |
| 35 to 50 years | 41 (53.9%) | 106.0 |
| Total | 76 (100.0%) | 81.0 |
Fertility by Age by Marriage Status in Colchester
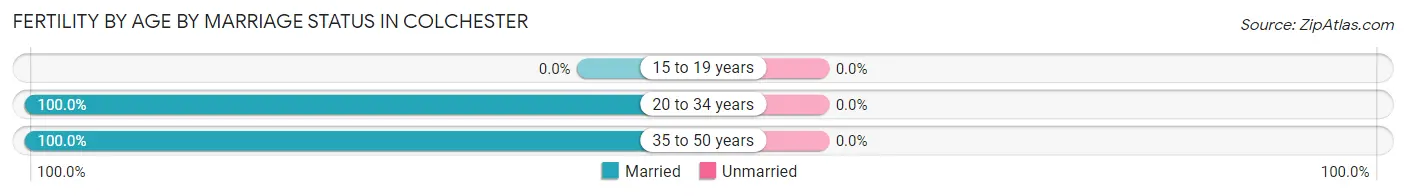
| Age Bracket | Married | Unmarried |
| 15 to 19 years | 0 (0.0%) | 0 (0.0%) |
| 20 to 34 years | 35 (100.0%) | 0 (0.0%) |
| 35 to 50 years | 41 (100.0%) | 0 (0.0%) |
| Total | 76 (100.0%) | 0 (0.0%) |
Fertility by Education in Colchester
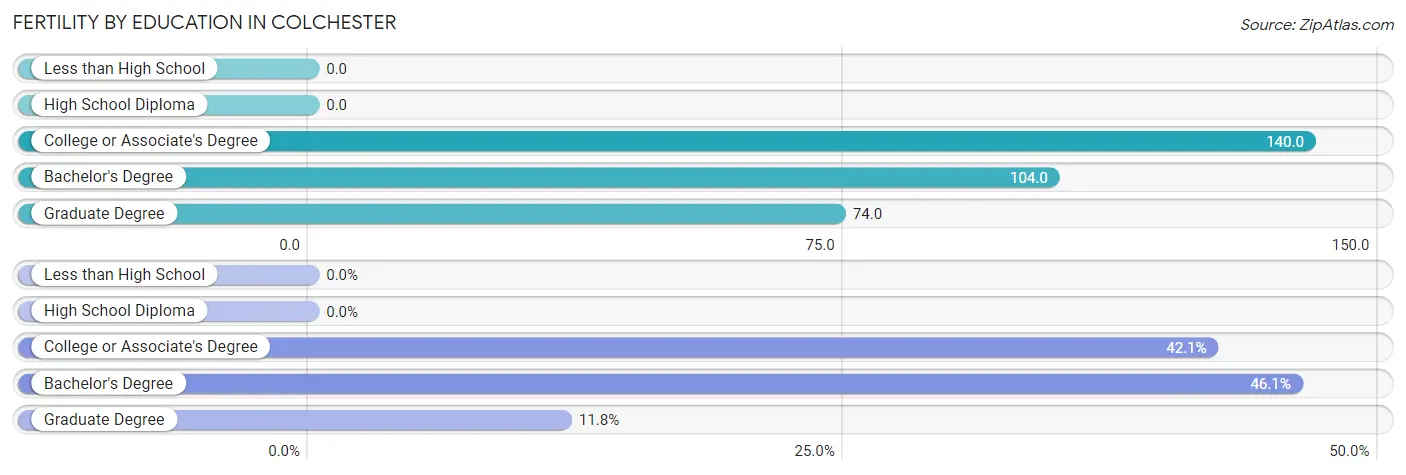
| Educational Attainment | Women with Births | Births / 1,000 Women |
| Less than High School | 0 (0.0%) | 0.0 |
| High School Diploma | 0 (0.0%) | 0.0 |
| College or Associate's Degree | 32 (42.1%) | 140.0 |
| Bachelor's Degree | 35 (46.1%) | 104.0 |
| Graduate Degree | 9 (11.8%) | 74.0 |
| Total | 76 (100.0%) | 81.0 |
Fertility by Education by Marriage Status in Colchester
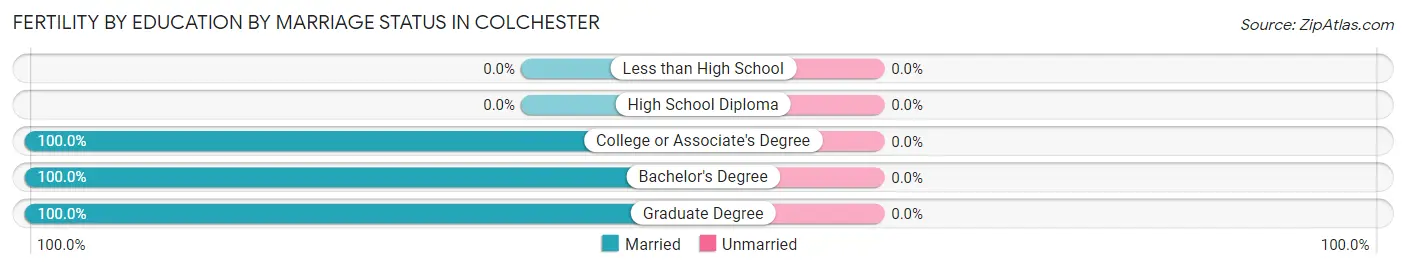
| Educational Attainment | Married | Unmarried |
| Less than High School | 0 (0.0%) | 0 (0.0%) |
| High School Diploma | 0 (0.0%) | 0 (0.0%) |
| College or Associate's Degree | 32 (100.0%) | 0 (0.0%) |
| Bachelor's Degree | 35 (100.0%) | 0 (0.0%) |
| Graduate Degree | 9 (100.0%) | 0 (0.0%) |
| Total | 76 (100.0%) | 0 (0.0%) |
Employment Characteristics in Colchester
Employment by Class of Employer in Colchester
Among the 2,098 employed individuals in Colchester, private company employees (1,404 | 66.9%), not-for-profit organizations (196 | 9.3%), and local government employees (160 | 7.6%) make up the most common classes of employment.
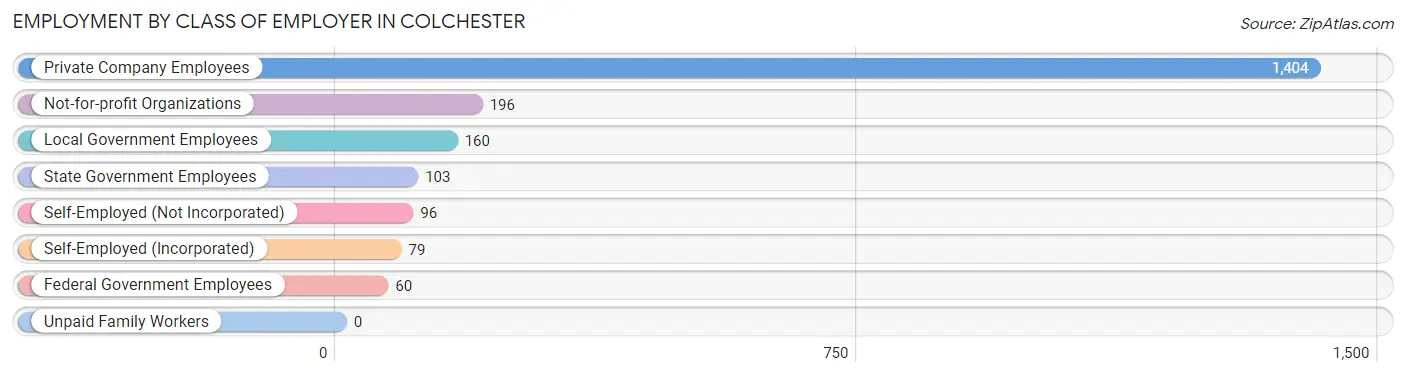
| Employer Class | # Employees | % Employees |
| Private Company Employees | 1,404 | 66.9% |
| Self-Employed (Incorporated) | 79 | 3.8% |
| Self-Employed (Not Incorporated) | 96 | 4.6% |
| Not-for-profit Organizations | 196 | 9.3% |
| Local Government Employees | 160 | 7.6% |
| State Government Employees | 103 | 4.9% |
| Federal Government Employees | 60 | 2.9% |
| Unpaid Family Workers | 0 | 0.0% |
| Total | 2,098 | 100.0% |
Employment Status by Age in Colchester
According to the labor force statistics for Colchester, out of the total population over 16 years of age (4,052), 56.3% or 2,281 individuals are in the labor force, with 8.0% or 182 of them unemployed. The age group with the highest labor force participation rate is 25 to 29 years, with 97.4% or 267 individuals in the labor force. Within the labor force, the 16 to 19 years age range has the highest percentage of unemployed individuals, with 73.5% or 25 of them being unemployed.
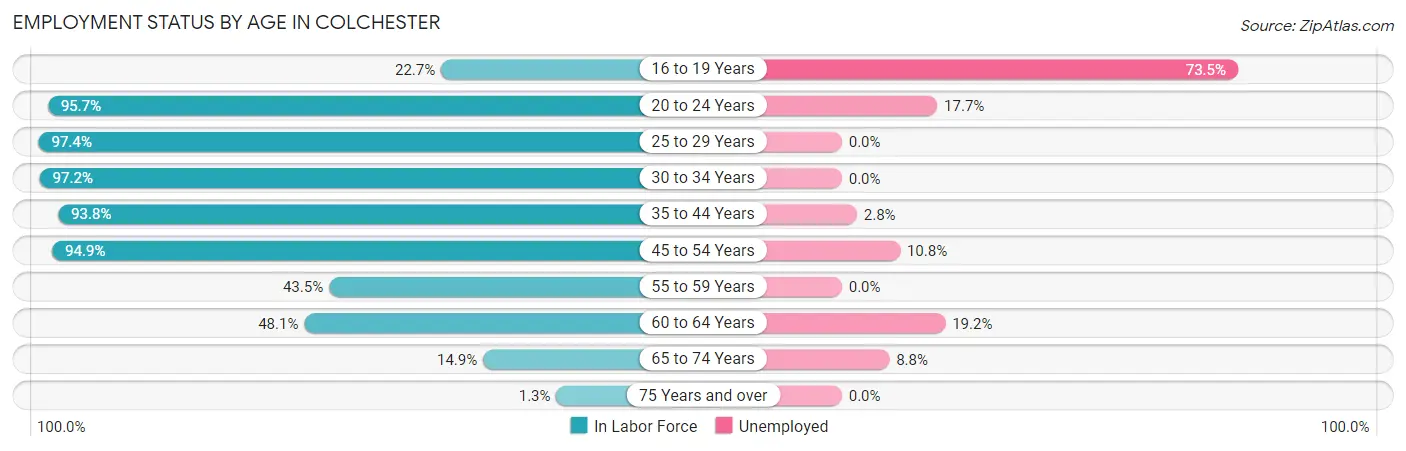
| Age Bracket | In Labor Force | Unemployed |
| 16 to 19 Years | 34 (22.7%) | 25 (73.5%) |
| 20 to 24 Years | 288 (95.7%) | 51 (17.7%) |
| 25 to 29 Years | 267 (97.4%) | 0 (0.0%) |
| 30 to 34 Years | 317 (97.2%) | 0 (0.0%) |
| 35 to 44 Years | 480 (93.8%) | 13 (2.8%) |
| 45 to 54 Years | 461 (94.9%) | 50 (10.8%) |
| 55 to 59 Years | 151 (43.5%) | 0 (0.0%) |
| 60 to 64 Years | 182 (48.1%) | 35 (19.2%) |
| 65 to 74 Years | 91 (14.9%) | 8 (8.8%) |
| 75 Years and over | 9 (1.3%) | 0 (0.0%) |
| Total | 2,281 (56.3%) | 182 (8.0%) |
Employment Status by Educational Attainment in Colchester
According to labor force statistics for Colchester, 80.0% of individuals (1,858) out of the total population between 25 and 64 years of age (2,323) are in the labor force, with 5.3% or 98 of them being unemployed. The group with the highest labor force participation rate are those with the educational attainment of bachelor's degree or higher, with 97.9% or 912 individuals in the labor force. Within the labor force, individuals with college / associate degree education have the highest percentage of unemployment, with 11.7% or 55 of them being unemployed.
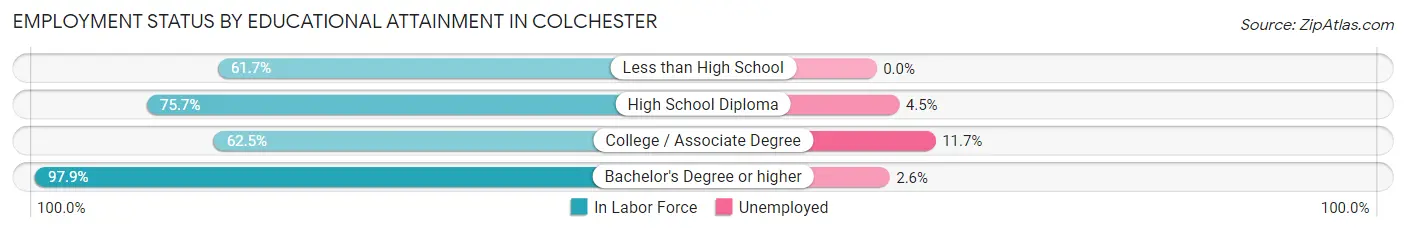
| Educational Attainment | In Labor Force | Unemployed |
| Less than High School | 37 (61.7%) | 0 (0.0%) |
| High School Diploma | 440 (75.7%) | 26 (4.5%) |
| College / Associate Degree | 469 (62.5%) | 88 (11.7%) |
| Bachelor's Degree or higher | 912 (97.9%) | 24 (2.6%) |
| Total | 1,858 (80.0%) | 123 (5.3%) |
Employment Occupations by Sex in Colchester
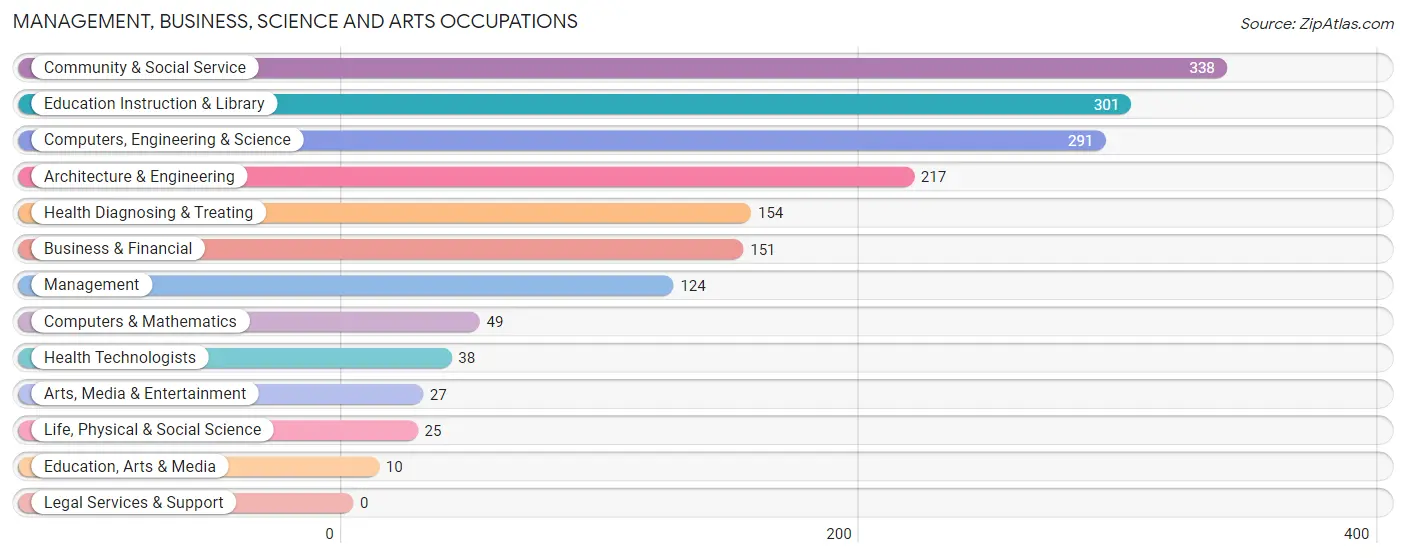
Management, Business, Science and Arts Occupations
The most common Management, Business, Science and Arts occupations in Colchester are Community & Social Service (338 | 16.2%), Education Instruction & Library (301 | 14.4%), Computers, Engineering & Science (291 | 14.0%), Architecture & Engineering (217 | 10.4%), and Health Diagnosing & Treating (154 | 7.4%).
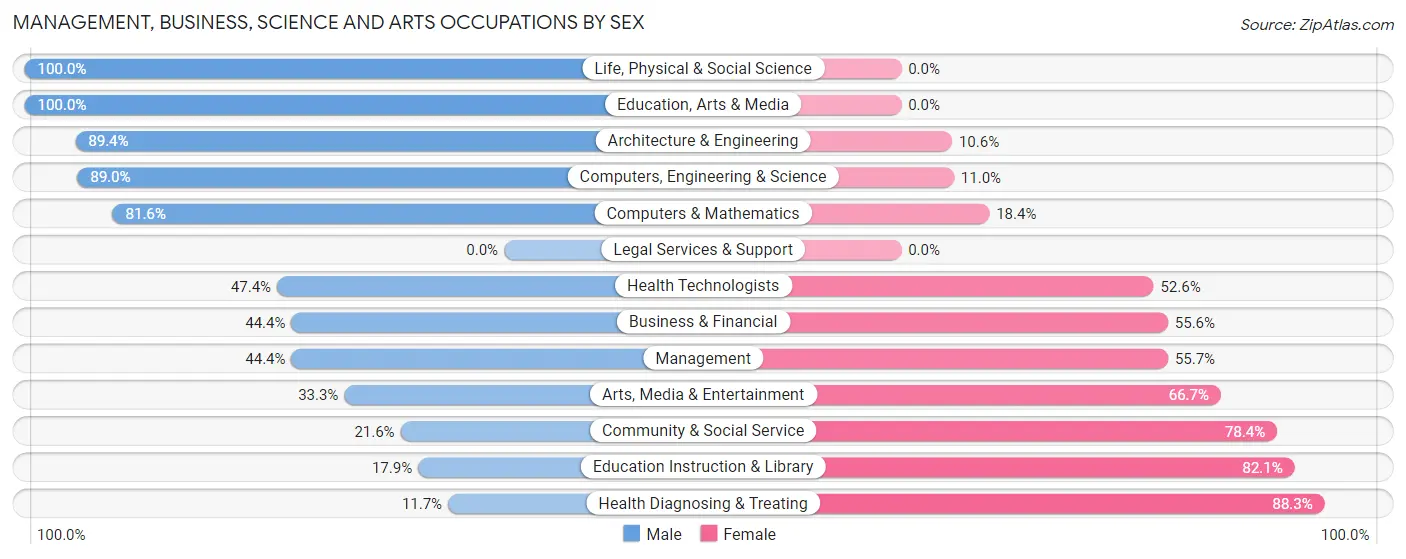
Management, Business, Science and Arts Occupations by Sex
Within the Management, Business, Science and Arts occupations in Colchester, the most male-oriented occupations are Life, Physical & Social Science (100.0%), Education, Arts & Media (100.0%), and Architecture & Engineering (89.4%), while the most female-oriented occupations are Health Diagnosing & Treating (88.3%), Education Instruction & Library (82.1%), and Community & Social Service (78.4%).
| Occupation | Male | Female |
| Management | 55 (44.4%) | 69 (55.6%) |
| Business & Financial | 67 (44.4%) | 84 (55.6%) |
| Computers, Engineering & Science | 259 (89.0%) | 32 (11.0%) |
| Computers & Mathematics | 40 (81.6%) | 9 (18.4%) |
| Architecture & Engineering | 194 (89.4%) | 23 (10.6%) |
| Life, Physical & Social Science | 25 (100.0%) | 0 (0.0%) |
| Community & Social Service | 73 (21.6%) | 265 (78.4%) |
| Education, Arts & Media | 10 (100.0%) | 0 (0.0%) |
| Legal Services & Support | 0 (0.0%) | 0 (0.0%) |
| Education Instruction & Library | 54 (17.9%) | 247 (82.1%) |
| Arts, Media & Entertainment | 9 (33.3%) | 18 (66.7%) |
| Health Diagnosing & Treating | 18 (11.7%) | 136 (88.3%) |
| Health Technologists | 18 (47.4%) | 20 (52.6%) |
| Total (Category) | 472 (44.6%) | 586 (55.4%) |
| Total (Overall) | 1,142 (54.7%) | 944 (45.3%) |
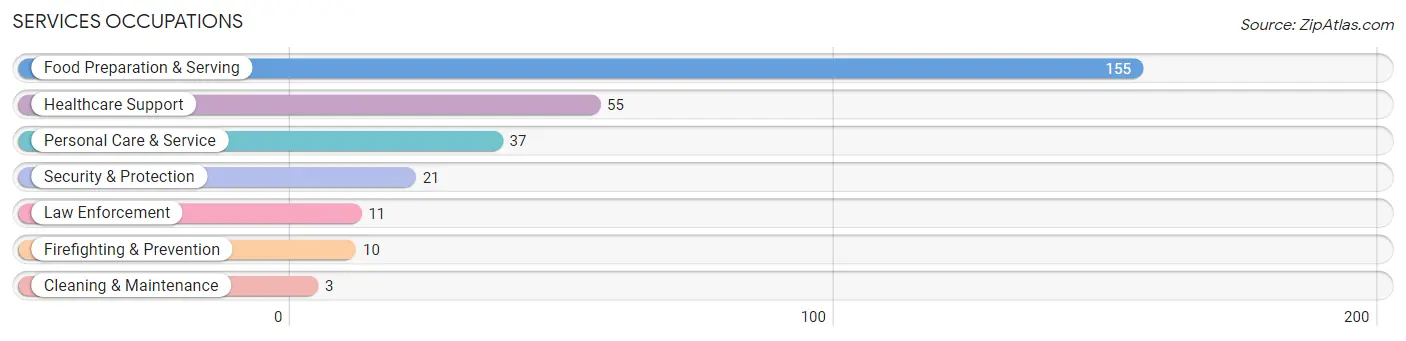
Services Occupations
The most common Services occupations in Colchester are Food Preparation & Serving (155 | 7.4%), Healthcare Support (55 | 2.6%), Personal Care & Service (37 | 1.8%), Security & Protection (21 | 1.0%), and Law Enforcement (11 | 0.5%).
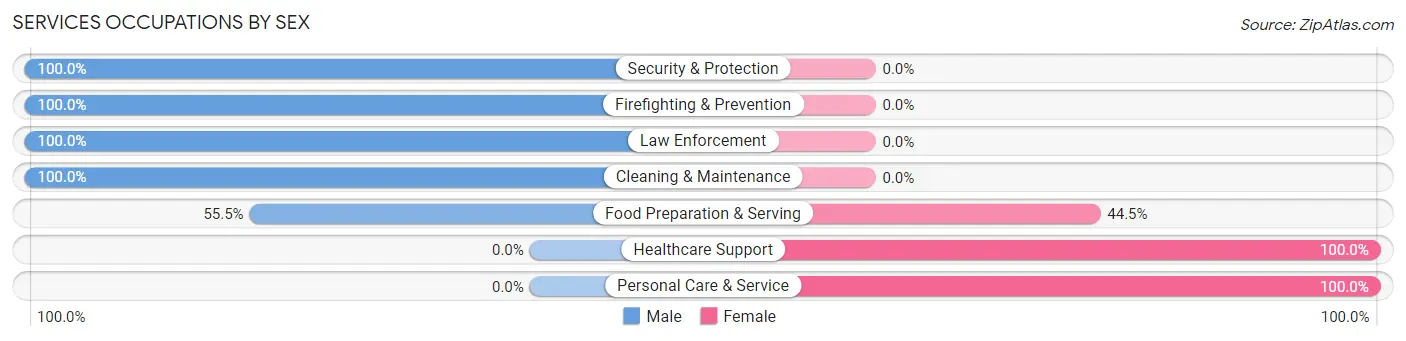
Services Occupations by Sex
Within the Services occupations in Colchester, the most male-oriented occupations are Security & Protection (100.0%), Firefighting & Prevention (100.0%), and Law Enforcement (100.0%), while the most female-oriented occupations are Healthcare Support (100.0%), Personal Care & Service (100.0%), and Food Preparation & Serving (44.5%).
| Occupation | Male | Female |
| Healthcare Support | 0 (0.0%) | 55 (100.0%) |
| Security & Protection | 21 (100.0%) | 0 (0.0%) |
| Firefighting & Prevention | 10 (100.0%) | 0 (0.0%) |
| Law Enforcement | 11 (100.0%) | 0 (0.0%) |
| Food Preparation & Serving | 86 (55.5%) | 69 (44.5%) |
| Cleaning & Maintenance | 3 (100.0%) | 0 (0.0%) |
| Personal Care & Service | 0 (0.0%) | 37 (100.0%) |
| Total (Category) | 110 (40.6%) | 161 (59.4%) |
| Total (Overall) | 1,142 (54.7%) | 944 (45.3%) |
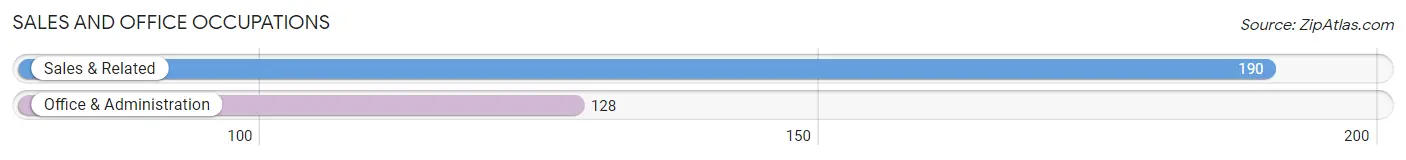
Sales and Office Occupations
The most common Sales and Office occupations in Colchester are Sales & Related (190 | 9.1%), and Office & Administration (128 | 6.1%).
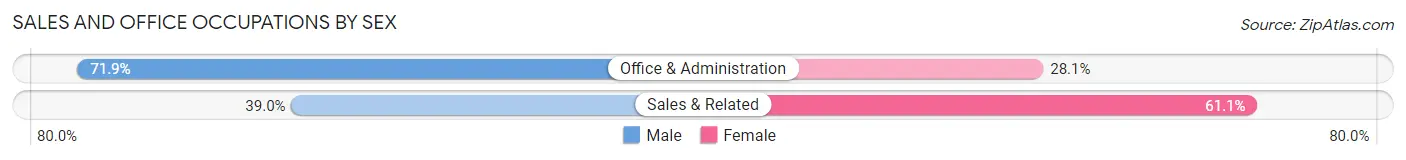
Sales and Office Occupations by Sex
| Occupation | Male | Female |
| Sales & Related | 74 (39.0%) | 116 (61.1%) |
| Office & Administration | 92 (71.9%) | 36 (28.1%) |
| Total (Category) | 166 (52.2%) | 152 (47.8%) |
| Total (Overall) | 1,142 (54.7%) | 944 (45.3%) |
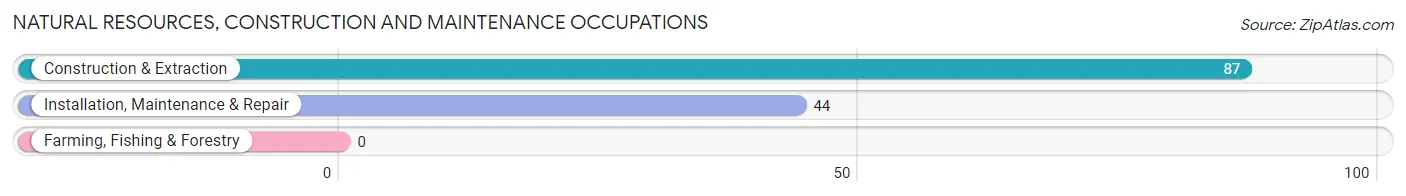
Natural Resources, Construction and Maintenance Occupations
The most common Natural Resources, Construction and Maintenance occupations in Colchester are Construction & Extraction (87 | 4.2%), and Installation, Maintenance & Repair (44 | 2.1%).
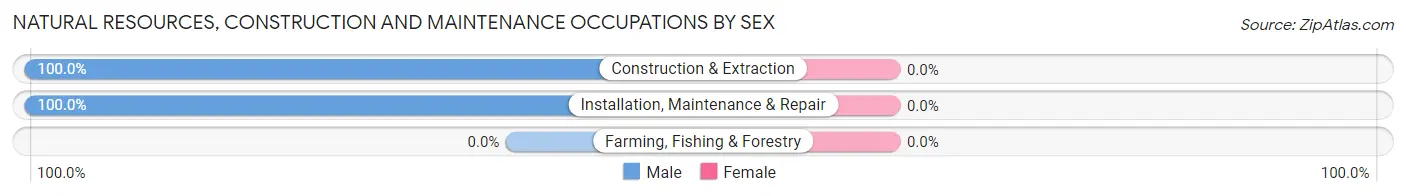
Natural Resources, Construction and Maintenance Occupations by Sex
| Occupation | Male | Female |
| Farming, Fishing & Forestry | 0 (0.0%) | 0 (0.0%) |
| Construction & Extraction | 87 (100.0%) | 0 (0.0%) |
| Installation, Maintenance & Repair | 44 (100.0%) | 0 (0.0%) |
| Total (Category) | 131 (100.0%) | 0 (0.0%) |
| Total (Overall) | 1,142 (54.7%) | 944 (45.3%) |
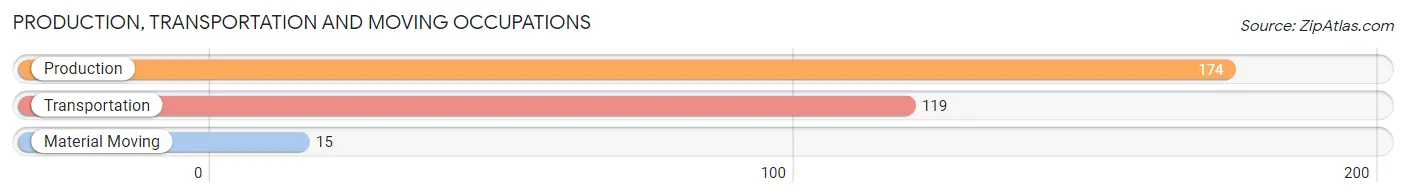
Production, Transportation and Moving Occupations
The most common Production, Transportation and Moving occupations in Colchester are Production (174 | 8.3%), Transportation (119 | 5.7%), and Material Moving (15 | 0.7%).
Production, Transportation and Moving Occupations by Sex
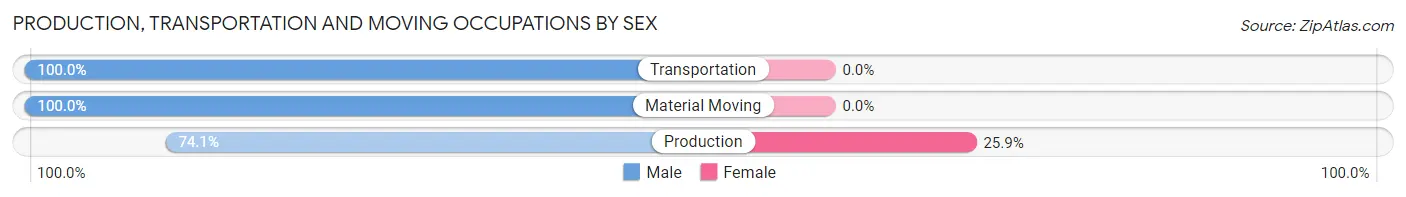
| Occupation | Male | Female |
| Production | 129 (74.1%) | 45 (25.9%) |
| Transportation | 119 (100.0%) | 0 (0.0%) |
| Material Moving | 15 (100.0%) | 0 (0.0%) |
| Total (Category) | 263 (85.4%) | 45 (14.6%) |
| Total (Overall) | 1,142 (54.7%) | 944 (45.3%) |
Employment Industries by Sex in Colchester
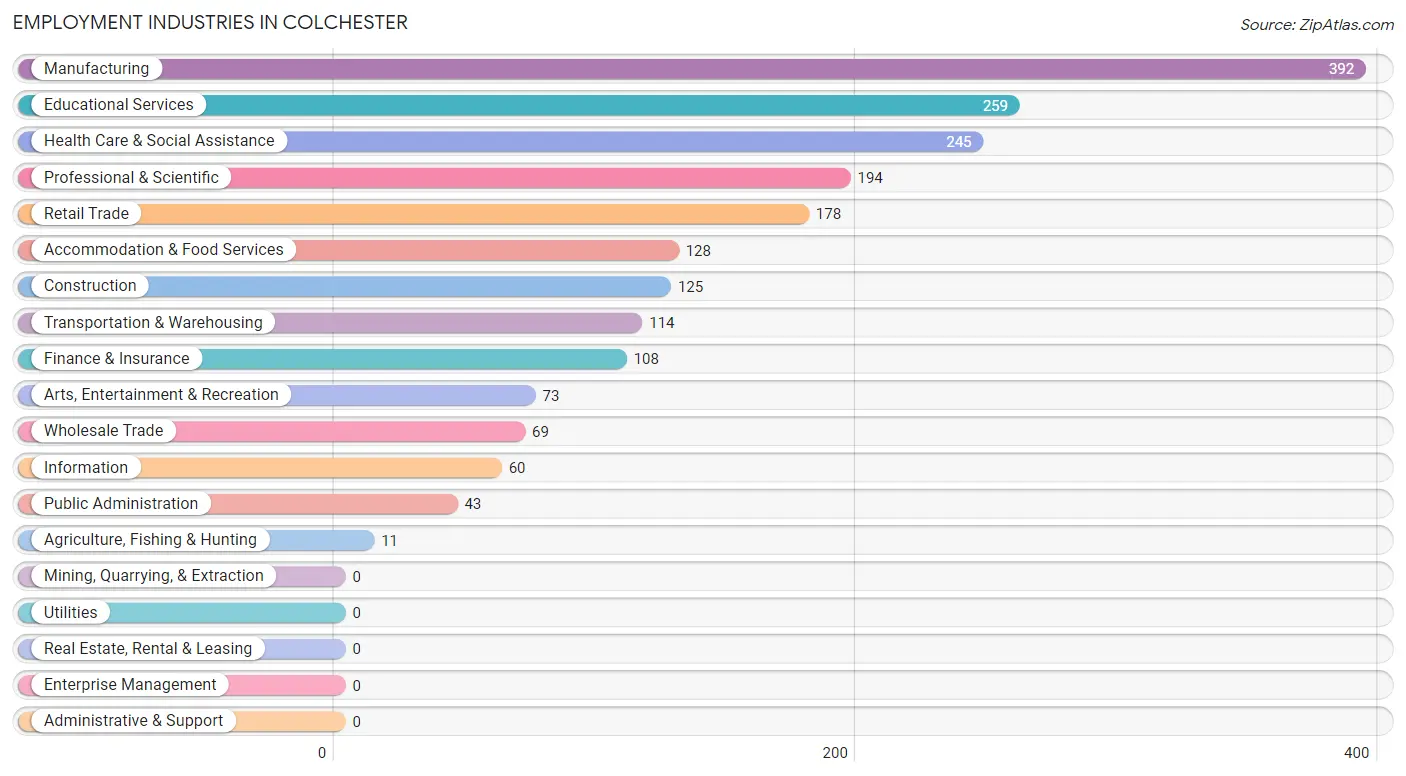
Employment Industries in Colchester
The major employment industries in Colchester include Manufacturing (392 | 18.8%), Educational Services (259 | 12.4%), Health Care & Social Assistance (245 | 11.7%), Professional & Scientific (194 | 9.3%), and Retail Trade (178 | 8.5%).
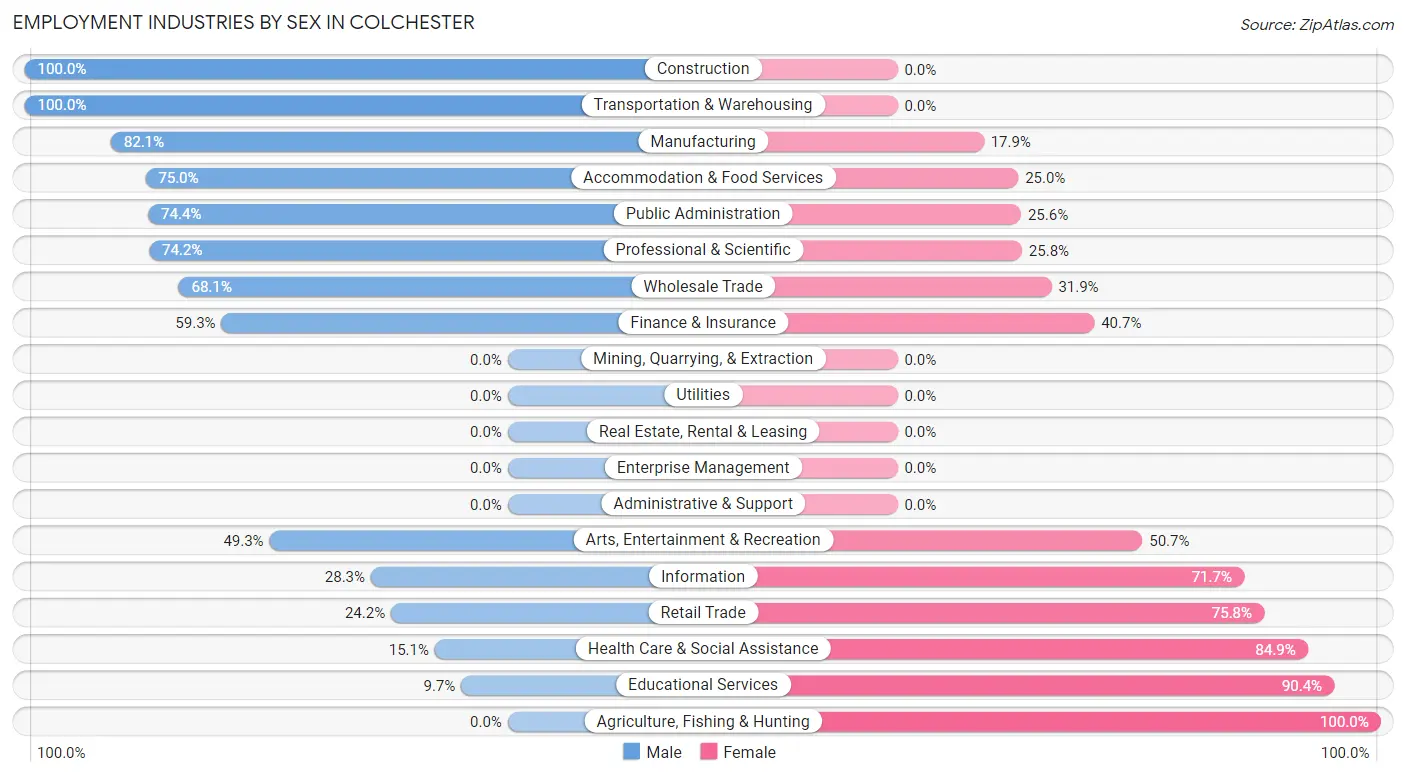
Employment Industries by Sex in Colchester
The Colchester industries that see more men than women are Construction (100.0%), Transportation & Warehousing (100.0%), and Manufacturing (82.1%), whereas the industries that tend to have a higher number of women are Agriculture, Fishing & Hunting (100.0%), Educational Services (90.3%), and Health Care & Social Assistance (84.9%).
| Industry | Male | Female |
| Agriculture, Fishing & Hunting | 0 (0.0%) | 11 (100.0%) |
| Mining, Quarrying, & Extraction | 0 (0.0%) | 0 (0.0%) |
| Construction | 125 (100.0%) | 0 (0.0%) |
| Manufacturing | 322 (82.1%) | 70 (17.9%) |
| Wholesale Trade | 47 (68.1%) | 22 (31.9%) |
| Retail Trade | 43 (24.2%) | 135 (75.8%) |
| Transportation & Warehousing | 114 (100.0%) | 0 (0.0%) |
| Utilities | 0 (0.0%) | 0 (0.0%) |
| Information | 17 (28.3%) | 43 (71.7%) |
| Finance & Insurance | 64 (59.3%) | 44 (40.7%) |
| Real Estate, Rental & Leasing | 0 (0.0%) | 0 (0.0%) |
| Professional & Scientific | 144 (74.2%) | 50 (25.8%) |
| Enterprise Management | 0 (0.0%) | 0 (0.0%) |
| Administrative & Support | 0 (0.0%) | 0 (0.0%) |
| Educational Services | 25 (9.7%) | 234 (90.3%) |
| Health Care & Social Assistance | 37 (15.1%) | 208 (84.9%) |
| Arts, Entertainment & Recreation | 36 (49.3%) | 37 (50.7%) |
| Accommodation & Food Services | 96 (75.0%) | 32 (25.0%) |
| Public Administration | 32 (74.4%) | 11 (25.6%) |
| Total | 1,142 (54.7%) | 944 (45.3%) |
Education in Colchester
School Enrollment in Colchester
The most common levels of schooling among the 882 students in Colchester are high school (255 | 28.9%), middle school (141 | 16.0%), and elementary school (127 | 14.4%).
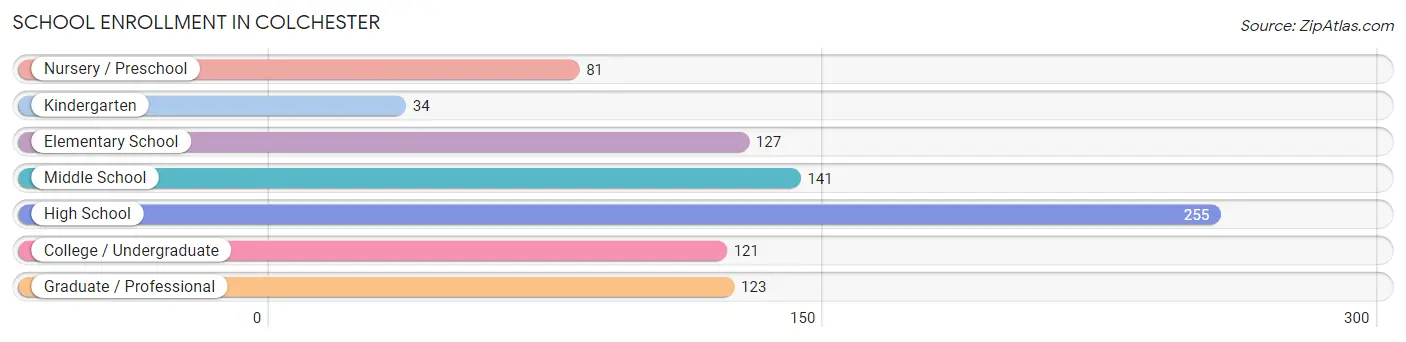
| School Level | # Students | % Students |
| Nursery / Preschool | 81 | 9.2% |
| Kindergarten | 34 | 3.8% |
| Elementary School | 127 | 14.4% |
| Middle School | 141 | 16.0% |
| High School | 255 | 28.9% |
| College / Undergraduate | 121 | 13.7% |
| Graduate / Professional | 123 | 14.0% |
| Total | 882 | 100.0% |
School Enrollment by Age by Funding Source in Colchester
Out of a total of 882 students who are enrolled in schools in Colchester, 198 (22.4%) attend a private institution, while the remaining 684 (77.6%) are enrolled in public schools. The age group of 25 to 34 year olds has the highest likelihood of being enrolled in private schools, with 92 (100.0% in the age bracket) enrolled. Conversely, the age group of 5 to 9 year old has the lowest likelihood of being enrolled in a private school, with 161 (100.0% in the age bracket) attending a public institution.
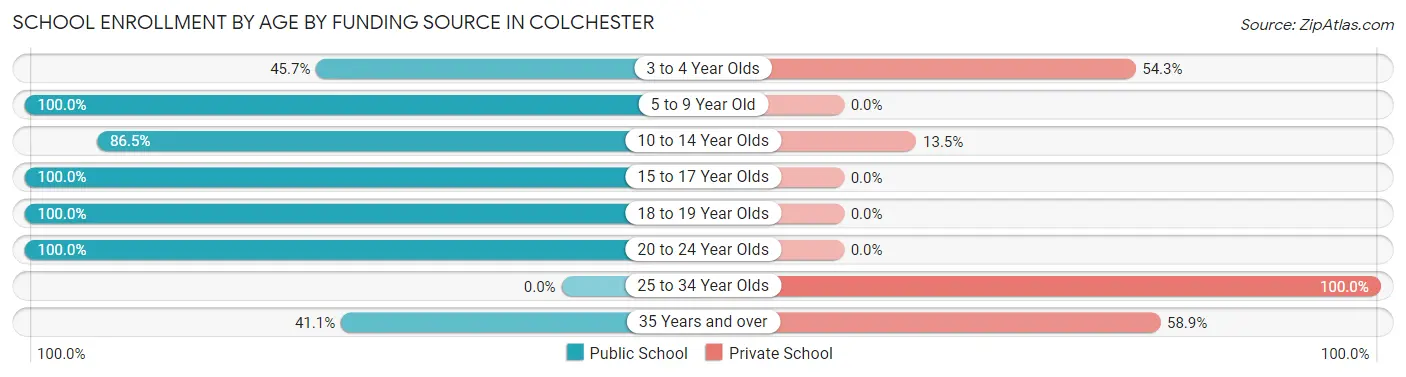
| Age Bracket | Public School | Private School |
| 3 to 4 Year Olds | 37 (45.7%) | 44 (54.3%) |
| 5 to 9 Year Old | 161 (100.0%) | 0 (0.0%) |
| 10 to 14 Year Olds | 186 (86.5%) | 29 (13.5%) |
| 15 to 17 Year Olds | 181 (100.0%) | 0 (0.0%) |
| 18 to 19 Year Olds | 9 (100.0%) | 0 (0.0%) |
| 20 to 24 Year Olds | 87 (100.0%) | 0 (0.0%) |
| 25 to 34 Year Olds | 0 (0.0%) | 92 (100.0%) |
| 35 Years and over | 23 (41.1%) | 33 (58.9%) |
| Total | 684 (77.6%) | 198 (22.4%) |
Educational Attainment by Field of Study in Colchester
Education (240 | 16.8%), science & technology (177 | 12.4%), visual & performing arts (171 | 11.9%), business (144 | 10.1%), and engineering (143 | 10.0%) are the most common fields of study among 1,432 individuals in Colchester who have obtained a bachelor's degree or higher.
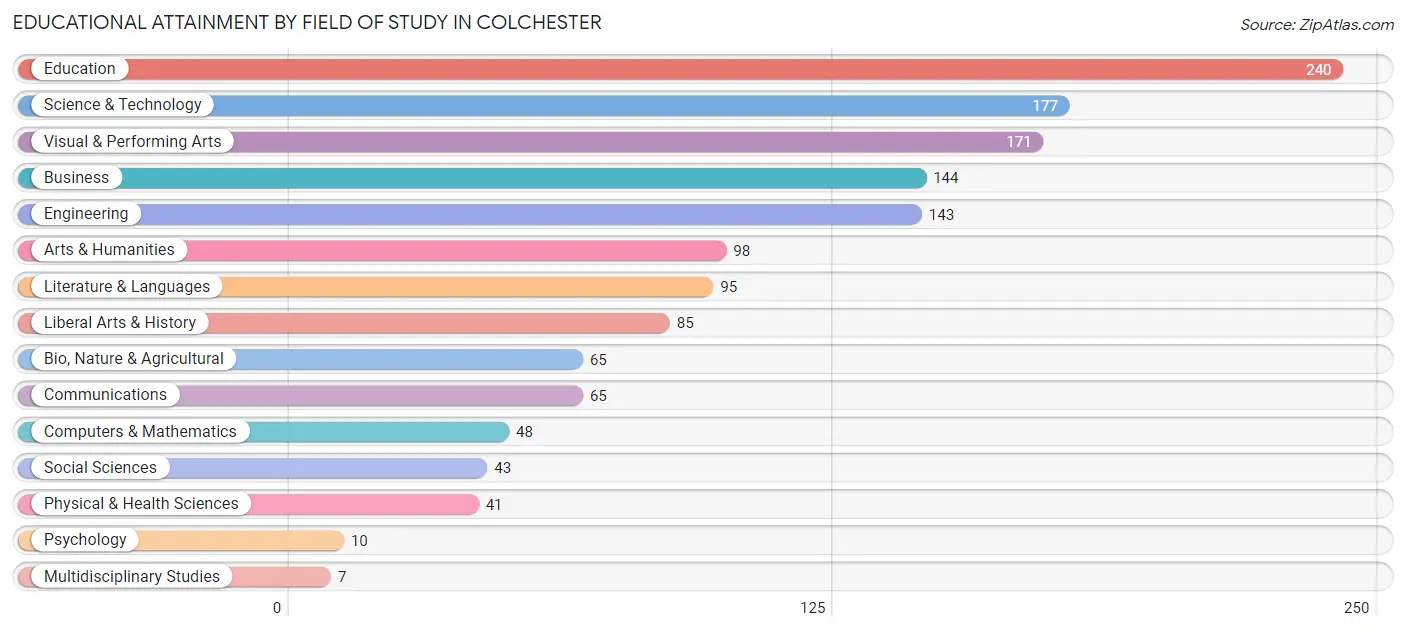
| Field of Study | # Graduates | % Graduates |
| Computers & Mathematics | 48 | 3.4% |
| Bio, Nature & Agricultural | 65 | 4.5% |
| Physical & Health Sciences | 41 | 2.9% |
| Psychology | 10 | 0.7% |
| Social Sciences | 43 | 3.0% |
| Engineering | 143 | 10.0% |
| Multidisciplinary Studies | 7 | 0.5% |
| Science & Technology | 177 | 12.4% |
| Business | 144 | 10.1% |
| Education | 240 | 16.8% |
| Literature & Languages | 95 | 6.6% |
| Liberal Arts & History | 85 | 5.9% |
| Visual & Performing Arts | 171 | 11.9% |
| Communications | 65 | 4.5% |
| Arts & Humanities | 98 | 6.8% |
| Total | 1,432 | 100.0% |
Transportation & Commute in Colchester
Vehicle Availability by Sex in Colchester
The most prevalent vehicle ownership categories in Colchester are males with 2 vehicles (622, accounting for 54.0%) and females with 2 vehicles (537, making up 65.9%).
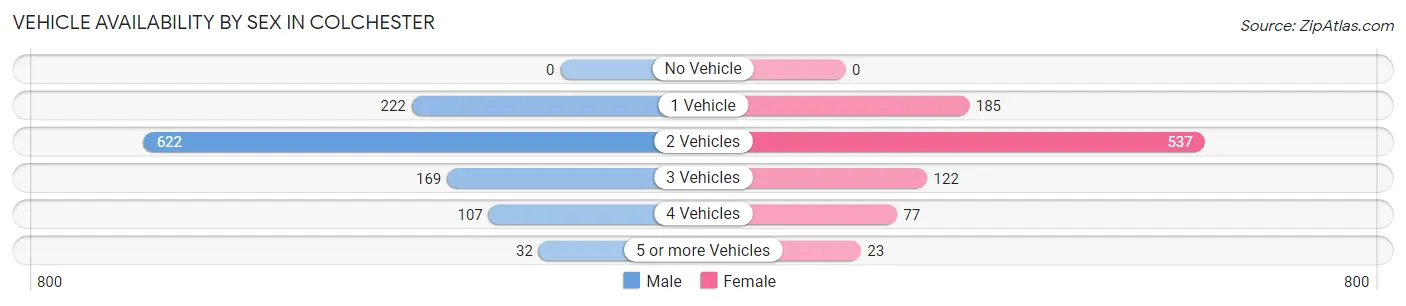
| Vehicles Available | Male | Female |
| No Vehicle | 0 (0.0%) | 0 (0.0%) |
| 1 Vehicle | 222 (19.3%) | 185 (19.6%) |
| 2 Vehicles | 622 (54.0%) | 537 (56.9%) |
| 3 Vehicles | 169 (14.7%) | 122 (12.9%) |
| 4 Vehicles | 107 (9.3%) | 77 (8.2%) |
| 5 or more Vehicles | 32 (2.8%) | 23 (2.4%) |
| Total | 1,152 (100.0%) | 944 (100.0%) |
Commute Time in Colchester
The most frequently occuring commute durations in Colchester are 40 to 44 minutes (313 commuters, 17.3%), 30 to 34 minutes (307 commuters, 17.0%), and 45 to 59 minutes (276 commuters, 15.3%).
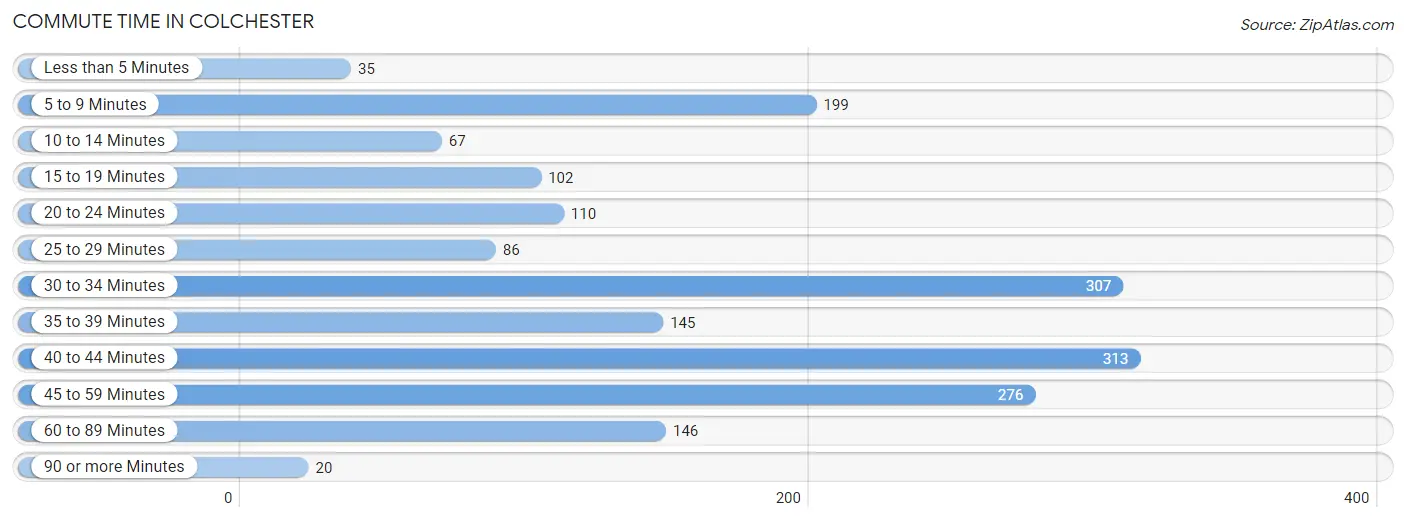
| Commute Time | # Commuters | % Commuters |
| Less than 5 Minutes | 35 | 1.9% |
| 5 to 9 Minutes | 199 | 11.0% |
| 10 to 14 Minutes | 67 | 3.7% |
| 15 to 19 Minutes | 102 | 5.7% |
| 20 to 24 Minutes | 110 | 6.1% |
| 25 to 29 Minutes | 86 | 4.8% |
| 30 to 34 Minutes | 307 | 17.0% |
| 35 to 39 Minutes | 145 | 8.0% |
| 40 to 44 Minutes | 313 | 17.3% |
| 45 to 59 Minutes | 276 | 15.3% |
| 60 to 89 Minutes | 146 | 8.1% |
| 90 or more Minutes | 20 | 1.1% |
Commute Time by Sex in Colchester
The most common commute times in Colchester are 45 to 59 minutes (245 commuters, 24.0%) for males and 40 to 44 minutes (171 commuters, 21.8%) for females.
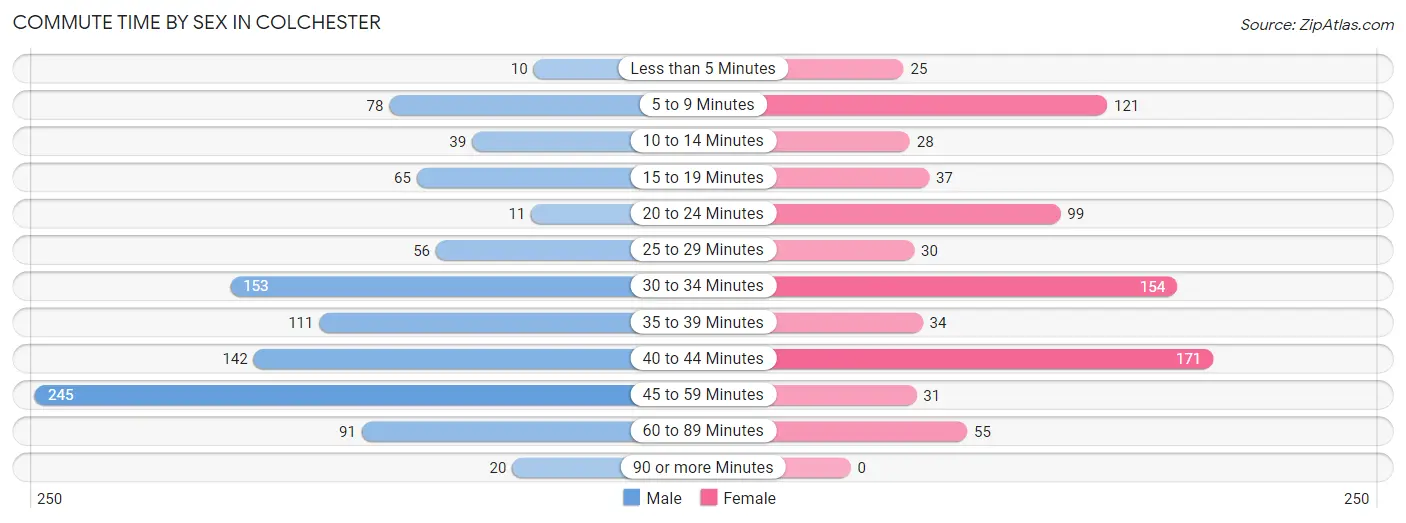
| Commute Time | Male | Female |
| Less than 5 Minutes | 10 (1.0%) | 25 (3.2%) |
| 5 to 9 Minutes | 78 (7.6%) | 121 (15.4%) |
| 10 to 14 Minutes | 39 (3.8%) | 28 (3.6%) |
| 15 to 19 Minutes | 65 (6.4%) | 37 (4.7%) |
| 20 to 24 Minutes | 11 (1.1%) | 99 (12.6%) |
| 25 to 29 Minutes | 56 (5.5%) | 30 (3.8%) |
| 30 to 34 Minutes | 153 (15.0%) | 154 (19.6%) |
| 35 to 39 Minutes | 111 (10.9%) | 34 (4.3%) |
| 40 to 44 Minutes | 142 (13.9%) | 171 (21.8%) |
| 45 to 59 Minutes | 245 (24.0%) | 31 (4.0%) |
| 60 to 89 Minutes | 91 (8.9%) | 55 (7.0%) |
| 90 or more Minutes | 20 (2.0%) | 0 (0.0%) |
Time of Departure to Work by Sex in Colchester
The most frequent times of departure to work in Colchester are 6:30 AM to 6:59 AM (177, 17.3%) for males and 7:00 AM to 7:29 AM (206, 26.2%) for females.
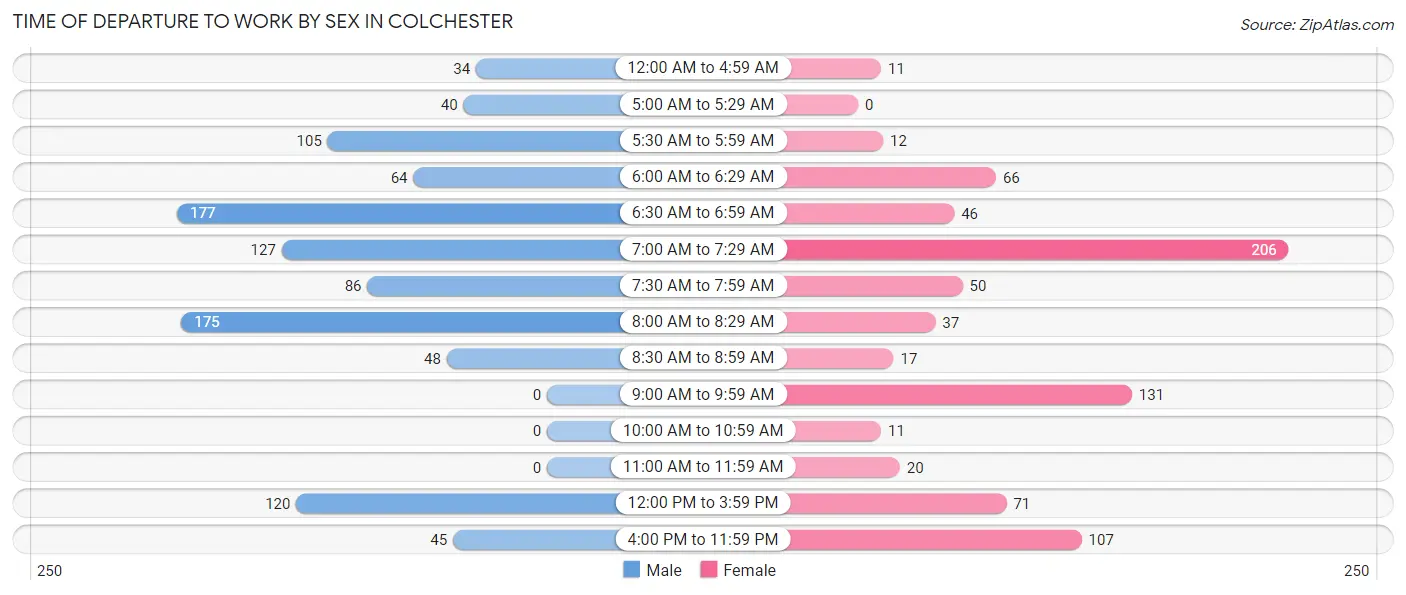
| Time of Departure | Male | Female |
| 12:00 AM to 4:59 AM | 34 (3.3%) | 11 (1.4%) |
| 5:00 AM to 5:29 AM | 40 (3.9%) | 0 (0.0%) |
| 5:30 AM to 5:59 AM | 105 (10.3%) | 12 (1.5%) |
| 6:00 AM to 6:29 AM | 64 (6.3%) | 66 (8.4%) |
| 6:30 AM to 6:59 AM | 177 (17.3%) | 46 (5.9%) |
| 7:00 AM to 7:29 AM | 127 (12.4%) | 206 (26.2%) |
| 7:30 AM to 7:59 AM | 86 (8.4%) | 50 (6.4%) |
| 8:00 AM to 8:29 AM | 175 (17.1%) | 37 (4.7%) |
| 8:30 AM to 8:59 AM | 48 (4.7%) | 17 (2.2%) |
| 9:00 AM to 9:59 AM | 0 (0.0%) | 131 (16.7%) |
| 10:00 AM to 10:59 AM | 0 (0.0%) | 11 (1.4%) |
| 11:00 AM to 11:59 AM | 0 (0.0%) | 20 (2.5%) |
| 12:00 PM to 3:59 PM | 120 (11.7%) | 71 (9.0%) |
| 4:00 PM to 11:59 PM | 45 (4.4%) | 107 (13.6%) |
| Total | 1,021 (100.0%) | 785 (100.0%) |
Housing Occupancy in Colchester
Occupancy by Ownership in Colchester
Of the total 2,129 dwellings in Colchester, owner-occupied units account for 1,275 (59.9%), while renter-occupied units make up 854 (40.1%).
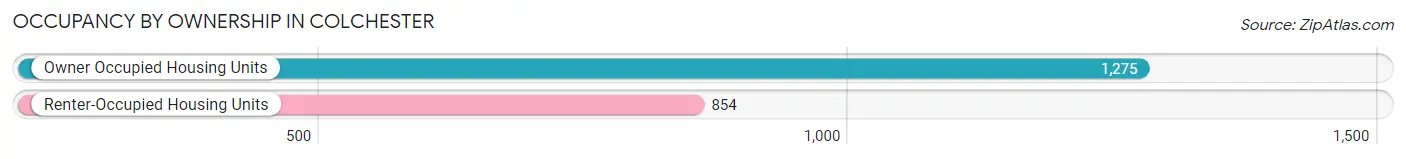
| Occupancy | # Housing Units | % Housing Units |
| Owner Occupied Housing Units | 1,275 | 59.9% |
| Renter-Occupied Housing Units | 854 | 40.1% |
| Total Occupied Housing Units | 2,129 | 100.0% |
Occupancy by Household Size in Colchester
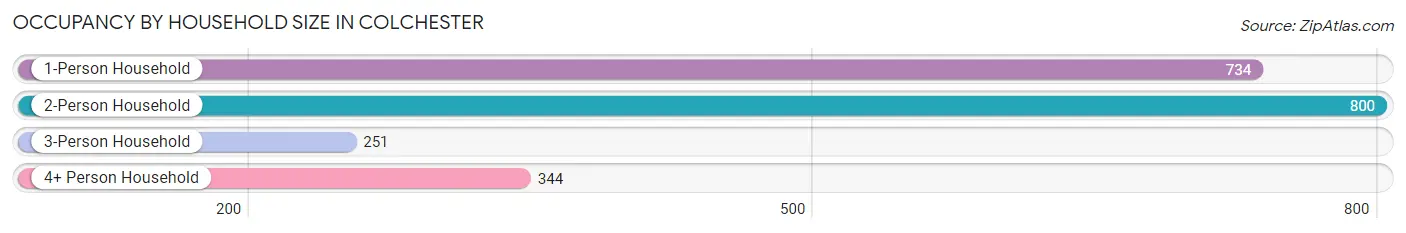
| Household Size | # Housing Units | % Housing Units |
| 1-Person Household | 734 | 34.5% |
| 2-Person Household | 800 | 37.6% |
| 3-Person Household | 251 | 11.8% |
| 4+ Person Household | 344 | 16.2% |
| Total Housing Units | 2,129 | 100.0% |
Occupancy by Ownership by Household Size in Colchester
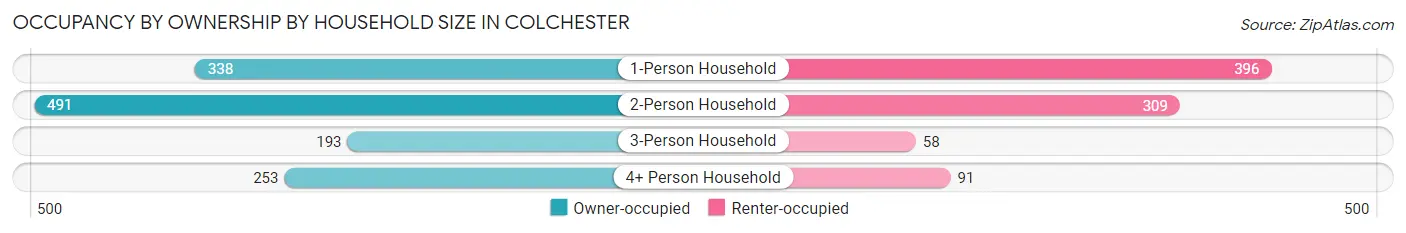
| Household Size | Owner-occupied | Renter-occupied |
| 1-Person Household | 338 (46.1%) | 396 (53.9%) |
| 2-Person Household | 491 (61.4%) | 309 (38.6%) |
| 3-Person Household | 193 (76.9%) | 58 (23.1%) |
| 4+ Person Household | 253 (73.6%) | 91 (26.5%) |
| Total Housing Units | 1,275 (59.9%) | 854 (40.1%) |
Occupancy by Educational Attainment in Colchester
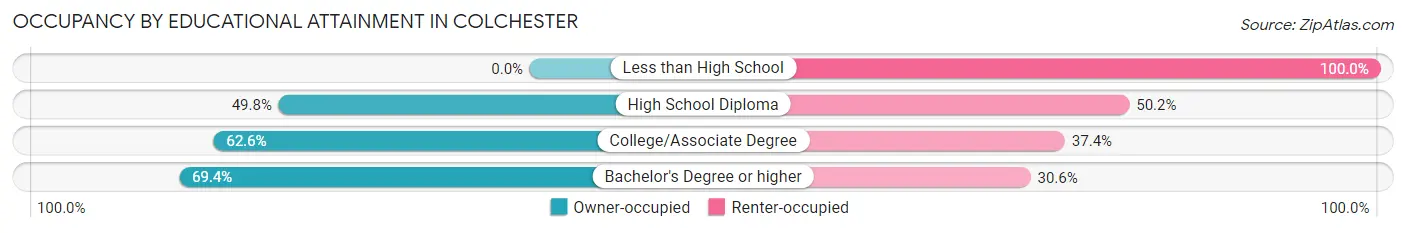
| Household Size | Owner-occupied | Renter-occupied |
| Less than High School | 0 (0.0%) | 66 (100.0%) |
| High School Diploma | 264 (49.8%) | 266 (50.2%) |
| College/Associate Degree | 485 (62.6%) | 290 (37.4%) |
| Bachelor's Degree or higher | 526 (69.4%) | 232 (30.6%) |
Occupancy by Age of Householder in Colchester
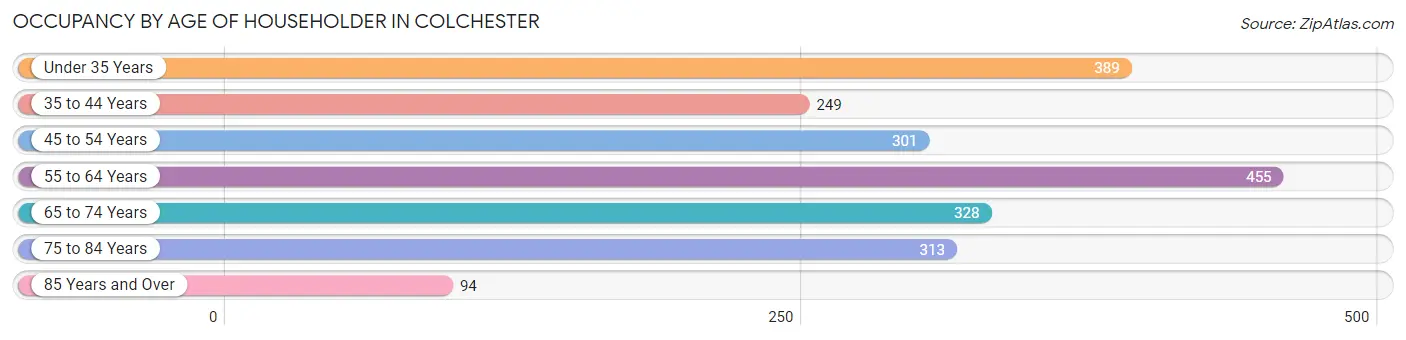
| Age Bracket | # Households | % Households |
| Under 35 Years | 389 | 18.3% |
| 35 to 44 Years | 249 | 11.7% |
| 45 to 54 Years | 301 | 14.1% |
| 55 to 64 Years | 455 | 21.4% |
| 65 to 74 Years | 328 | 15.4% |
| 75 to 84 Years | 313 | 14.7% |
| 85 Years and Over | 94 | 4.4% |
| Total | 2,129 | 100.0% |
Housing Finances in Colchester
Median Income by Occupancy in Colchester
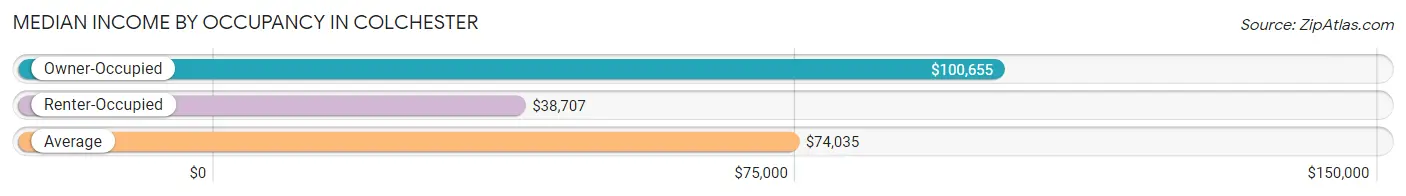
| Occupancy Type | # Households | Median Income |
| Owner-Occupied | 1,275 (59.9%) | $100,655 |
| Renter-Occupied | 854 (40.1%) | $38,707 |
| Average | 2,129 (100.0%) | $74,035 |
Occupancy by Householder Income Bracket in Colchester
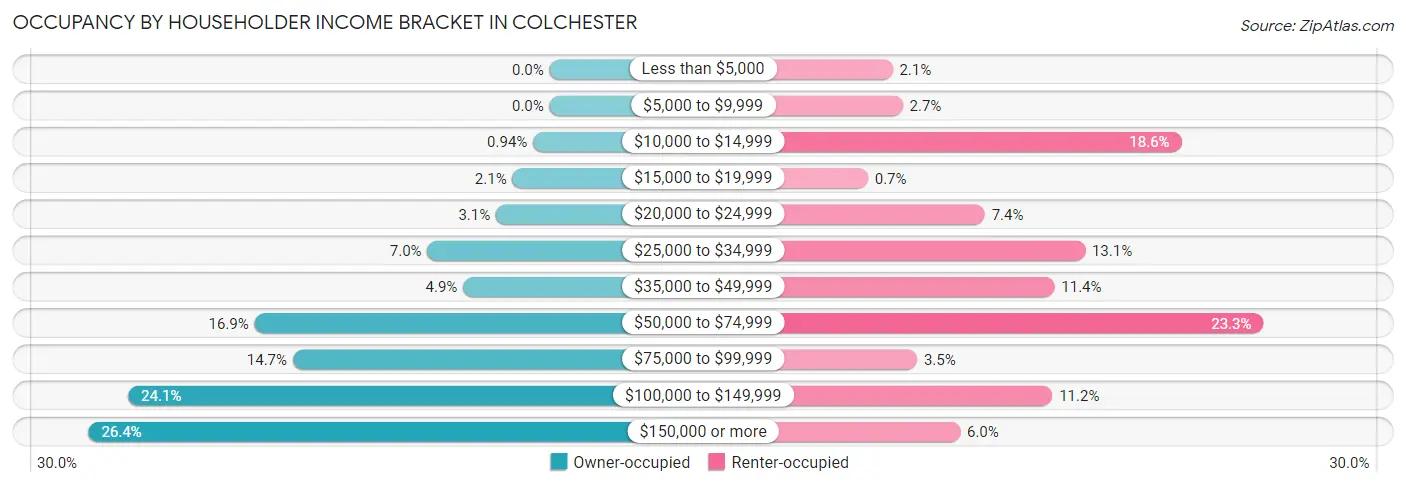
| Income Bracket | Owner-occupied | Renter-occupied |
| Less than $5,000 | 0 (0.0%) | 18 (2.1%) |
| $5,000 to $9,999 | 0 (0.0%) | 23 (2.7%) |
| $10,000 to $14,999 | 12 (0.9%) | 159 (18.6%) |
| $15,000 to $19,999 | 27 (2.1%) | 6 (0.7%) |
| $20,000 to $24,999 | 39 (3.1%) | 63 (7.4%) |
| $25,000 to $34,999 | 89 (7.0%) | 112 (13.1%) |
| $35,000 to $49,999 | 63 (4.9%) | 97 (11.4%) |
| $50,000 to $74,999 | 215 (16.9%) | 199 (23.3%) |
| $75,000 to $99,999 | 187 (14.7%) | 30 (3.5%) |
| $100,000 to $149,999 | 307 (24.1%) | 96 (11.2%) |
| $150,000 or more | 336 (26.4%) | 51 (6.0%) |
| Total | 1,275 (100.0%) | 854 (100.0%) |
Monthly Housing Cost Tiers in Colchester
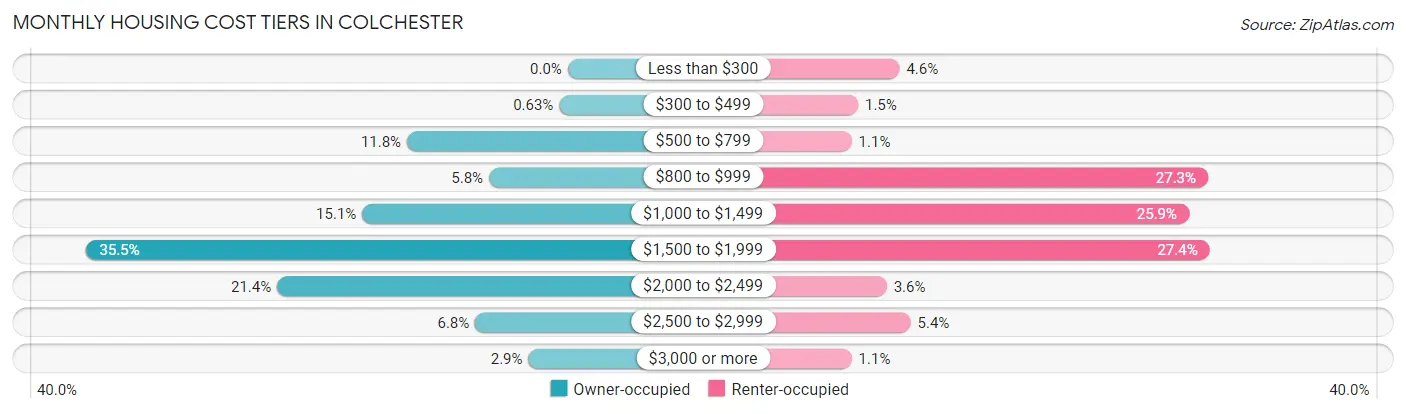
| Monthly Cost | Owner-occupied | Renter-occupied |
| Less than $300 | 0 (0.0%) | 39 (4.6%) |
| $300 to $499 | 8 (0.6%) | 13 (1.5%) |
| $500 to $799 | 151 (11.8%) | 9 (1.1%) |
| $800 to $999 | 74 (5.8%) | 233 (27.3%) |
| $1,000 to $1,499 | 193 (15.1%) | 221 (25.9%) |
| $1,500 to $1,999 | 452 (35.4%) | 234 (27.4%) |
| $2,000 to $2,499 | 273 (21.4%) | 31 (3.6%) |
| $2,500 to $2,999 | 87 (6.8%) | 46 (5.4%) |
| $3,000 or more | 37 (2.9%) | 9 (1.1%) |
| Total | 1,275 (100.0%) | 854 (100.0%) |
Physical Housing Characteristics in Colchester
Housing Structures in Colchester
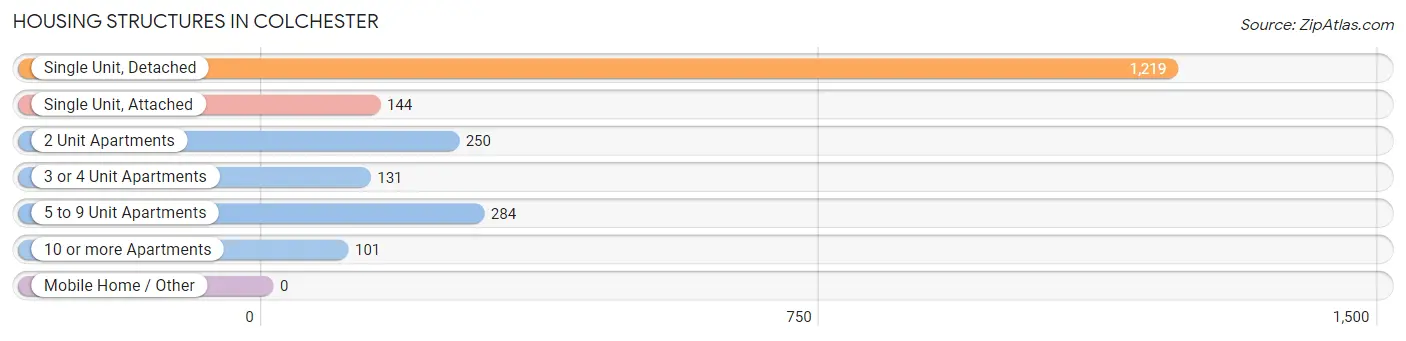
| Structure Type | # Housing Units | % Housing Units |
| Single Unit, Detached | 1,219 | 57.3% |
| Single Unit, Attached | 144 | 6.8% |
| 2 Unit Apartments | 250 | 11.7% |
| 3 or 4 Unit Apartments | 131 | 6.1% |
| 5 to 9 Unit Apartments | 284 | 13.3% |
| 10 or more Apartments | 101 | 4.7% |
| Mobile Home / Other | 0 | 0.0% |
| Total | 2,129 | 100.0% |
Housing Structures by Occupancy in Colchester
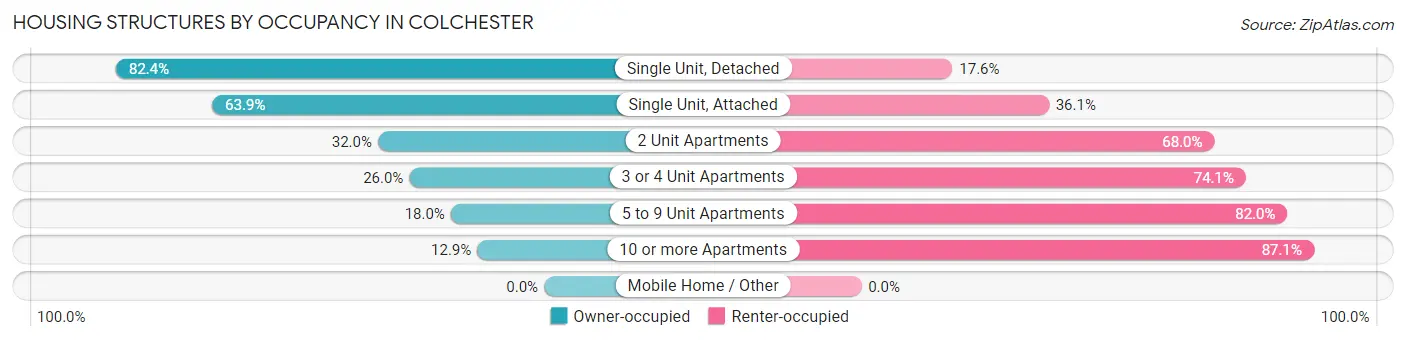
| Structure Type | Owner-occupied | Renter-occupied |
| Single Unit, Detached | 1,005 (82.4%) | 214 (17.6%) |
| Single Unit, Attached | 92 (63.9%) | 52 (36.1%) |
| 2 Unit Apartments | 80 (32.0%) | 170 (68.0%) |
| 3 or 4 Unit Apartments | 34 (26.0%) | 97 (74.1%) |
| 5 to 9 Unit Apartments | 51 (18.0%) | 233 (82.0%) |
| 10 or more Apartments | 13 (12.9%) | 88 (87.1%) |
| Mobile Home / Other | 0 (0.0%) | 0 (0.0%) |
| Total | 1,275 (59.9%) | 854 (40.1%) |
Housing Structures by Number of Rooms in Colchester
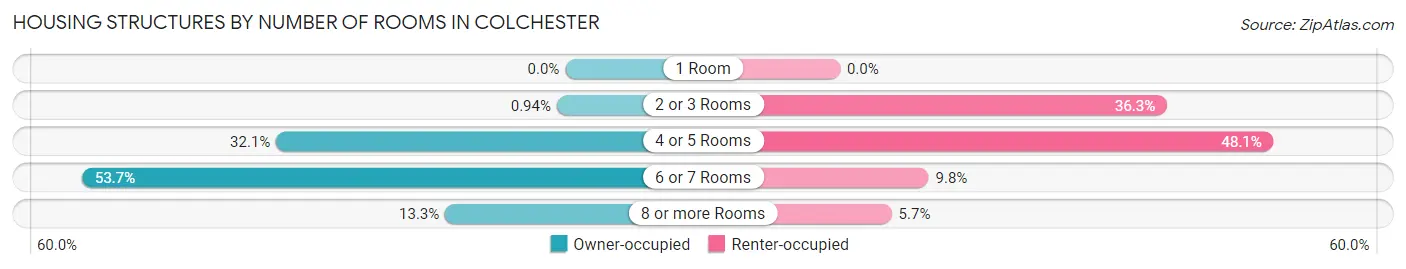
| Number of Rooms | Owner-occupied | Renter-occupied |
| 1 Room | 0 (0.0%) | 0 (0.0%) |
| 2 or 3 Rooms | 12 (0.9%) | 310 (36.3%) |
| 4 or 5 Rooms | 409 (32.1%) | 411 (48.1%) |
| 6 or 7 Rooms | 684 (53.6%) | 84 (9.8%) |
| 8 or more Rooms | 170 (13.3%) | 49 (5.7%) |
| Total | 1,275 (100.0%) | 854 (100.0%) |
Housing Structure by Heating Type in Colchester
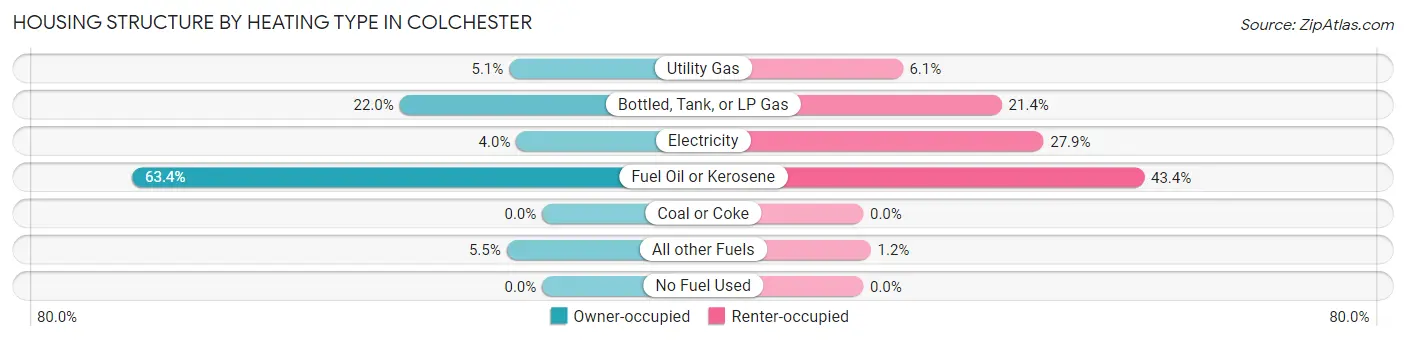
| Heating Type | Owner-occupied | Renter-occupied |
| Utility Gas | 65 (5.1%) | 52 (6.1%) |
| Bottled, Tank, or LP Gas | 281 (22.0%) | 183 (21.4%) |
| Electricity | 51 (4.0%) | 238 (27.9%) |
| Fuel Oil or Kerosene | 808 (63.4%) | 371 (43.4%) |
| Coal or Coke | 0 (0.0%) | 0 (0.0%) |
| All other Fuels | 70 (5.5%) | 10 (1.2%) |
| No Fuel Used | 0 (0.0%) | 0 (0.0%) |
| Total | 1,275 (100.0%) | 854 (100.0%) |
Household Vehicle Usage in Colchester
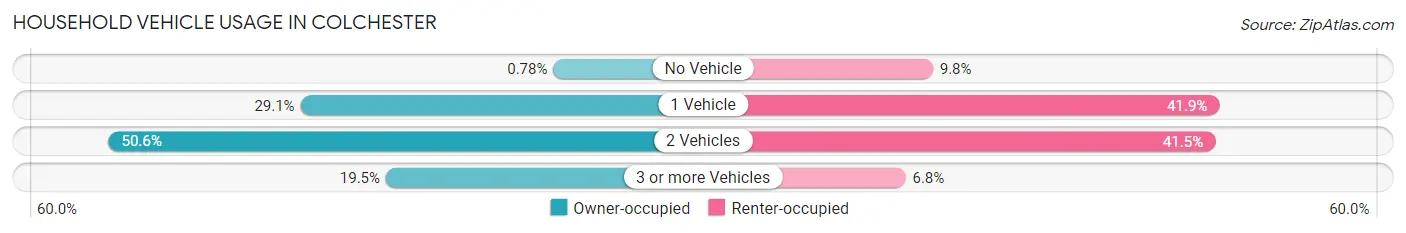
| Vehicles per Household | Owner-occupied | Renter-occupied |
| No Vehicle | 10 (0.8%) | 84 (9.8%) |
| 1 Vehicle | 371 (29.1%) | 358 (41.9%) |
| 2 Vehicles | 645 (50.6%) | 354 (41.4%) |
| 3 or more Vehicles | 249 (19.5%) | 58 (6.8%) |
| Total | 1,275 (100.0%) | 854 (100.0%) |
Real Estate & Mortgages in Colchester
Real Estate and Mortgage Overview in Colchester
| Characteristic | Without Mortgage | With Mortgage |
| Housing Units | 410 | 865 |
| Median Property Value | $259,000 | $251,100 |
| Median Household Income | $91,000 | $263 |
| Monthly Housing Costs | $980 | $37 |
| Real Estate Taxes | $5,495 | $0 |
Property Value by Mortgage Status in Colchester
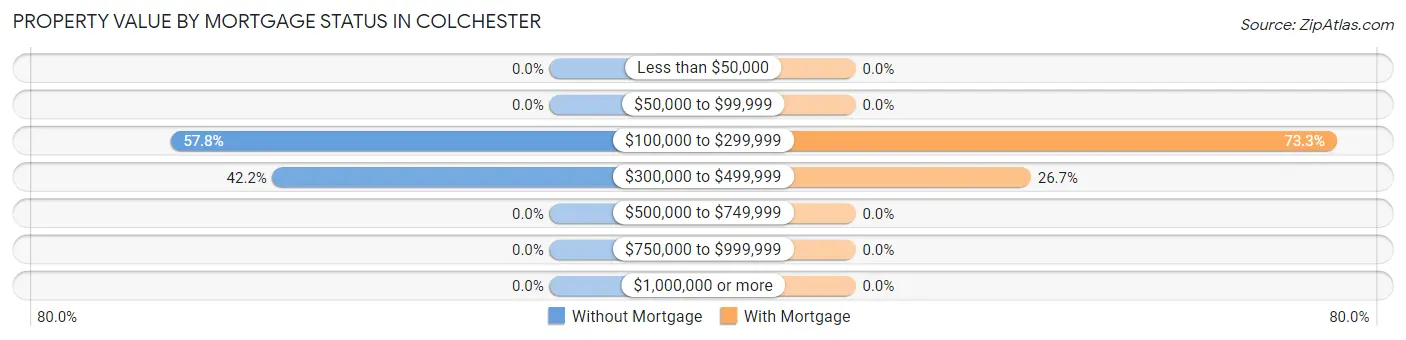
| Property Value | Without Mortgage | With Mortgage |
| Less than $50,000 | 0 (0.0%) | 0 (0.0%) |
| $50,000 to $99,999 | 0 (0.0%) | 0 (0.0%) |
| $100,000 to $299,999 | 237 (57.8%) | 634 (73.3%) |
| $300,000 to $499,999 | 173 (42.2%) | 231 (26.7%) |
| $500,000 to $749,999 | 0 (0.0%) | 0 (0.0%) |
| $750,000 to $999,999 | 0 (0.0%) | 0 (0.0%) |
| $1,000,000 or more | 0 (0.0%) | 0 (0.0%) |
| Total | 410 (100.0%) | 865 (100.0%) |
Household Income by Mortgage Status in Colchester
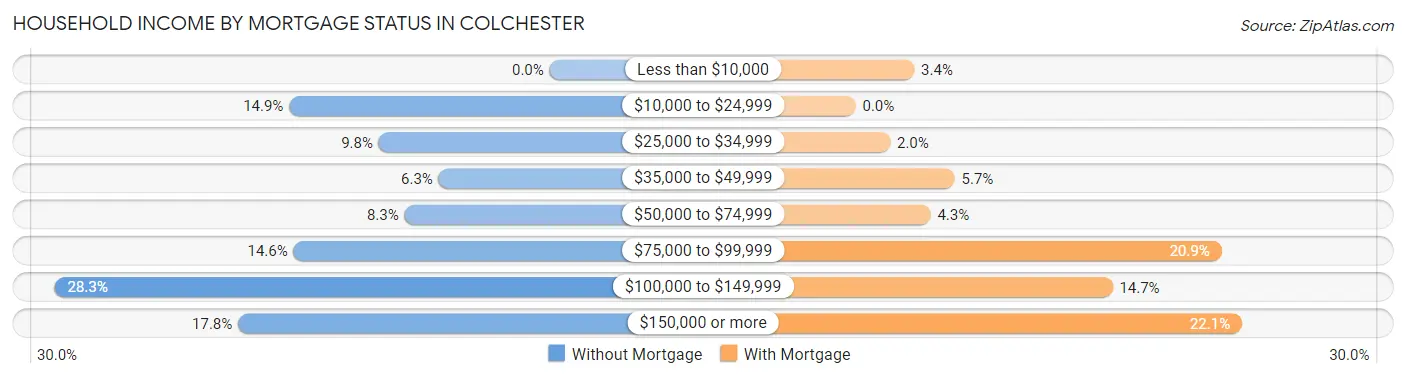
| Household Income | Without Mortgage | With Mortgage |
| Less than $10,000 | 0 (0.0%) | 29 (3.4%) |
| $10,000 to $24,999 | 61 (14.9%) | 0 (0.0%) |
| $25,000 to $34,999 | 40 (9.8%) | 17 (2.0%) |
| $35,000 to $49,999 | 26 (6.3%) | 49 (5.7%) |
| $50,000 to $74,999 | 34 (8.3%) | 37 (4.3%) |
| $75,000 to $99,999 | 60 (14.6%) | 181 (20.9%) |
| $100,000 to $149,999 | 116 (28.3%) | 127 (14.7%) |
| $150,000 or more | 73 (17.8%) | 191 (22.1%) |
| Total | 410 (100.0%) | 865 (100.0%) |
Property Value to Household Income Ratio in Colchester
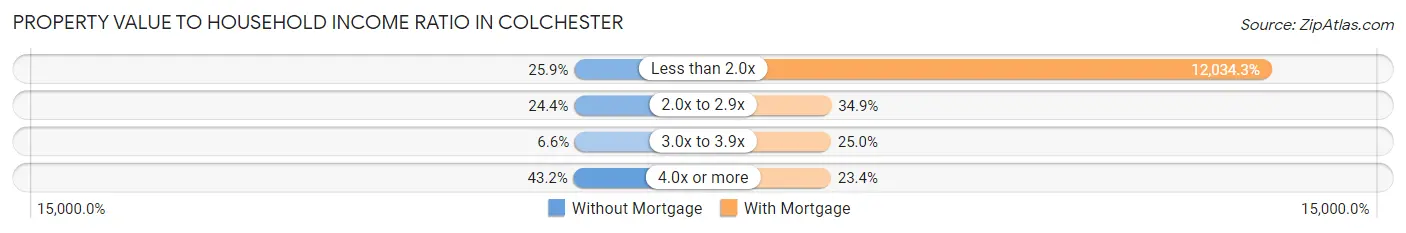
| Value-to-Income Ratio | Without Mortgage | With Mortgage |
| Less than 2.0x | 106 (25.9%) | 104,097 (12,034.3%) |
| 2.0x to 2.9x | 100 (24.4%) | 302 (34.9%) |
| 3.0x to 3.9x | 27 (6.6%) | 216 (25.0%) |
| 4.0x or more | 177 (43.2%) | 202 (23.4%) |
| Total | 410 (100.0%) | 865 (100.0%) |
Real Estate Taxes by Mortgage Status in Colchester
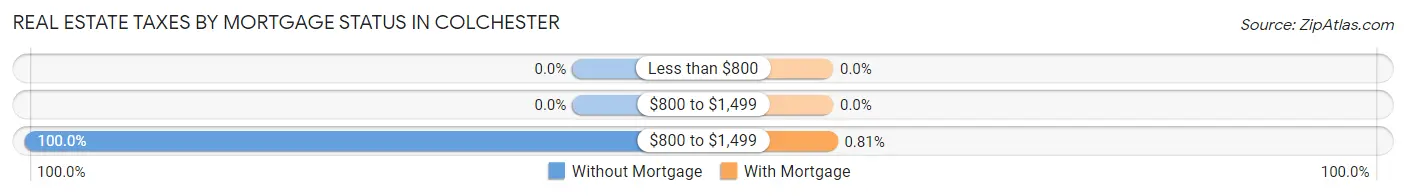
| Property Taxes | Without Mortgage | With Mortgage |
| Less than $800 | 0 (0.0%) | 0 (0.0%) |
| $800 to $1,499 | 0 (0.0%) | 0 (0.0%) |
| $800 to $1,499 | 410 (100.0%) | 7 (0.8%) |
| Total | 410 (100.0%) | 865 (100.0%) |
Health & Disability in Colchester
Health Insurance Coverage by Age in Colchester
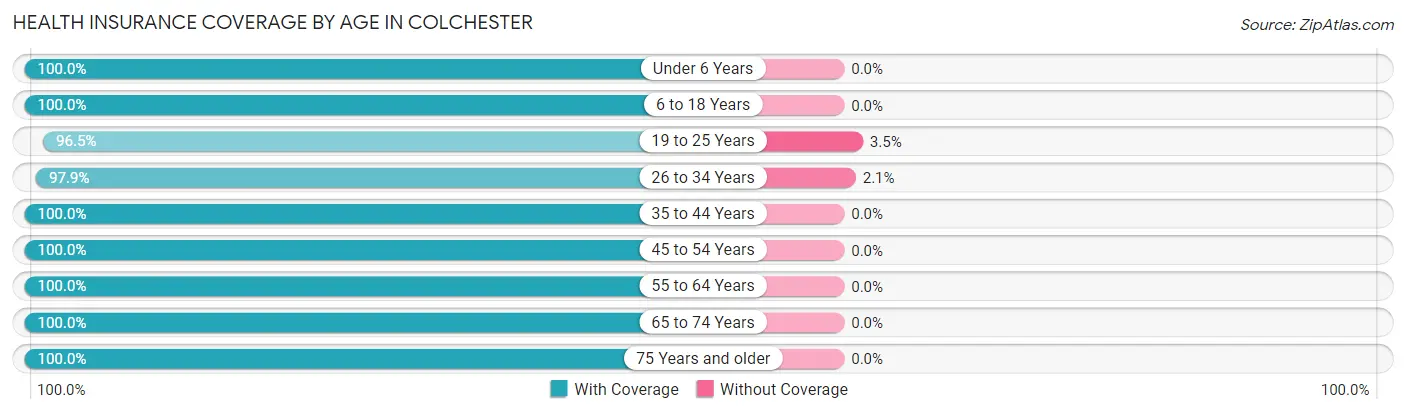
| Age Bracket | With Coverage | Without Coverage |
| Under 6 Years | 409 (100.0%) | 0 (0.0%) |
| 6 to 18 Years | 523 (100.0%) | 0 (0.0%) |
| 19 to 25 Years | 362 (96.5%) | 13 (3.5%) |
| 26 to 34 Years | 548 (97.9%) | 12 (2.1%) |
| 35 to 44 Years | 500 (100.0%) | 0 (0.0%) |
| 45 to 54 Years | 486 (100.0%) | 0 (0.0%) |
| 55 to 64 Years | 696 (100.0%) | 0 (0.0%) |
| 65 to 74 Years | 590 (100.0%) | 0 (0.0%) |
| 75 Years and older | 549 (100.0%) | 0 (0.0%) |
| Total | 4,663 (99.5%) | 25 (0.5%) |
Health Insurance Coverage by Citizenship Status in Colchester
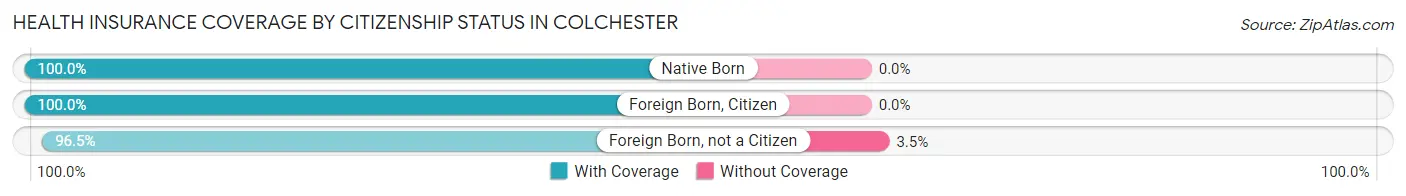
| Citizenship Status | With Coverage | Without Coverage |
| Native Born | 409 (100.0%) | 0 (0.0%) |
| Foreign Born, Citizen | 523 (100.0%) | 0 (0.0%) |
| Foreign Born, not a Citizen | 362 (96.5%) | 13 (3.5%) |
Health Insurance Coverage by Household Income in Colchester
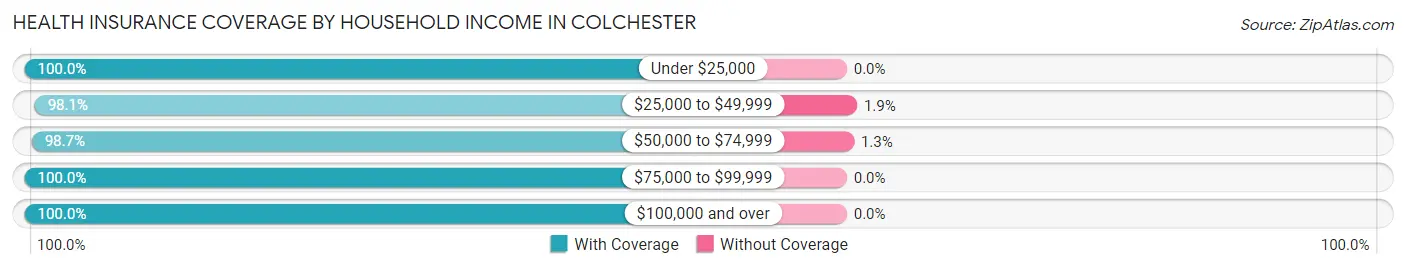
| Household Income | With Coverage | Without Coverage |
| Under $25,000 | 418 (100.0%) | 0 (0.0%) |
| $25,000 to $49,999 | 670 (98.1%) | 13 (1.9%) |
| $50,000 to $74,999 | 885 (98.7%) | 12 (1.3%) |
| $75,000 to $99,999 | 681 (100.0%) | 0 (0.0%) |
| $100,000 and over | 2,006 (100.0%) | 0 (0.0%) |
Public vs Private Health Insurance Coverage by Age in Colchester
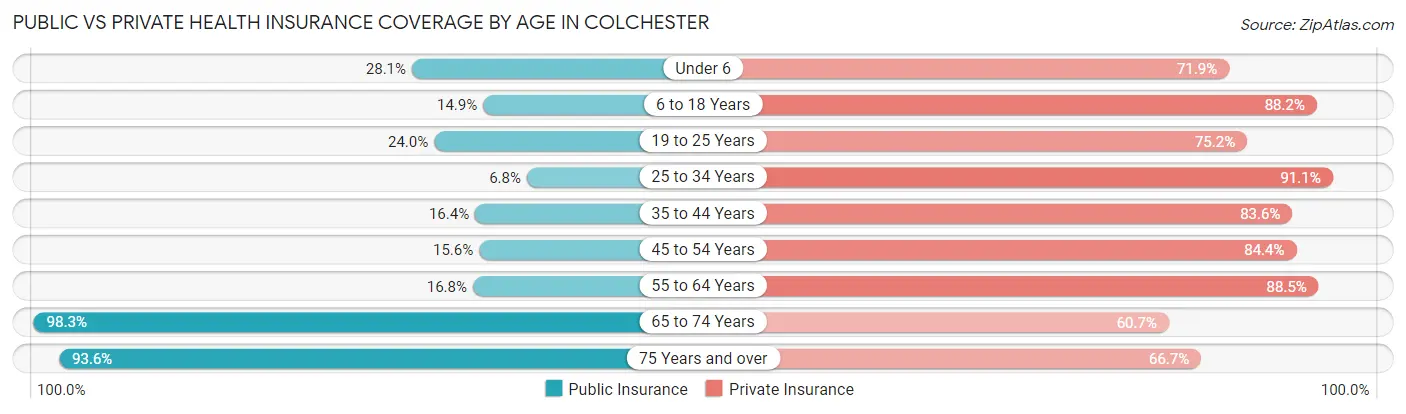
| Age Bracket | Public Insurance | Private Insurance |
| Under 6 | 115 (28.1%) | 294 (71.9%) |
| 6 to 18 Years | 78 (14.9%) | 461 (88.1%) |
| 19 to 25 Years | 90 (24.0%) | 282 (75.2%) |
| 25 to 34 Years | 38 (6.8%) | 510 (91.1%) |
| 35 to 44 Years | 82 (16.4%) | 418 (83.6%) |
| 45 to 54 Years | 76 (15.6%) | 410 (84.4%) |
| 55 to 64 Years | 117 (16.8%) | 616 (88.5%) |
| 65 to 74 Years | 580 (98.3%) | 358 (60.7%) |
| 75 Years and over | 514 (93.6%) | 366 (66.7%) |
| Total | 1,690 (36.0%) | 3,715 (79.2%) |
Disability Status by Sex by Age in Colchester
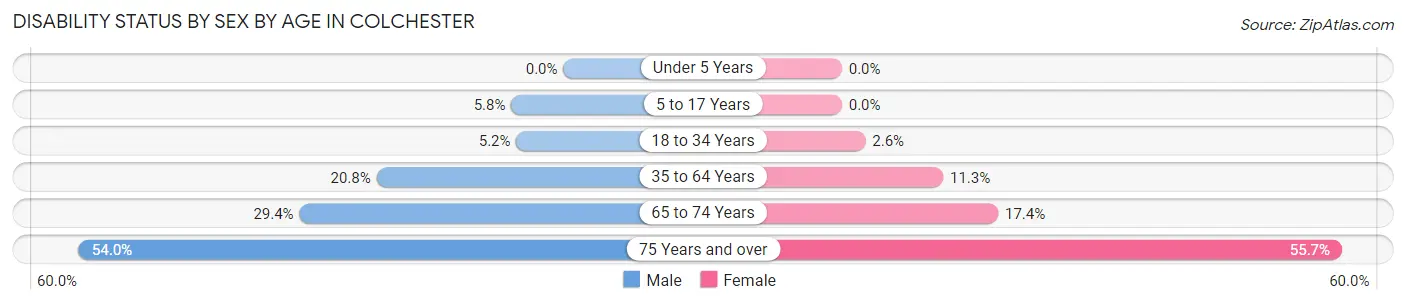
| Age Bracket | Male | Female |
| Under 5 Years | 0 (0.0%) | 0 (0.0%) |
| 5 to 17 Years | 12 (5.8%) | 0 (0.0%) |
| 18 to 34 Years | 29 (5.2%) | 10 (2.6%) |
| 35 to 64 Years | 182 (20.8%) | 91 (11.3%) |
| 65 to 74 Years | 67 (29.4%) | 63 (17.4%) |
| 75 Years and over | 116 (53.9%) | 186 (55.7%) |
Disability Class by Sex by Age in Colchester
Disability Class: Hearing Difficulty
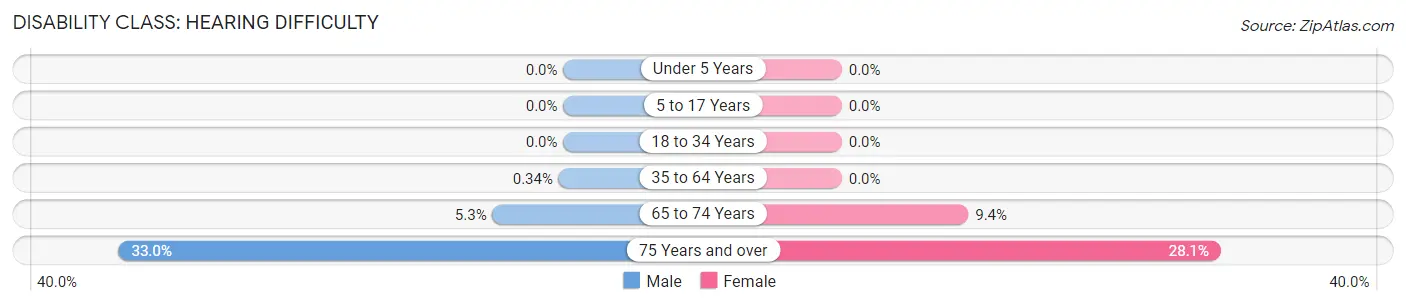
| Age Bracket | Male | Female |
| Under 5 Years | 0 (0.0%) | 0 (0.0%) |
| 5 to 17 Years | 0 (0.0%) | 0 (0.0%) |
| 18 to 34 Years | 0 (0.0%) | 0 (0.0%) |
| 35 to 64 Years | 3 (0.3%) | 0 (0.0%) |
| 65 to 74 Years | 12 (5.3%) | 34 (9.4%) |
| 75 Years and over | 71 (33.0%) | 94 (28.1%) |
Disability Class: Vision Difficulty
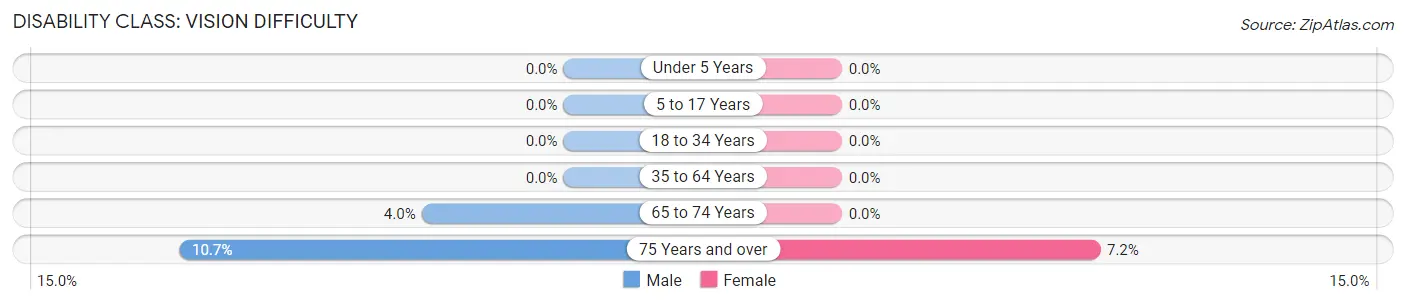
| Age Bracket | Male | Female |
| Under 5 Years | 0 (0.0%) | 0 (0.0%) |
| 5 to 17 Years | 0 (0.0%) | 0 (0.0%) |
| 18 to 34 Years | 0 (0.0%) | 0 (0.0%) |
| 35 to 64 Years | 0 (0.0%) | 0 (0.0%) |
| 65 to 74 Years | 9 (4.0%) | 0 (0.0%) |
| 75 Years and over | 23 (10.7%) | 24 (7.2%) |
Disability Class: Cognitive Difficulty
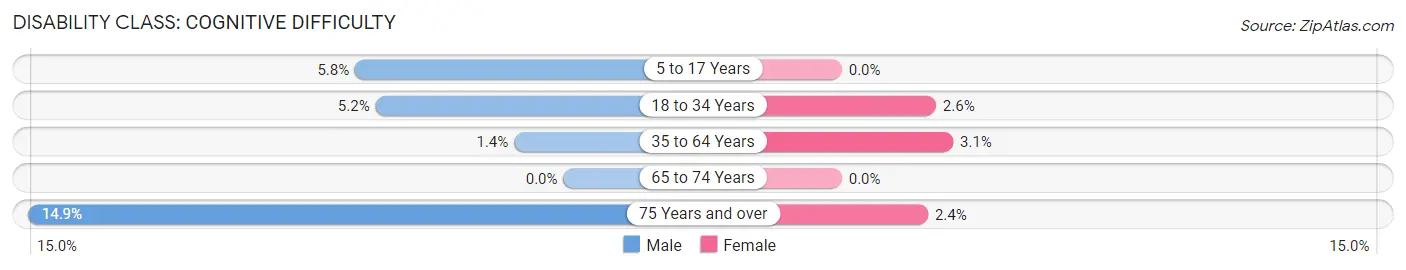
| Age Bracket | Male | Female |
| 5 to 17 Years | 12 (5.8%) | 0 (0.0%) |
| 18 to 34 Years | 29 (5.2%) | 10 (2.6%) |
| 35 to 64 Years | 12 (1.4%) | 25 (3.1%) |
| 65 to 74 Years | 0 (0.0%) | 0 (0.0%) |
| 75 Years and over | 32 (14.9%) | 8 (2.4%) |
Disability Class: Ambulatory Difficulty
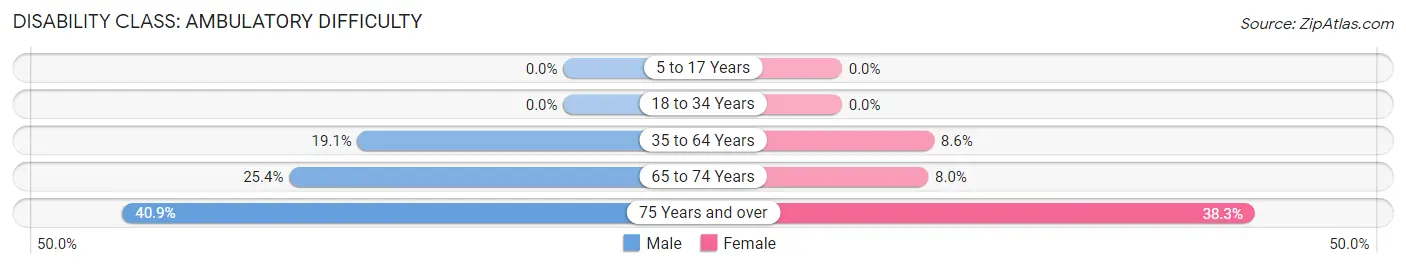
| Age Bracket | Male | Female |
| 5 to 17 Years | 0 (0.0%) | 0 (0.0%) |
| 18 to 34 Years | 0 (0.0%) | 0 (0.0%) |
| 35 to 64 Years | 167 (19.1%) | 69 (8.6%) |
| 65 to 74 Years | 58 (25.4%) | 29 (8.0%) |
| 75 Years and over | 88 (40.9%) | 128 (38.3%) |
Disability Class: Self-Care Difficulty
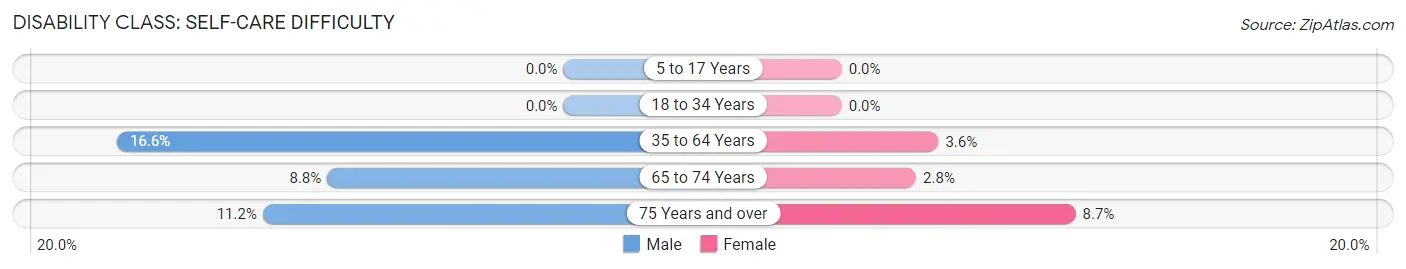
| Age Bracket | Male | Female |
| 5 to 17 Years | 0 (0.0%) | 0 (0.0%) |
| 18 to 34 Years | 0 (0.0%) | 0 (0.0%) |
| 35 to 64 Years | 145 (16.6%) | 29 (3.6%) |
| 65 to 74 Years | 20 (8.8%) | 10 (2.8%) |
| 75 Years and over | 24 (11.2%) | 29 (8.7%) |
Technology Access in Colchester
Computing Device Access in Colchester
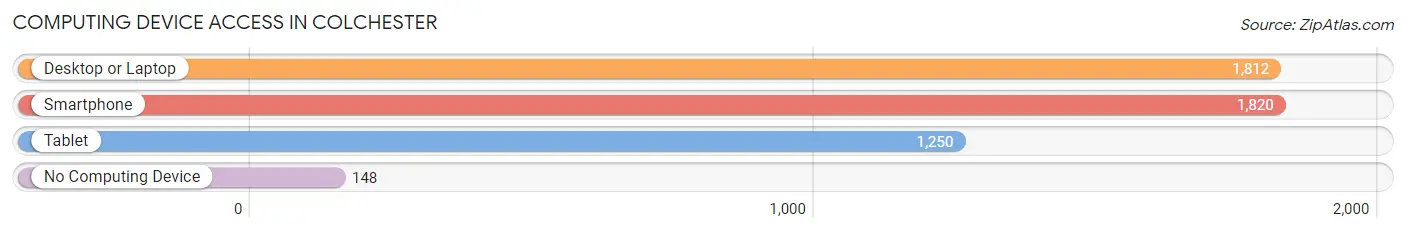
| Device Type | # Households | % Households |
| Desktop or Laptop | 1,812 | 85.1% |
| Smartphone | 1,820 | 85.5% |
| Tablet | 1,250 | 58.7% |
| No Computing Device | 148 | 7.0% |
| Total | 2,129 | 100.0% |
Internet Access in Colchester
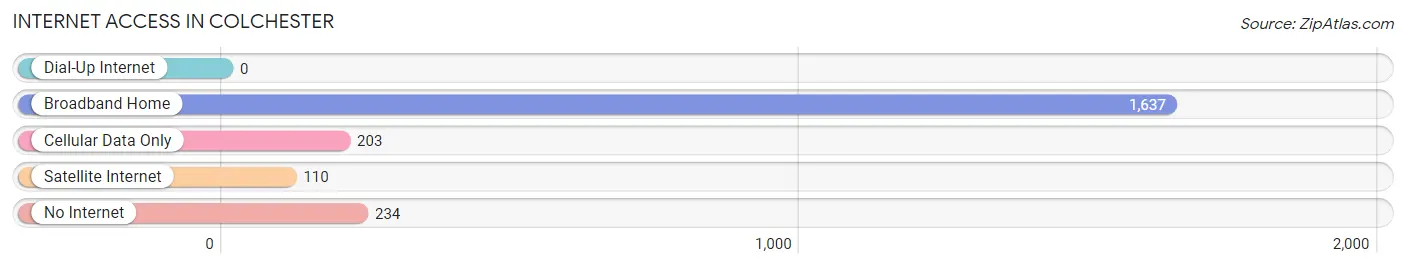
| Internet Type | # Households | % Households |
| Dial-Up Internet | 0 | 0.0% |
| Broadband Home | 1,637 | 76.9% |
| Cellular Data Only | 203 | 9.5% |
| Satellite Internet | 110 | 5.2% |
| No Internet | 234 | 11.0% |
| Total | 2,129 | 100.0% |
Colchester Summary
Colchester, Connecticut is a town located in New London County, Connecticut. It is bordered by the towns of East Lyme, Salem, and Lebanon. The town has a population of 16,068 as of the 2010 census.
History
Colchester was first settled in 1698 by settlers from the nearby town of Saybrook. The town was incorporated in May of 1703 and was named after Colchester, England. The town was originally a farming community, but by the mid-1800s, the town had become a manufacturing center. The town was home to several factories, including a cotton mill, a paper mill, and a woolen mill.
Geography
Colchester is located in southeastern Connecticut, about 10 miles east of the city of New London. The town is situated on the banks of the Salmon River, which flows through the town. The town is mostly rural, with a few small villages scattered throughout. The town is mostly flat, with some rolling hills in the northern part of town.
Economy
Colchester’s economy is largely based on agriculture and manufacturing. The town is home to several farms, which produce a variety of crops, including corn, soybeans, and hay. The town is also home to several manufacturing companies, including a paper mill, a plastics factory, and a machine shop. The town is also home to several small businesses, including restaurants, retail stores, and service providers.
Demographics
As of the 2010 census, Colchester had a population of 16,068. The racial makeup of the town was 94.3% White, 1.7% African American, 0.5% Native American, 1.2% Asian, 0.1% Pacific Islander, 1.2% from other races, and 1.1% from two or more races. Hispanic or Latino of any race were 3.2% of the population.
The median income for a household in the town was $68,945, and the median income for a family was $77,945. The per capita income for the town was $30,945. About 4.2% of families and 5.3% of the population were below the poverty line, including 6.3% of those under age 18 and 4.2% of those age 65 or over.
Colchester is a small town with a rich history and a diverse economy. The town is home to several farms and manufacturing companies, as well as a variety of small businesses. The town has a diverse population, with a mix of races and ethnicities. The town is a great place to live, work, and raise a family.
Common Questions
What is Per Capita Income in Colchester?
Per Capita income in Colchester is $40,669.
What is the Median Family Income in Colchester?
Median Family Income in Colchester is $96,300.
What is the Median Household income in Colchester?
Median Household Income in Colchester is $74,035.
What is Income or Wage Gap in Colchester?
Income or Wage Gap in Colchester is 32.9%.
Women in Colchester earn 67.1 cents for every dollar earned by a man.
What is Inequality or Gini Index in Colchester?
Inequality or Gini Index in Colchester is 0.39.
What is the Total Population of Colchester?
Total Population of Colchester is 4,868.
What is the Total Male Population of Colchester?
Total Male Population of Colchester is 2,333.
What is the Total Female Population of Colchester?
Total Female Population of Colchester is 2,535.
What is the Ratio of Males per 100 Females in Colchester?
There are 92.03 Males per 100 Females in Colchester.
What is the Ratio of Females per 100 Males in Colchester?
There are 108.66 Females per 100 Males in Colchester.
What is the Median Population Age in Colchester?
Median Population Age in Colchester is 45.9 Years.
What is the Average Family Size in Colchester
Average Family Size in Colchester is 2.8 People.
What is the Average Household Size in Colchester
Average Household Size in Colchester is 2.2 People.
How Large is the Labor Force in Colchester?
There are 2,281 People in the Labor Forcein in Colchester.
What is the Percentage of People in the Labor Force in Colchester?
56.3% of People are in the Labor Force in Colchester.
What is the Unemployment Rate in Colchester?
Unemployment Rate in Colchester is 8.0%.