Winsted, CT Map & Demographics
Winsted Map
Winsted Overview
$36,436
PER CAPITA INCOME
$83,011
AVG FAMILY INCOME
$66,250
AVG HOUSEHOLD INCOME
42.6%
WAGE / INCOME GAP [ % ]
57.4¢/ $1
WAGE / INCOME GAP [ $ ]
$6,163
FAMILY INCOME DEFICIT
0.45
INEQUALITY / GINI INDEX
6,880
TOTAL POPULATION
3,562
MALE POPULATION
3,318
FEMALE POPULATION
107.35
MALES / 100 FEMALES
93.15
FEMALES / 100 MALES
43.0
MEDIAN AGE
2.6
AVG FAMILY SIZE
2.1
AVG HOUSEHOLD SIZE
3,737
LABOR FORCE [ PEOPLE ]
64.1%
PERCENT IN LABOR FORCE
6.3%
UNEMPLOYMENT RATE
Winsted Zip Codes
Winsted Area Codes
Income in Winsted
Income Overview in Winsted
Per Capita Income in Winsted is $36,436, while median incomes of families and households are $83,011 and $66,250 respectively.
| Characteristic | Number | Measure |
| Per Capita Income | 6,880 | $36,436 |
| Median Family Income | 1,723 | $83,011 |
| Mean Family Income | 1,723 | $94,072 |
| Median Household Income | 3,291 | $66,250 |
| Mean Household Income | 3,291 | $76,785 |
| Income Deficit | 1,723 | $6,163 |
| Wage / Income Gap (%) | 6,880 | 42.60% |
| Wage / Income Gap ($) | 6,880 | 57.40¢ per $1 |
| Gini / Inequality Index | 6,880 | 0.45 |
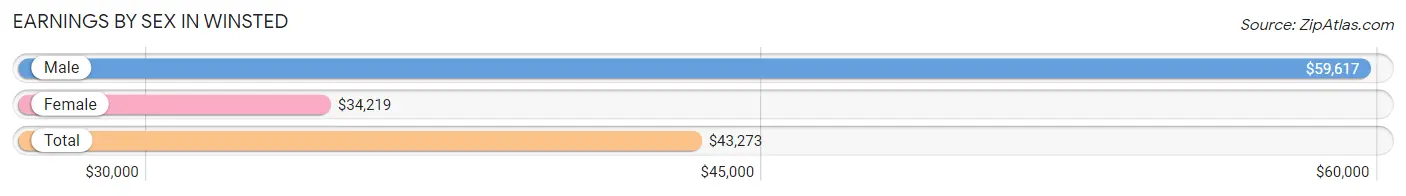
Earnings by Sex in Winsted
Average Earnings in Winsted are $43,273, $59,617 for men and $34,219 for women, a difference of 42.6%.
| Sex | Number | Average Earnings |
| Male | 1,751 (46.6%) | $59,617 |
| Female | 2,005 (53.4%) | $34,219 |
| Total | 3,756 (100.0%) | $43,273 |
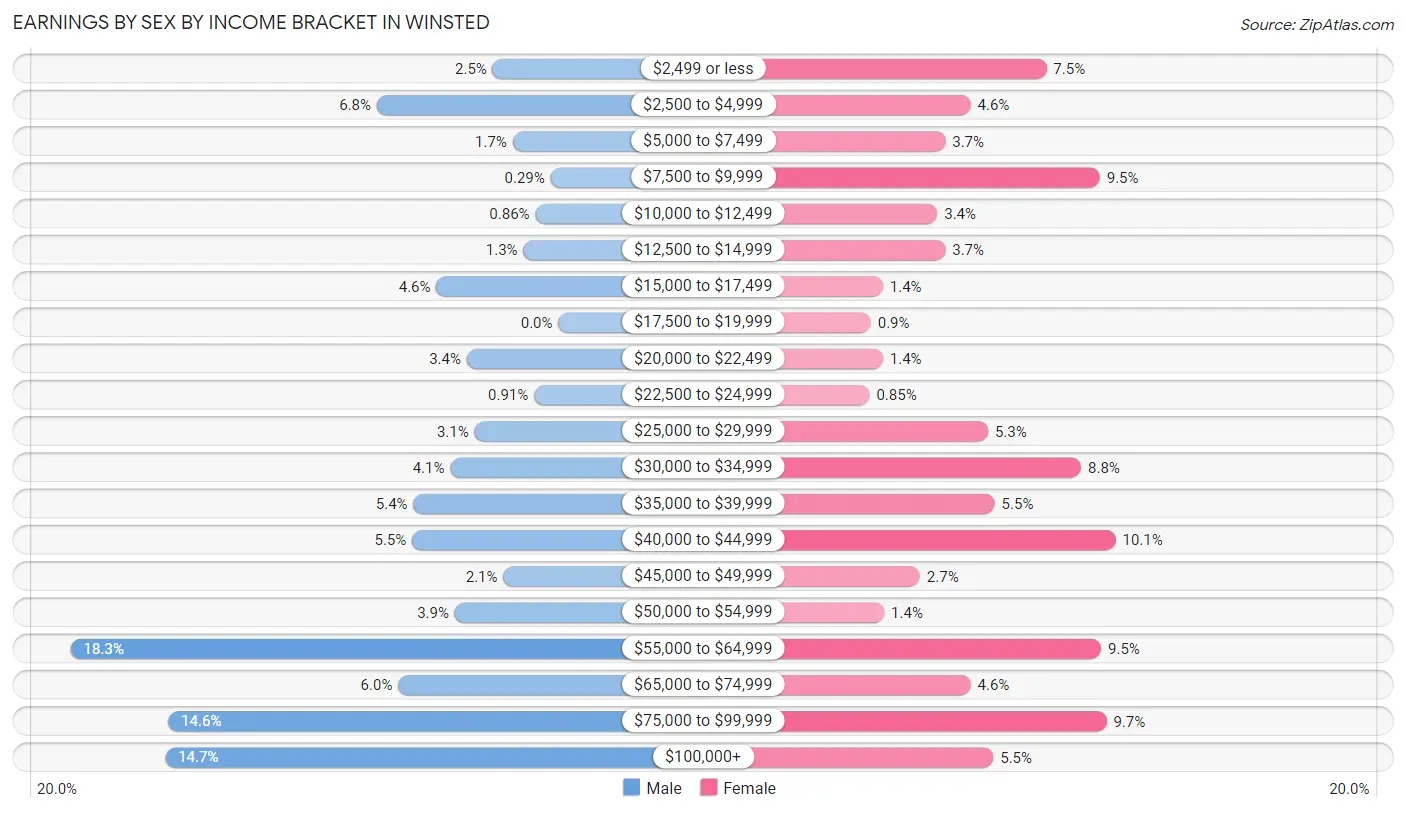
Earnings by Sex by Income Bracket in Winsted
The most common earnings brackets in Winsted are $55,000 to $64,999 for men (320 | 18.3%) and $40,000 to $44,999 for women (202 | 10.1%).
| Income | Male | Female |
| $2,499 or less | 43 (2.5%) | 150 (7.5%) |
| $2,500 to $4,999 | 119 (6.8%) | 93 (4.6%) |
| $5,000 to $7,499 | 30 (1.7%) | 74 (3.7%) |
| $7,500 to $9,999 | 5 (0.3%) | 190 (9.5%) |
| $10,000 to $12,499 | 15 (0.9%) | 68 (3.4%) |
| $12,500 to $14,999 | 23 (1.3%) | 74 (3.7%) |
| $15,000 to $17,499 | 80 (4.6%) | 27 (1.3%) |
| $17,500 to $19,999 | 0 (0.0%) | 18 (0.9%) |
| $20,000 to $22,499 | 60 (3.4%) | 27 (1.3%) |
| $22,500 to $24,999 | 16 (0.9%) | 17 (0.9%) |
| $25,000 to $29,999 | 55 (3.1%) | 106 (5.3%) |
| $30,000 to $34,999 | 71 (4.1%) | 176 (8.8%) |
| $35,000 to $39,999 | 95 (5.4%) | 111 (5.5%) |
| $40,000 to $44,999 | 96 (5.5%) | 202 (10.1%) |
| $45,000 to $49,999 | 36 (2.1%) | 55 (2.7%) |
| $50,000 to $54,999 | 68 (3.9%) | 28 (1.4%) |
| $55,000 to $64,999 | 320 (18.3%) | 191 (9.5%) |
| $65,000 to $74,999 | 105 (6.0%) | 93 (4.6%) |
| $75,000 to $99,999 | 256 (14.6%) | 195 (9.7%) |
| $100,000+ | 258 (14.7%) | 110 (5.5%) |
| Total | 1,751 (100.0%) | 2,005 (100.0%) |
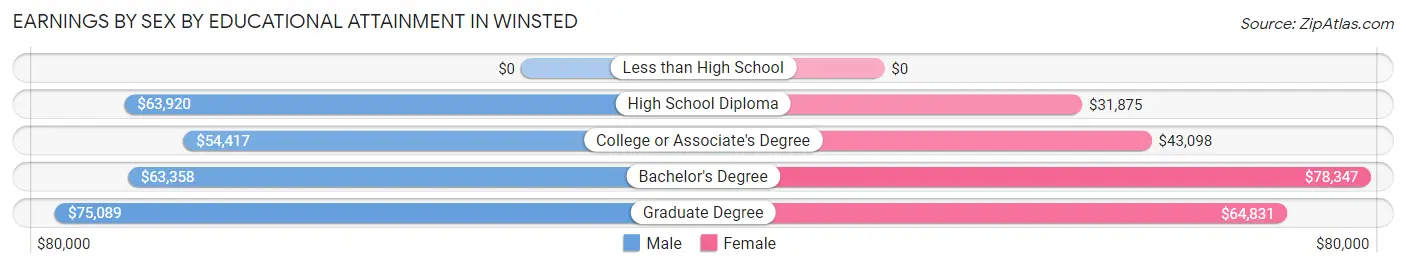
Earnings by Sex by Educational Attainment in Winsted
Average earnings in Winsted are $62,836 for men and $40,288 for women, a difference of 35.9%. Men with an educational attainment of graduate degree enjoy the highest average annual earnings of $75,089, while those with college or associate's degree education earn the least with $54,417. Women with an educational attainment of bachelor's degree earn the most with the average annual earnings of $78,347, while those with high school diploma education have the smallest earnings of $31,875.
| Educational Attainment | Male Income | Female Income |
| Less than High School | - | - |
| High School Diploma | $63,920 | $31,875 |
| College or Associate's Degree | $54,417 | $43,098 |
| Bachelor's Degree | $63,358 | $78,347 |
| Graduate Degree | $75,089 | $64,831 |
| Total | $62,836 | $40,288 |
Family Income in Winsted
Family Income Brackets in Winsted
According to the Winsted family income data, there are 477 families falling into the $100,000 to $149,999 income range, which is the most common income bracket and makes up 27.7% of all families. Conversely, the less than $10,000 income bracket is the least frequent group with only 21 families (1.2%) belonging to this category.
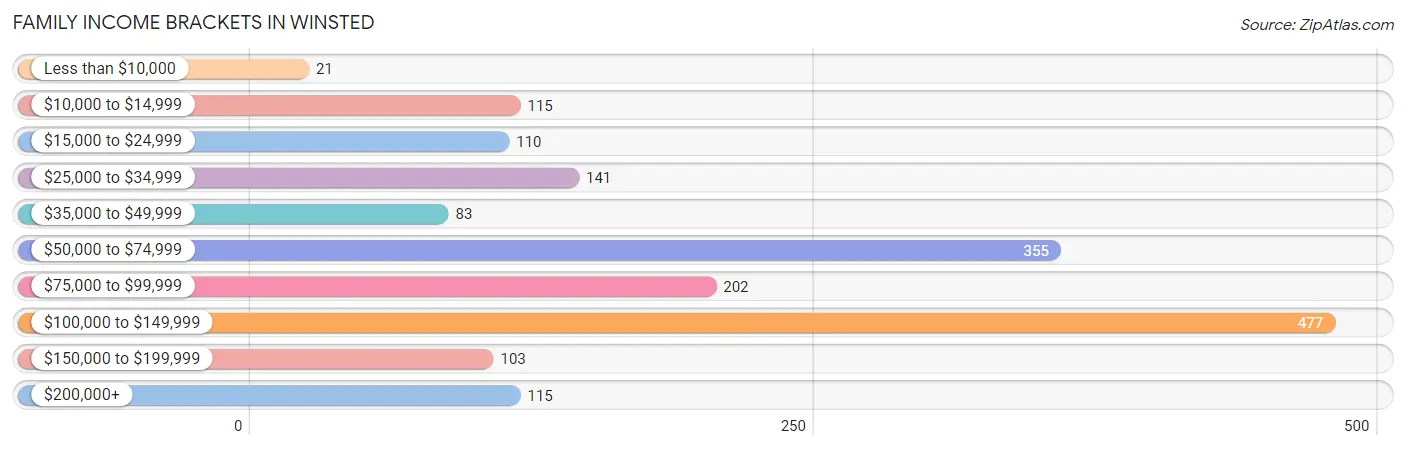
| Income Bracket | # Families | % Families |
| Less than $10,000 | 21 | 1.2% |
| $10,000 to $14,999 | 115 | 6.7% |
| $15,000 to $24,999 | 110 | 6.4% |
| $25,000 to $34,999 | 141 | 8.2% |
| $35,000 to $49,999 | 83 | 4.8% |
| $50,000 to $74,999 | 355 | 20.6% |
| $75,000 to $99,999 | 202 | 11.7% |
| $100,000 to $149,999 | 477 | 27.7% |
| $150,000 to $199,999 | 103 | 6.0% |
| $200,000+ | 115 | 6.7% |
Family Income by Famaliy Size in Winsted
4-person families (97 | 5.6%) account for the highest median family income in Winsted with $118,009 per family, while 2-person families (1,028 | 59.7%) have the highest median income of $36,399 per family member.
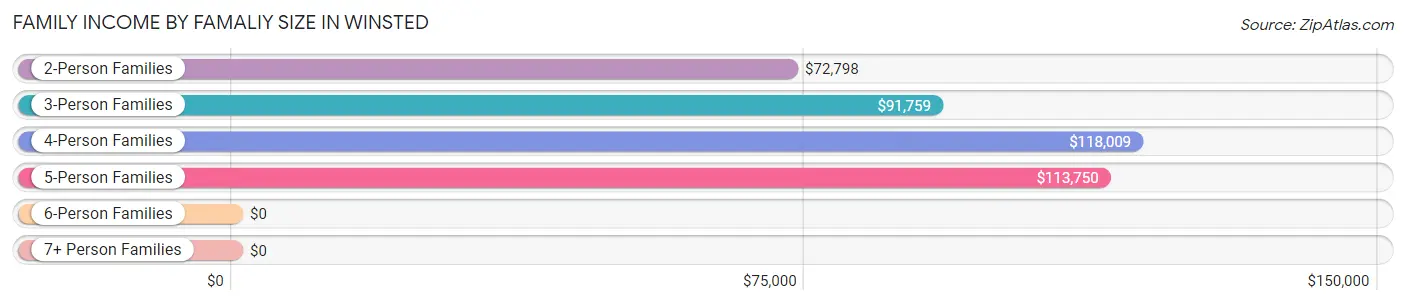
| Income Bracket | # Families | Median Income |
| 2-Person Families | 1,028 (59.7%) | $72,798 |
| 3-Person Families | 488 (28.3%) | $91,759 |
| 4-Person Families | 97 (5.6%) | $118,009 |
| 5-Person Families | 80 (4.6%) | $113,750 |
| 6-Person Families | 16 (0.9%) | $0 |
| 7+ Person Families | 14 (0.8%) | $0 |
| Total | 1,723 (100.0%) | $83,011 |
Family Income by Number of Earners in Winsted
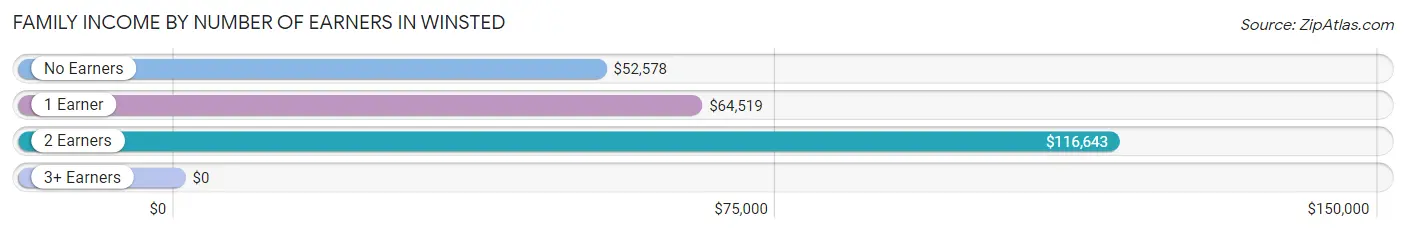
| Number of Earners | # Families | Median Income |
| No Earners | 201 (11.7%) | $52,578 |
| 1 Earner | 680 (39.5%) | $64,519 |
| 2 Earners | 686 (39.8%) | $116,643 |
| 3+ Earners | 156 (9.0%) | $0 |
| Total | 1,723 (100.0%) | $83,011 |
Household Income in Winsted
Household Income Brackets in Winsted
With 688 households falling in the category, the $100,000 to $149,999 income range is the most frequent in Winsted, accounting for 20.9% of all households. In contrast, only 168 households (5.1%) fall into the $25,000 to $34,999 income bracket, making it the least populous group.
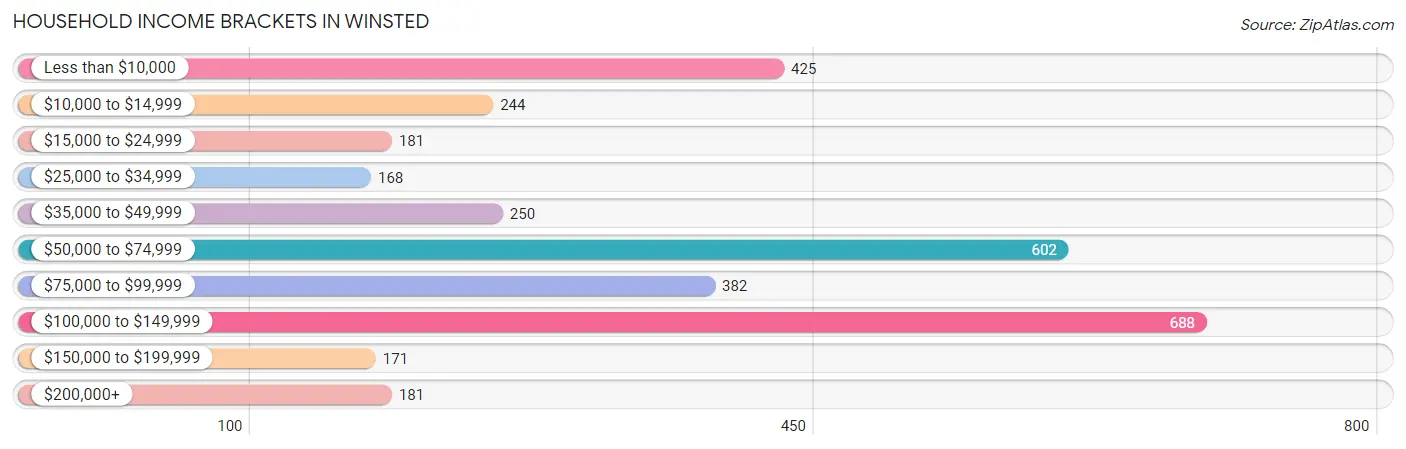
| Income Bracket | # Households | % Households |
| Less than $10,000 | 425 | 12.9% |
| $10,000 to $14,999 | 244 | 7.4% |
| $15,000 to $24,999 | 181 | 5.5% |
| $25,000 to $34,999 | 168 | 5.1% |
| $35,000 to $49,999 | 250 | 7.6% |
| $50,000 to $74,999 | 602 | 18.3% |
| $75,000 to $99,999 | 382 | 11.6% |
| $100,000 to $149,999 | 688 | 20.9% |
| $150,000 to $199,999 | 171 | 5.2% |
| $200,000+ | 181 | 5.5% |
Household Income by Householder Age in Winsted
The median household income in Winsted is $66,250, with the highest median household income of $98,452 found in the 25 to 44 years age bracket for the primary householder. A total of 1,030 households (31.3%) fall into this category. Meanwhile, the 15 to 24 years age bracket for the primary householder has the lowest median household income of $0, with 78 households (2.4%) in this group.
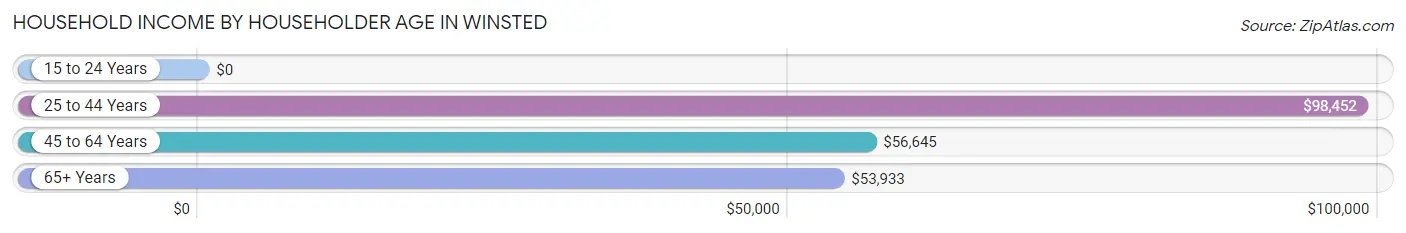
| Income Bracket | # Households | Median Income |
| 15 to 24 Years | 78 (2.4%) | $0 |
| 25 to 44 Years | 1,030 (31.3%) | $98,452 |
| 45 to 64 Years | 1,130 (34.3%) | $56,645 |
| 65+ Years | 1,053 (32.0%) | $53,933 |
| Total | 3,291 (100.0%) | $66,250 |
Poverty in Winsted
Income Below Poverty by Sex and Age in Winsted
With 15.8% poverty level for males and 22.2% for females among the residents of Winsted, 55 to 64 year old males and 18 to 24 year old females are the most vulnerable to poverty, with 242 males (32.9%) and 120 females (54.8%) in their respective age groups living below the poverty level.
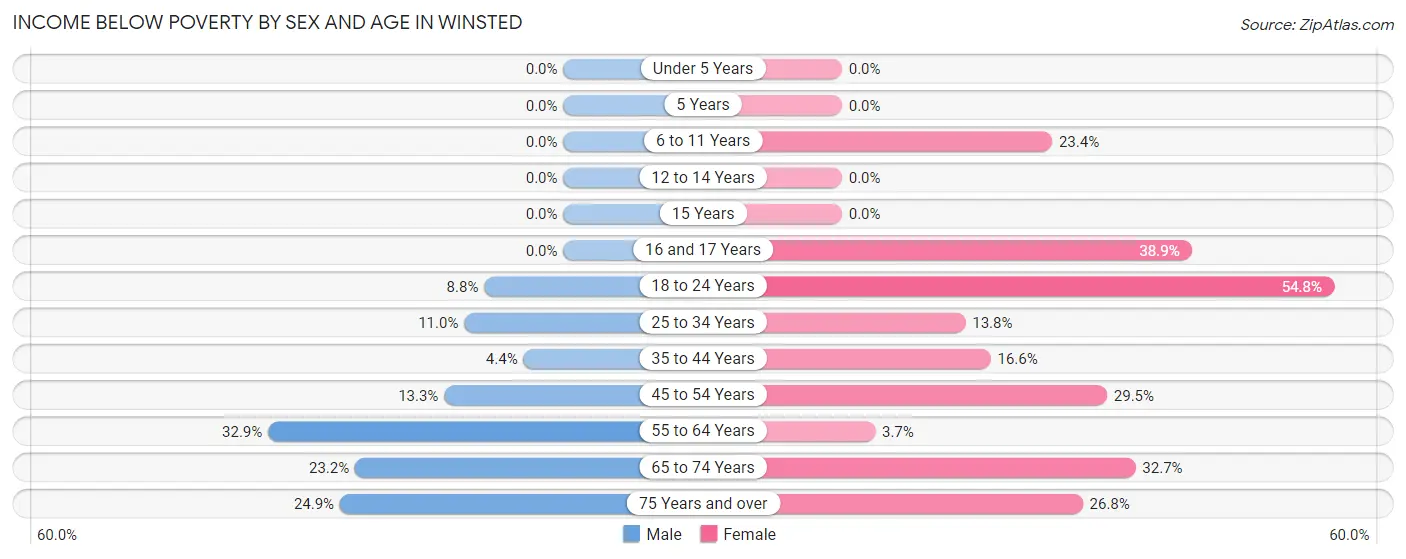
| Age Bracket | Male | Female |
| Under 5 Years | 0 (0.0%) | 0 (0.0%) |
| 5 Years | 0 (0.0%) | 0 (0.0%) |
| 6 to 11 Years | 0 (0.0%) | 59 (23.4%) |
| 12 to 14 Years | 0 (0.0%) | 0 (0.0%) |
| 15 Years | 0 (0.0%) | 0 (0.0%) |
| 16 and 17 Years | 0 (0.0%) | 44 (38.9%) |
| 18 to 24 Years | 17 (8.8%) | 120 (54.8%) |
| 25 to 34 Years | 55 (11.0%) | 37 (13.8%) |
| 35 to 44 Years | 22 (4.4%) | 120 (16.6%) |
| 45 to 54 Years | 43 (13.3%) | 80 (29.5%) |
| 55 to 64 Years | 242 (32.9%) | 17 (3.7%) |
| 65 to 74 Years | 119 (23.2%) | 154 (32.7%) |
| 75 Years and over | 53 (24.9%) | 81 (26.8%) |
| Total | 551 (15.8%) | 712 (22.2%) |
Income Above Poverty by Sex and Age in Winsted
According to the poverty statistics in Winsted, males aged under 5 years and females aged under 5 years are the age groups that are most secure financially, with 100.0% of males and 100.0% of females in these age groups living above the poverty line.
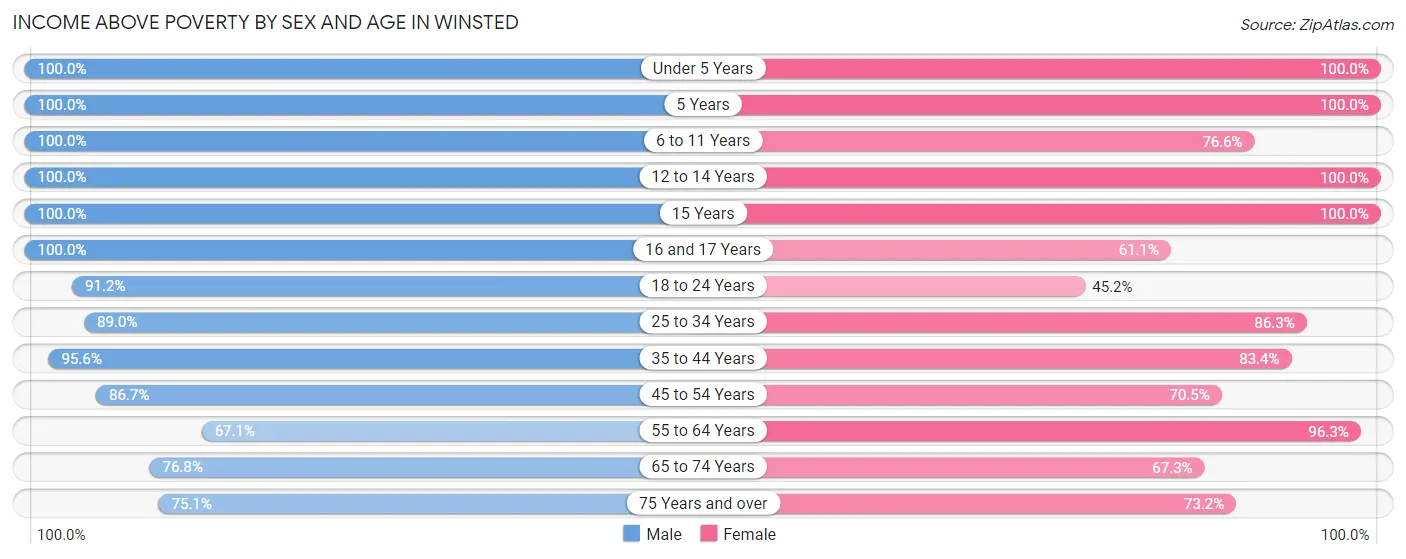
| Age Bracket | Male | Female |
| Under 5 Years | 130 (100.0%) | 27 (100.0%) |
| 5 Years | 81 (100.0%) | 14 (100.0%) |
| 6 to 11 Years | 212 (100.0%) | 193 (76.6%) |
| 12 to 14 Years | 14 (100.0%) | 51 (100.0%) |
| 15 Years | 67 (100.0%) | 42 (100.0%) |
| 16 and 17 Years | 13 (100.0%) | 69 (61.1%) |
| 18 to 24 Years | 176 (91.2%) | 99 (45.2%) |
| 25 to 34 Years | 443 (89.0%) | 232 (86.3%) |
| 35 to 44 Years | 473 (95.6%) | 604 (83.4%) |
| 45 to 54 Years | 281 (86.7%) | 191 (70.5%) |
| 55 to 64 Years | 494 (67.1%) | 442 (96.3%) |
| 65 to 74 Years | 394 (76.8%) | 317 (67.3%) |
| 75 Years and over | 160 (75.1%) | 221 (73.2%) |
| Total | 2,938 (84.2%) | 2,502 (77.8%) |
Income Below Poverty Among Married-Couple Families in Winsted
The poverty statistics for married-couple families in Winsted show that 9.9% or 126 of the total 1,276 families live below the poverty line. Families with 1 or 2 children have the highest poverty rate of 22.1%, comprising of 68 families. On the other hand, families with 3 or 4 children have the lowest poverty rate of 0.0%, which includes 0 families.
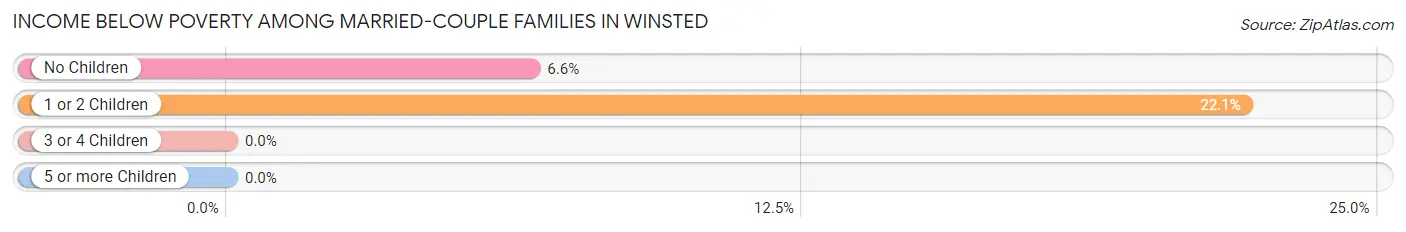
| Children | Above Poverty | Below Poverty |
| No Children | 824 (93.4%) | 58 (6.6%) |
| 1 or 2 Children | 240 (77.9%) | 68 (22.1%) |
| 3 or 4 Children | 86 (100.0%) | 0 (0.0%) |
| 5 or more Children | 0 (0.0%) | 0 (0.0%) |
| Total | 1,150 (90.1%) | 126 (9.9%) |
Income Below Poverty Among Single-Parent Households in Winsted
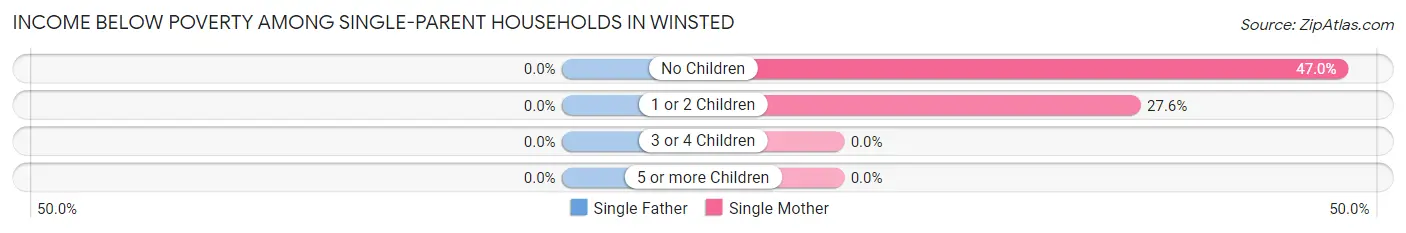
| Children | Single Father | Single Mother |
| No Children | 0 (0.0%) | 47 (47.0%) |
| 1 or 2 Children | 0 (0.0%) | 74 (27.6%) |
| 3 or 4 Children | 0 (0.0%) | 0 (0.0%) |
| 5 or more Children | 0 (0.0%) | 0 (0.0%) |
| Total | 0 (0.0%) | 121 (32.9%) |
Income Below Poverty Among Married-Couple vs Single-Parent Households in Winsted
The poverty data for Winsted shows that 126 of the married-couple family households (9.9%) and 121 of the single-parent households (27.1%) are living below the poverty level. Within the married-couple family households, those with 1 or 2 children have the highest poverty rate, with 68 households (22.1%) falling below the poverty line. Among the single-parent households, those with no children have the highest poverty rate, with 47 household (35.9%) living below poverty.
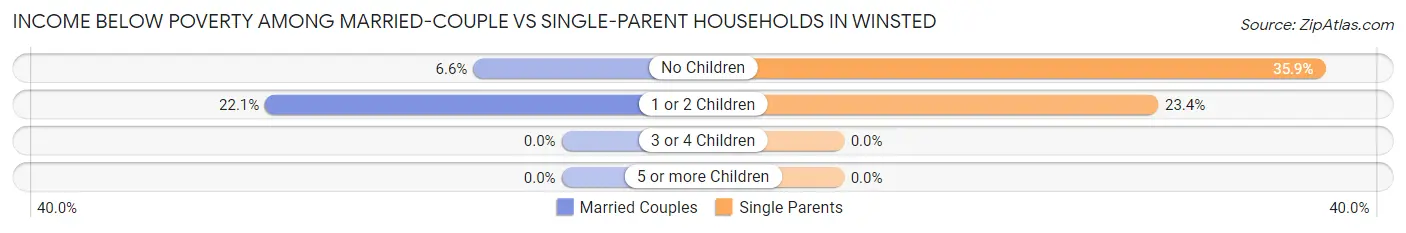
| Children | Married-Couple Families | Single-Parent Households |
| No Children | 58 (6.6%) | 47 (35.9%) |
| 1 or 2 Children | 68 (22.1%) | 74 (23.4%) |
| 3 or 4 Children | 0 (0.0%) | 0 (0.0%) |
| 5 or more Children | 0 (0.0%) | 0 (0.0%) |
| Total | 126 (9.9%) | 121 (27.1%) |
Race in Winsted
The most populous races in Winsted are White / Caucasian (5,617 | 81.6%), Hispanic or Latino (831 | 12.1%), and Two or more Races (541 | 7.9%).
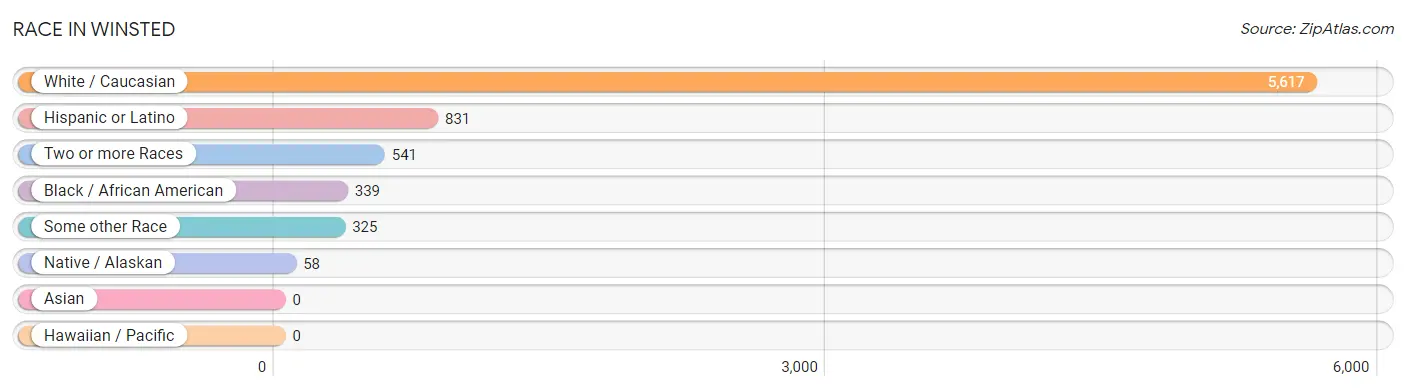
| Race | # Population | % Population |
| Asian | 0 | 0.0% |
| Black / African American | 339 | 4.9% |
| Hawaiian / Pacific | 0 | 0.0% |
| Hispanic or Latino | 831 | 12.1% |
| Native / Alaskan | 58 | 0.8% |
| White / Caucasian | 5,617 | 81.6% |
| Two or more Races | 541 | 7.9% |
| Some other Race | 325 | 4.7% |
| Total | 6,880 | 100.0% |
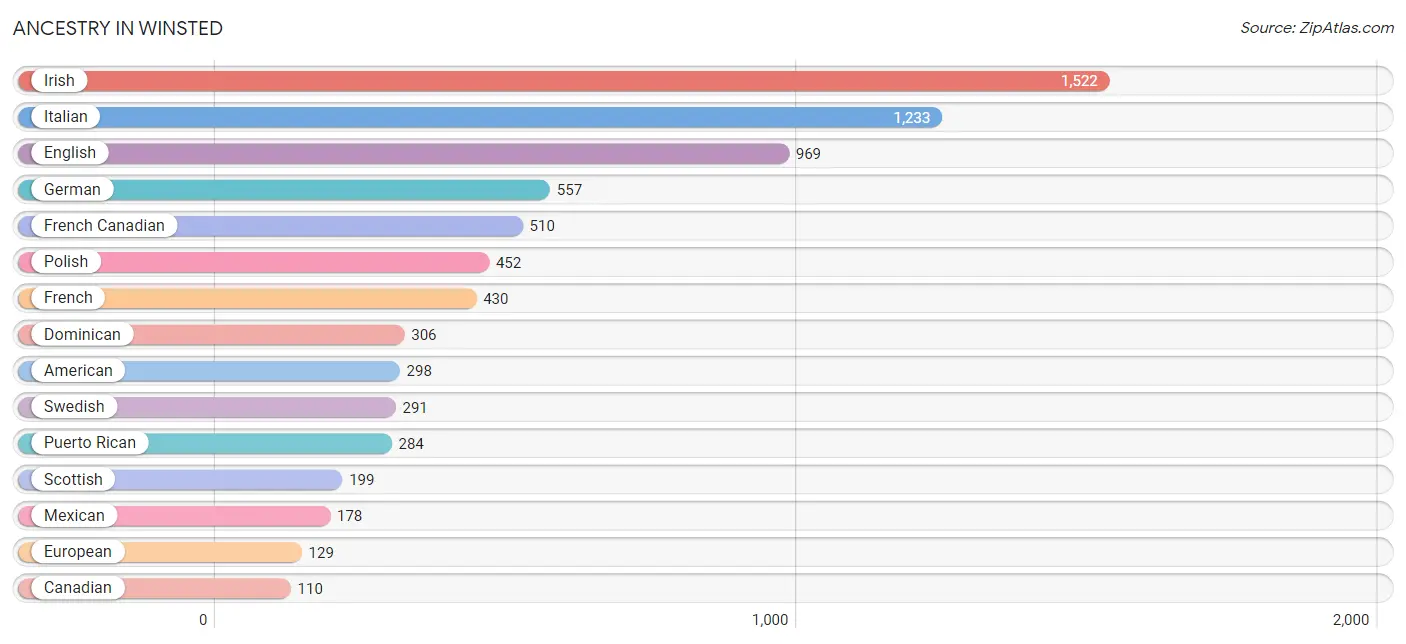
Ancestry in Winsted
The most populous ancestries reported in Winsted are Irish (1,522 | 22.1%), Italian (1,233 | 17.9%), English (969 | 14.1%), German (557 | 8.1%), and French Canadian (510 | 7.4%), together accounting for 69.6% of all Winsted residents.
| Ancestry | # Population | % Population |
| American | 298 | 4.3% |
| Arab | 12 | 0.2% |
| Assyrian / Chaldean / Syriac | 11 | 0.2% |
| Bhutanese | 52 | 0.8% |
| British | 10 | 0.2% |
| Burmese | 37 | 0.5% |
| Canadian | 110 | 1.6% |
| Colombian | 47 | 0.7% |
| Czech | 16 | 0.2% |
| Dominican | 306 | 4.4% |
| Dutch | 16 | 0.2% |
| English | 969 | 14.1% |
| European | 129 | 1.9% |
| French | 430 | 6.2% |
| French Canadian | 510 | 7.4% |
| German | 557 | 8.1% |
| Greek | 94 | 1.4% |
| Hungarian | 37 | 0.5% |
| Irish | 1,522 | 22.1% |
| Italian | 1,233 | 17.9% |
| Korean | 16 | 0.2% |
| Lebanese | 12 | 0.2% |
| Lithuanian | 38 | 0.5% |
| Mexican | 178 | 2.6% |
| Norwegian | 9 | 0.1% |
| Polish | 452 | 6.6% |
| Portuguese | 12 | 0.2% |
| Puerto Rican | 284 | 4.1% |
| Russian | 42 | 0.6% |
| Scandinavian | 14 | 0.2% |
| Scottish | 199 | 2.9% |
| South American | 47 | 0.7% |
| South American Indian | 47 | 0.7% |
| Spanish | 16 | 0.2% |
| Swedish | 291 | 4.2% |
| Swiss | 10 | 0.2% |
| Ukrainian | 14 | 0.2% |
| Welsh | 35 | 0.5% | View All 38 Rows |
Immigrants in Winsted
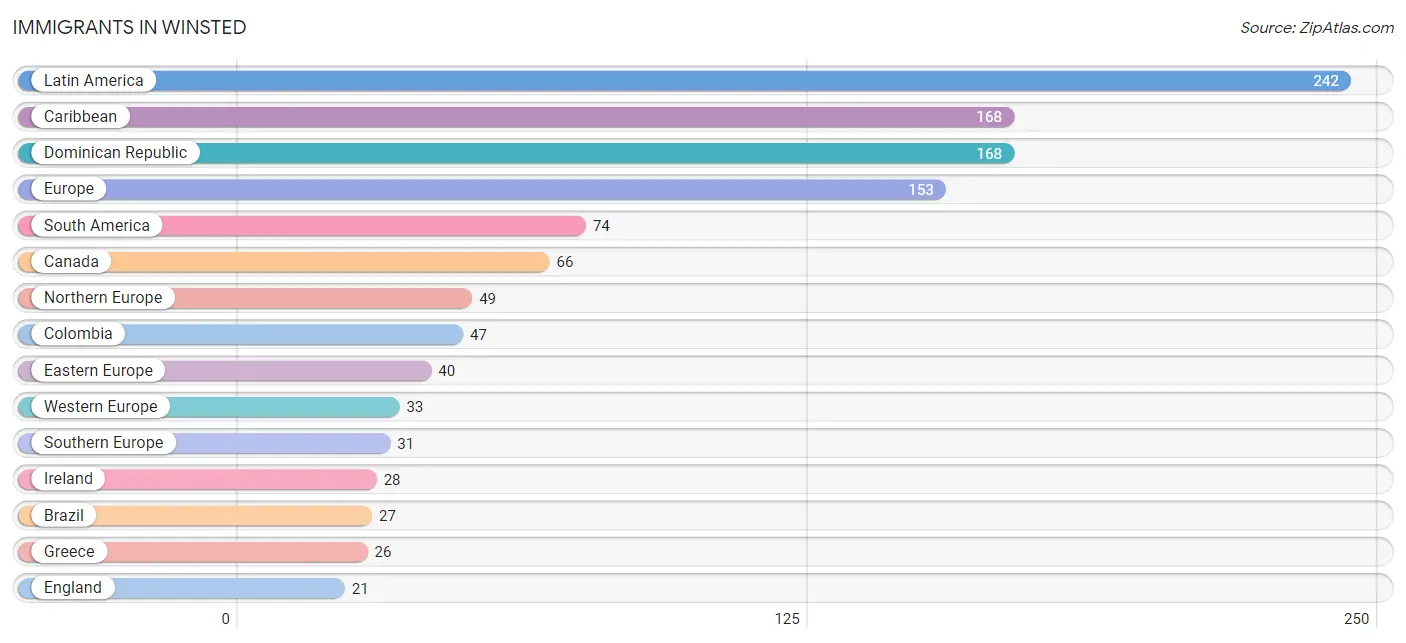
The most numerous immigrant groups reported in Winsted came from Latin America (242 | 3.5%), Caribbean (168 | 2.4%), Dominican Republic (168 | 2.4%), Europe (153 | 2.2%), and South America (74 | 1.1%), together accounting for 11.7% of all Winsted residents.
| Immigration Origin | # Population | % Population |
| Albania | 12 | 0.2% |
| Austria | 15 | 0.2% |
| Belarus | 14 | 0.2% |
| Brazil | 27 | 0.4% |
| Canada | 66 | 1.0% |
| Caribbean | 168 | 2.4% |
| Colombia | 47 | 0.7% |
| Dominican Republic | 168 | 2.4% |
| Eastern Europe | 40 | 0.6% |
| England | 21 | 0.3% |
| Europe | 153 | 2.2% |
| Germany | 18 | 0.3% |
| Greece | 26 | 0.4% |
| Ireland | 28 | 0.4% |
| Italy | 5 | 0.1% |
| Latin America | 242 | 3.5% |
| Northern Europe | 49 | 0.7% |
| South America | 74 | 1.1% |
| Southern Europe | 31 | 0.4% |
| Ukraine | 14 | 0.2% |
| Western Europe | 33 | 0.5% | View All 21 Rows |
Sex and Age in Winsted
Sex and Age in Winsted
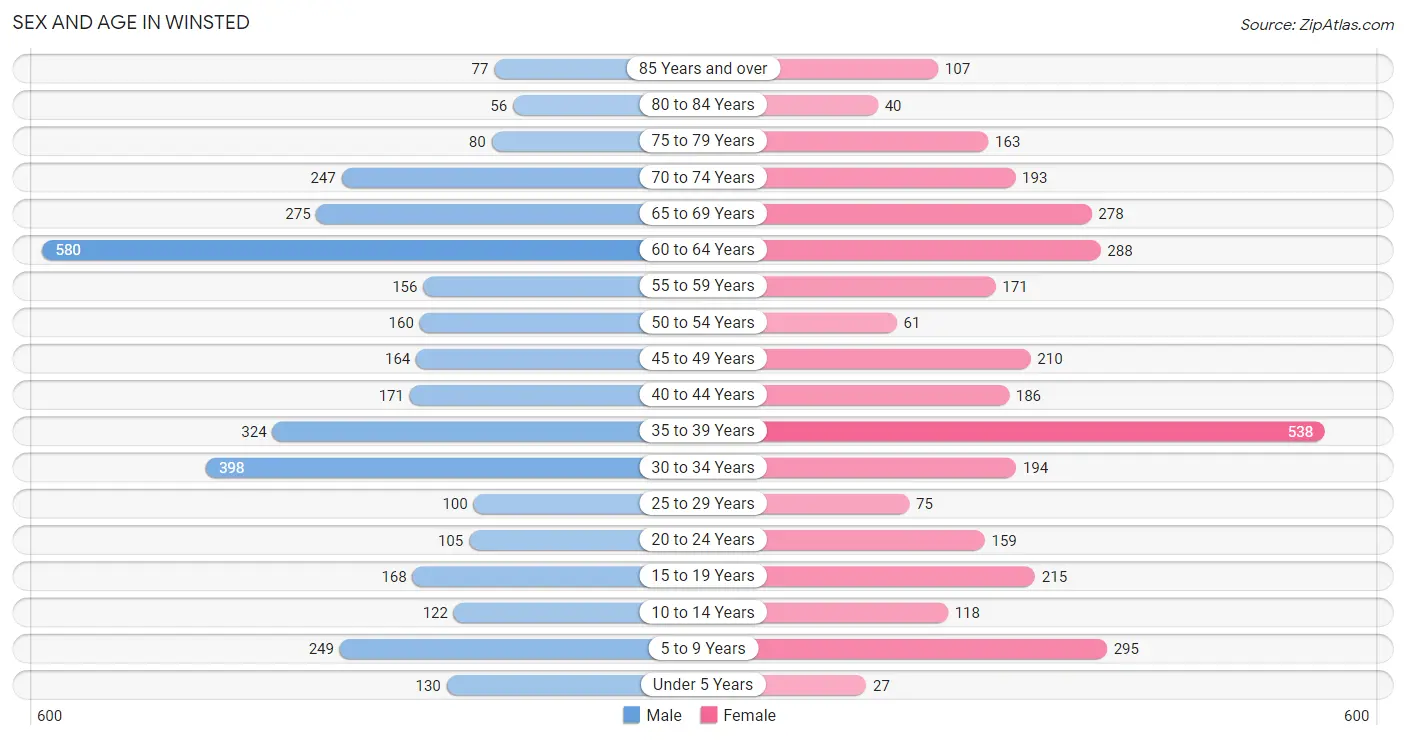
The most populous age groups in Winsted are 60 to 64 Years (580 | 16.3%) for men and 35 to 39 Years (538 | 16.2%) for women.
| Age Bracket | Male | Female |
| Under 5 Years | 130 (3.6%) | 27 (0.8%) |
| 5 to 9 Years | 249 (7.0%) | 295 (8.9%) |
| 10 to 14 Years | 122 (3.4%) | 118 (3.6%) |
| 15 to 19 Years | 168 (4.7%) | 215 (6.5%) |
| 20 to 24 Years | 105 (2.9%) | 159 (4.8%) |
| 25 to 29 Years | 100 (2.8%) | 75 (2.3%) |
| 30 to 34 Years | 398 (11.2%) | 194 (5.9%) |
| 35 to 39 Years | 324 (9.1%) | 538 (16.2%) |
| 40 to 44 Years | 171 (4.8%) | 186 (5.6%) |
| 45 to 49 Years | 164 (4.6%) | 210 (6.3%) |
| 50 to 54 Years | 160 (4.5%) | 61 (1.8%) |
| 55 to 59 Years | 156 (4.4%) | 171 (5.1%) |
| 60 to 64 Years | 580 (16.3%) | 288 (8.7%) |
| 65 to 69 Years | 275 (7.7%) | 278 (8.4%) |
| 70 to 74 Years | 247 (6.9%) | 193 (5.8%) |
| 75 to 79 Years | 80 (2.2%) | 163 (4.9%) |
| 80 to 84 Years | 56 (1.6%) | 40 (1.2%) |
| 85 Years and over | 77 (2.2%) | 107 (3.2%) |
| Total | 3,562 (100.0%) | 3,318 (100.0%) |
Families and Households in Winsted
Median Family Size in Winsted
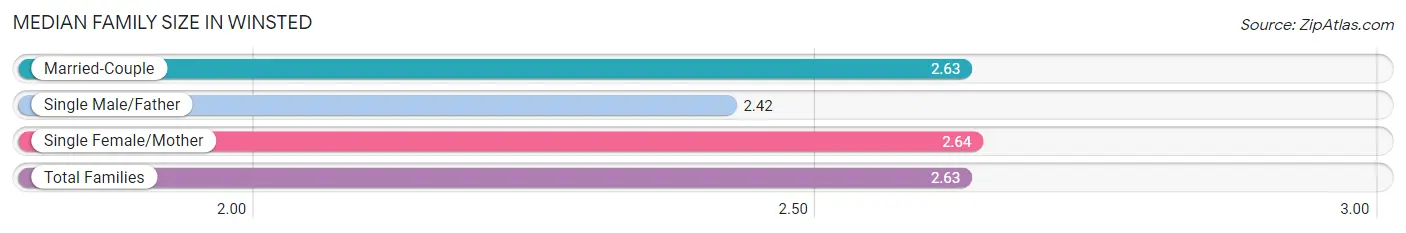
The median family size in Winsted is 2.63 persons per family, with single female/mother families (368 | 21.4%) accounting for the largest median family size of 2.64 persons per family. On the other hand, single male/father families (79 | 4.6%) represent the smallest median family size with 2.42 persons per family.
| Family Type | # Families | Family Size |
| Married-Couple | 1,276 (74.1%) | 2.63 |
| Single Male/Father | 79 (4.6%) | 2.42 |
| Single Female/Mother | 368 (21.4%) | 2.64 |
| Total Families | 1,723 (100.0%) | 2.63 |
Median Household Size in Winsted
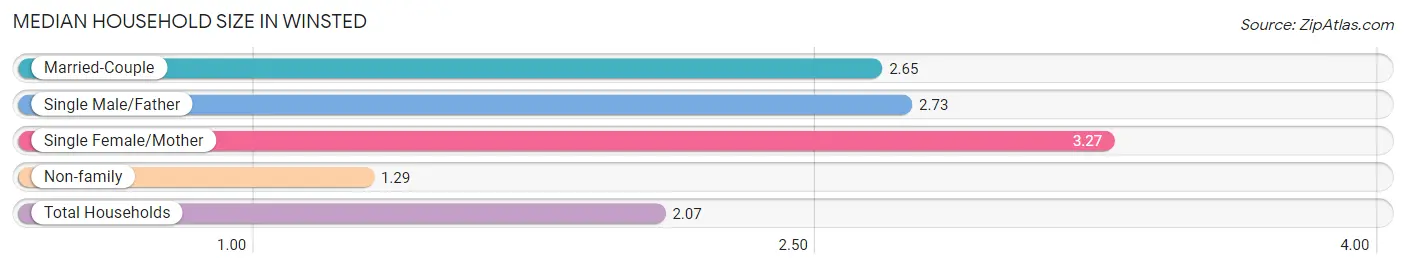
The median household size in Winsted is 2.07 persons per household, with single female/mother households (368 | 11.2%) accounting for the largest median household size of 3.27 persons per household. non-family households (1,568 | 47.6%) represent the smallest median household size with 1.29 persons per household.
| Household Type | # Households | Household Size |
| Married-Couple | 1,276 (38.8%) | 2.65 |
| Single Male/Father | 79 (2.4%) | 2.73 |
| Single Female/Mother | 368 (11.2%) | 3.27 |
| Non-family | 1,568 (47.6%) | 1.29 |
| Total Households | 3,291 (100.0%) | 2.07 |
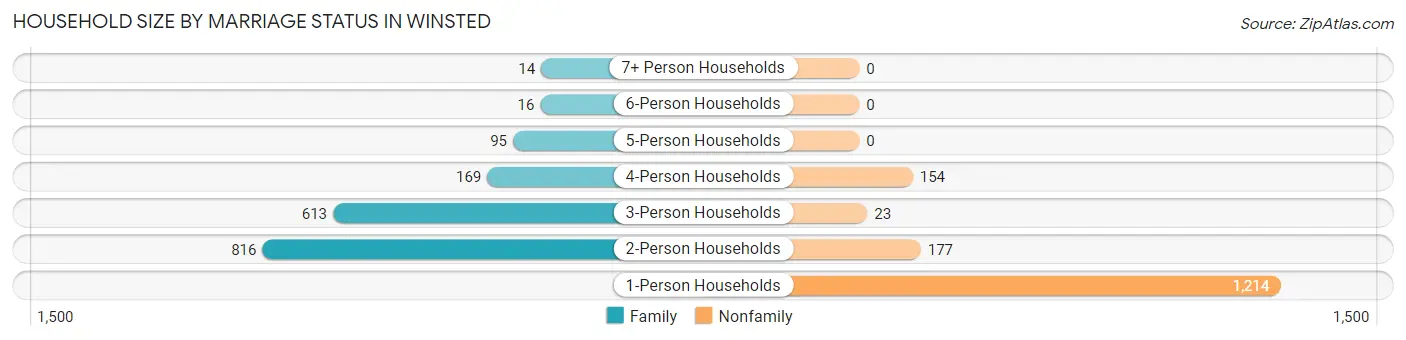
Household Size by Marriage Status in Winsted
Out of a total of 3,291 households in Winsted, 1,723 (52.3%) are family households, while 1,568 (47.6%) are nonfamily households. The most numerous type of family households are 2-person households, comprising 816, and the most common type of nonfamily households are 1-person households, comprising 1,214.
| Household Size | Family Households | Nonfamily Households |
| 1-Person Households | - | 1,214 (36.9%) |
| 2-Person Households | 816 (24.8%) | 177 (5.4%) |
| 3-Person Households | 613 (18.6%) | 23 (0.7%) |
| 4-Person Households | 169 (5.1%) | 154 (4.7%) |
| 5-Person Households | 95 (2.9%) | 0 (0.0%) |
| 6-Person Households | 16 (0.5%) | 0 (0.0%) |
| 7+ Person Households | 14 (0.4%) | 0 (0.0%) |
| Total | 1,723 (52.3%) | 1,568 (47.6%) |
Female Fertility in Winsted
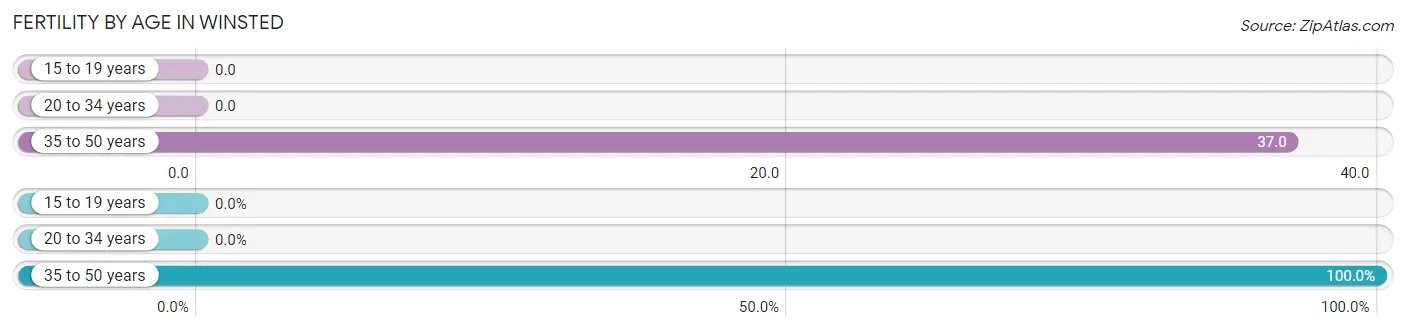
Fertility by Age in Winsted
Average fertility rate in Winsted is 22.0 births per 1,000 women. Women in the age bracket of 35 to 50 years have the highest fertility rate with 37.0 births per 1,000 women. Women in the age bracket of 35 to 50 years acount for 100.0% of all women with births.
| Age Bracket | Women with Births | Births / 1,000 Women |
| 15 to 19 years | 0 (0.0%) | 0.0 |
| 20 to 34 years | 0 (0.0%) | 0.0 |
| 35 to 50 years | 35 (100.0%) | 37.0 |
| Total | 35 (100.0%) | 22.0 |
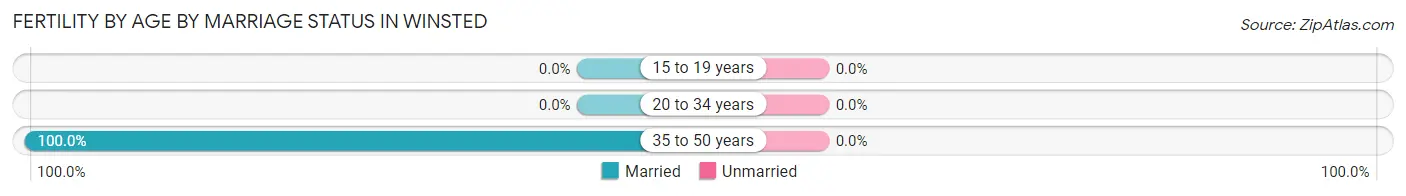
Fertility by Age by Marriage Status in Winsted
| Age Bracket | Married | Unmarried |
| 15 to 19 years | 0 (0.0%) | 0 (0.0%) |
| 20 to 34 years | 0 (0.0%) | 0 (0.0%) |
| 35 to 50 years | 35 (100.0%) | 0 (0.0%) |
| Total | 35 (100.0%) | 0 (0.0%) |
Fertility by Education in Winsted
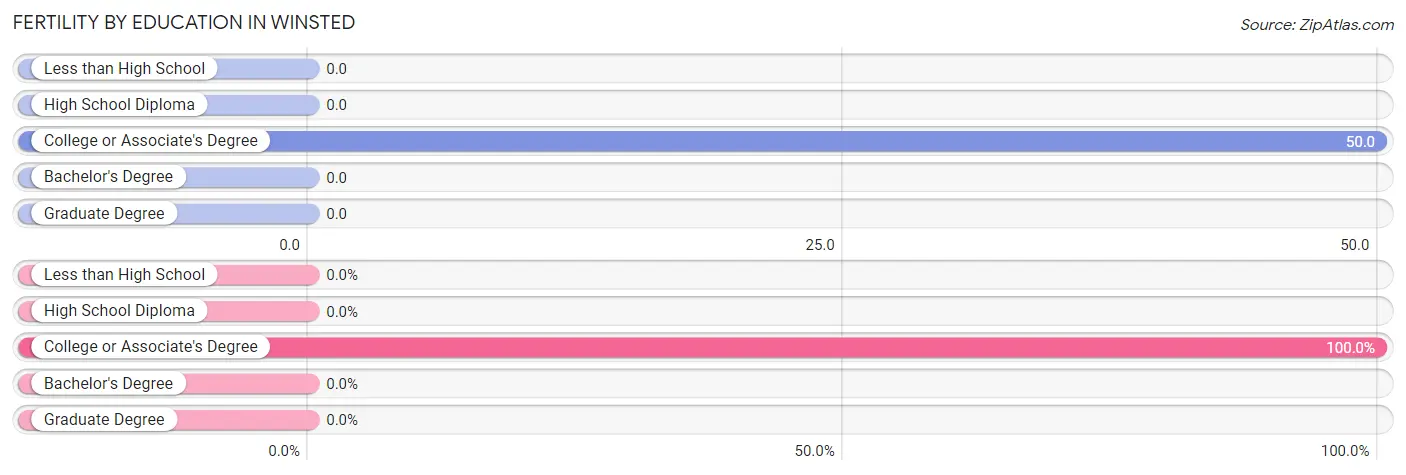
| Educational Attainment | Women with Births | Births / 1,000 Women |
| Less than High School | 0 (0.0%) | 0.0 |
| High School Diploma | 0 (0.0%) | 0.0 |
| College or Associate's Degree | 35 (100.0%) | 50.0 |
| Bachelor's Degree | 0 (0.0%) | 0.0 |
| Graduate Degree | 0 (0.0%) | 0.0 |
| Total | 35 (100.0%) | 22.0 |
Fertility by Education by Marriage Status in Winsted
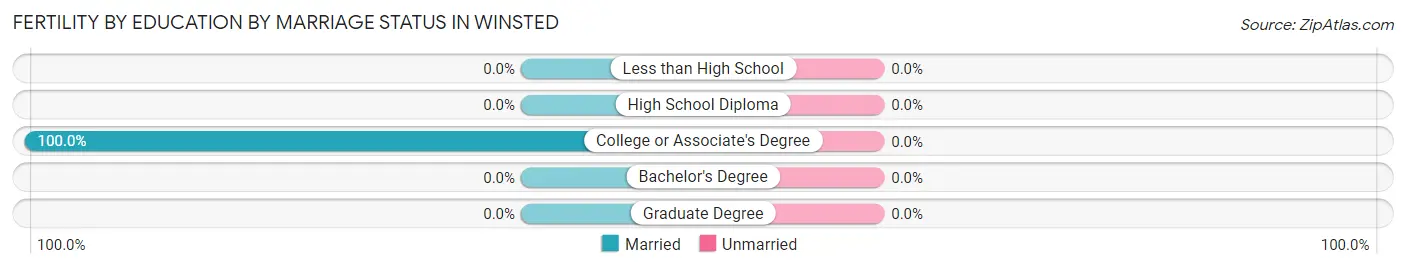
| Educational Attainment | Married | Unmarried |
| Less than High School | 0 (0.0%) | 0 (0.0%) |
| High School Diploma | 0 (0.0%) | 0 (0.0%) |
| College or Associate's Degree | 35 (100.0%) | 0 (0.0%) |
| Bachelor's Degree | 0 (0.0%) | 0 (0.0%) |
| Graduate Degree | 0 (0.0%) | 0 (0.0%) |
| Total | 35 (100.0%) | 0 (0.0%) |
Employment Characteristics in Winsted
Employment by Class of Employer in Winsted
Among the 3,402 employed individuals in Winsted, private company employees (2,697 | 79.3%), not-for-profit organizations (187 | 5.5%), and local government employees (172 | 5.1%) make up the most common classes of employment.
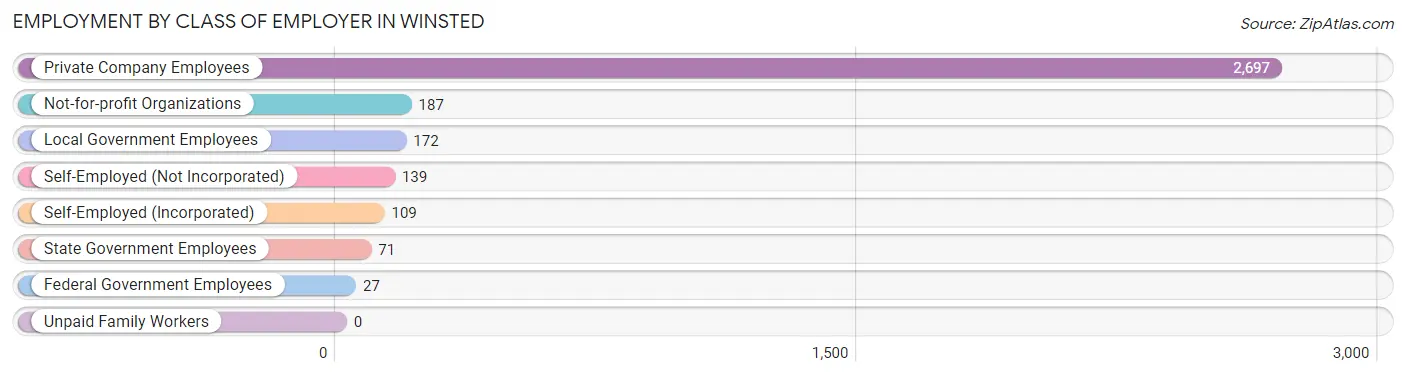
| Employer Class | # Employees | % Employees |
| Private Company Employees | 2,697 | 79.3% |
| Self-Employed (Incorporated) | 109 | 3.2% |
| Self-Employed (Not Incorporated) | 139 | 4.1% |
| Not-for-profit Organizations | 187 | 5.5% |
| Local Government Employees | 172 | 5.1% |
| State Government Employees | 71 | 2.1% |
| Federal Government Employees | 27 | 0.8% |
| Unpaid Family Workers | 0 | 0.0% |
| Total | 3,402 | 100.0% |
Employment Status by Age in Winsted
According to the labor force statistics for Winsted, out of the total population over 16 years of age (5,830), 64.1% or 3,737 individuals are in the labor force, with 6.3% or 235 of them unemployed. The age group with the highest labor force participation rate is 20 to 24 years, with 100.0% or 264 individuals in the labor force. Within the labor force, the 60 to 64 years age range has the highest percentage of unemployed individuals, with 16.6% or 54 of them being unemployed.
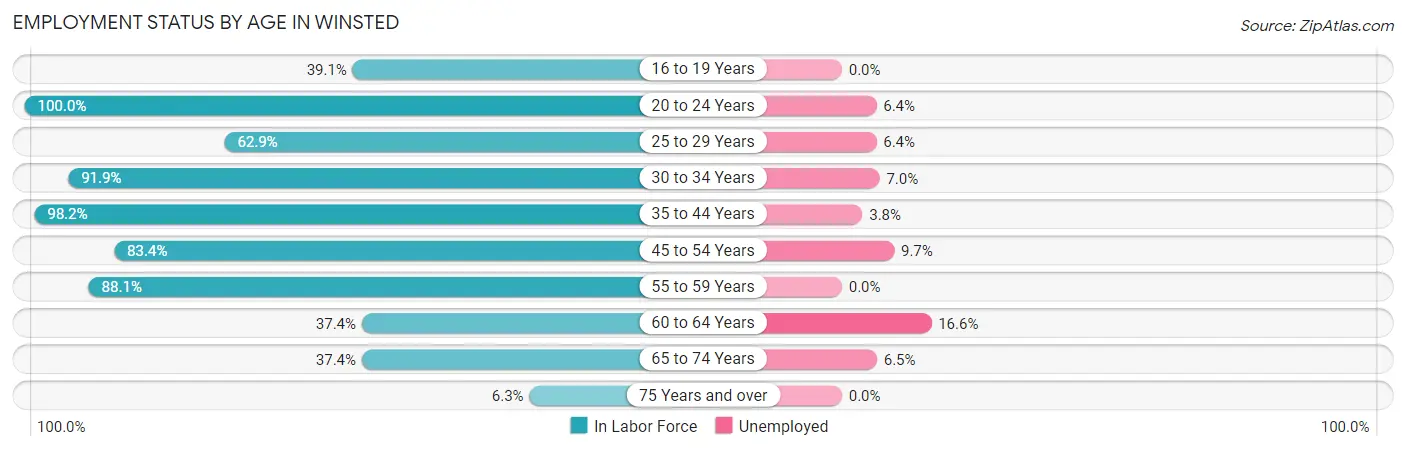
| Age Bracket | In Labor Force | Unemployed |
| 16 to 19 Years | 107 (39.1%) | 0 (0.0%) |
| 20 to 24 Years | 264 (100.0%) | 17 (6.4%) |
| 25 to 29 Years | 110 (62.9%) | 7 (6.4%) |
| 30 to 34 Years | 544 (91.9%) | 38 (7.0%) |
| 35 to 44 Years | 1,197 (98.2%) | 45 (3.8%) |
| 45 to 54 Years | 496 (83.4%) | 48 (9.7%) |
| 55 to 59 Years | 288 (88.1%) | 0 (0.0%) |
| 60 to 64 Years | 325 (37.4%) | 54 (16.6%) |
| 65 to 74 Years | 371 (37.4%) | 24 (6.5%) |
| 75 Years and over | 33 (6.3%) | 0 (0.0%) |
| Total | 3,737 (64.1%) | 235 (6.3%) |
Employment Status by Educational Attainment in Winsted
According to labor force statistics for Winsted, 78.4% of individuals (2,960) out of the total population between 25 and 64 years of age (3,776) are in the labor force, with 6.5% or 192 of them being unemployed. The group with the highest labor force participation rate are those with the educational attainment of bachelor's degree or higher, with 95.2% or 641 individuals in the labor force. Within the labor force, individuals with less than high school education have the highest percentage of unemployment, with 39.7% or 29 of them being unemployed.
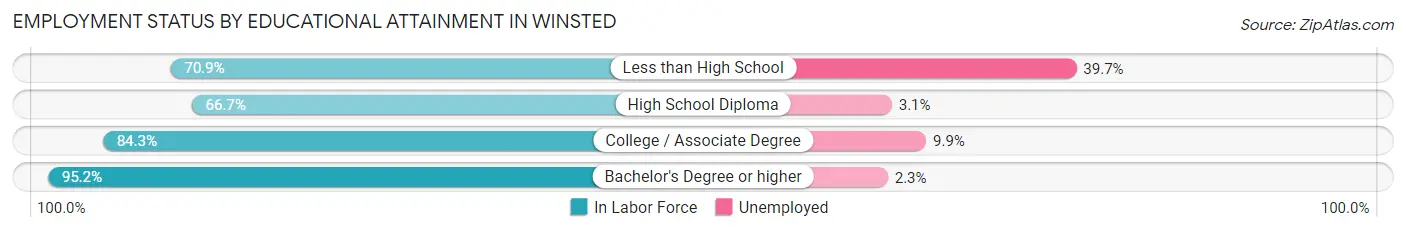
| Educational Attainment | In Labor Force | Unemployed |
| Less than High School | 73 (70.9%) | 41 (39.7%) |
| High School Diploma | 1,071 (66.7%) | 50 (3.1%) |
| College / Associate Degree | 1,176 (84.3%) | 138 (9.9%) |
| Bachelor's Degree or higher | 641 (95.2%) | 15 (2.3%) |
| Total | 2,960 (78.4%) | 245 (6.5%) |
Employment Occupations by Sex in Winsted
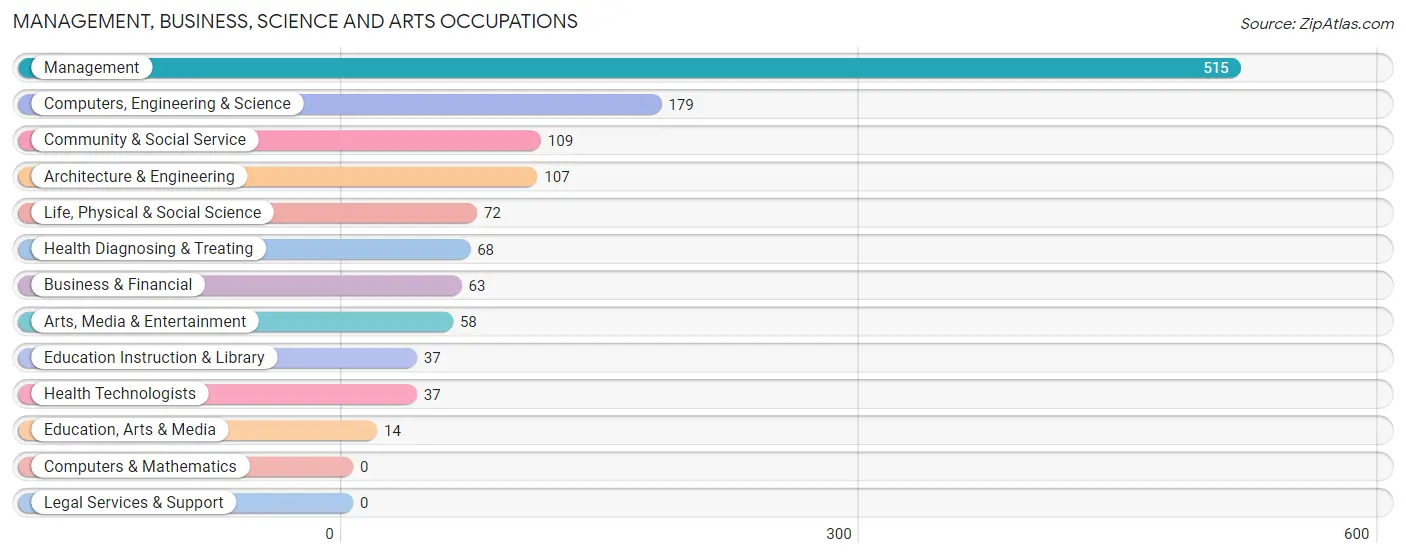
Management, Business, Science and Arts Occupations
The most common Management, Business, Science and Arts occupations in Winsted are Management (515 | 14.7%), Computers, Engineering & Science (179 | 5.1%), Community & Social Service (109 | 3.1%), Architecture & Engineering (107 | 3.1%), and Life, Physical & Social Science (72 | 2.1%).
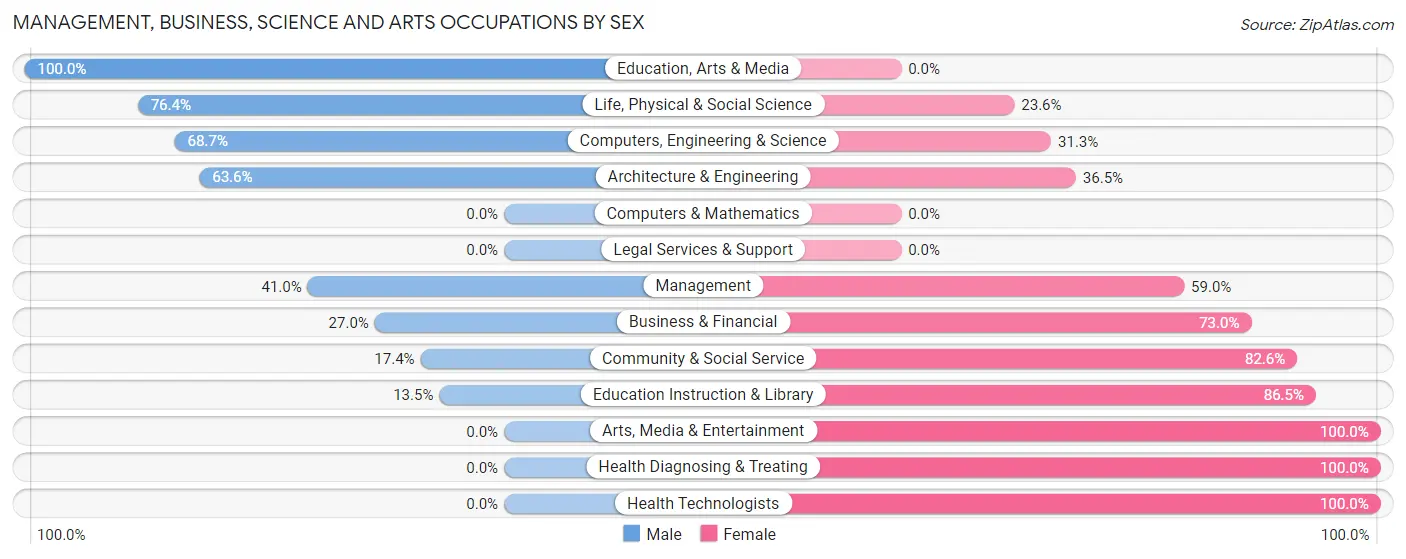
Management, Business, Science and Arts Occupations by Sex
Within the Management, Business, Science and Arts occupations in Winsted, the most male-oriented occupations are Education, Arts & Media (100.0%), Life, Physical & Social Science (76.4%), and Computers, Engineering & Science (68.7%), while the most female-oriented occupations are Arts, Media & Entertainment (100.0%), Health Diagnosing & Treating (100.0%), and Health Technologists (100.0%).
| Occupation | Male | Female |
| Management | 211 (41.0%) | 304 (59.0%) |
| Business & Financial | 17 (27.0%) | 46 (73.0%) |
| Computers, Engineering & Science | 123 (68.7%) | 56 (31.3%) |
| Computers & Mathematics | 0 (0.0%) | 0 (0.0%) |
| Architecture & Engineering | 68 (63.5%) | 39 (36.4%) |
| Life, Physical & Social Science | 55 (76.4%) | 17 (23.6%) |
| Community & Social Service | 19 (17.4%) | 90 (82.6%) |
| Education, Arts & Media | 14 (100.0%) | 0 (0.0%) |
| Legal Services & Support | 0 (0.0%) | 0 (0.0%) |
| Education Instruction & Library | 5 (13.5%) | 32 (86.5%) |
| Arts, Media & Entertainment | 0 (0.0%) | 58 (100.0%) |
| Health Diagnosing & Treating | 0 (0.0%) | 68 (100.0%) |
| Health Technologists | 0 (0.0%) | 37 (100.0%) |
| Total (Category) | 370 (39.6%) | 564 (60.4%) |
| Total (Overall) | 1,639 (46.8%) | 1,862 (53.2%) |
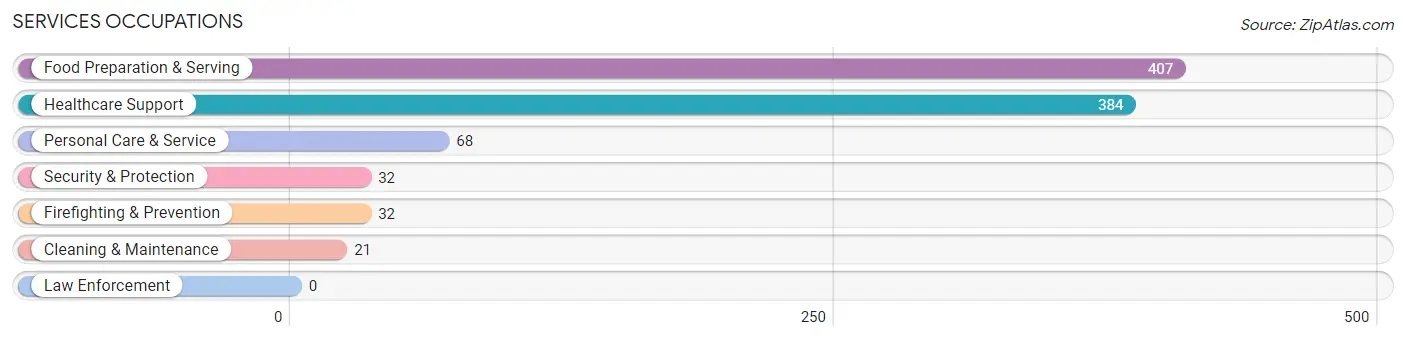
Services Occupations
The most common Services occupations in Winsted are Food Preparation & Serving (407 | 11.6%), Healthcare Support (384 | 11.0%), Personal Care & Service (68 | 1.9%), Security & Protection (32 | 0.9%), and Firefighting & Prevention (32 | 0.9%).
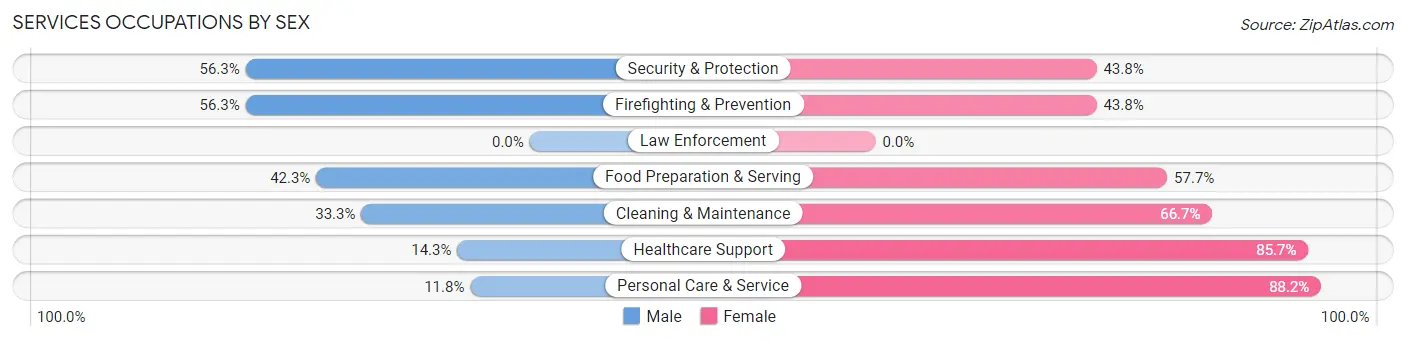
Services Occupations by Sex
Within the Services occupations in Winsted, the most male-oriented occupations are Security & Protection (56.2%), Firefighting & Prevention (56.2%), and Food Preparation & Serving (42.3%), while the most female-oriented occupations are Personal Care & Service (88.2%), Healthcare Support (85.7%), and Cleaning & Maintenance (66.7%).
| Occupation | Male | Female |
| Healthcare Support | 55 (14.3%) | 329 (85.7%) |
| Security & Protection | 18 (56.2%) | 14 (43.8%) |
| Firefighting & Prevention | 18 (56.2%) | 14 (43.8%) |
| Law Enforcement | 0 (0.0%) | 0 (0.0%) |
| Food Preparation & Serving | 172 (42.3%) | 235 (57.7%) |
| Cleaning & Maintenance | 7 (33.3%) | 14 (66.7%) |
| Personal Care & Service | 8 (11.8%) | 60 (88.2%) |
| Total (Category) | 260 (28.5%) | 652 (71.5%) |
| Total (Overall) | 1,639 (46.8%) | 1,862 (53.2%) |
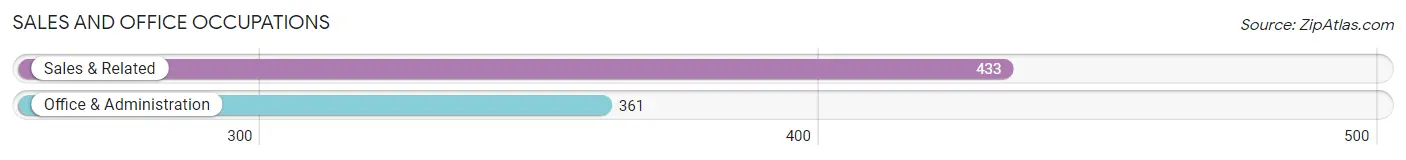
Sales and Office Occupations
The most common Sales and Office occupations in Winsted are Sales & Related (433 | 12.4%), and Office & Administration (361 | 10.3%).
Sales and Office Occupations by Sex
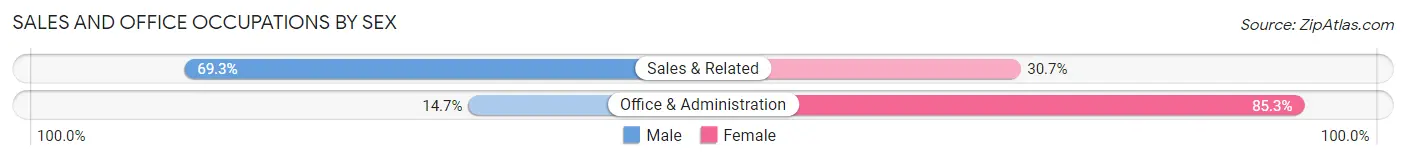
| Occupation | Male | Female |
| Sales & Related | 300 (69.3%) | 133 (30.7%) |
| Office & Administration | 53 (14.7%) | 308 (85.3%) |
| Total (Category) | 353 (44.5%) | 441 (55.5%) |
| Total (Overall) | 1,639 (46.8%) | 1,862 (53.2%) |
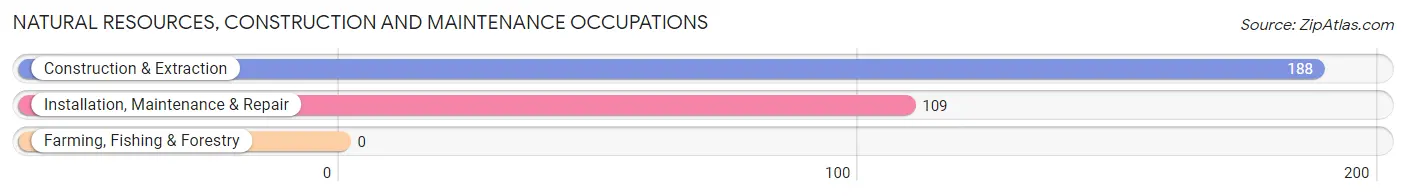
Natural Resources, Construction and Maintenance Occupations
The most common Natural Resources, Construction and Maintenance occupations in Winsted are Construction & Extraction (188 | 5.4%), and Installation, Maintenance & Repair (109 | 3.1%).
Natural Resources, Construction and Maintenance Occupations by Sex
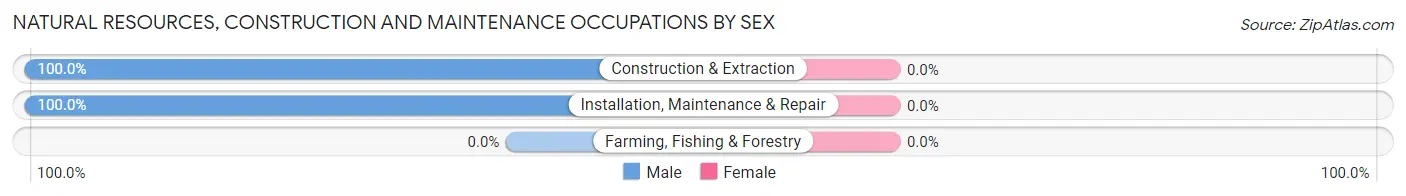
| Occupation | Male | Female |
| Farming, Fishing & Forestry | 0 (0.0%) | 0 (0.0%) |
| Construction & Extraction | 188 (100.0%) | 0 (0.0%) |
| Installation, Maintenance & Repair | 109 (100.0%) | 0 (0.0%) |
| Total (Category) | 297 (100.0%) | 0 (0.0%) |
| Total (Overall) | 1,639 (46.8%) | 1,862 (53.2%) |
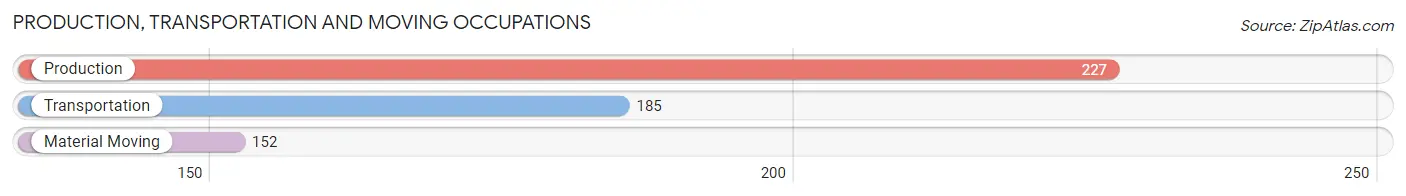
Production, Transportation and Moving Occupations
The most common Production, Transportation and Moving occupations in Winsted are Production (227 | 6.5%), Transportation (185 | 5.3%), and Material Moving (152 | 4.3%).
Production, Transportation and Moving Occupations by Sex
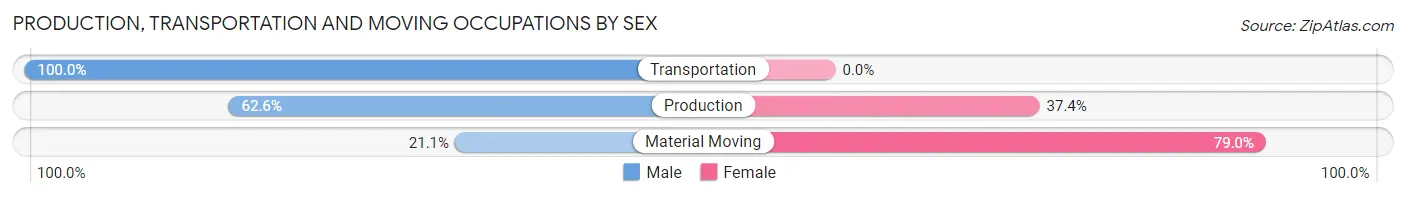
| Occupation | Male | Female |
| Production | 142 (62.6%) | 85 (37.4%) |
| Transportation | 185 (100.0%) | 0 (0.0%) |
| Material Moving | 32 (21.0%) | 120 (78.9%) |
| Total (Category) | 359 (63.6%) | 205 (36.3%) |
| Total (Overall) | 1,639 (46.8%) | 1,862 (53.2%) |
Employment Industries by Sex in Winsted
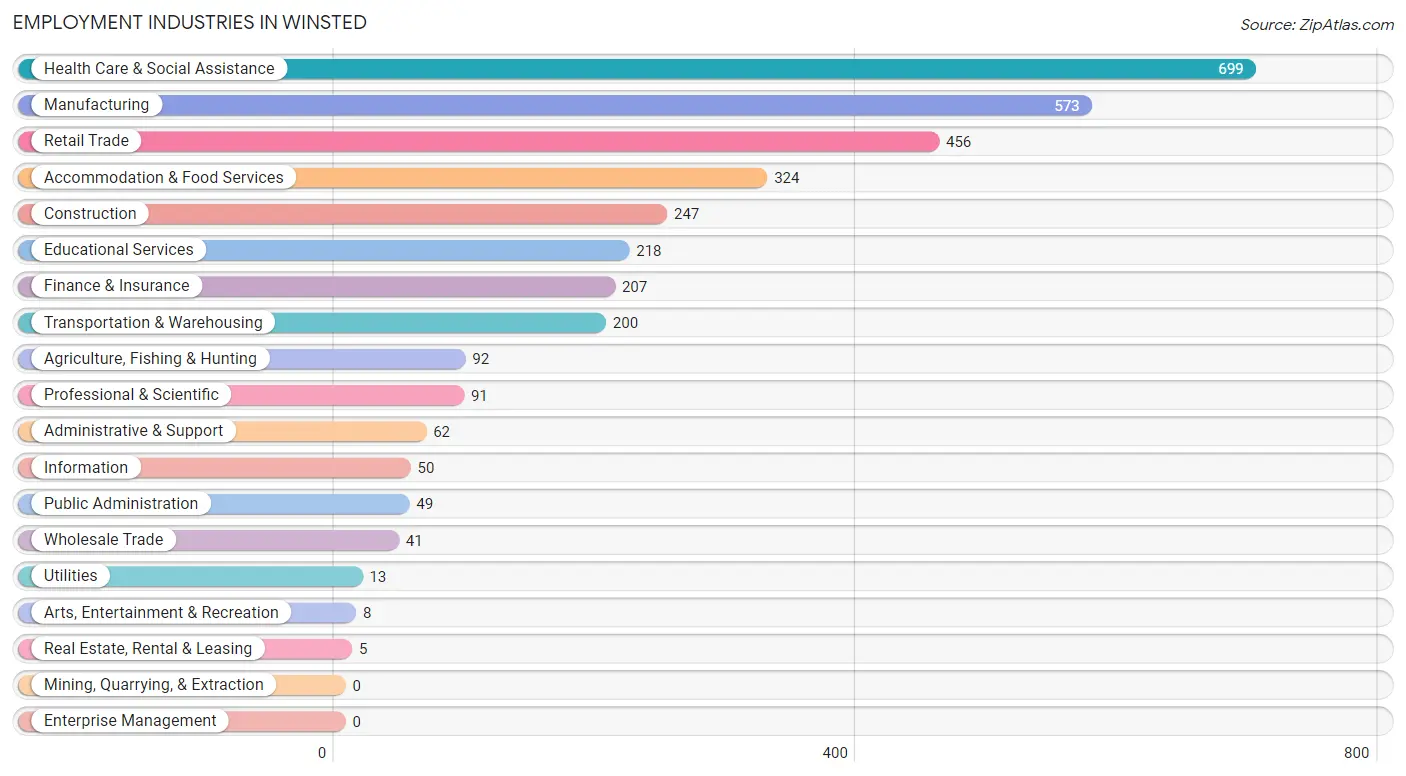
Employment Industries in Winsted
The major employment industries in Winsted include Health Care & Social Assistance (699 | 20.0%), Manufacturing (573 | 16.4%), Retail Trade (456 | 13.0%), Accommodation & Food Services (324 | 9.2%), and Construction (247 | 7.1%).
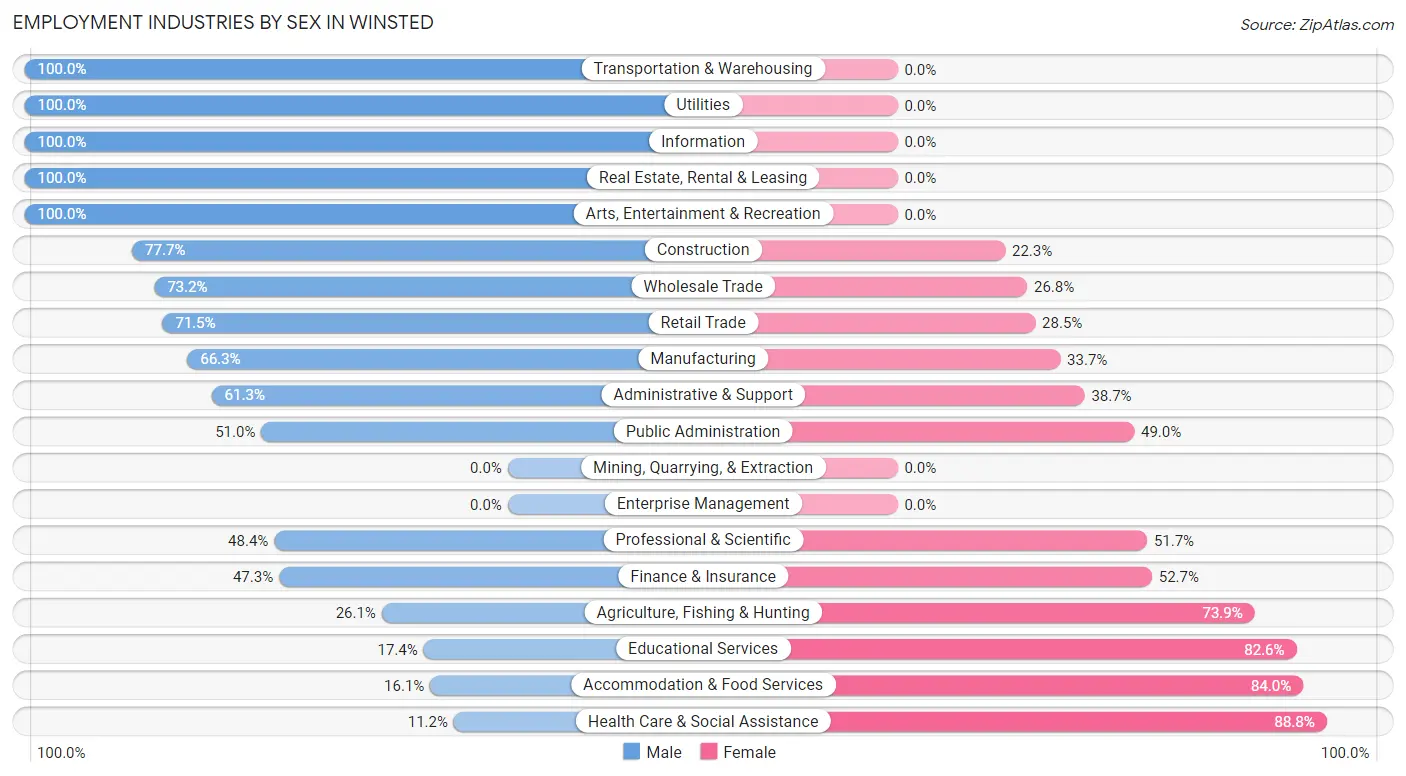
Employment Industries by Sex in Winsted
The Winsted industries that see more men than women are Transportation & Warehousing (100.0%), Utilities (100.0%), and Information (100.0%), whereas the industries that tend to have a higher number of women are Health Care & Social Assistance (88.8%), Accommodation & Food Services (84.0%), and Educational Services (82.6%).
| Industry | Male | Female |
| Agriculture, Fishing & Hunting | 24 (26.1%) | 68 (73.9%) |
| Mining, Quarrying, & Extraction | 0 (0.0%) | 0 (0.0%) |
| Construction | 192 (77.7%) | 55 (22.3%) |
| Manufacturing | 380 (66.3%) | 193 (33.7%) |
| Wholesale Trade | 30 (73.2%) | 11 (26.8%) |
| Retail Trade | 326 (71.5%) | 130 (28.5%) |
| Transportation & Warehousing | 200 (100.0%) | 0 (0.0%) |
| Utilities | 13 (100.0%) | 0 (0.0%) |
| Information | 50 (100.0%) | 0 (0.0%) |
| Finance & Insurance | 98 (47.3%) | 109 (52.7%) |
| Real Estate, Rental & Leasing | 5 (100.0%) | 0 (0.0%) |
| Professional & Scientific | 44 (48.3%) | 47 (51.6%) |
| Enterprise Management | 0 (0.0%) | 0 (0.0%) |
| Administrative & Support | 38 (61.3%) | 24 (38.7%) |
| Educational Services | 38 (17.4%) | 180 (82.6%) |
| Health Care & Social Assistance | 78 (11.2%) | 621 (88.8%) |
| Arts, Entertainment & Recreation | 8 (100.0%) | 0 (0.0%) |
| Accommodation & Food Services | 52 (16.1%) | 272 (84.0%) |
| Public Administration | 25 (51.0%) | 24 (49.0%) |
| Total | 1,639 (46.8%) | 1,862 (53.2%) |
Education in Winsted
School Enrollment in Winsted
The most common levels of schooling among the 1,546 students in Winsted are elementary school (388 | 25.1%), high school (324 | 21.0%), and college / undergraduate (271 | 17.5%).
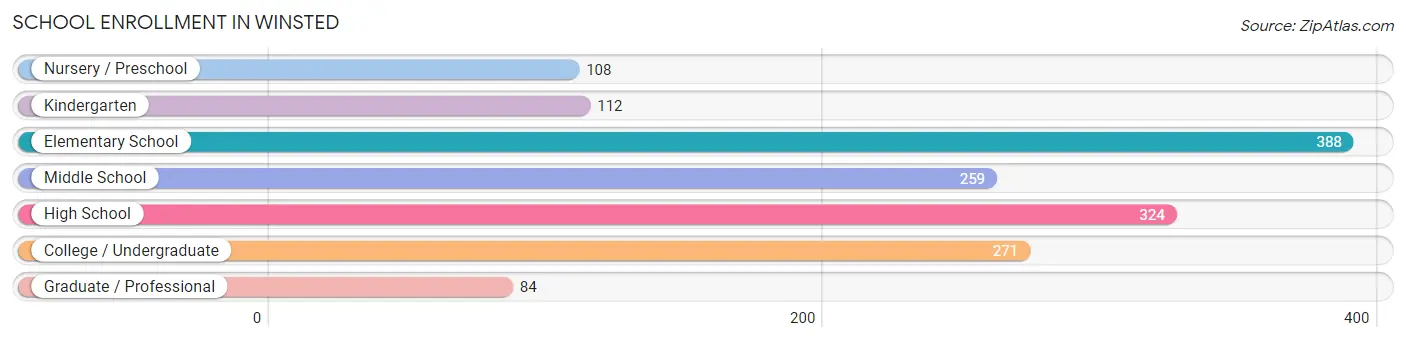
| School Level | # Students | % Students |
| Nursery / Preschool | 108 | 7.0% |
| Kindergarten | 112 | 7.2% |
| Elementary School | 388 | 25.1% |
| Middle School | 259 | 16.8% |
| High School | 324 | 21.0% |
| College / Undergraduate | 271 | 17.5% |
| Graduate / Professional | 84 | 5.4% |
| Total | 1,546 | 100.0% |
School Enrollment by Age by Funding Source in Winsted
Out of a total of 1,546 students who are enrolled in schools in Winsted, 144 (9.3%) attend a private institution, while the remaining 1,402 (90.7%) are enrolled in public schools. The age group of 3 to 4 year olds has the highest likelihood of being enrolled in private schools, with 52 (54.7% in the age bracket) enrolled. Conversely, the age group of 18 to 19 year olds has the lowest likelihood of being enrolled in a private school, with 148 (100.0% in the age bracket) attending a public institution.
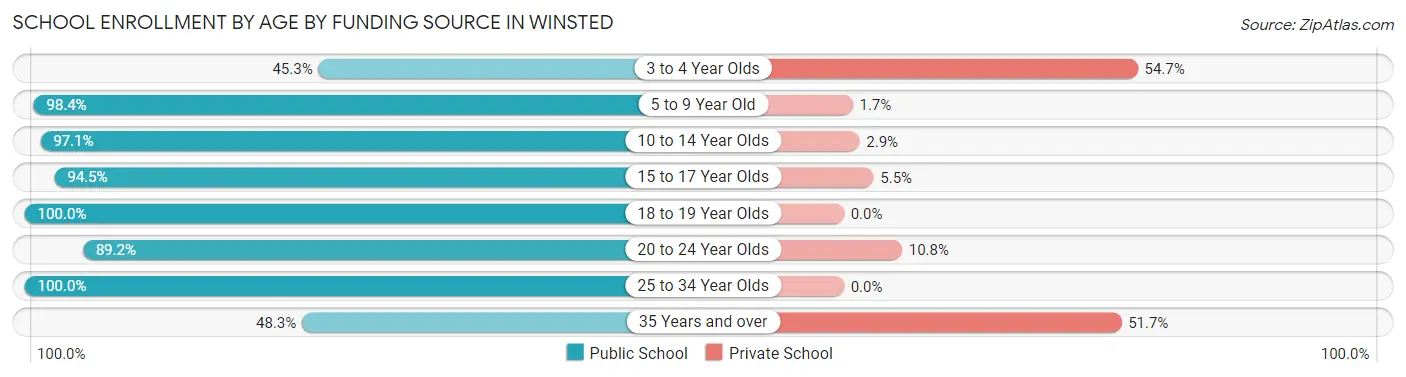
| Age Bracket | Public School | Private School |
| 3 to 4 Year Olds | 43 (45.3%) | 52 (54.7%) |
| 5 to 9 Year Old | 535 (98.4%) | 9 (1.7%) |
| 10 to 14 Year Olds | 233 (97.1%) | 7 (2.9%) |
| 15 to 17 Year Olds | 222 (94.5%) | 13 (5.5%) |
| 18 to 19 Year Olds | 148 (100.0%) | 0 (0.0%) |
| 20 to 24 Year Olds | 140 (89.2%) | 17 (10.8%) |
| 25 to 34 Year Olds | 38 (100.0%) | 0 (0.0%) |
| 35 Years and over | 43 (48.3%) | 46 (51.7%) |
| Total | 1,402 (90.7%) | 144 (9.3%) |
Educational Attainment by Field of Study in Winsted
Education (228 | 20.5%), business (226 | 20.4%), science & technology (165 | 14.9%), psychology (98 | 8.8%), and bio, nature & agricultural (85 | 7.7%) are the most common fields of study among 1,110 individuals in Winsted who have obtained a bachelor's degree or higher.
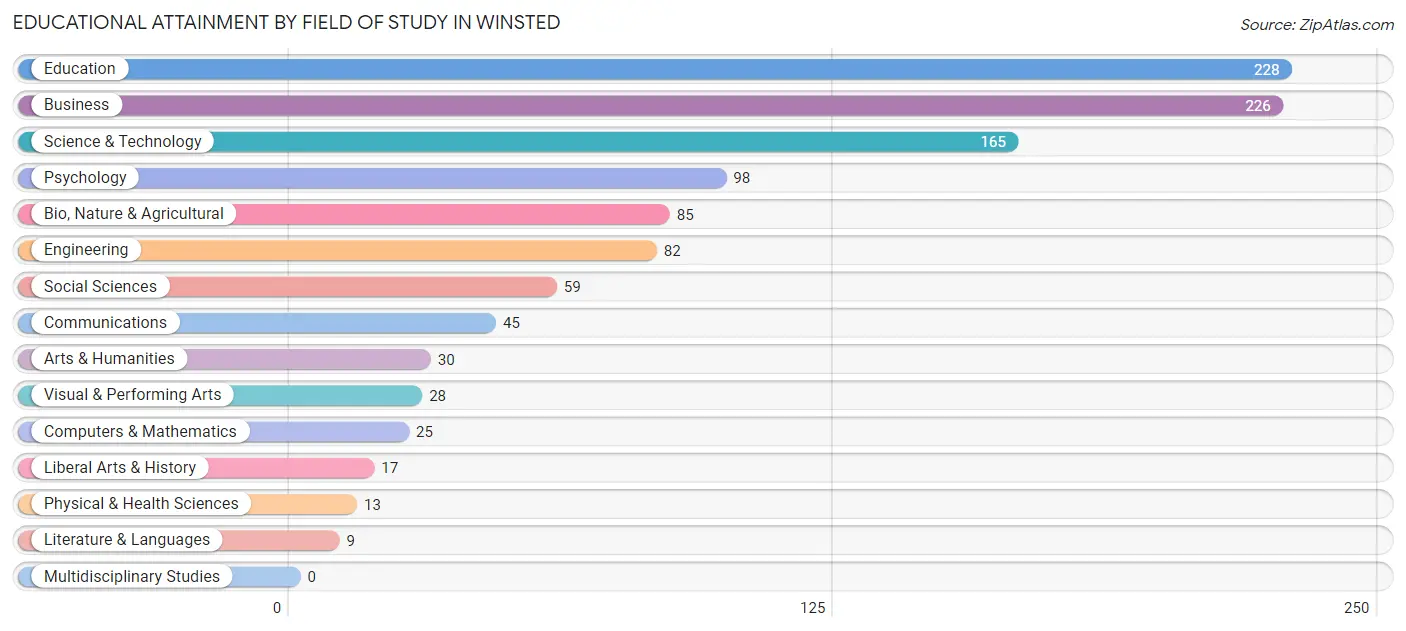
| Field of Study | # Graduates | % Graduates |
| Computers & Mathematics | 25 | 2.2% |
| Bio, Nature & Agricultural | 85 | 7.7% |
| Physical & Health Sciences | 13 | 1.2% |
| Psychology | 98 | 8.8% |
| Social Sciences | 59 | 5.3% |
| Engineering | 82 | 7.4% |
| Multidisciplinary Studies | 0 | 0.0% |
| Science & Technology | 165 | 14.9% |
| Business | 226 | 20.4% |
| Education | 228 | 20.5% |
| Literature & Languages | 9 | 0.8% |
| Liberal Arts & History | 17 | 1.5% |
| Visual & Performing Arts | 28 | 2.5% |
| Communications | 45 | 4.1% |
| Arts & Humanities | 30 | 2.7% |
| Total | 1,110 | 100.0% |
Transportation & Commute in Winsted
Vehicle Availability by Sex in Winsted
The most prevalent vehicle ownership categories in Winsted are males with 2 vehicles (711, accounting for 46.2%) and females with 2 vehicles (993, making up 38.3%).
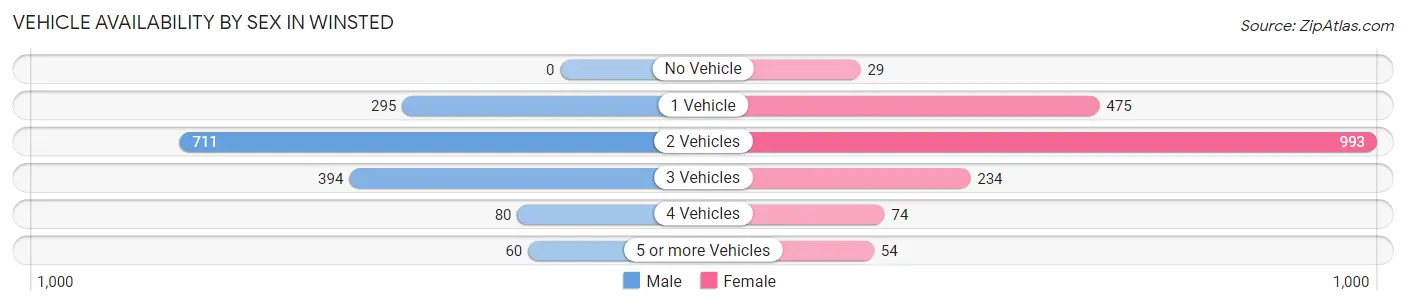
| Vehicles Available | Male | Female |
| No Vehicle | 0 (0.0%) | 29 (1.6%) |
| 1 Vehicle | 295 (19.2%) | 475 (25.6%) |
| 2 Vehicles | 711 (46.2%) | 993 (53.4%) |
| 3 Vehicles | 394 (25.6%) | 234 (12.6%) |
| 4 Vehicles | 80 (5.2%) | 74 (4.0%) |
| 5 or more Vehicles | 60 (3.9%) | 54 (2.9%) |
| Total | 1,540 (100.0%) | 1,859 (100.0%) |
Commute Time in Winsted
The most frequently occuring commute durations in Winsted are 15 to 19 minutes (451 commuters, 13.8%), 5 to 9 minutes (441 commuters, 13.5%), and 20 to 24 minutes (399 commuters, 12.2%).
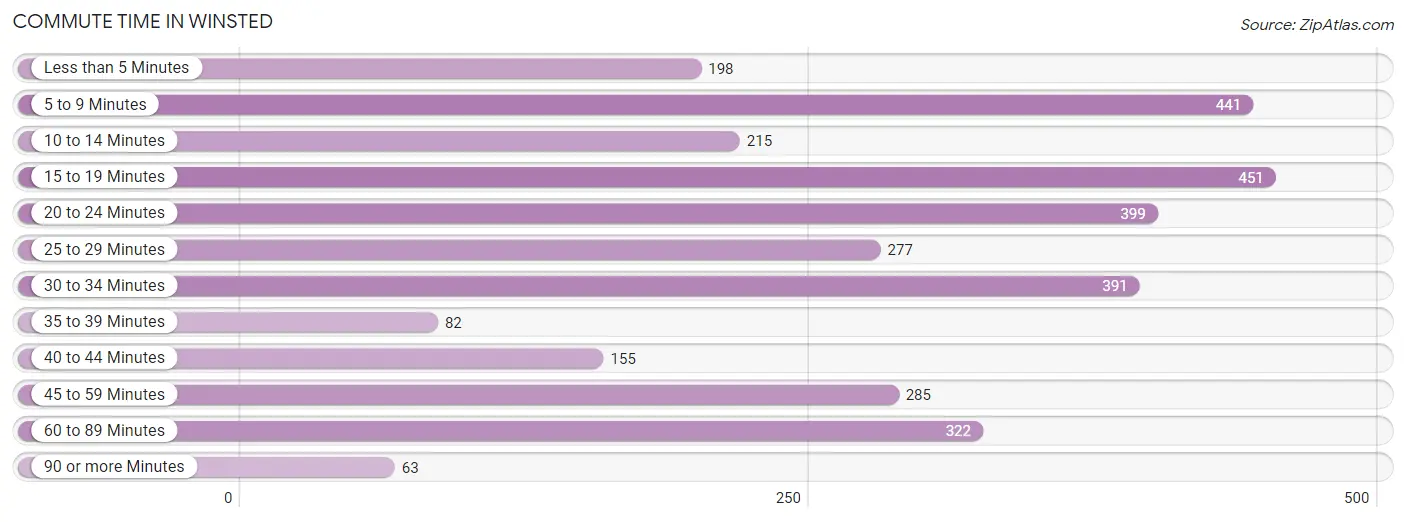
| Commute Time | # Commuters | % Commuters |
| Less than 5 Minutes | 198 | 6.0% |
| 5 to 9 Minutes | 441 | 13.5% |
| 10 to 14 Minutes | 215 | 6.6% |
| 15 to 19 Minutes | 451 | 13.8% |
| 20 to 24 Minutes | 399 | 12.2% |
| 25 to 29 Minutes | 277 | 8.5% |
| 30 to 34 Minutes | 391 | 11.9% |
| 35 to 39 Minutes | 82 | 2.5% |
| 40 to 44 Minutes | 155 | 4.7% |
| 45 to 59 Minutes | 285 | 8.7% |
| 60 to 89 Minutes | 322 | 9.8% |
| 90 or more Minutes | 63 | 1.9% |
Commute Time by Sex in Winsted
The most common commute times in Winsted are 5 to 9 minutes (258 commuters, 17.1%) for males and 20 to 24 minutes (316 commuters, 17.9%) for females.

| Commute Time | Male | Female |
| Less than 5 Minutes | 0 (0.0%) | 198 (11.2%) |
| 5 to 9 Minutes | 258 (17.1%) | 183 (10.3%) |
| 10 to 14 Minutes | 49 (3.2%) | 166 (9.4%) |
| 15 to 19 Minutes | 241 (16.0%) | 210 (11.9%) |
| 20 to 24 Minutes | 83 (5.5%) | 316 (17.9%) |
| 25 to 29 Minutes | 140 (9.3%) | 137 (7.7%) |
| 30 to 34 Minutes | 185 (12.2%) | 206 (11.7%) |
| 35 to 39 Minutes | 5 (0.3%) | 77 (4.4%) |
| 40 to 44 Minutes | 35 (2.3%) | 120 (6.8%) |
| 45 to 59 Minutes | 226 (15.0%) | 59 (3.3%) |
| 60 to 89 Minutes | 233 (15.4%) | 89 (5.0%) |
| 90 or more Minutes | 56 (3.7%) | 7 (0.4%) |
Time of Departure to Work by Sex in Winsted
The most frequent times of departure to work in Winsted are 6:00 AM to 6:29 AM (312, 20.6%) for males and 7:00 AM to 7:29 AM (310, 17.5%) for females.
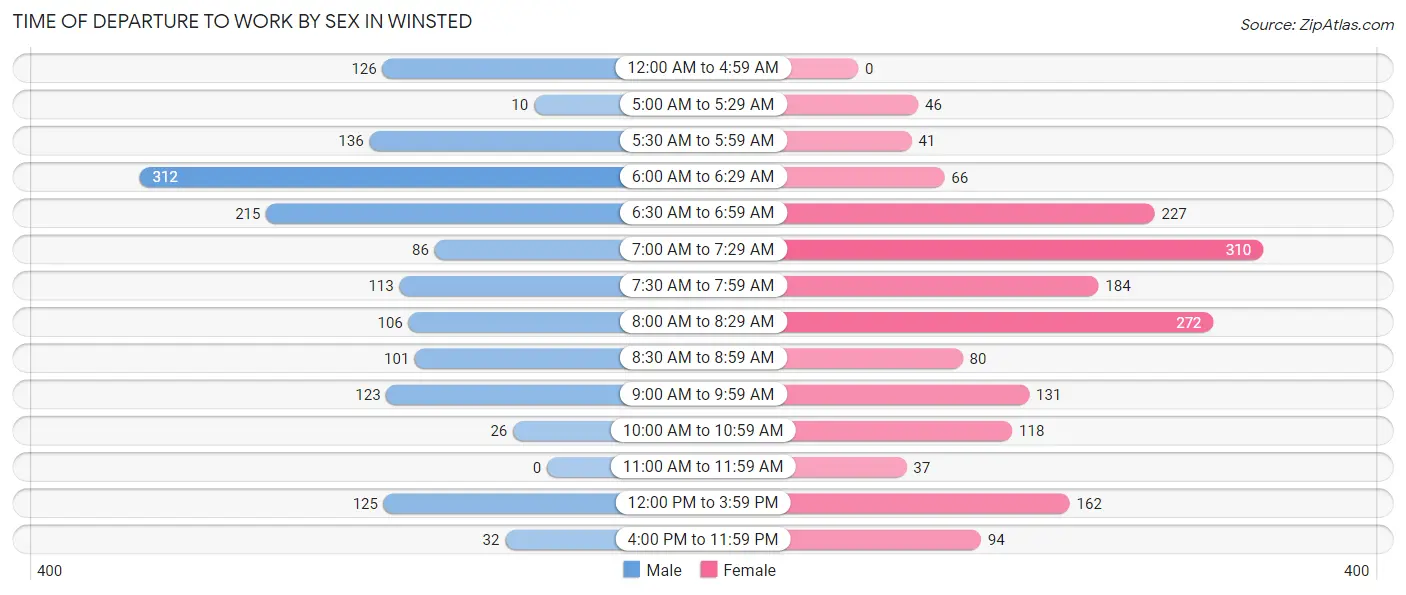
| Time of Departure | Male | Female |
| 12:00 AM to 4:59 AM | 126 (8.3%) | 0 (0.0%) |
| 5:00 AM to 5:29 AM | 10 (0.7%) | 46 (2.6%) |
| 5:30 AM to 5:59 AM | 136 (9.0%) | 41 (2.3%) |
| 6:00 AM to 6:29 AM | 312 (20.6%) | 66 (3.7%) |
| 6:30 AM to 6:59 AM | 215 (14.2%) | 227 (12.8%) |
| 7:00 AM to 7:29 AM | 86 (5.7%) | 310 (17.5%) |
| 7:30 AM to 7:59 AM | 113 (7.5%) | 184 (10.4%) |
| 8:00 AM to 8:29 AM | 106 (7.0%) | 272 (15.4%) |
| 8:30 AM to 8:59 AM | 101 (6.7%) | 80 (4.5%) |
| 9:00 AM to 9:59 AM | 123 (8.1%) | 131 (7.4%) |
| 10:00 AM to 10:59 AM | 26 (1.7%) | 118 (6.7%) |
| 11:00 AM to 11:59 AM | 0 (0.0%) | 37 (2.1%) |
| 12:00 PM to 3:59 PM | 125 (8.3%) | 162 (9.2%) |
| 4:00 PM to 11:59 PM | 32 (2.1%) | 94 (5.3%) |
| Total | 1,511 (100.0%) | 1,768 (100.0%) |
Housing Occupancy in Winsted
Occupancy by Ownership in Winsted
Of the total 3,291 dwellings in Winsted, owner-occupied units account for 1,595 (48.5%), while renter-occupied units make up 1,696 (51.5%).
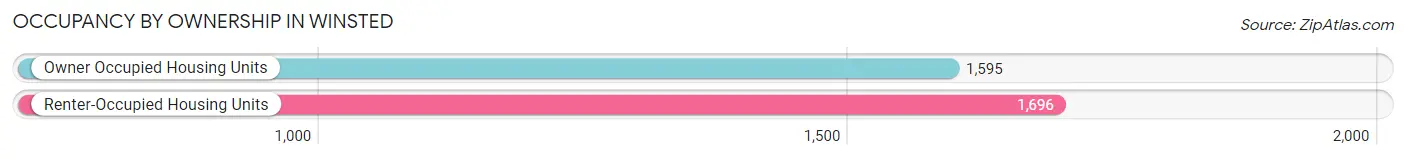
| Occupancy | # Housing Units | % Housing Units |
| Owner Occupied Housing Units | 1,595 | 48.5% |
| Renter-Occupied Housing Units | 1,696 | 51.5% |
| Total Occupied Housing Units | 3,291 | 100.0% |
Occupancy by Household Size in Winsted
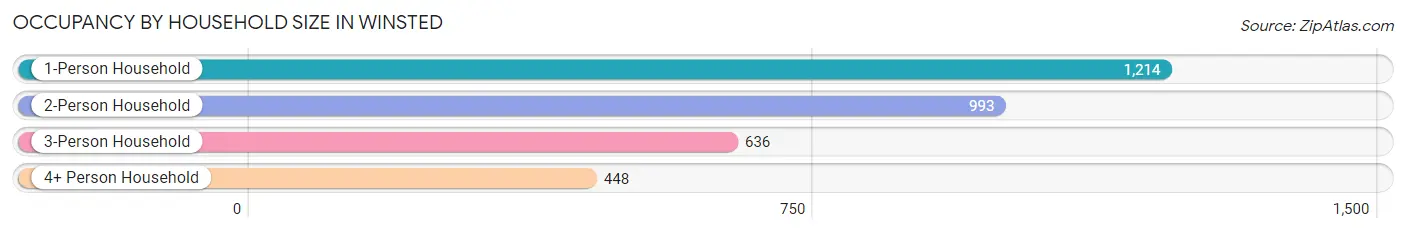
| Household Size | # Housing Units | % Housing Units |
| 1-Person Household | 1,214 | 36.9% |
| 2-Person Household | 993 | 30.2% |
| 3-Person Household | 636 | 19.3% |
| 4+ Person Household | 448 | 13.6% |
| Total Housing Units | 3,291 | 100.0% |
Occupancy by Ownership by Household Size in Winsted
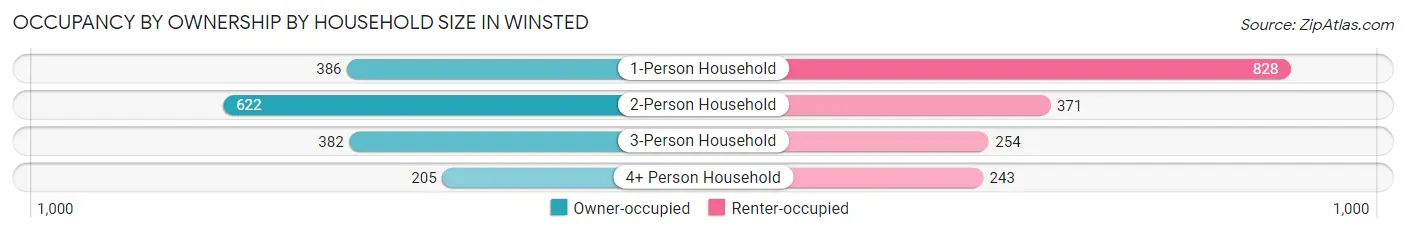
| Household Size | Owner-occupied | Renter-occupied |
| 1-Person Household | 386 (31.8%) | 828 (68.2%) |
| 2-Person Household | 622 (62.6%) | 371 (37.4%) |
| 3-Person Household | 382 (60.1%) | 254 (39.9%) |
| 4+ Person Household | 205 (45.8%) | 243 (54.2%) |
| Total Housing Units | 1,595 (48.5%) | 1,696 (51.5%) |
Occupancy by Educational Attainment in Winsted
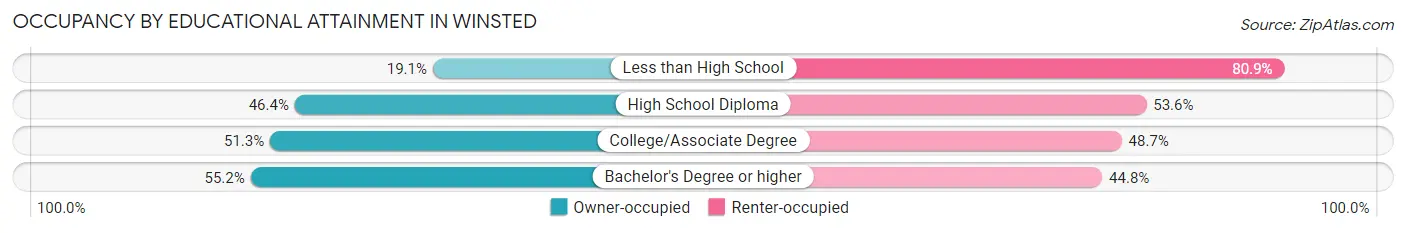
| Household Size | Owner-occupied | Renter-occupied |
| Less than High School | 37 (19.1%) | 157 (80.9%) |
| High School Diploma | 541 (46.4%) | 624 (53.6%) |
| College/Associate Degree | 656 (51.3%) | 622 (48.7%) |
| Bachelor's Degree or higher | 361 (55.2%) | 293 (44.8%) |
Occupancy by Age of Householder in Winsted
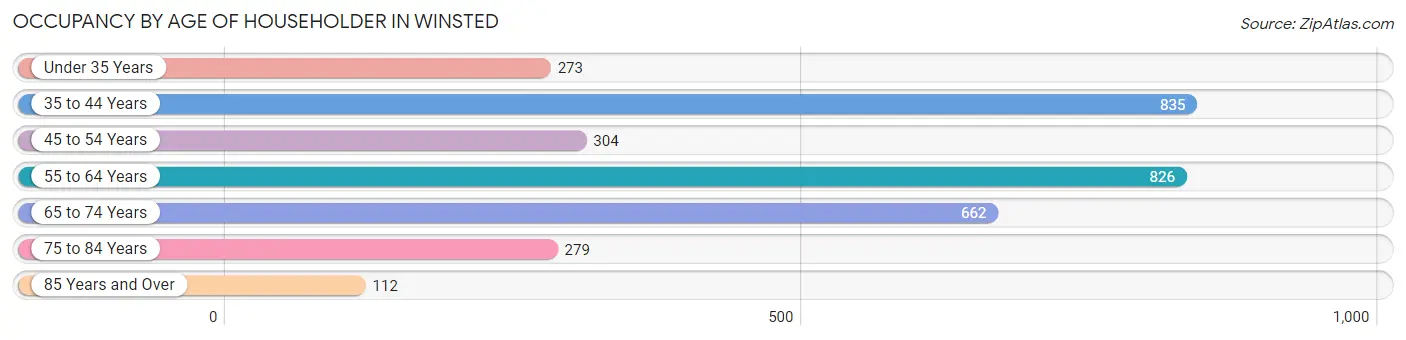
| Age Bracket | # Households | % Households |
| Under 35 Years | 273 | 8.3% |
| 35 to 44 Years | 835 | 25.4% |
| 45 to 54 Years | 304 | 9.2% |
| 55 to 64 Years | 826 | 25.1% |
| 65 to 74 Years | 662 | 20.1% |
| 75 to 84 Years | 279 | 8.5% |
| 85 Years and Over | 112 | 3.4% |
| Total | 3,291 | 100.0% |
Housing Finances in Winsted
Median Income by Occupancy in Winsted
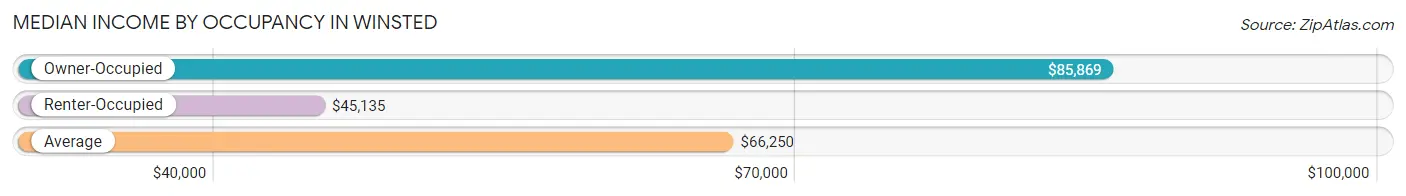
| Occupancy Type | # Households | Median Income |
| Owner-Occupied | 1,595 (48.5%) | $85,869 |
| Renter-Occupied | 1,696 (51.5%) | $45,135 |
| Average | 3,291 (100.0%) | $66,250 |
Occupancy by Householder Income Bracket in Winsted
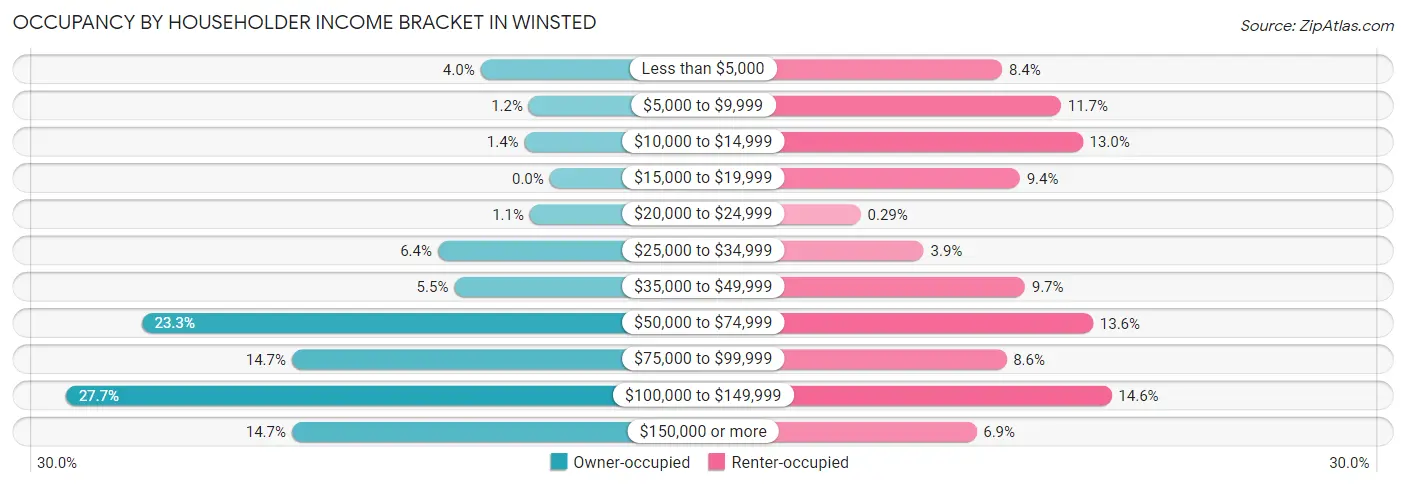
| Income Bracket | Owner-occupied | Renter-occupied |
| Less than $5,000 | 63 (4.0%) | 142 (8.4%) |
| $5,000 to $9,999 | 19 (1.2%) | 199 (11.7%) |
| $10,000 to $14,999 | 23 (1.4%) | 220 (13.0%) |
| $15,000 to $19,999 | 0 (0.0%) | 159 (9.4%) |
| $20,000 to $24,999 | 18 (1.1%) | 5 (0.3%) |
| $25,000 to $34,999 | 102 (6.4%) | 66 (3.9%) |
| $35,000 to $49,999 | 87 (5.4%) | 164 (9.7%) |
| $50,000 to $74,999 | 372 (23.3%) | 230 (13.6%) |
| $75,000 to $99,999 | 235 (14.7%) | 146 (8.6%) |
| $100,000 to $149,999 | 441 (27.7%) | 248 (14.6%) |
| $150,000 or more | 235 (14.7%) | 117 (6.9%) |
| Total | 1,595 (100.0%) | 1,696 (100.0%) |
Monthly Housing Cost Tiers in Winsted
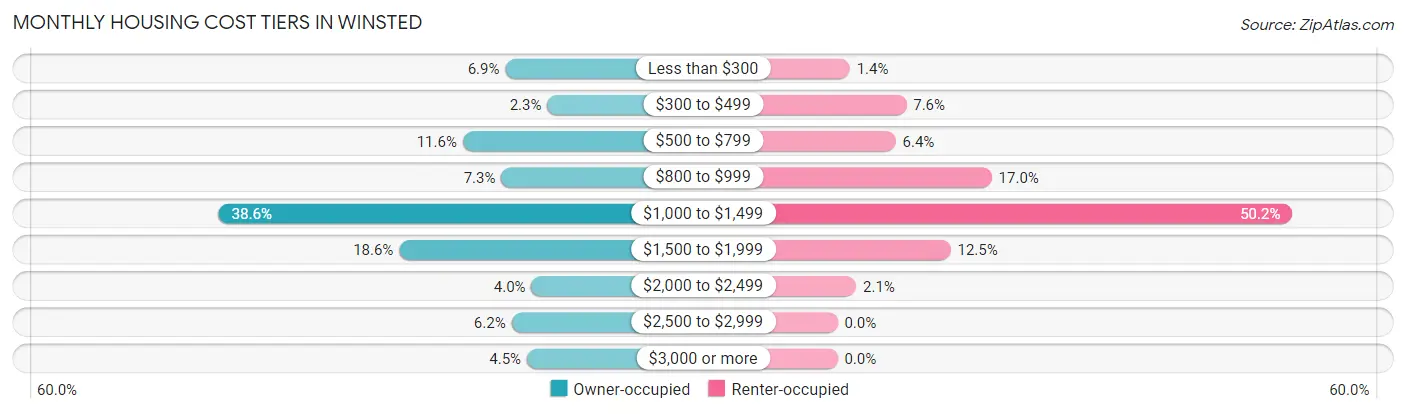
| Monthly Cost | Owner-occupied | Renter-occupied |
| Less than $300 | 110 (6.9%) | 23 (1.4%) |
| $300 to $499 | 36 (2.3%) | 129 (7.6%) |
| $500 to $799 | 185 (11.6%) | 109 (6.4%) |
| $800 to $999 | 117 (7.3%) | 289 (17.0%) |
| $1,000 to $1,499 | 615 (38.6%) | 852 (50.2%) |
| $1,500 to $1,999 | 297 (18.6%) | 212 (12.5%) |
| $2,000 to $2,499 | 64 (4.0%) | 35 (2.1%) |
| $2,500 to $2,999 | 99 (6.2%) | 0 (0.0%) |
| $3,000 or more | 72 (4.5%) | 0 (0.0%) |
| Total | 1,595 (100.0%) | 1,696 (100.0%) |
Physical Housing Characteristics in Winsted
Housing Structures in Winsted
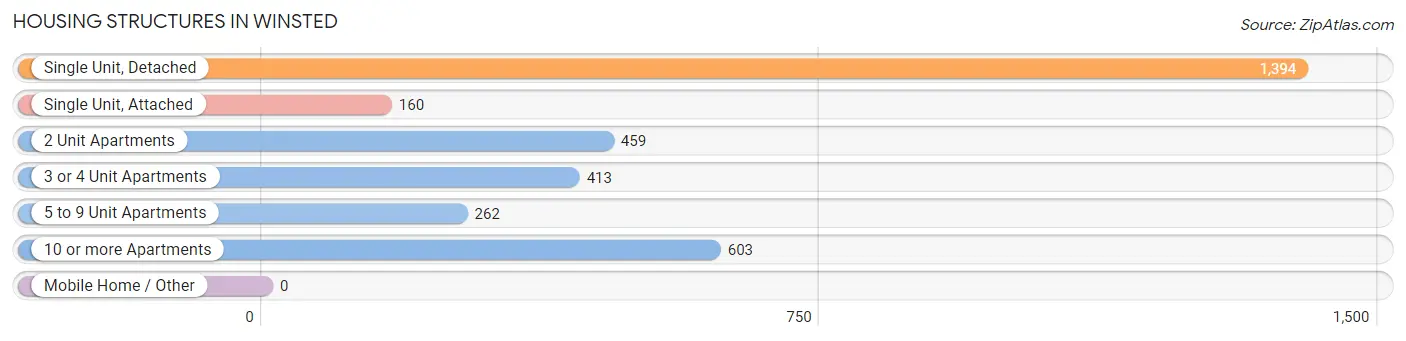
| Structure Type | # Housing Units | % Housing Units |
| Single Unit, Detached | 1,394 | 42.4% |
| Single Unit, Attached | 160 | 4.9% |
| 2 Unit Apartments | 459 | 14.0% |
| 3 or 4 Unit Apartments | 413 | 12.6% |
| 5 to 9 Unit Apartments | 262 | 8.0% |
| 10 or more Apartments | 603 | 18.3% |
| Mobile Home / Other | 0 | 0.0% |
| Total | 3,291 | 100.0% |
Housing Structures by Occupancy in Winsted
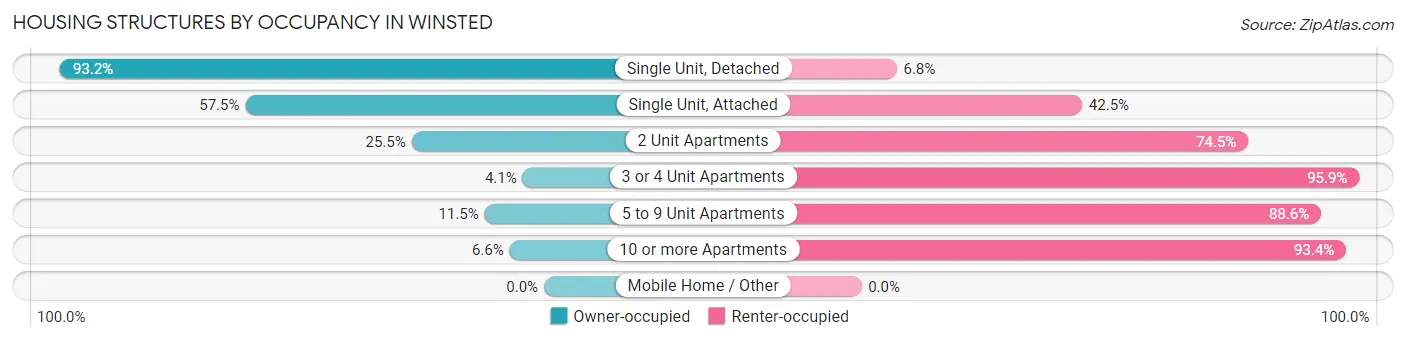
| Structure Type | Owner-occupied | Renter-occupied |
| Single Unit, Detached | 1,299 (93.2%) | 95 (6.8%) |
| Single Unit, Attached | 92 (57.5%) | 68 (42.5%) |
| 2 Unit Apartments | 117 (25.5%) | 342 (74.5%) |
| 3 or 4 Unit Apartments | 17 (4.1%) | 396 (95.9%) |
| 5 to 9 Unit Apartments | 30 (11.5%) | 232 (88.5%) |
| 10 or more Apartments | 40 (6.6%) | 563 (93.4%) |
| Mobile Home / Other | 0 (0.0%) | 0 (0.0%) |
| Total | 1,595 (48.5%) | 1,696 (51.5%) |
Housing Structures by Number of Rooms in Winsted
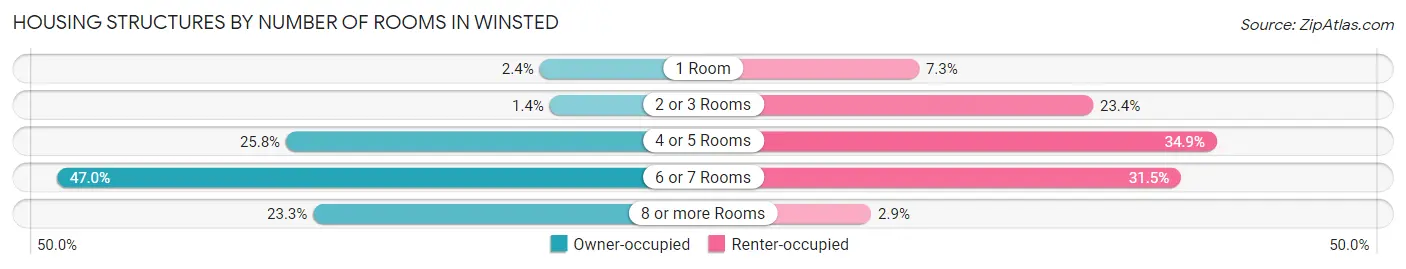
| Number of Rooms | Owner-occupied | Renter-occupied |
| 1 Room | 38 (2.4%) | 124 (7.3%) |
| 2 or 3 Rooms | 23 (1.4%) | 397 (23.4%) |
| 4 or 5 Rooms | 412 (25.8%) | 591 (34.8%) |
| 6 or 7 Rooms | 750 (47.0%) | 535 (31.5%) |
| 8 or more Rooms | 372 (23.3%) | 49 (2.9%) |
| Total | 1,595 (100.0%) | 1,696 (100.0%) |
Housing Structure by Heating Type in Winsted
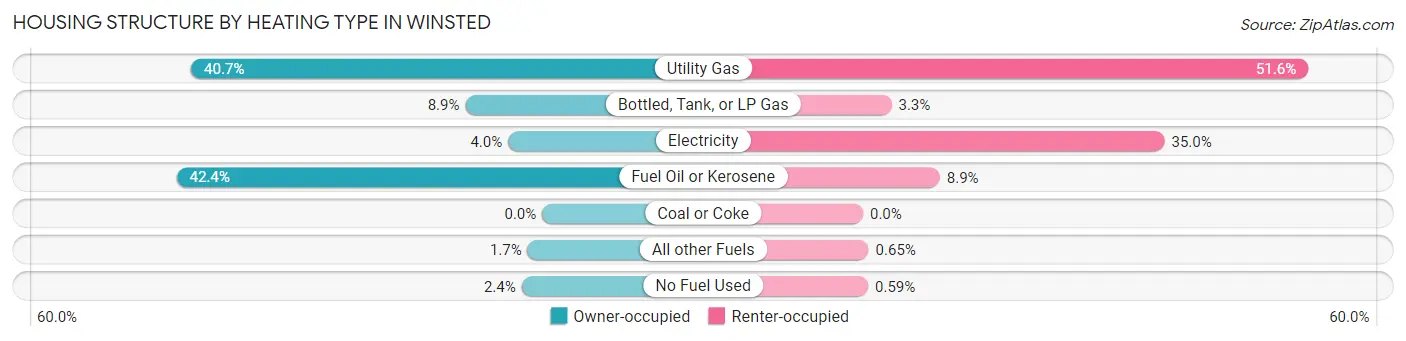
| Heating Type | Owner-occupied | Renter-occupied |
| Utility Gas | 649 (40.7%) | 875 (51.6%) |
| Bottled, Tank, or LP Gas | 142 (8.9%) | 56 (3.3%) |
| Electricity | 63 (4.0%) | 593 (35.0%) |
| Fuel Oil or Kerosene | 676 (42.4%) | 151 (8.9%) |
| Coal or Coke | 0 (0.0%) | 0 (0.0%) |
| All other Fuels | 27 (1.7%) | 11 (0.6%) |
| No Fuel Used | 38 (2.4%) | 10 (0.6%) |
| Total | 1,595 (100.0%) | 1,696 (100.0%) |
Household Vehicle Usage in Winsted
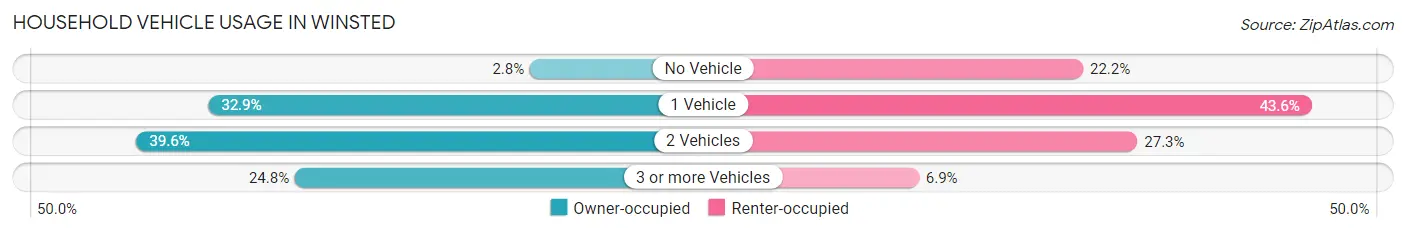
| Vehicles per Household | Owner-occupied | Renter-occupied |
| No Vehicle | 45 (2.8%) | 377 (22.2%) |
| 1 Vehicle | 524 (32.9%) | 739 (43.6%) |
| 2 Vehicles | 631 (39.6%) | 463 (27.3%) |
| 3 or more Vehicles | 395 (24.8%) | 117 (6.9%) |
| Total | 1,595 (100.0%) | 1,696 (100.0%) |
Real Estate & Mortgages in Winsted
Real Estate and Mortgage Overview in Winsted
| Characteristic | Without Mortgage | With Mortgage |
| Housing Units | 583 | 1,012 |
| Median Property Value | $199,000 | $177,400 |
| Median Household Income | $71,283 | $137 |
| Monthly Housing Costs | $728 | $72 |
| Real Estate Taxes | $3,762 | $57 |
Property Value by Mortgage Status in Winsted
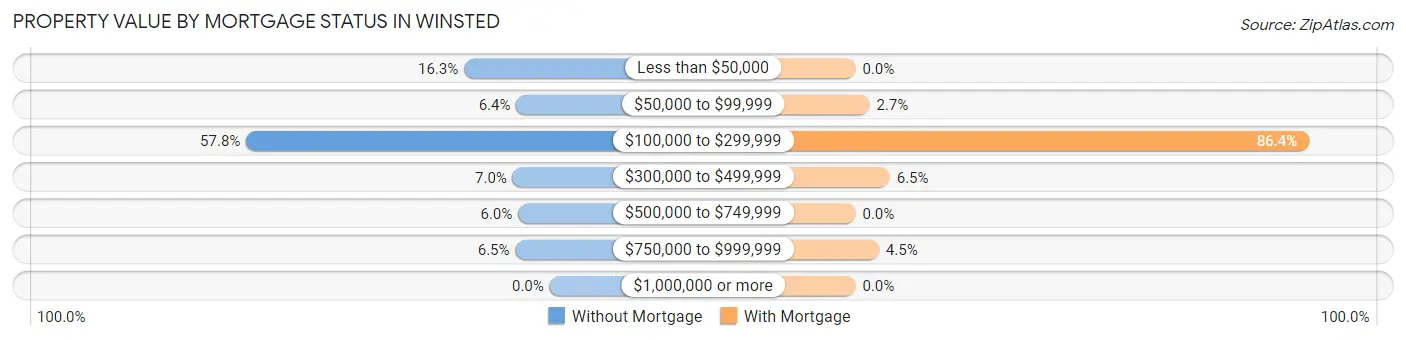
| Property Value | Without Mortgage | With Mortgage |
| Less than $50,000 | 95 (16.3%) | 0 (0.0%) |
| $50,000 to $99,999 | 37 (6.4%) | 27 (2.7%) |
| $100,000 to $299,999 | 337 (57.8%) | 874 (86.4%) |
| $300,000 to $499,999 | 41 (7.0%) | 66 (6.5%) |
| $500,000 to $749,999 | 35 (6.0%) | 0 (0.0%) |
| $750,000 to $999,999 | 38 (6.5%) | 45 (4.4%) |
| $1,000,000 or more | 0 (0.0%) | 0 (0.0%) |
| Total | 583 (100.0%) | 1,012 (100.0%) |
Household Income by Mortgage Status in Winsted
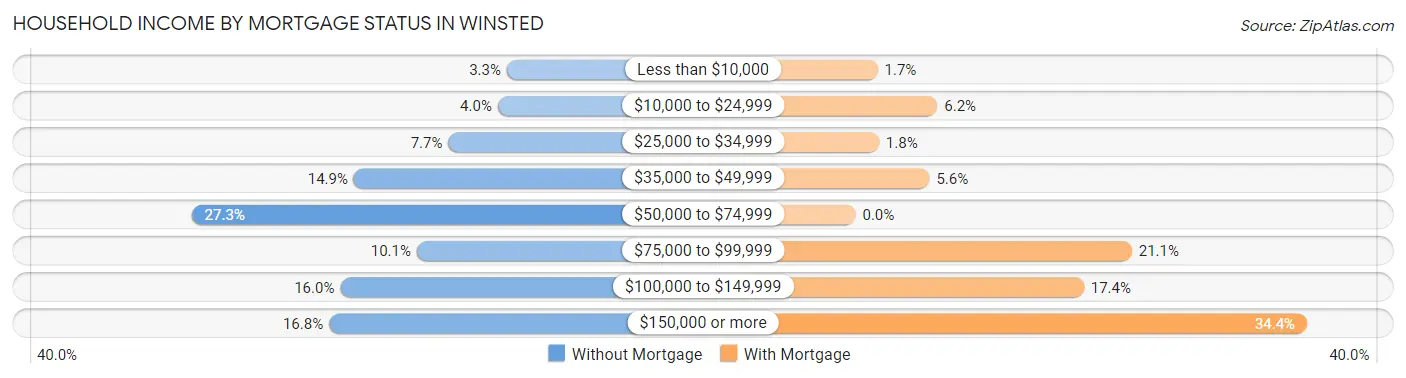
| Household Income | Without Mortgage | With Mortgage |
| Less than $10,000 | 19 (3.3%) | 17 (1.7%) |
| $10,000 to $24,999 | 23 (4.0%) | 63 (6.2%) |
| $25,000 to $34,999 | 45 (7.7%) | 18 (1.8%) |
| $35,000 to $49,999 | 87 (14.9%) | 57 (5.6%) |
| $50,000 to $74,999 | 159 (27.3%) | 0 (0.0%) |
| $75,000 to $99,999 | 59 (10.1%) | 213 (21.0%) |
| $100,000 to $149,999 | 93 (16.0%) | 176 (17.4%) |
| $150,000 or more | 98 (16.8%) | 348 (34.4%) |
| Total | 583 (100.0%) | 1,012 (100.0%) |
Property Value to Household Income Ratio in Winsted
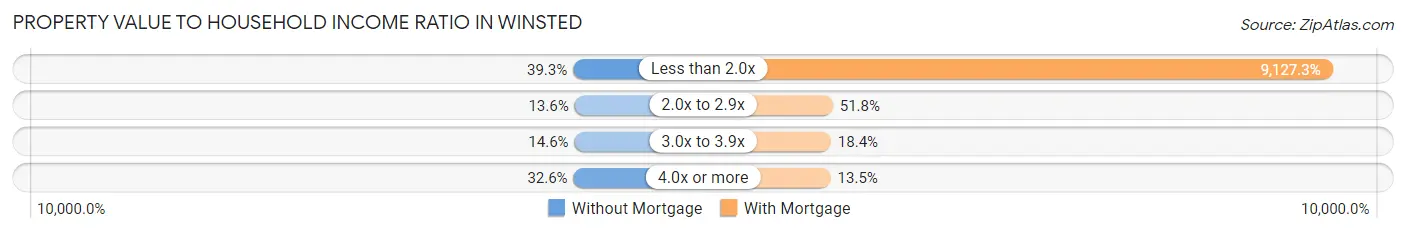
| Value-to-Income Ratio | Without Mortgage | With Mortgage |
| Less than 2.0x | 229 (39.3%) | 92,368 (9,127.3%) |
| 2.0x to 2.9x | 79 (13.6%) | 524 (51.8%) |
| 3.0x to 3.9x | 85 (14.6%) | 186 (18.4%) |
| 4.0x or more | 190 (32.6%) | 137 (13.5%) |
| Total | 583 (100.0%) | 1,012 (100.0%) |
Real Estate Taxes by Mortgage Status in Winsted
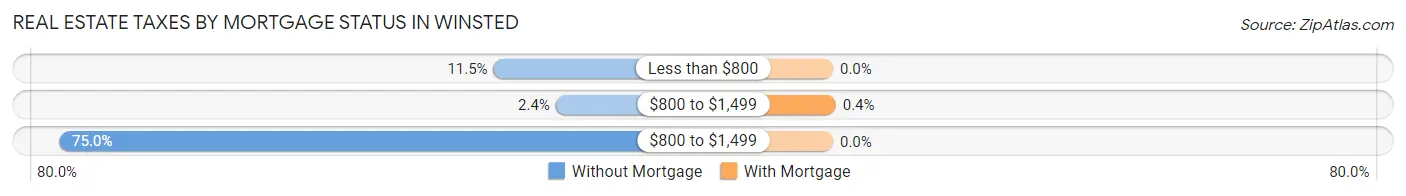
| Property Taxes | Without Mortgage | With Mortgage |
| Less than $800 | 67 (11.5%) | 0 (0.0%) |
| $800 to $1,499 | 14 (2.4%) | 4 (0.4%) |
| $800 to $1,499 | 437 (75.0%) | 0 (0.0%) |
| Total | 583 (100.0%) | 1,012 (100.0%) |
Health & Disability in Winsted
Health Insurance Coverage by Age in Winsted
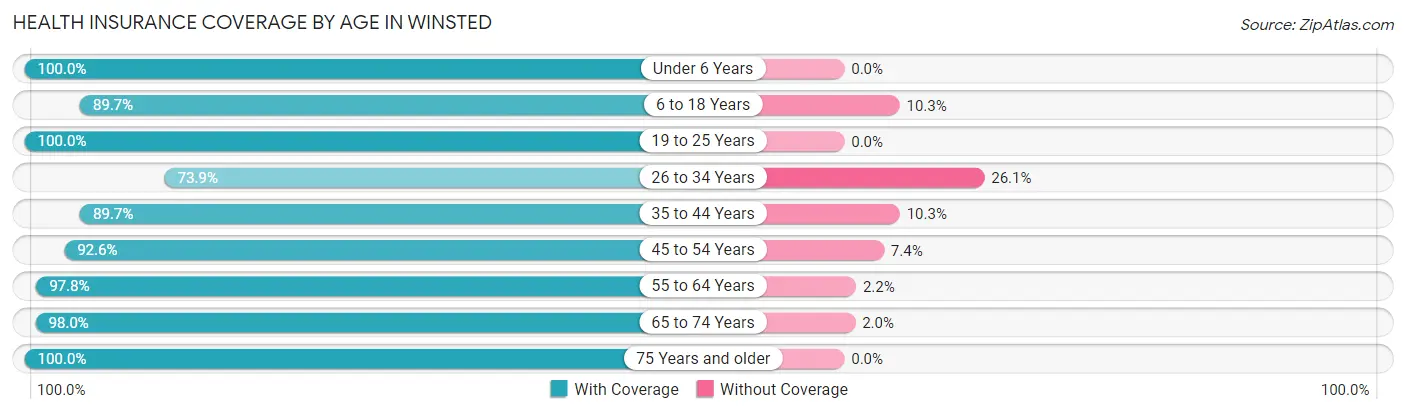
| Age Bracket | With Coverage | Without Coverage |
| Under 6 Years | 252 (100.0%) | 0 (0.0%) |
| 6 to 18 Years | 896 (89.7%) | 103 (10.3%) |
| 19 to 25 Years | 426 (100.0%) | 0 (0.0%) |
| 26 to 34 Years | 501 (73.9%) | 177 (26.1%) |
| 35 to 44 Years | 1,093 (89.7%) | 126 (10.3%) |
| 45 to 54 Years | 551 (92.6%) | 44 (7.4%) |
| 55 to 64 Years | 1,169 (97.8%) | 26 (2.2%) |
| 65 to 74 Years | 964 (98.0%) | 20 (2.0%) |
| 75 Years and older | 515 (100.0%) | 0 (0.0%) |
| Total | 6,367 (92.8%) | 496 (7.2%) |
Health Insurance Coverage by Citizenship Status in Winsted
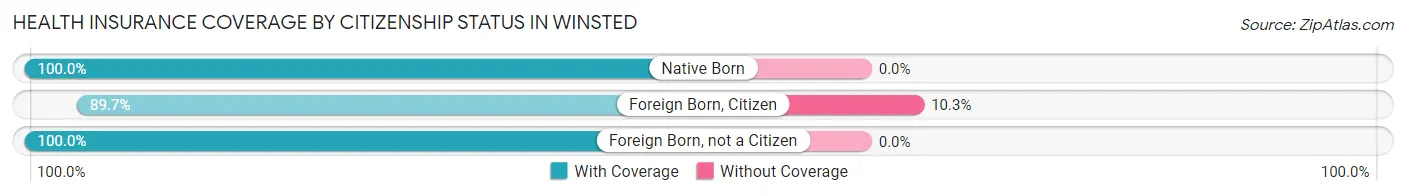
| Citizenship Status | With Coverage | Without Coverage |
| Native Born | 252 (100.0%) | 0 (0.0%) |
| Foreign Born, Citizen | 896 (89.7%) | 103 (10.3%) |
| Foreign Born, not a Citizen | 426 (100.0%) | 0 (0.0%) |
Health Insurance Coverage by Household Income in Winsted
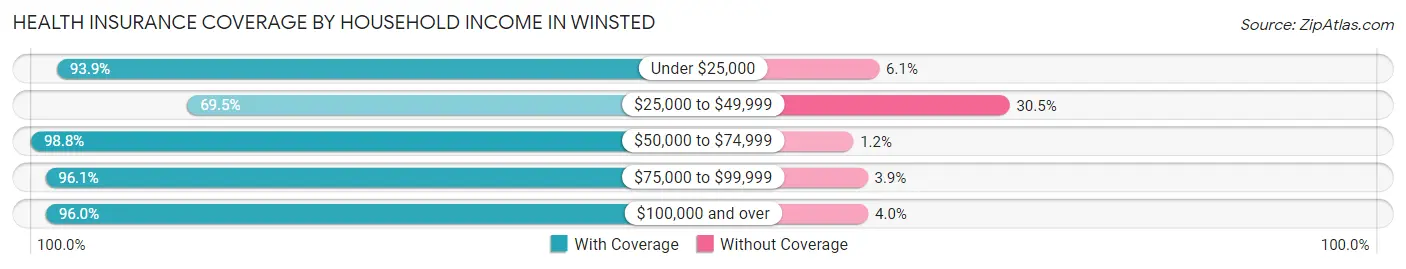
| Household Income | With Coverage | Without Coverage |
| Under $25,000 | 1,054 (93.9%) | 68 (6.1%) |
| $25,000 to $49,999 | 602 (69.5%) | 264 (30.5%) |
| $50,000 to $74,999 | 988 (98.8%) | 12 (1.2%) |
| $75,000 to $99,999 | 868 (96.1%) | 35 (3.9%) |
| $100,000 and over | 2,815 (96.0%) | 117 (4.0%) |
Public vs Private Health Insurance Coverage by Age in Winsted
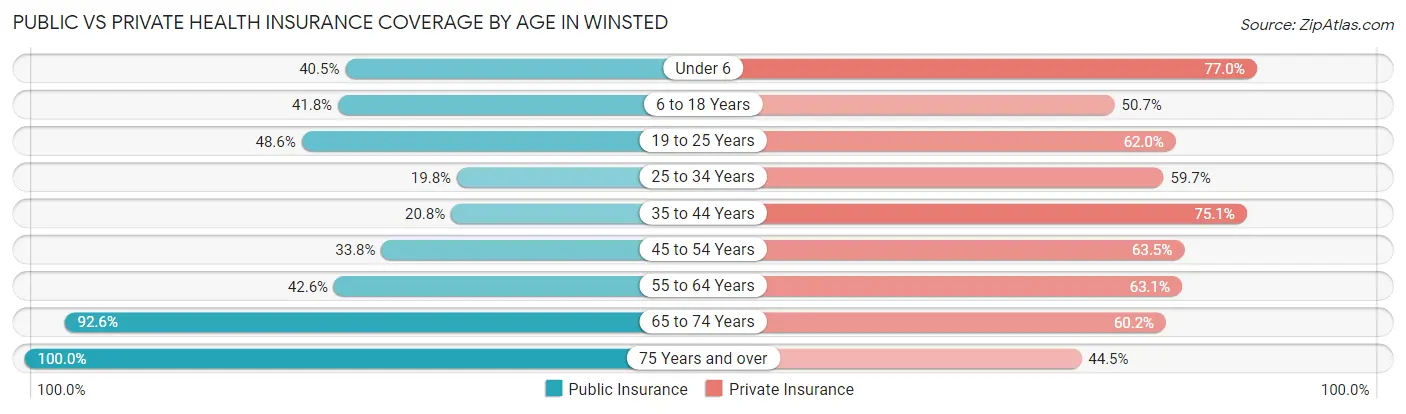
| Age Bracket | Public Insurance | Private Insurance |
| Under 6 | 102 (40.5%) | 194 (77.0%) |
| 6 to 18 Years | 418 (41.8%) | 506 (50.6%) |
| 19 to 25 Years | 207 (48.6%) | 264 (62.0%) |
| 25 to 34 Years | 134 (19.8%) | 405 (59.7%) |
| 35 to 44 Years | 254 (20.8%) | 916 (75.1%) |
| 45 to 54 Years | 201 (33.8%) | 378 (63.5%) |
| 55 to 64 Years | 509 (42.6%) | 754 (63.1%) |
| 65 to 74 Years | 911 (92.6%) | 592 (60.2%) |
| 75 Years and over | 515 (100.0%) | 229 (44.5%) |
| Total | 3,251 (47.4%) | 4,238 (61.8%) |
Disability Status by Sex by Age in Winsted
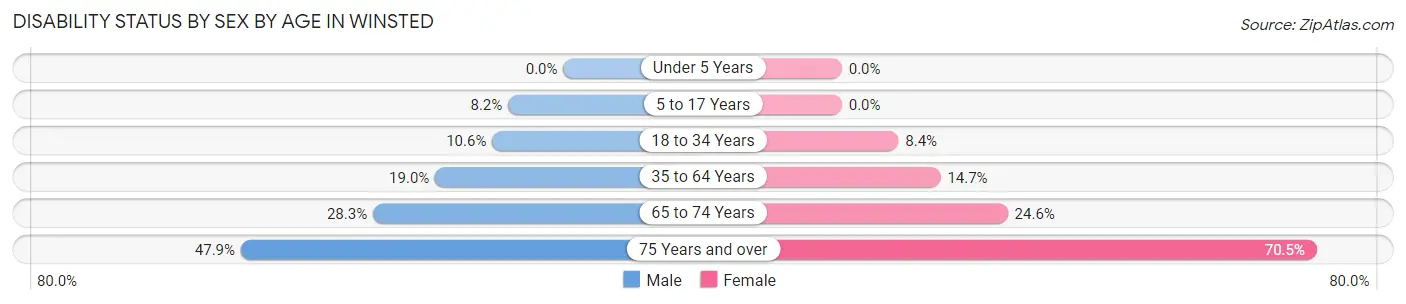
| Age Bracket | Male | Female |
| Under 5 Years | 0 (0.0%) | 0 (0.0%) |
| 5 to 17 Years | 37 (8.2%) | 0 (0.0%) |
| 18 to 34 Years | 73 (10.6%) | 41 (8.4%) |
| 35 to 64 Years | 296 (19.0%) | 213 (14.6%) |
| 65 to 74 Years | 145 (28.3%) | 116 (24.6%) |
| 75 Years and over | 102 (47.9%) | 213 (70.5%) |
Disability Class by Sex by Age in Winsted
Disability Class: Hearing Difficulty
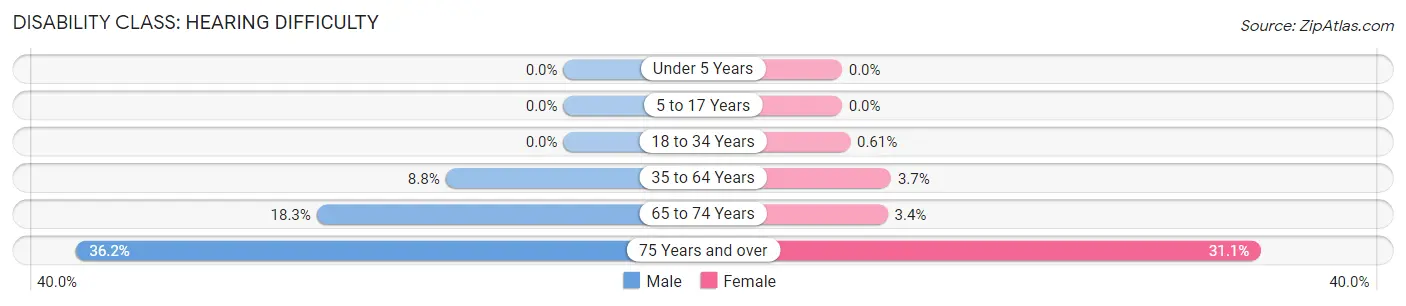
| Age Bracket | Male | Female |
| Under 5 Years | 0 (0.0%) | 0 (0.0%) |
| 5 to 17 Years | 0 (0.0%) | 0 (0.0%) |
| 18 to 34 Years | 0 (0.0%) | 3 (0.6%) |
| 35 to 64 Years | 136 (8.7%) | 53 (3.6%) |
| 65 to 74 Years | 94 (18.3%) | 16 (3.4%) |
| 75 Years and over | 77 (36.1%) | 94 (31.1%) |
Disability Class: Vision Difficulty
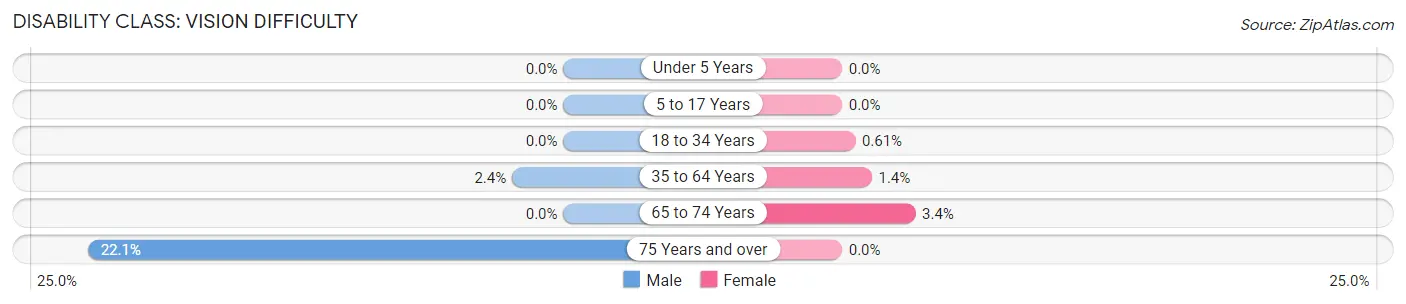
| Age Bracket | Male | Female |
| Under 5 Years | 0 (0.0%) | 0 (0.0%) |
| 5 to 17 Years | 0 (0.0%) | 0 (0.0%) |
| 18 to 34 Years | 0 (0.0%) | 3 (0.6%) |
| 35 to 64 Years | 37 (2.4%) | 20 (1.4%) |
| 65 to 74 Years | 0 (0.0%) | 16 (3.4%) |
| 75 Years and over | 47 (22.1%) | 0 (0.0%) |
Disability Class: Cognitive Difficulty
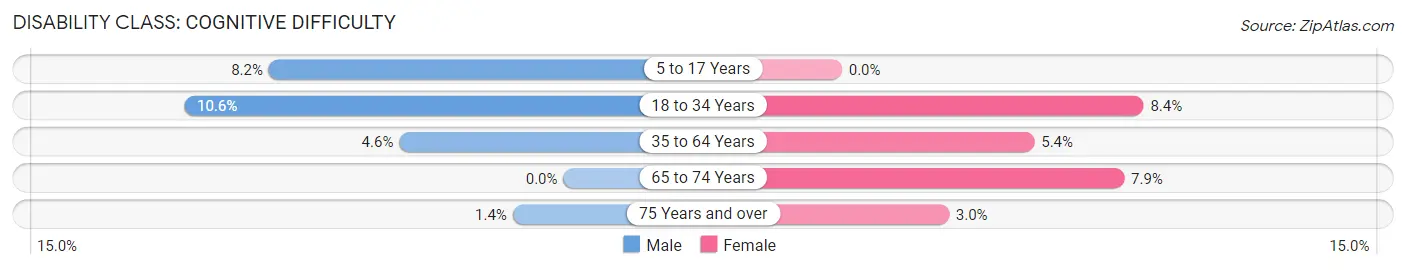
| Age Bracket | Male | Female |
| 5 to 17 Years | 37 (8.2%) | 0 (0.0%) |
| 18 to 34 Years | 73 (10.6%) | 41 (8.4%) |
| 35 to 64 Years | 71 (4.6%) | 78 (5.4%) |
| 65 to 74 Years | 0 (0.0%) | 37 (7.9%) |
| 75 Years and over | 3 (1.4%) | 9 (3.0%) |
Disability Class: Ambulatory Difficulty
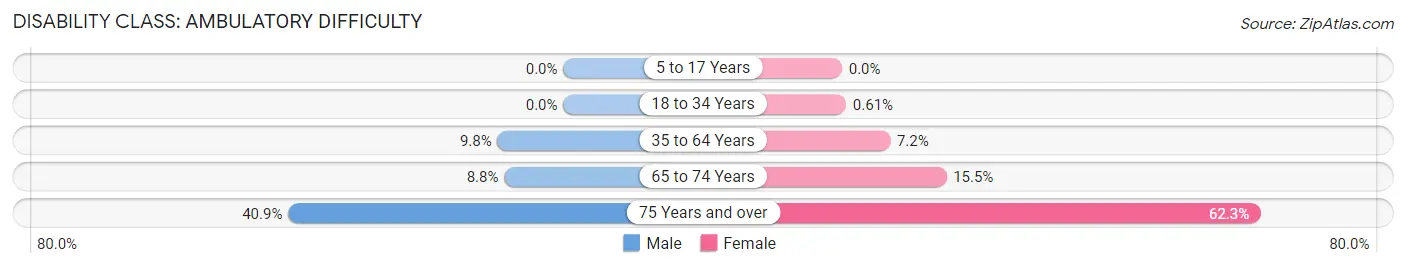
| Age Bracket | Male | Female |
| 5 to 17 Years | 0 (0.0%) | 0 (0.0%) |
| 18 to 34 Years | 0 (0.0%) | 3 (0.6%) |
| 35 to 64 Years | 152 (9.8%) | 104 (7.1%) |
| 65 to 74 Years | 45 (8.8%) | 73 (15.5%) |
| 75 Years and over | 87 (40.8%) | 188 (62.3%) |
Disability Class: Self-Care Difficulty
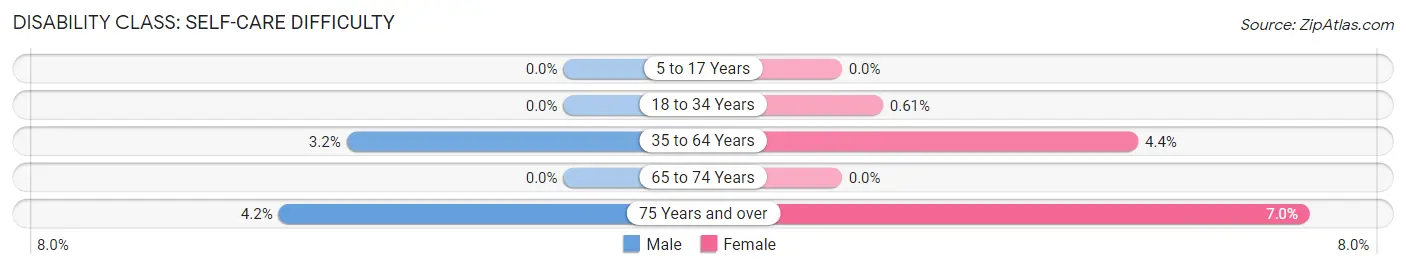
| Age Bracket | Male | Female |
| 5 to 17 Years | 0 (0.0%) | 0 (0.0%) |
| 18 to 34 Years | 0 (0.0%) | 3 (0.6%) |
| 35 to 64 Years | 50 (3.2%) | 64 (4.4%) |
| 65 to 74 Years | 0 (0.0%) | 0 (0.0%) |
| 75 Years and over | 9 (4.2%) | 21 (7.0%) |
Technology Access in Winsted
Computing Device Access in Winsted
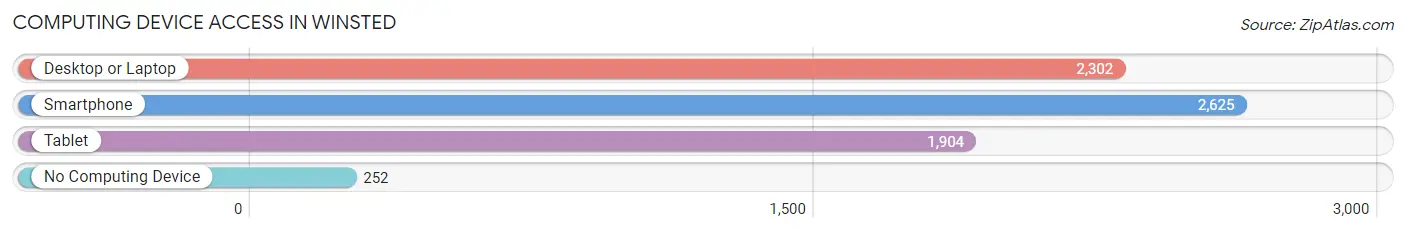
| Device Type | # Households | % Households |
| Desktop or Laptop | 2,302 | 70.0% |
| Smartphone | 2,625 | 79.8% |
| Tablet | 1,904 | 57.9% |
| No Computing Device | 252 | 7.7% |
| Total | 3,291 | 100.0% |
Internet Access in Winsted
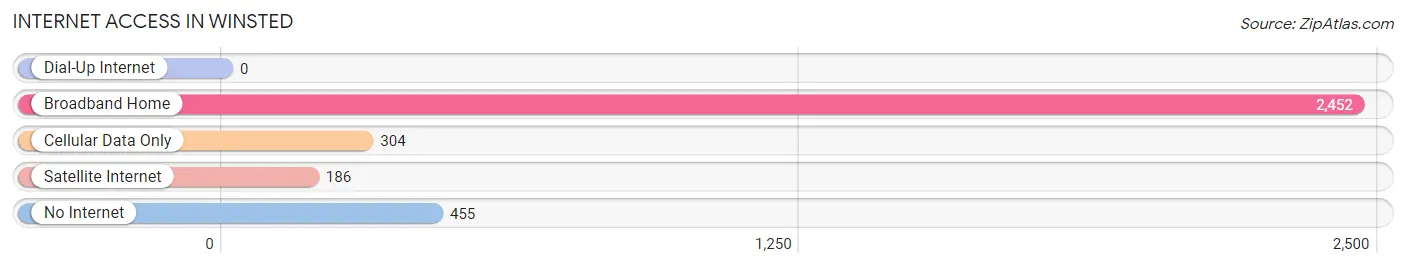
| Internet Type | # Households | % Households |
| Dial-Up Internet | 0 | 0.0% |
| Broadband Home | 2,452 | 74.5% |
| Cellular Data Only | 304 | 9.2% |
| Satellite Internet | 186 | 5.7% |
| No Internet | 455 | 13.8% |
| Total | 3,291 | 100.0% |
Winsted Summary
Winsted is a town located in the northwest corner of Connecticut in the Litchfield Hills region. It is situated in the Housatonic River Valley, and is bordered by the towns of Barkhamsted, Colebrook, Norfolk, and Torrington. The town has a population of 7,321 as of the 2010 census, and is the birthplace of the Winchester Repeating Arms Company, which was founded in 1866.
History
Winsted was first settled in 1750 by a group of settlers from Farmington, Connecticut. The town was originally known as Westfield, but was renamed in 1833 after the Winchester Repeating Arms Company, which was founded in the town in 1866. The company was responsible for the development of the first repeating rifle, and the town was renamed in honor of the company.
The town was an important industrial center during the 19th century, with the Winchester Repeating Arms Company being the largest employer in the area. The company was responsible for the development of the first repeating rifle, and the town was renamed in honor of the company. The company was also responsible for the construction of the first public library in the town, which opened in 1872.
Geography
Winsted is located in the northwest corner of Connecticut in the Litchfield Hills region. It is situated in the Housatonic River Valley, and is bordered by the towns of Barkhamsted, Colebrook, Norfolk, and Torrington. The town has a total area of 11.2 square miles, of which 10.9 square miles is land and 0.3 square miles is water.
The town is located in the Housatonic River Valley, and is surrounded by hills and mountains. The highest point in the town is the summit of East Mountain, which has an elevation of 1,717 feet. The town is also home to the Winchester Reservoir, which is a popular destination for fishing and boating.
Economy
Winsted is home to a variety of businesses and industries, including manufacturing, retail, and tourism. The town is home to several manufacturing companies, including the Winchester Repeating Arms Company, which is the largest employer in the town. The company is responsible for the production of firearms and ammunition, and has been in operation since 1866.
The town is also home to several retail businesses, including a variety of restaurants, shops, and stores. The town is also home to several tourist attractions, including the Winchester Reservoir, which is a popular destination for fishing and boating.
Demographics
As of the 2010 census, the town had a population of 7,321. The racial makeup of the town was 94.2% White, 1.7% African American, 0.3% Native American, 0.9% Asian, 0.1% Pacific Islander, 1.2% from other races, and 1.6% from two or more races. Hispanic or Latino of any race were 4.2% of the population.
The median household income in the town was $50,945, and the median family income was $60,917. The per capita income in the town was $25,945. About 8.2% of families and 10.2% of the population were below the poverty line, including 14.2% of those under age 18 and 6.2% of those age 65 or over.
Common Questions
What is Per Capita Income in Winsted?
Per Capita income in Winsted is $36,436.
What is the Median Family Income in Winsted?
Median Family Income in Winsted is $83,011.
What is the Median Household income in Winsted?
Median Household Income in Winsted is $66,250.
What is Income or Wage Gap in Winsted?
Income or Wage Gap in Winsted is 42.6%.
Women in Winsted earn 57.4 cents for every dollar earned by a man.
What is Family Income Deficit in Winsted?
Family Income Deficit in Winsted is $6,163.
Families that are below poverty line in Winsted earn $6,163 less on average than the poverty threshold level.
What is Inequality or Gini Index in Winsted?
Inequality or Gini Index in Winsted is 0.45.
What is the Total Population of Winsted?
Total Population of Winsted is 6,880.
What is the Total Male Population of Winsted?
Total Male Population of Winsted is 3,562.
What is the Total Female Population of Winsted?
Total Female Population of Winsted is 3,318.
What is the Ratio of Males per 100 Females in Winsted?
There are 107.35 Males per 100 Females in Winsted.
What is the Ratio of Females per 100 Males in Winsted?
There are 93.15 Females per 100 Males in Winsted.
What is the Median Population Age in Winsted?
Median Population Age in Winsted is 43.0 Years.
What is the Average Family Size in Winsted
Average Family Size in Winsted is 2.6 People.
What is the Average Household Size in Winsted
Average Household Size in Winsted is 2.1 People.
How Large is the Labor Force in Winsted?
There are 3,737 People in the Labor Forcein in Winsted.
What is the Percentage of People in the Labor Force in Winsted?
64.1% of People are in the Labor Force in Winsted.
What is the Unemployment Rate in Winsted?
Unemployment Rate in Winsted is 6.3%.