Cities with the Highest Percentage of Households With One or more Vehicles in Connecticut
RELATED REPORTS & OPTIONS
Households with 1 or more Cars
Connecticut
Compare Cities
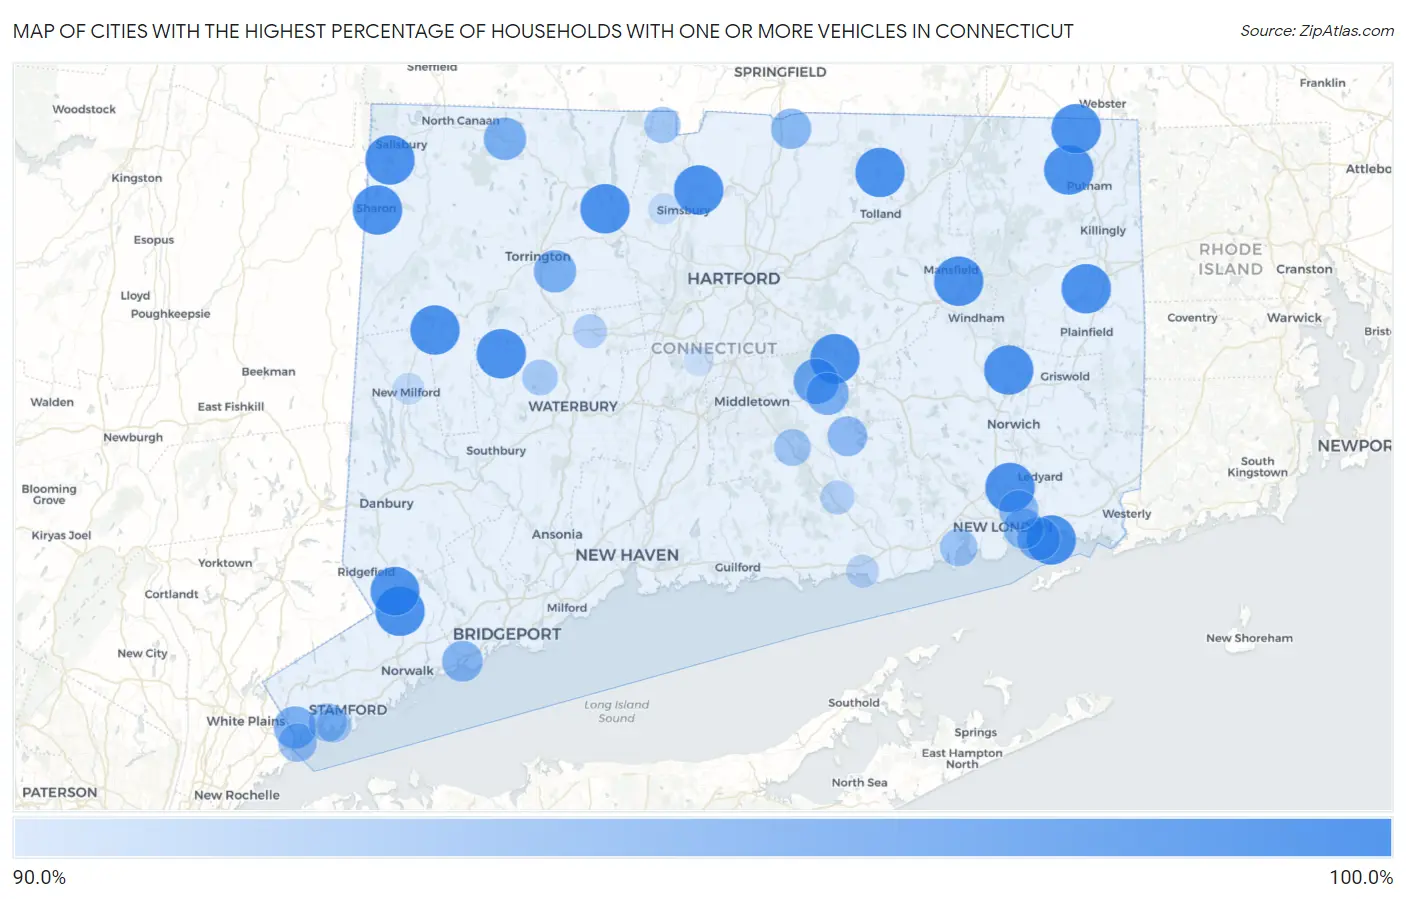
Map of Cities with the Highest Percentage of Households With One or more Vehicles in Connecticut
0.0%
100.0%
Cities with the Highest Percentage of Households With One or more Vehicles in Connecticut
| City | Housholds With 1+ Cars | vs State | vs National | |
| 1. | Coleytown | 100.0% | 91.5%(+8.50)#1 | 91.7%(+8.30)#21 |
| 2. | Mill Plain | 100.0% | 91.5%(+8.50)#2 | 91.7%(+8.30)#63 |
| 3. | Sharon | 100.0% | 91.5%(+8.50)#3 | 91.7%(+8.30)#293 |
| 4. | Riverton | 100.0% | 91.5%(+8.50)#4 | 91.7%(+8.30)#333 |
| 5. | Fenwick Borough | 100.0% | 91.5%(+8.50)#5 | 91.7%(+8.30)#700 |
| 6. | Fairfield University | 100.0% | 91.5%(+8.50)#6 | 91.7%(+8.30)#915 |
| 7. | Bethlehem Village | 100.0% | 91.5%(+8.50)#7 | 91.7%(+8.30)#1,064 |
| 8. | Crystal Lake | 100.0% | 91.5%(+8.50)#8 | 91.7%(+8.30)#1,072 |
| 9. | Tariffville | 100.0% | 91.5%(+8.50)#9 | 91.7%(+8.30)#1,136 |
| 10. | Noank | 100.0% | 91.5%(+8.50)#10 | 91.7%(+8.30)#1,161 |
| 11. | Lakes East | 100.0% | 91.5%(+8.50)#11 | 91.7%(+8.30)#1,277 |
| 12. | South Wilton | 100.0% | 91.5%(+8.50)#12 | 91.7%(+8.30)#1,289 |
| 13. | South Woodstock | 100.0% | 91.5%(+8.50)#13 | 91.7%(+8.30)#1,293 |
| 14. | Wauregan | 100.0% | 91.5%(+8.50)#14 | 91.7%(+8.30)#1,309 |
| 15. | New Hartford Center | 100.0% | 91.5%(+8.50)#15 | 91.7%(+8.30)#1,331 |
| 16. | Mansfield Center | 100.0% | 91.5%(+8.50)#16 | 91.7%(+8.30)#1,370 |
| 17. | Baltic | 100.0% | 91.5%(+8.50)#17 | 91.7%(+8.30)#1,458 |
| 18. | Gales Ferry | 100.0% | 91.5%(+8.50)#18 | 91.7%(+8.30)#1,475 |
| 19. | New Preston | 100.0% | 91.5%(+8.50)#19 | 91.7%(+8.30)#1,540 |
| 20. | Quinebaug | 100.0% | 91.5%(+8.50)#20 | 91.7%(+8.30)#1,613 |
| 21. | Bigelow Corners | 100.0% | 91.5%(+8.50)#21 | 91.7%(+8.30)#1,624 |
| 22. | Lakeville | 100.0% | 91.5%(+8.50)#22 | 91.7%(+8.30)#1,675 |
| 23. | Plattsville | 100.0% | 91.5%(+8.50)#23 | 91.7%(+8.30)#1,691 |
| 24. | Weston | 100.0% | 91.5%(+8.50)#24 | 91.7%(+8.30)#1,774 |
| 25. | Terramuggus | 100.0% | 91.5%(+8.50)#25 | 91.7%(+8.30)#1,795 |
| 26. | Murray | 100.0% | 91.5%(+8.50)#26 | 91.7%(+8.30)#1,894 |
| 27. | Candlewood Orchards | 100.0% | 91.5%(+8.50)#27 | 91.7%(+8.30)#1,986 |
| 28. | Botsford | 100.0% | 91.5%(+8.50)#28 | 91.7%(+8.30)#2,157 |
| 29. | Mechanicsville | 100.0% | 91.5%(+8.50)#29 | 91.7%(+8.30)#2,229 |
| 30. | Gaylordsville | 100.0% | 91.5%(+8.50)#30 | 91.7%(+8.30)#2,235 |
| 31. | Cannondale | 100.0% | 91.5%(+8.50)#31 | 91.7%(+8.30)#2,252 |
| 32. | Lake Bungee | 100.0% | 91.5%(+8.50)#32 | 91.7%(+8.30)#2,298 |
| 33. | Candlewood Isle | 100.0% | 91.5%(+8.50)#33 | 91.7%(+8.30)#2,422 |
| 34. | West Mountain | 100.0% | 91.5%(+8.50)#34 | 91.7%(+8.30)#2,573 |
| 35. | Rock Ridge | 100.0% | 91.5%(+8.50)#35 | 91.7%(+8.30)#2,596 |
| 36. | Lakeside Woods | 100.0% | 91.5%(+8.50)#36 | 91.7%(+8.30)#2,652 |
| 37. | Witches Woods | 100.0% | 91.5%(+8.50)#37 | 91.7%(+8.30)#2,673 |
| 38. | Pleasant Valley | 100.0% | 91.5%(+8.50)#38 | 91.7%(+8.30)#3,089 |
| 39. | Knollcrest | 100.0% | 91.5%(+8.50)#39 | 91.7%(+8.30)#3,114 |
| 40. | Lake Chaffee | 100.0% | 91.5%(+8.50)#40 | 91.7%(+8.30)#3,125 |
| 41. | Dayville | 100.0% | 91.5%(+8.50)#41 | 91.7%(+8.30)#3,184 |
| 42. | Redding Center | 100.0% | 91.5%(+8.50)#42 | 91.7%(+8.30)#3,377 |
| 43. | Quasset Lake | 100.0% | 91.5%(+8.50)#43 | 91.7%(+8.30)#3,492 |
| 44. | Cornwall Bridge | 100.0% | 91.5%(+8.50)#44 | 91.7%(+8.30)#3,596 |
| 45. | Bogus Hill | 100.0% | 91.5%(+8.50)#45 | 91.7%(+8.30)#3,852 |
| 46. | Topstone | 100.0% | 91.5%(+8.50)#46 | 91.7%(+8.30)#4,056 |
| 47. | Candlewood Knolls | 100.0% | 91.5%(+8.50)#48 | 91.7%(+8.30)#4,143 |
| 48. | Brookfield Center | 100.0% | 91.5%(+8.50)#49 | 91.7%(+8.30)#4,144 |
| 49. | Hawleyville | 100.0% | 91.5%(+8.50)#50 | 91.7%(+8.30)#4,375 |
| 50. | Candlewood Lake Club | 100.0% | 91.5%(+8.50)#51 | 91.7%(+8.30)#4,437 |
| 51. | Sail Harbor | 100.0% | 91.5%(+8.50)#52 | 91.7%(+8.30)#4,464 |
| 52. | Bridgewater | 100.0% | 91.5%(+8.50)#53 | 91.7%(+8.30)#4,487 |
| 53. | Chimney Point | 100.0% | 91.5%(+8.50)#54 | 91.7%(+8.30)#5,031 |
| 54. | Cornwall | 100.0% | 91.5%(+8.50)#55 | 91.7%(+8.30)#5,416 |
| 55. | Sherman | 100.0% | 91.5%(+8.50)#56 | 91.7%(+8.30)#6,445 |
| 56. | Georgetown | 99.9% | 91.5%(+8.40)#57 | 91.7%(+8.20)#7,187 |
| 57. | West Cornwall | 99.9% | 91.5%(+8.40)#58 | 91.7%(+8.20)#7,720 |
| 58. | Stonington Borough | 99.4% | 91.5%(+7.90)#59 | 91.7%(+7.70)#8,216 |
| 59. | Lake Pocotopaug | 99.2% | 91.5%(+7.70)#60 | 91.7%(+7.50)#8,496 |
| 60. | Greens Farms | 99.0% | 91.5%(+7.50)#61 | 91.7%(+7.30)#8,962 |
| 61. | Compo | 98.9% | 91.5%(+7.40)#62 | 91.7%(+7.20)#9,212 |
| 62. | Ball Pond | 98.8% | 91.5%(+7.30)#63 | 91.7%(+7.10)#9,463 |
| 63. | Poquonock Bridge | 98.8% | 91.5%(+7.30)#64 | 91.7%(+7.10)#9,491 |
| 64. | Lakes West | 98.8% | 91.5%(+7.30)#65 | 91.7%(+7.10)#9,492 |
| 65. | Pemberwick | 98.7% | 91.5%(+7.20)#66 | 91.7%(+7.00)#9,685 |
| 66. | Northwest Harwinton | 98.7% | 91.5%(+7.20)#67 | 91.7%(+7.00)#9,686 |
| 67. | East Hampton | 98.7% | 91.5%(+7.20)#68 | 91.7%(+7.00)#9,693 |
| 68. | Norfolk | 98.7% | 91.5%(+7.20)#69 | 91.7%(+7.00)#9,778 |
| 69. | Noroton | 98.6% | 91.5%(+7.10)#70 | 91.7%(+6.90)#9,883 |
| 70. | Old Hill | 98.4% | 91.5%(+6.90)#71 | 91.7%(+6.70)#10,414 |
| 71. | Southport | 98.4% | 91.5%(+6.90)#72 | 91.7%(+6.70)#10,447 |
| 72. | Groton Long Point Borough | 98.4% | 91.5%(+6.90)#73 | 91.7%(+6.70)#10,497 |
| 73. | Sherwood Manor | 98.3% | 91.5%(+6.80)#74 | 91.7%(+6.60)#10,609 |
| 74. | Long Hill | 98.3% | 91.5%(+6.80)#75 | 91.7%(+6.60)#10,617 |
| 75. | Darien Downtown | 98.3% | 91.5%(+6.80)#76 | 91.7%(+6.60)#10,698 |
| 76. | Conning Towers Nautilus Park | 98.2% | 91.5%(+6.70)#77 | 91.7%(+6.50)#10,861 |
| 77. | Noroton Heights | 98.2% | 91.5%(+6.70)#78 | 91.7%(+6.50)#10,906 |
| 78. | Moodus | 98.2% | 91.5%(+6.70)#79 | 91.7%(+6.50)#10,948 |
| 79. | Staples | 98.0% | 91.5%(+6.50)#80 | 91.7%(+6.30)#11,354 |
| 80. | Byram | 98.0% | 91.5%(+6.50)#81 | 91.7%(+6.30)#11,365 |
| 81. | East | 98.0% | 91.5%(+6.50)#82 | 91.7%(+6.30)#11,377 |
| 82. | Inglenook | 98.0% | 91.5%(+6.50)#83 | 91.7%(+6.30)#11,448 |
| 83. | Riverside | 97.9% | 91.5%(+6.40)#84 | 91.7%(+6.20)#11,629 |
| 84. | Niantic | 97.8% | 91.5%(+6.30)#85 | 91.7%(+6.10)#11,903 |
| 85. | Higganum | 97.7% | 91.5%(+6.20)#86 | 91.7%(+6.00)#12,167 |
| 86. | Newtown Borough | 97.6% | 91.5%(+6.10)#87 | 91.7%(+5.90)#12,409 |
| 87. | North Granby | 97.6% | 91.5%(+6.10)#88 | 91.7%(+5.90)#12,424 |
| 88. | Watertown | 97.5% | 91.5%(+6.00)#89 | 91.7%(+5.80)#12,642 |
| 89. | Old Greenwich | 97.4% | 91.5%(+5.90)#90 | 91.7%(+5.70)#12,871 |
| 90. | Stratford Downtown | 97.3% | 91.5%(+5.80)#91 | 91.7%(+5.60)#13,188 |
| 91. | Terryville | 97.2% | 91.5%(+5.70)#92 | 91.7%(+5.50)#13,398 |
| 92. | Chester Center | 97.2% | 91.5%(+5.70)#93 | 91.7%(+5.50)#13,452 |
| 93. | Sandy Hook | 97.1% | 91.5%(+5.60)#94 | 91.7%(+5.40)#13,626 |
| 94. | Woodmont Borough | 97.0% | 91.5%(+5.50)#95 | 91.7%(+5.30)#13,923 |
| 95. | Saybrook Manor | 97.0% | 91.5%(+5.50)#96 | 91.7%(+5.30)#13,937 |
| 96. | Litchfield Borough | 96.9% | 91.5%(+5.40)#97 | 91.7%(+5.20)#14,202 |
| 97. | New Milford | 96.8% | 91.5%(+5.30)#98 | 91.7%(+5.10)#14,375 |
| 98. | West Simsbury | 96.7% | 91.5%(+5.20)#99 | 91.7%(+5.00)#14,681 |
| 99. | Saugatuck | 96.6% | 91.5%(+5.10)#100 | 91.7%(+4.90)#14,905 |
| 100. | Kensington | 96.5% | 91.5%(+5.00)#101 | 91.7%(+4.80)#15,078 |
Common Questions
What are the Top 10 Cities with the Highest Percentage of Households With One or more Vehicles in Connecticut?
Top 10 Cities with the Highest Percentage of Households With One or more Vehicles in Connecticut are:
#1
100.0%
#2
100.0%
#3
100.0%
#4
100.0%
#5
100.0%
#6
100.0%
#7
100.0%
#8
100.0%
#9
100.0%
#10
100.0%
What city has the Highest Percentage of Households With One or more Vehicles in Connecticut?
Sharon has the Highest Percentage of Households With One or more Vehicles in Connecticut with 100.0%.
What is the Percentage of Households With One or more Vehicles in the State of Connecticut?
Percentage of Households With One or more Vehicles in Connecticut is 91.5%.
What is the Percentage of Households With One or more Vehicles in the United States?
Percentage of Households With One or more Vehicles in the United States is 91.7%.