Cities with the Highest Percentage of Immigrants from Ecuador in Connecticut
RELATED REPORTS & OPTIONS
Ecuador
Connecticut
Compare Cities
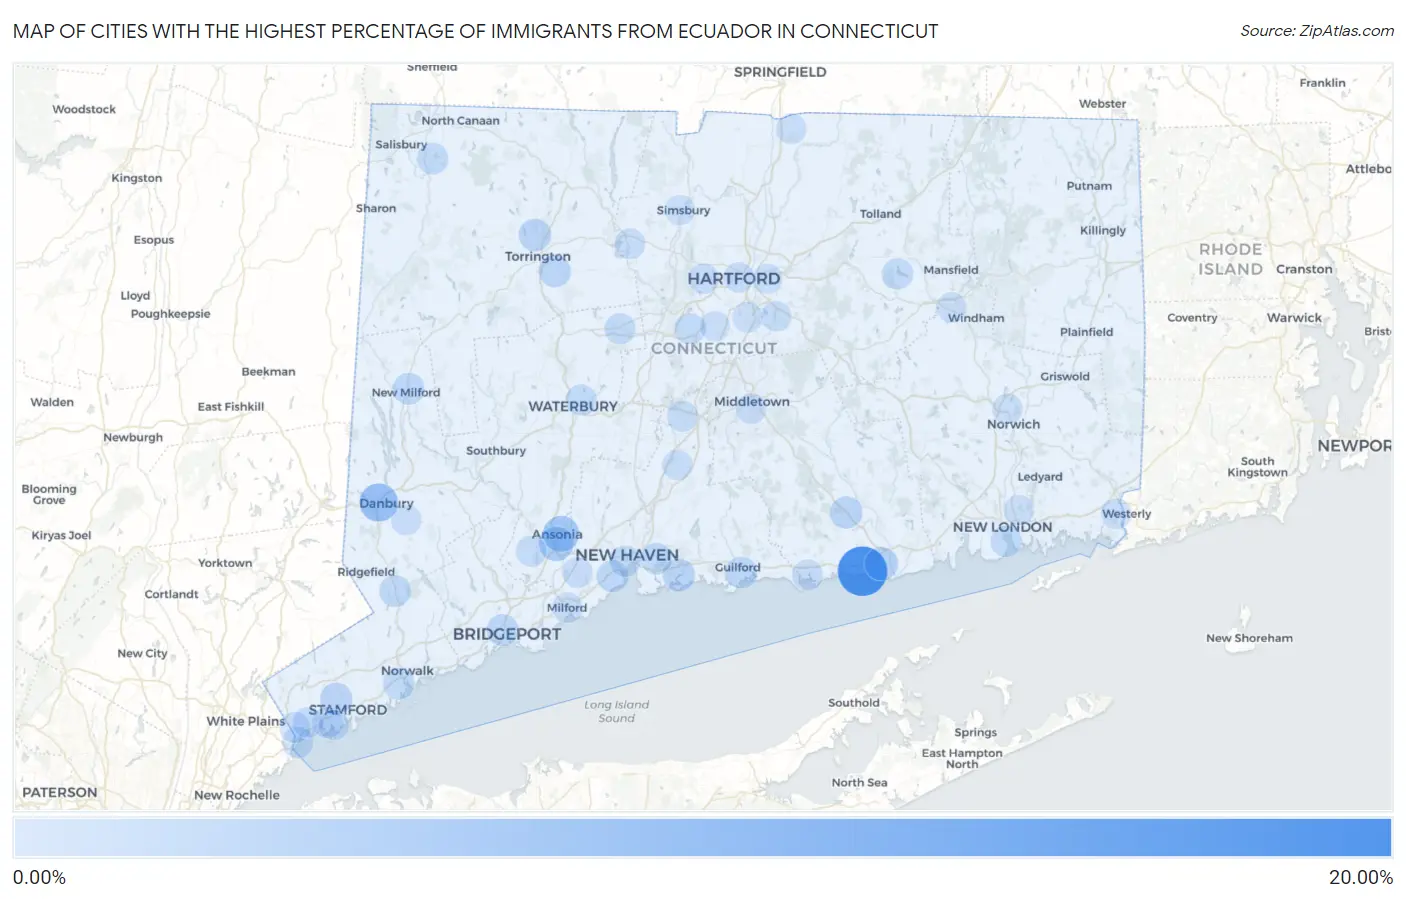
Map of Cities with the Highest Percentage of Immigrants from Ecuador in Connecticut
0.00%
20.00%
Cities with the Highest Percentage of Immigrants from Ecuador in Connecticut
| City | Ecuador | vs State | vs National | |
| 1. | Saybrook Manor | 17.55% | 0.67%(+16.9)#-1 | 0.15%(+17.4)#0 |
| 2. | Danbury | 7.00% | 0.67%(+6.33)#10 | 0.15%(+6.85)#5,016 |
| 3. | Ansonia | 4.93% | 0.67%(+4.26)#31 | 0.15%(+4.78)#9,368 |
| 4. | Derby | 3.88% | 0.67%(+3.21)#32 | 0.15%(+3.73)#9,369 |
| 5. | Old Saybrook Center | 2.73% | 0.67%(+2.06)#33 | 0.15%(+2.58)#9,370 |
| 6. | Torrington | 2.15% | 0.67%(+1.49)#44 | 0.15%(+2.01)#10,579 |
| 7. | Candlewood Isle | 2.14% | 0.67%(+1.48)#45 | 0.15%(+2.00)#10,580 |
| 8. | Branford Center | 2.00% | 0.67%(+1.33)#46 | 0.15%(+1.85)#10,581 |
| 9. | Stamford | 1.87% | 0.67%(+1.20)#47 | 0.15%(+1.72)#10,582 |
| 10. | Ball Pond | 1.86% | 0.67%(+1.19)#48 | 0.15%(+1.71)#10,583 |
| 11. | Deep River Center | 1.85% | 0.67%(+1.19)#49 | 0.15%(+1.71)#10,584 |
| 12. | Northwest Harwinton | 1.75% | 0.67%(+1.08)#50 | 0.15%(+1.60)#10,585 |
| 13. | West Haven | 1.44% | 0.67%(+0.775)#51 | 0.15%(+1.30)#10,586 |
| 14. | New Milford | 1.44% | 0.67%(+0.772)#52 | 0.15%(+1.29)#10,587 |
| 15. | Guilford Center | 1.38% | 0.67%(+0.712)#53 | 0.15%(+1.23)#10,588 |
| 16. | Bridgeport | 1.37% | 0.67%(+0.708)#54 | 0.15%(+1.23)#10,589 |
| 17. | Georgetown | 1.33% | 0.67%(+0.663)#55 | 0.15%(+1.18)#10,590 |
| 18. | Falls Village | 1.27% | 0.67%(+0.603)#56 | 0.15%(+1.12)#10,591 |
| 19. | Norwalk | 1.27% | 0.67%(+0.601)#57 | 0.15%(+1.12)#10,592 |
| 20. | East Haven | 1.23% | 0.67%(+0.562)#58 | 0.15%(+1.08)#10,593 |
| 21. | New London | 1.05% | 0.67%(+0.386)#59 | 0.15%(+0.906)#10,594 |
| 22. | Byram | 1.02% | 0.67%(+0.356)#60 | 0.15%(+0.877)#10,595 |
| 23. | New Haven | 1.00% | 0.67%(+0.334)#61 | 0.15%(+0.854)#10,596 |
| 24. | New Britain | 0.93% | 0.67%(+0.267)#62 | 0.15%(+0.787)#10,597 |
| 25. | Coventry Lake | 0.90% | 0.67%(+0.232)#63 | 0.15%(+0.752)#10,598 |
| 26. | Waterbury | 0.88% | 0.67%(+0.213)#64 | 0.15%(+0.734)#10,599 |
| 27. | Darien Downtown | 0.85% | 0.67%(+0.184)#65 | 0.15%(+0.704)#10,600 |
| 28. | Bristol | 0.83% | 0.67%(+0.162)#66 | 0.15%(+0.682)#10,756 |
| 29. | Pemberwick | 0.68% | 0.67%(+0.020)#67 | 0.15%(+0.540)#10,757 |
| 30. | Clinton | 0.67% | 0.67%(+0.009)#68 | 0.15%(+0.529)#10,758 |
| 31. | Meriden | 0.64% | 0.67%(-0.026)#69 | 0.15%(+0.494)#10,759 |
| 32. | Saugatuck | 0.63% | 0.67%(-0.032)#70 | 0.15%(+0.488)#10,760 |
| 33. | Shelton | 0.53% | 0.67%(-0.136)#71 | 0.15%(+0.384)#10,761 |
| 34. | Noroton | 0.50% | 0.67%(-0.166)#72 | 0.15%(+0.354)#10,762 |
| 35. | Naugatuck Borough | 0.50% | 0.67%(-0.166)#73 | 0.15%(+0.354)#10,944 |
| 36. | Riverside | 0.46% | 0.67%(-0.203)#74 | 0.15%(+0.317)#10,945 |
| 37. | Wallingford Center | 0.44% | 0.67%(-0.228)#75 | 0.15%(+0.292)#10,946 |
| 38. | Bethel | 0.42% | 0.67%(-0.241)#76 | 0.15%(+0.279)#10,947 |
| 39. | Orange | 0.39% | 0.67%(-0.279)#77 | 0.15%(+0.241)#10,948 |
| 40. | Westport | 0.37% | 0.67%(-0.290)#78 | 0.15%(+0.230)#10,949 |
| 41. | Collinsville | 0.37% | 0.67%(-0.292)#79 | 0.15%(+0.228)#10,950 |
| 42. | Pawcatuck | 0.36% | 0.67%(-0.306)#80 | 0.15%(+0.214)#10,951 |
| 43. | Noroton Heights | 0.33% | 0.67%(-0.333)#81 | 0.15%(+0.187)#10,952 |
| 44. | West Hartford | 0.28% | 0.67%(-0.389)#82 | 0.15%(+0.131)#10,953 |
| 45. | Stepney | 0.27% | 0.67%(-0.393)#83 | 0.15%(+0.127)#10,954 |
| 46. | Middletown | 0.24% | 0.67%(-0.422)#84 | 0.15%(+0.098)#11,876 |
| 47. | Milford City Balance | 0.23% | 0.67%(-0.434)#85 | 0.15%(+0.086)#12,340 |
| 48. | Glastonbury Center | 0.23% | 0.67%(-0.439)#86 | 0.15%(+0.081)#12,341 |
| 49. | Trumbull Center | 0.22% | 0.67%(-0.443)#87 | 0.15%(+0.077)#12,342 |
| 50. | Compo | 0.22% | 0.67%(-0.445)#88 | 0.15%(+0.075)#12,343 |
| 51. | Greenwich | 0.21% | 0.67%(-0.452)#89 | 0.15%(+0.068)#12,344 |
| 52. | Sherwood Manor | 0.17% | 0.67%(-0.491)#90 | 0.15%(+0.029)#12,345 |
| 53. | Old Greenwich | 0.16% | 0.67%(-0.509)#91 | 0.15%(+0.011)#12,346 |
| 54. | Hartford | 0.15% | 0.67%(-0.517)#92 | 0.15%(+0.003)#12,347 |
| 55. | Simsbury Center | 0.13% | 0.67%(-0.534)#93 | 0.15%(-0.014)#12,348 |
| 56. | Wethersfield | 0.13% | 0.67%(-0.540)#94 | 0.15%(-0.020)#12,349 |
| 57. | Norwich | 0.12% | 0.67%(-0.548)#95 | 0.15%(-0.028)#12,350 |
| 58. | Newington | 0.049% | 0.67%(-0.616)#96 | 0.15%(-0.096)#12,351 |
| 59. | Willimantic | 0.045% | 0.67%(-0.620)#97 | 0.15%(-0.100)#12,352 |
| 60. | East Hartford | 0.035% | 0.67%(-0.630)#98 | 0.15%(-0.110)#12,353 |
| 61. | Lordship | 0.026% | 0.67%(-0.639)#99 | 0.15%(-0.119)#12,354 |
| 62. | Conning Towers Nautilus Park | 0.024% | 0.67%(-0.641)#100 | 0.15%(-0.121)#12,355 |
1
2Common Questions
What are the Top 10 Cities with the Highest Percentage of Immigrants from Ecuador in Connecticut?
Top 10 Cities with the Highest Percentage of Immigrants from Ecuador in Connecticut are:
#1
17.55%
#2
7.00%
#3
4.93%
#4
3.88%
#5
2.73%
#6
2.15%
#7
2.00%
#8
1.87%
#9
1.85%
#10
1.75%
What city has the Highest Percentage of Immigrants from Ecuador in Connecticut?
Saybrook Manor has the Highest Percentage of Immigrants from Ecuador in Connecticut with 17.55%.
What is the Percentage of Immigrants from Ecuador in the State of Connecticut?
Percentage of Immigrants from Ecuador in Connecticut is 0.67%.
What is the Percentage of Immigrants from Ecuador in the United States?
Percentage of Immigrants from Ecuador in the United States is 0.15%.