Y O Ranch, WY Map & Demographics
Y O Ranch Map
Y O Ranch Overview
$17,712
PER CAPITA INCOME
$65,840
AVG HOUSEHOLD INCOME
0.03
INEQUALITY / GINI INDEX
313
TOTAL POPULATION
133
MALE POPULATION
180
FEMALE POPULATION
73.89
MALES / 100 FEMALES
135.34
FEMALES / 100 MALES
47.2
MEDIAN AGE
4.0
AVG FAMILY SIZE
3.9
AVG HOUSEHOLD SIZE
161
LABOR FORCE [ PEOPLE ]
80.5%
PERCENT IN LABOR FORCE
37.9%
UNEMPLOYMENT RATE
Income in Y O Ranch
Income Overview in Y O Ranch
| Characteristic | Number | Measure |
| Per Capita Income | 313 | $17,712 |
| Median Family Income | 76 | $0 |
| Mean Family Income | 76 | $0 |
| Median Household Income | 81 | $65,840 |
| Mean Household Income | 81 | $62,922 |
| Income Deficit | 76 | $0 |
| Wage / Income Gap (%) | 313 | 0.00% |
| Wage / Income Gap ($) | 313 | 100.00¢ per $1 |
| Gini / Inequality Index | 313 | 0.03 |
Earnings by Sex in Y O Ranch
| Sex | Number | Average Earnings |
| Male | 69 (42.9%) | $0 |
| Female | 92 (57.1%) | $0 |
| Total | 161 (100.0%) | $0 |
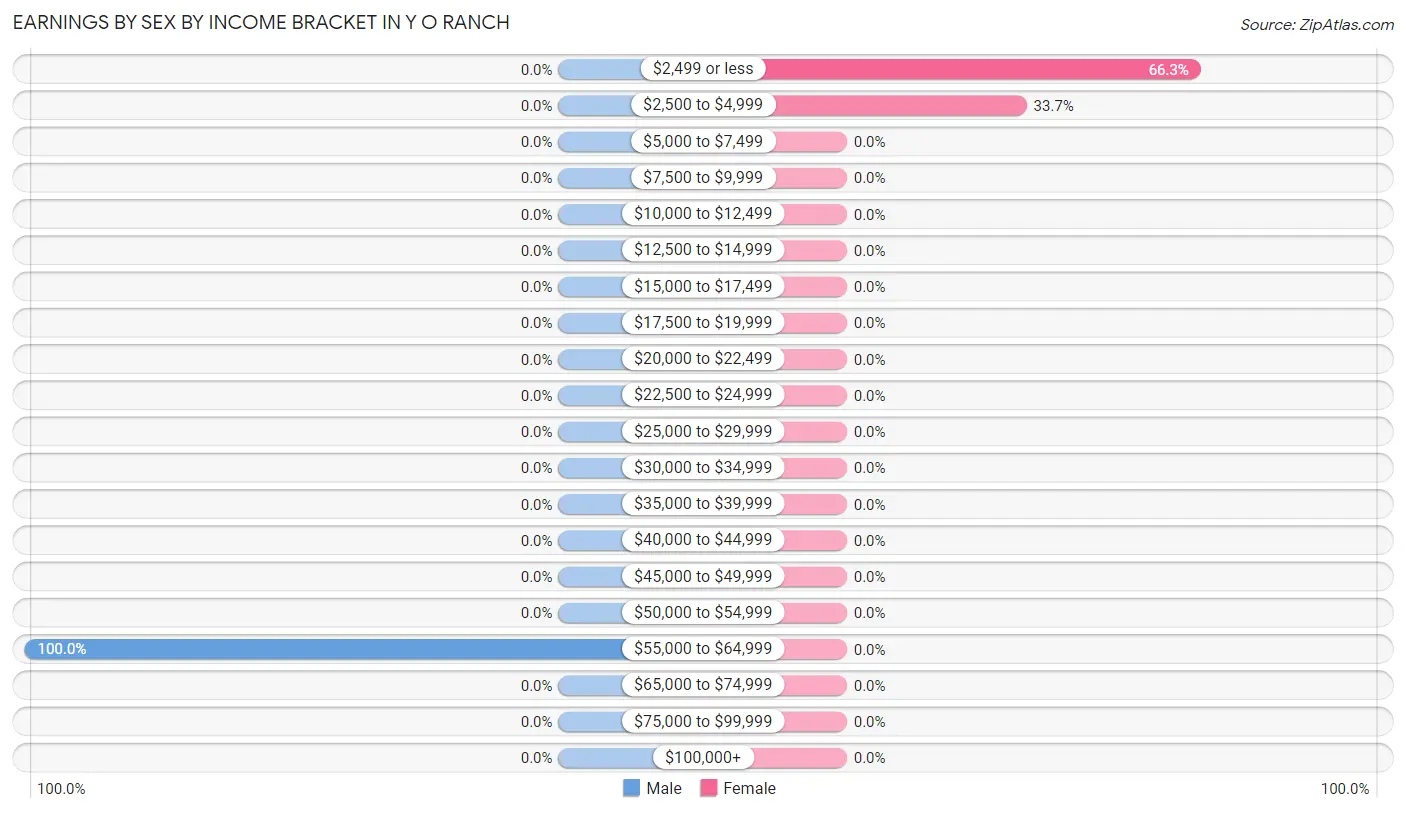
Earnings by Sex by Income Bracket in Y O Ranch
The most common earnings brackets in Y O Ranch are $55,000 to $64,999 for men (69 | 100.0%) and $2,499 or less for women (61 | 66.3%).
| Income | Male | Female |
| $2,499 or less | 0 (0.0%) | 61 (66.3%) |
| $2,500 to $4,999 | 0 (0.0%) | 31 (33.7%) |
| $5,000 to $7,499 | 0 (0.0%) | 0 (0.0%) |
| $7,500 to $9,999 | 0 (0.0%) | 0 (0.0%) |
| $10,000 to $12,499 | 0 (0.0%) | 0 (0.0%) |
| $12,500 to $14,999 | 0 (0.0%) | 0 (0.0%) |
| $15,000 to $17,499 | 0 (0.0%) | 0 (0.0%) |
| $17,500 to $19,999 | 0 (0.0%) | 0 (0.0%) |
| $20,000 to $22,499 | 0 (0.0%) | 0 (0.0%) |
| $22,500 to $24,999 | 0 (0.0%) | 0 (0.0%) |
| $25,000 to $29,999 | 0 (0.0%) | 0 (0.0%) |
| $30,000 to $34,999 | 0 (0.0%) | 0 (0.0%) |
| $35,000 to $39,999 | 0 (0.0%) | 0 (0.0%) |
| $40,000 to $44,999 | 0 (0.0%) | 0 (0.0%) |
| $45,000 to $49,999 | 0 (0.0%) | 0 (0.0%) |
| $50,000 to $54,999 | 0 (0.0%) | 0 (0.0%) |
| $55,000 to $64,999 | 69 (100.0%) | 0 (0.0%) |
| $65,000 to $74,999 | 0 (0.0%) | 0 (0.0%) |
| $75,000 to $99,999 | 0 (0.0%) | 0 (0.0%) |
| $100,000+ | 0 (0.0%) | 0 (0.0%) |
| Total | 69 (100.0%) | 92 (100.0%) |
Earnings by Sex by Educational Attainment in Y O Ranch
| Educational Attainment | Male Income | Female Income |
| Less than High School | - | - |
| High School Diploma | - | - |
| College or Associate's Degree | - | - |
| Bachelor's Degree | - | - |
| Graduate Degree | - | - |
| Total | - | - |
Family Income in Y O Ranch
Family Income Brackets in Y O Ranch
According to the Y O Ranch family income data, there are 76 families falling into the $50,000 to $74,999 income range, which is the most common income bracket and makes up 100.0% of all families.
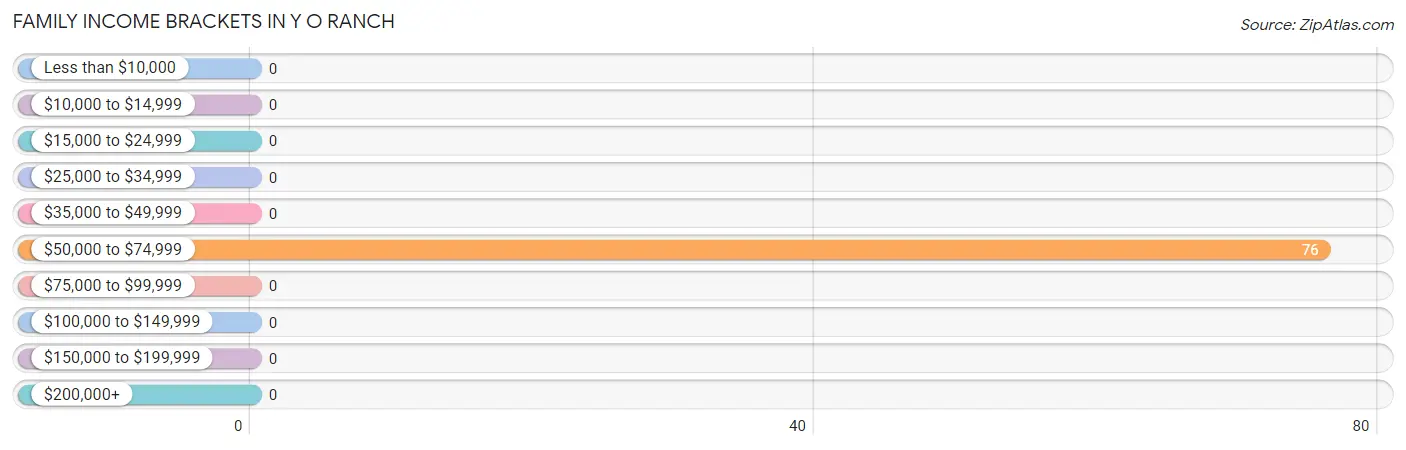
| Income Bracket | # Families | % Families |
| Less than $10,000 | 0 | 0.0% |
| $10,000 to $14,999 | 0 | 0.0% |
| $15,000 to $24,999 | 0 | 0.0% |
| $25,000 to $34,999 | 0 | 0.0% |
| $35,000 to $49,999 | 0 | 0.0% |
| $50,000 to $74,999 | 76 | 100.0% |
| $75,000 to $99,999 | 0 | 0.0% |
| $100,000 to $149,999 | 0 | 0.0% |
| $150,000 to $199,999 | 0 | 0.0% |
| $200,000+ | 0 | 0.0% |
Family Income by Famaliy Size in Y O Ranch
| Income Bracket | # Families | Median Income |
| 2-Person Families | 15 (19.7%) | $0 |
| 3-Person Families | 0 (0.0%) | $0 |
| 4-Person Families | 0 (0.0%) | $0 |
| 5-Person Families | 61 (80.3%) | $0 |
| 6-Person Families | 0 (0.0%) | $0 |
| 7+ Person Families | 0 (0.0%) | $0 |
| Total | 76 (100.0%) | $0 |
Family Income by Number of Earners in Y O Ranch
| Number of Earners | # Families | Median Income |
| No Earners | 15 (19.7%) | $0 |
| 1 Earner | 0 (0.0%) | $0 |
| 2 Earners | 0 (0.0%) | $0 |
| 3+ Earners | 61 (80.3%) | $0 |
| Total | 76 (100.0%) | $0 |
Household Income in Y O Ranch
Household Income Brackets in Y O Ranch
With 76 households falling in the category, the $50,000 to $74,999 income range is the most frequent in Y O Ranch, accounting for 93.8% of all households.
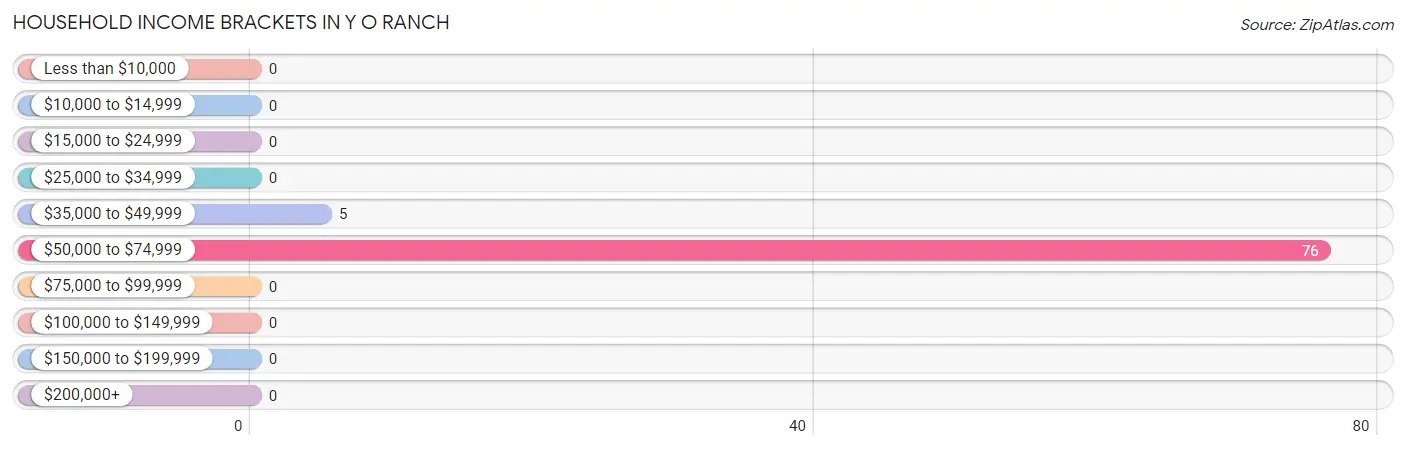
| Income Bracket | # Households | % Households |
| Less than $10,000 | 0 | 0.0% |
| $10,000 to $14,999 | 0 | 0.0% |
| $15,000 to $24,999 | 0 | 0.0% |
| $25,000 to $34,999 | 0 | 0.0% |
| $35,000 to $49,999 | 5 | 6.2% |
| $50,000 to $74,999 | 76 | 93.8% |
| $75,000 to $99,999 | 0 | 0.0% |
| $100,000 to $149,999 | 0 | 0.0% |
| $150,000 to $199,999 | 0 | 0.0% |
| $200,000+ | 0 | 0.0% |
Household Income by Householder Age in Y O Ranch
| Income Bracket | # Households | Median Income |
| 15 to 24 Years | 0 (0.0%) | $0 |
| 25 to 44 Years | 0 (0.0%) | $0 |
| 45 to 64 Years | 61 (75.3%) | $0 |
| 65+ Years | 20 (24.7%) | $0 |
| Total | 81 (100.0%) | $65,840 |
Poverty in Y O Ranch
Income Below Poverty by Sex and Age in Y O Ranch
| Age Bracket | Male | Female |
| Under 5 Years | 0 (0.0%) | 0 (0.0%) |
| 5 Years | 0 (0.0%) | 0 (0.0%) |
| 6 to 11 Years | 0 (0.0%) | 0 (0.0%) |
| 12 to 14 Years | 0 (0.0%) | 0 (0.0%) |
| 15 Years | 0 (0.0%) | 0 (0.0%) |
| 16 and 17 Years | 0 (0.0%) | 0 (0.0%) |
| 18 to 24 Years | 0 (0.0%) | 0 (0.0%) |
| 25 to 34 Years | 0 (0.0%) | 0 (0.0%) |
| 35 to 44 Years | 0 (0.0%) | 0 (0.0%) |
| 45 to 54 Years | 0 (0.0%) | 0 (0.0%) |
| 55 to 64 Years | 0 (0.0%) | 0 (0.0%) |
| 65 to 74 Years | 0 (0.0%) | 0 (0.0%) |
| 75 Years and over | 0 (0.0%) | 0 (0.0%) |
| Total | 0 (0.0%) | 0 (0.0%) |
Income Above Poverty by Sex and Age in Y O Ranch
According to the poverty statistics in Y O Ranch, males aged 6 to 11 years and females aged 6 to 11 years are the age groups that are most secure financially, with 100.0% of males and 100.0% of females in these age groups living above the poverty line.
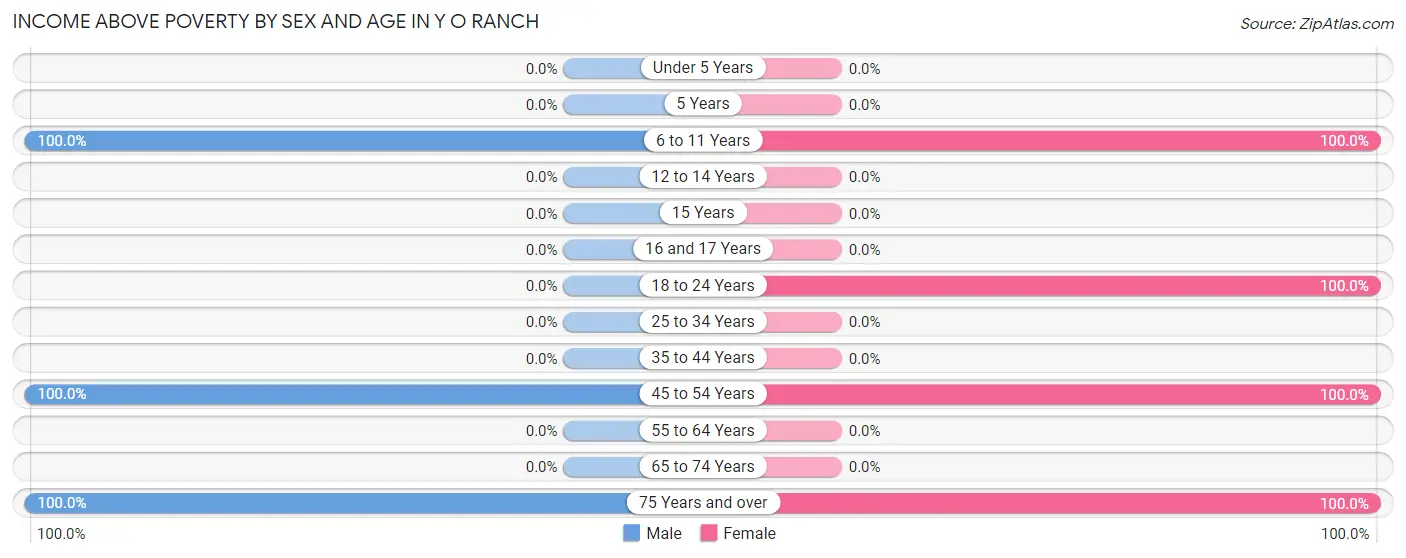
| Age Bracket | Male | Female |
| Under 5 Years | 0 (0.0%) | 0 (0.0%) |
| 5 Years | 0 (0.0%) | 0 (0.0%) |
| 6 to 11 Years | 44 (100.0%) | 69 (100.0%) |
| 12 to 14 Years | 0 (0.0%) | 0 (0.0%) |
| 15 Years | 0 (0.0%) | 0 (0.0%) |
| 16 and 17 Years | 0 (0.0%) | 0 (0.0%) |
| 18 to 24 Years | 0 (0.0%) | 31 (100.0%) |
| 25 to 34 Years | 0 (0.0%) | 0 (0.0%) |
| 35 to 44 Years | 0 (0.0%) | 0 (0.0%) |
| 45 to 54 Years | 69 (100.0%) | 61 (100.0%) |
| 55 to 64 Years | 0 (0.0%) | 0 (0.0%) |
| 65 to 74 Years | 0 (0.0%) | 0 (0.0%) |
| 75 Years and over | 20 (100.0%) | 19 (100.0%) |
| Total | 133 (100.0%) | 180 (100.0%) |
Income Below Poverty Among Married-Couple Families in Y O Ranch
| Children | Above Poverty | Below Poverty |
| No Children | 15 (100.0%) | 0 (0.0%) |
| 1 or 2 Children | 61 (100.0%) | 0 (0.0%) |
| 3 or 4 Children | 0 (0.0%) | 0 (0.0%) |
| 5 or more Children | 0 (0.0%) | 0 (0.0%) |
| Total | 76 (100.0%) | 0 (0.0%) |
Income Below Poverty Among Single-Parent Households in Y O Ranch
| Children | Single Father | Single Mother |
| No Children | 0 (0.0%) | 0 (0.0%) |
| 1 or 2 Children | 0 (0.0%) | 0 (0.0%) |
| 3 or 4 Children | 0 (0.0%) | 0 (0.0%) |
| 5 or more Children | 0 (0.0%) | 0 (0.0%) |
| Total | 0 (0.0%) | 0 (0.0%) |
Income Below Poverty Among Married-Couple vs Single-Parent Households in Y O Ranch
| Children | Married-Couple Families | Single-Parent Households |
| No Children | 0 (0.0%) | 0 (0.0%) |
| 1 or 2 Children | 0 (0.0%) | 0 (0.0%) |
| 3 or 4 Children | 0 (0.0%) | 0 (0.0%) |
| 5 or more Children | 0 (0.0%) | 0 (0.0%) |
| Total | 0 (0.0%) | 0 (0.0%) |
Race in Y O Ranch
The most populous races in Y O Ranch are , and White / Caucasian (313 | 100.0%).
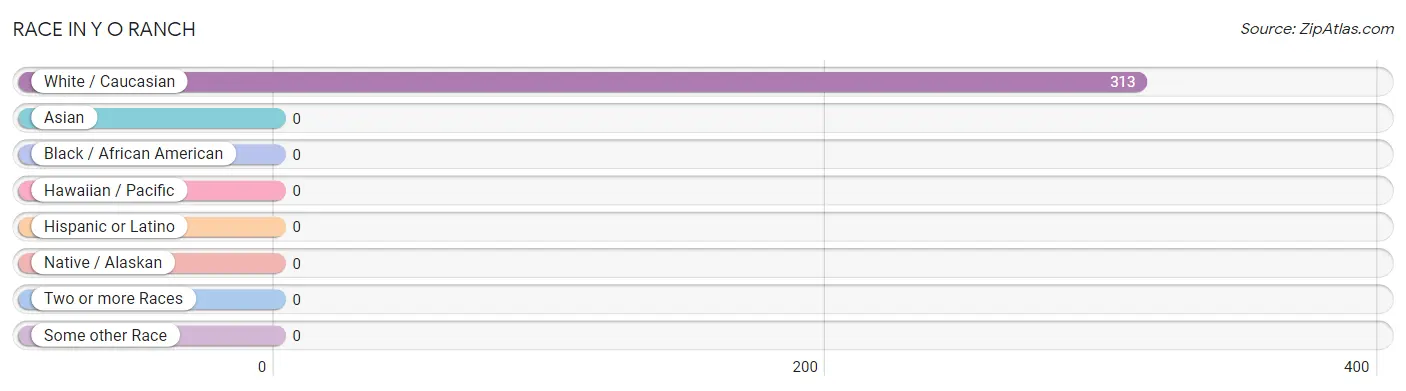
| Race | # Population | % Population |
| Asian | 0 | 0.0% |
| Black / African American | 0 | 0.0% |
| Hawaiian / Pacific | 0 | 0.0% |
| Hispanic or Latino | 0 | 0.0% |
| Native / Alaskan | 0 | 0.0% |
| White / Caucasian | 313 | 100.0% |
| Two or more Races | 0 | 0.0% |
| Some other Race | 0 | 0.0% |
| Total | 313 | 100.0% |
Ancestry in Y O Ranch
The most populous ancestries reported in Y O Ranch are German (205 | 65.5%), Norwegian (136 | 43.4%), English (88 | 28.1%), Scottish (34 | 10.9%), and Dutch (15 | 4.8%), together accounting for 152.7% of all Y O Ranch residents.
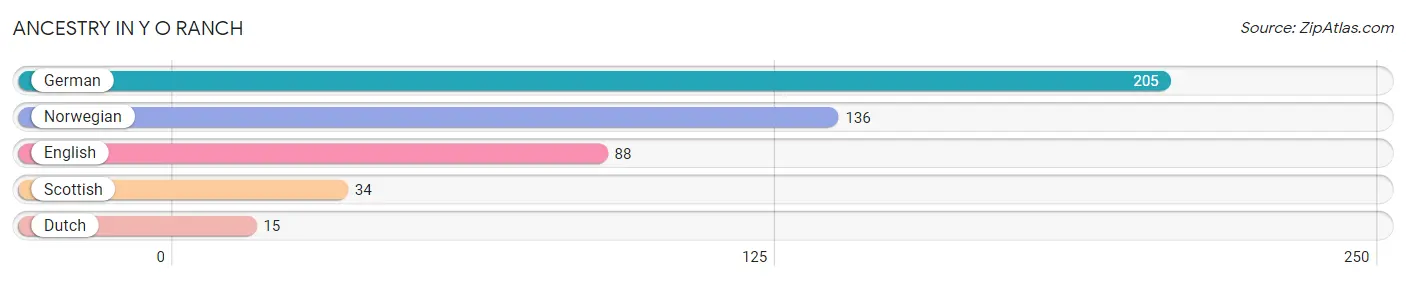
| Ancestry | # Population | % Population |
| Dutch | 15 | 4.8% |
| English | 88 | 28.1% |
| German | 205 | 65.5% |
| Norwegian | 136 | 43.4% |
| Scottish | 34 | 10.9% | View All 5 Rows |
Immigrants in Y O Ranch
The most numerous immigrant groups reported in Y O Ranch came from England (19 | 6.1%), Europe (19 | 6.1%), and Northern Europe (19 | 6.1%), together accounting for 18.2% of all Y O Ranch residents.
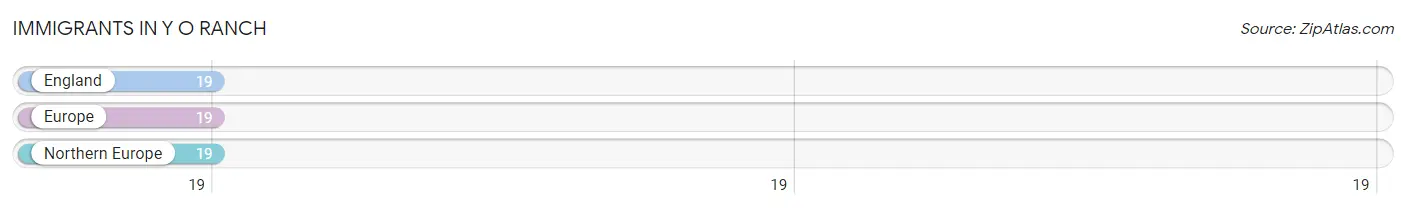
| Immigration Origin | # Population | % Population |
| England | 19 | 6.1% |
| Europe | 19 | 6.1% |
| Northern Europe | 19 | 6.1% | View All 3 Rows |
Sex and Age in Y O Ranch
Sex and Age in Y O Ranch
The most populous age groups in Y O Ranch are 45 to 49 Years (69 | 51.9%) for men and 5 to 9 Years (69 | 38.3%) for women.
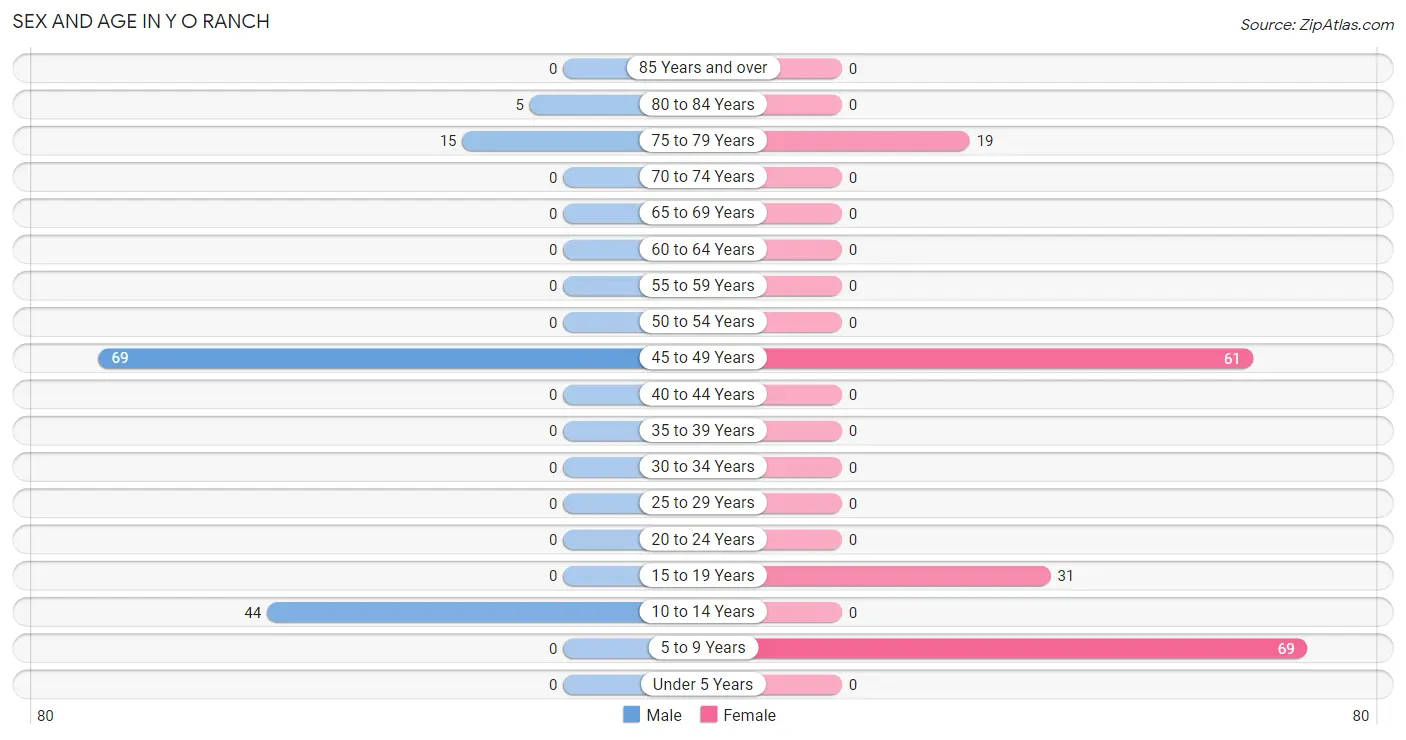
| Age Bracket | Male | Female |
| Under 5 Years | 0 (0.0%) | 0 (0.0%) |
| 5 to 9 Years | 0 (0.0%) | 69 (38.3%) |
| 10 to 14 Years | 44 (33.1%) | 0 (0.0%) |
| 15 to 19 Years | 0 (0.0%) | 31 (17.2%) |
| 20 to 24 Years | 0 (0.0%) | 0 (0.0%) |
| 25 to 29 Years | 0 (0.0%) | 0 (0.0%) |
| 30 to 34 Years | 0 (0.0%) | 0 (0.0%) |
| 35 to 39 Years | 0 (0.0%) | 0 (0.0%) |
| 40 to 44 Years | 0 (0.0%) | 0 (0.0%) |
| 45 to 49 Years | 69 (51.9%) | 61 (33.9%) |
| 50 to 54 Years | 0 (0.0%) | 0 (0.0%) |
| 55 to 59 Years | 0 (0.0%) | 0 (0.0%) |
| 60 to 64 Years | 0 (0.0%) | 0 (0.0%) |
| 65 to 69 Years | 0 (0.0%) | 0 (0.0%) |
| 70 to 74 Years | 0 (0.0%) | 0 (0.0%) |
| 75 to 79 Years | 15 (11.3%) | 19 (10.6%) |
| 80 to 84 Years | 5 (3.8%) | 0 (0.0%) |
| 85 Years and over | 0 (0.0%) | 0 (0.0%) |
| Total | 133 (100.0%) | 180 (100.0%) |
Families and Households in Y O Ranch
Median Family Size in Y O Ranch
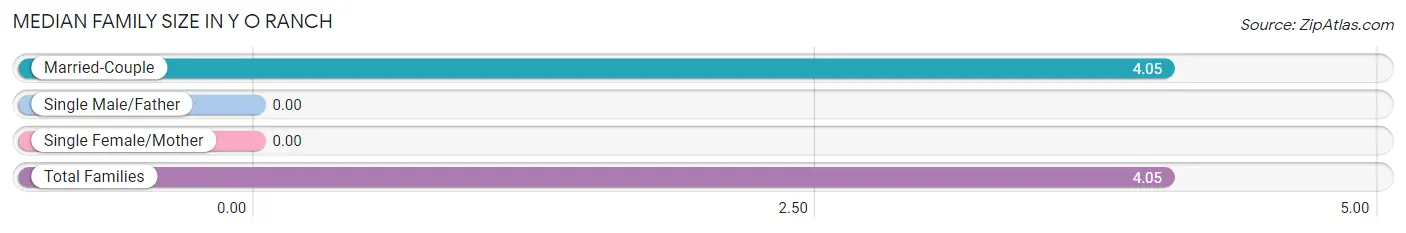
| Family Type | # Families | Family Size |
| Married-Couple | 76 (100.0%) | 4.05 |
| Single Male/Father | 0 (0.0%) | - |
| Single Female/Mother | 0 (0.0%) | - |
| Total Families | 76 (100.0%) | 4.05 |
Median Household Size in Y O Ranch

| Household Type | # Households | Household Size |
| Married-Couple | 76 (93.8%) | 4.05 |
| Single Male/Father | 0 (0.0%) | - |
| Single Female/Mother | 0 (0.0%) | - |
| Non-family | 5 (6.2%) | - |
| Total Households | 81 (100.0%) | 3.86 |
Household Size by Marriage Status in Y O Ranch
Out of a total of 81 households in Y O Ranch, 76 (93.8%) are family households, while 5 (6.2%) are nonfamily households. The most numerous type of family households are 5-person households, comprising 61, and the most common type of nonfamily households are 1-person households, comprising 5.
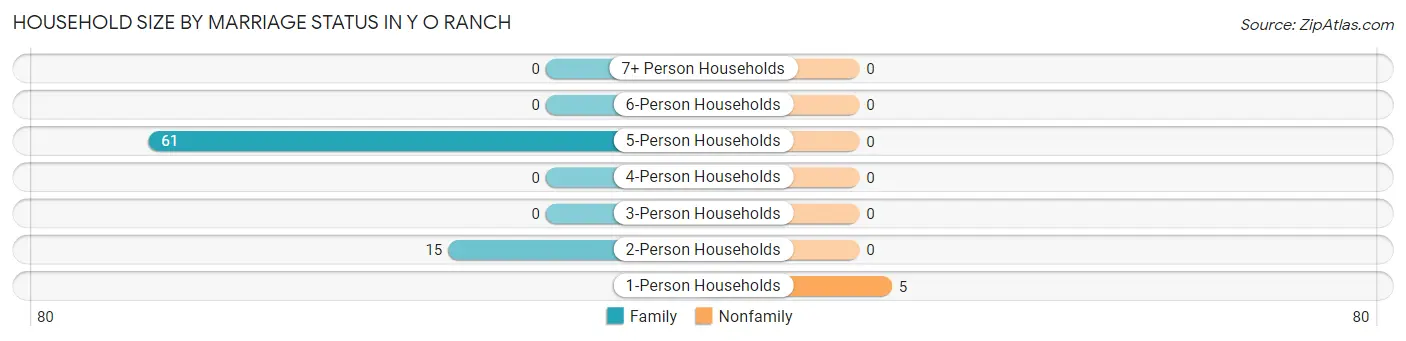
| Household Size | Family Households | Nonfamily Households |
| 1-Person Households | - | 5 (6.2%) |
| 2-Person Households | 15 (18.5%) | 0 (0.0%) |
| 3-Person Households | 0 (0.0%) | 0 (0.0%) |
| 4-Person Households | 0 (0.0%) | 0 (0.0%) |
| 5-Person Households | 61 (75.3%) | 0 (0.0%) |
| 6-Person Households | 0 (0.0%) | 0 (0.0%) |
| 7+ Person Households | 0 (0.0%) | 0 (0.0%) |
| Total | 76 (93.8%) | 5 (6.2%) |
Female Fertility in Y O Ranch
Fertility by Age in Y O Ranch
| Age Bracket | Women with Births | Births / 1,000 Women |
| 15 to 19 years | 0 (0.0%) | 0.0 |
| 20 to 34 years | 0 (0.0%) | 0.0 |
| 35 to 50 years | 0 (0.0%) | 0.0 |
| Total | 0 (0.0%) | 0.0 |
Fertility by Age by Marriage Status in Y O Ranch
| Age Bracket | Married | Unmarried |
| 15 to 19 years | 0 (0.0%) | 0 (0.0%) |
| 20 to 34 years | 0 (0.0%) | 0 (0.0%) |
| 35 to 50 years | 0 (0.0%) | 0 (0.0%) |
| Total | 0 (0.0%) | 0 (0.0%) |
Fertility by Education in Y O Ranch
| Educational Attainment | Women with Births | Births / 1,000 Women |
| Less than High School | 0 (0.0%) | 0.0 |
| High School Diploma | 0 (0.0%) | 0.0 |
| College or Associate's Degree | 0 (0.0%) | 0.0 |
| Bachelor's Degree | 0 (0.0%) | 0.0 |
| Graduate Degree | 0 (0.0%) | 0.0 |
| Total | 0 (0.0%) | 0.0 |
Fertility by Education by Marriage Status in Y O Ranch
| Educational Attainment | Married | Unmarried |
| Less than High School | 0 (0.0%) | 0 (0.0%) |
| High School Diploma | 0 (0.0%) | 0 (0.0%) |
| College or Associate's Degree | 0 (0.0%) | 0 (0.0%) |
| Bachelor's Degree | 0 (0.0%) | 0 (0.0%) |
| Graduate Degree | 0 (0.0%) | 0 (0.0%) |
| Total | 0 (0.0%) | 0 (0.0%) |
Employment Characteristics in Y O Ranch
Employment by Class of Employer in Y O Ranch
Among the 100 employed individuals in Y O Ranch, self-employed (not incorporated) (69 | 69.0%), and private company employees (31 | 31.0%) make up the most common classes of employment.
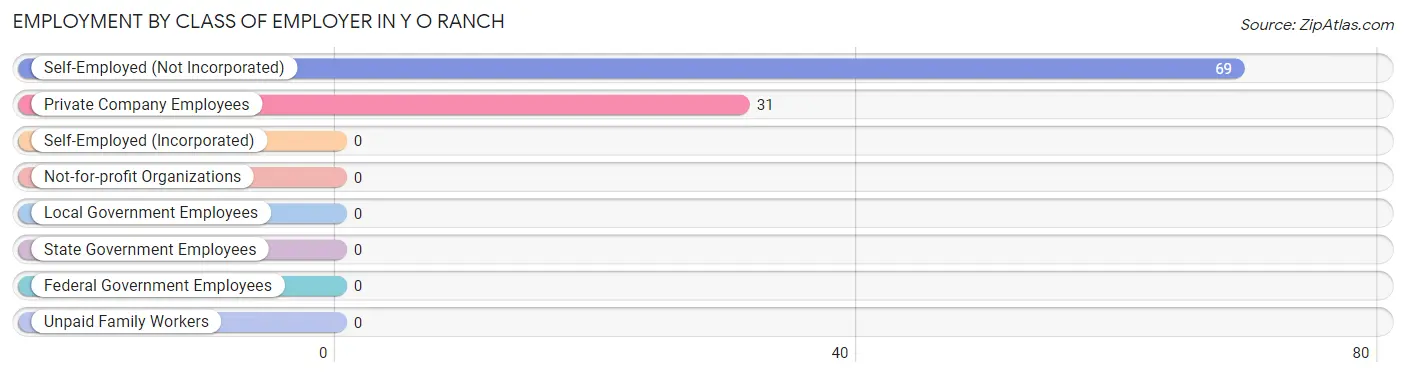
| Employer Class | # Employees | % Employees |
| Private Company Employees | 31 | 31.0% |
| Self-Employed (Incorporated) | 0 | 0.0% |
| Self-Employed (Not Incorporated) | 69 | 69.0% |
| Not-for-profit Organizations | 0 | 0.0% |
| Local Government Employees | 0 | 0.0% |
| State Government Employees | 0 | 0.0% |
| Federal Government Employees | 0 | 0.0% |
| Unpaid Family Workers | 0 | 0.0% |
| Total | 100 | 100.0% |
Employment Status by Age in Y O Ranch
According to the labor force statistics for Y O Ranch, out of the total population over 16 years of age (200), 80.5% or 161 individuals are in the labor force, with 37.9% or 61 of them unemployed. The age group with the highest labor force participation rate is 16 to 19 years, with 100.0% or 31 individuals in the labor force. Within the labor force, the 45 to 54 years age range has the highest percentage of unemployed individuals, with 46.9% or 61 of them being unemployed.
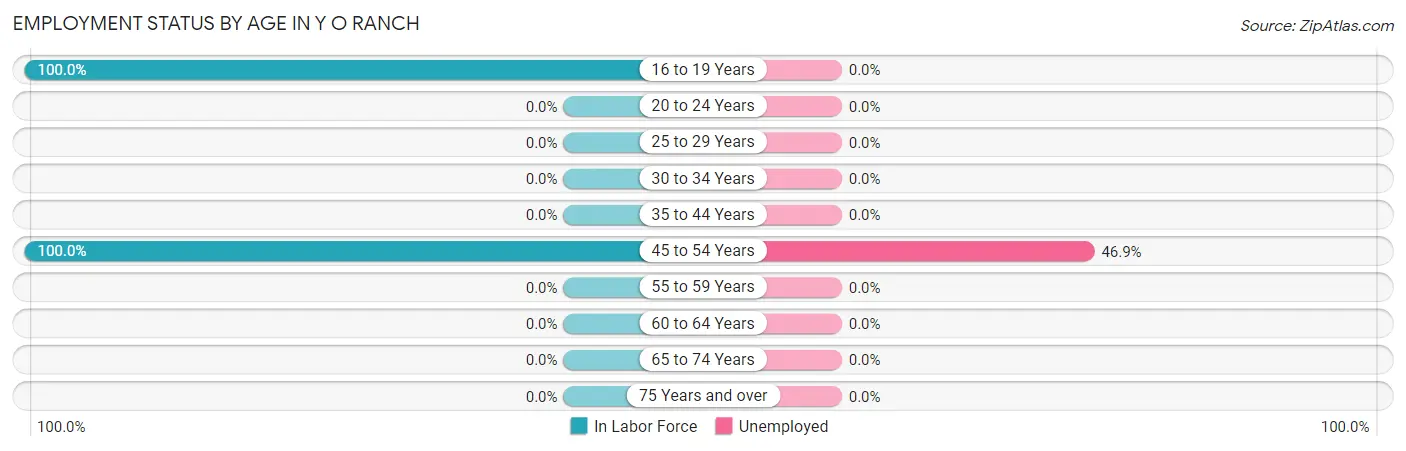
| Age Bracket | In Labor Force | Unemployed |
| 16 to 19 Years | 31 (100.0%) | 0 (0.0%) |
| 20 to 24 Years | 0 (0.0%) | 0 (0.0%) |
| 25 to 29 Years | 0 (0.0%) | 0 (0.0%) |
| 30 to 34 Years | 0 (0.0%) | 0 (0.0%) |
| 35 to 44 Years | 0 (0.0%) | 0 (0.0%) |
| 45 to 54 Years | 130 (100.0%) | 61 (46.9%) |
| 55 to 59 Years | 0 (0.0%) | 0 (0.0%) |
| 60 to 64 Years | 0 (0.0%) | 0 (0.0%) |
| 65 to 74 Years | 0 (0.0%) | 0 (0.0%) |
| 75 Years and over | 0 (0.0%) | 0 (0.0%) |
| Total | 161 (80.5%) | 61 (37.9%) |
Employment Status by Educational Attainment in Y O Ranch
According to labor force statistics for Y O Ranch, 100.0% of individuals (130) out of the total population between 25 and 64 years of age (130) are in the labor force, with 46.9% or 61 of them being unemployed. The group with the highest labor force participation rate are those with the educational attainment of high school diploma, with 100.0% or 69 individuals in the labor force. Within the labor force, individuals with college / associate degree education have the highest percentage of unemployment, with 100.0% or 61 of them being unemployed.
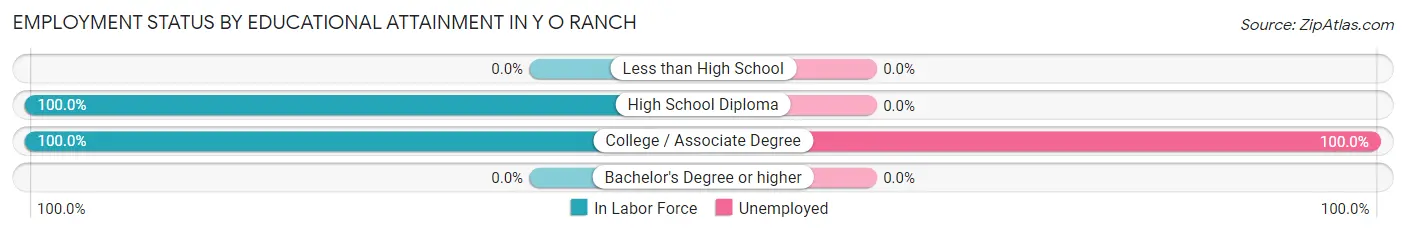
| Educational Attainment | In Labor Force | Unemployed |
| Less than High School | 0 (0.0%) | 0 (0.0%) |
| High School Diploma | 69 (100.0%) | 0 (0.0%) |
| College / Associate Degree | 61 (100.0%) | 61 (100.0%) |
| Bachelor's Degree or higher | 0 (0.0%) | 0 (0.0%) |
| Total | 130 (100.0%) | 61 (46.9%) |
Employment Occupations by Sex in Y O Ranch
Management, Business, Science and Arts Occupations
Management, Business, Science and Arts Occupations by Sex
| Occupation | Male | Female |
| Management | 0 (0.0%) | 0 (0.0%) |
| Business & Financial | 0 (0.0%) | 0 (0.0%) |
| Computers, Engineering & Science | 0 (0.0%) | 0 (0.0%) |
| Computers & Mathematics | 0 (0.0%) | 0 (0.0%) |
| Architecture & Engineering | 0 (0.0%) | 0 (0.0%) |
| Life, Physical & Social Science | 0 (0.0%) | 0 (0.0%) |
| Community & Social Service | 0 (0.0%) | 0 (0.0%) |
| Education, Arts & Media | 0 (0.0%) | 0 (0.0%) |
| Legal Services & Support | 0 (0.0%) | 0 (0.0%) |
| Education Instruction & Library | 0 (0.0%) | 0 (0.0%) |
| Arts, Media & Entertainment | 0 (0.0%) | 0 (0.0%) |
| Health Diagnosing & Treating | 0 (0.0%) | 0 (0.0%) |
| Health Technologists | 0 (0.0%) | 0 (0.0%) |
| Total (Category) | 0 (0.0%) | 0 (0.0%) |
| Total (Overall) | 69 (69.0%) | 31 (31.0%) |
Services Occupations
The most common Services occupations in Y O Ranch are , and Food Preparation & Serving (31 | 31.0%).
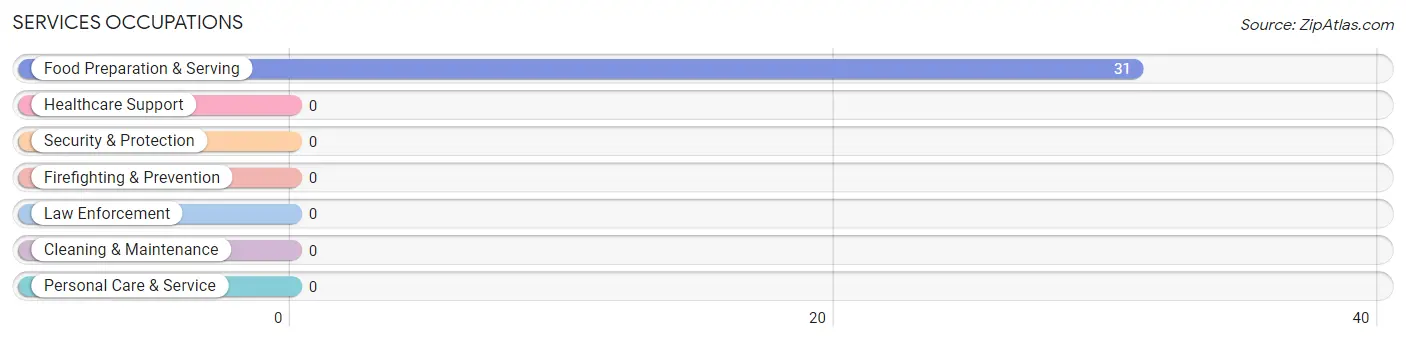
Services Occupations by Sex
| Occupation | Male | Female |
| Healthcare Support | 0 (0.0%) | 0 (0.0%) |
| Security & Protection | 0 (0.0%) | 0 (0.0%) |
| Firefighting & Prevention | 0 (0.0%) | 0 (0.0%) |
| Law Enforcement | 0 (0.0%) | 0 (0.0%) |
| Food Preparation & Serving | 0 (0.0%) | 31 (100.0%) |
| Cleaning & Maintenance | 0 (0.0%) | 0 (0.0%) |
| Personal Care & Service | 0 (0.0%) | 0 (0.0%) |
| Total (Category) | 0 (0.0%) | 31 (100.0%) |
| Total (Overall) | 69 (69.0%) | 31 (31.0%) |
Sales and Office Occupations
Sales and Office Occupations by Sex
| Occupation | Male | Female |
| Sales & Related | 0 (0.0%) | 0 (0.0%) |
| Office & Administration | 0 (0.0%) | 0 (0.0%) |
| Total (Category) | 0 (0.0%) | 0 (0.0%) |
| Total (Overall) | 69 (69.0%) | 31 (31.0%) |
Natural Resources, Construction and Maintenance Occupations
Natural Resources, Construction and Maintenance Occupations by Sex
| Occupation | Male | Female |
| Farming, Fishing & Forestry | 0 (0.0%) | 0 (0.0%) |
| Construction & Extraction | 0 (0.0%) | 0 (0.0%) |
| Installation, Maintenance & Repair | 0 (0.0%) | 0 (0.0%) |
| Total (Category) | 0 (0.0%) | 0 (0.0%) |
| Total (Overall) | 69 (69.0%) | 31 (31.0%) |
Production, Transportation and Moving Occupations
The most common Production, Transportation and Moving occupations in Y O Ranch are , and Transportation (69 | 69.0%).
Production, Transportation and Moving Occupations by Sex
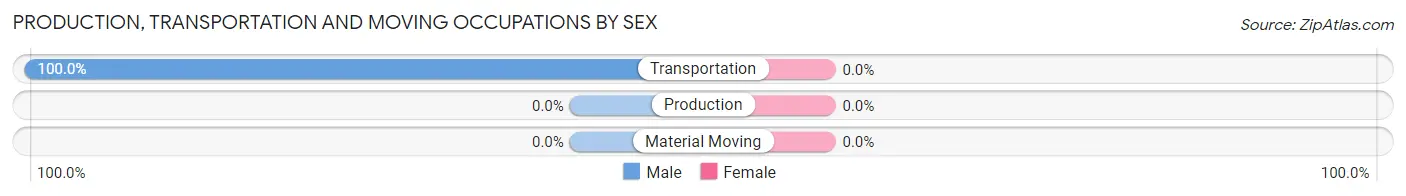
| Occupation | Male | Female |
| Production | 0 (0.0%) | 0 (0.0%) |
| Transportation | 69 (100.0%) | 0 (0.0%) |
| Material Moving | 0 (0.0%) | 0 (0.0%) |
| Total (Category) | 69 (100.0%) | 0 (0.0%) |
| Total (Overall) | 69 (69.0%) | 31 (31.0%) |
Employment Industries by Sex in Y O Ranch
Employment Industries in Y O Ranch
The major employment industries in Y O Ranch include Transportation & Warehousing (69 | 69.0%), and Accommodation & Food Services (31 | 31.0%).
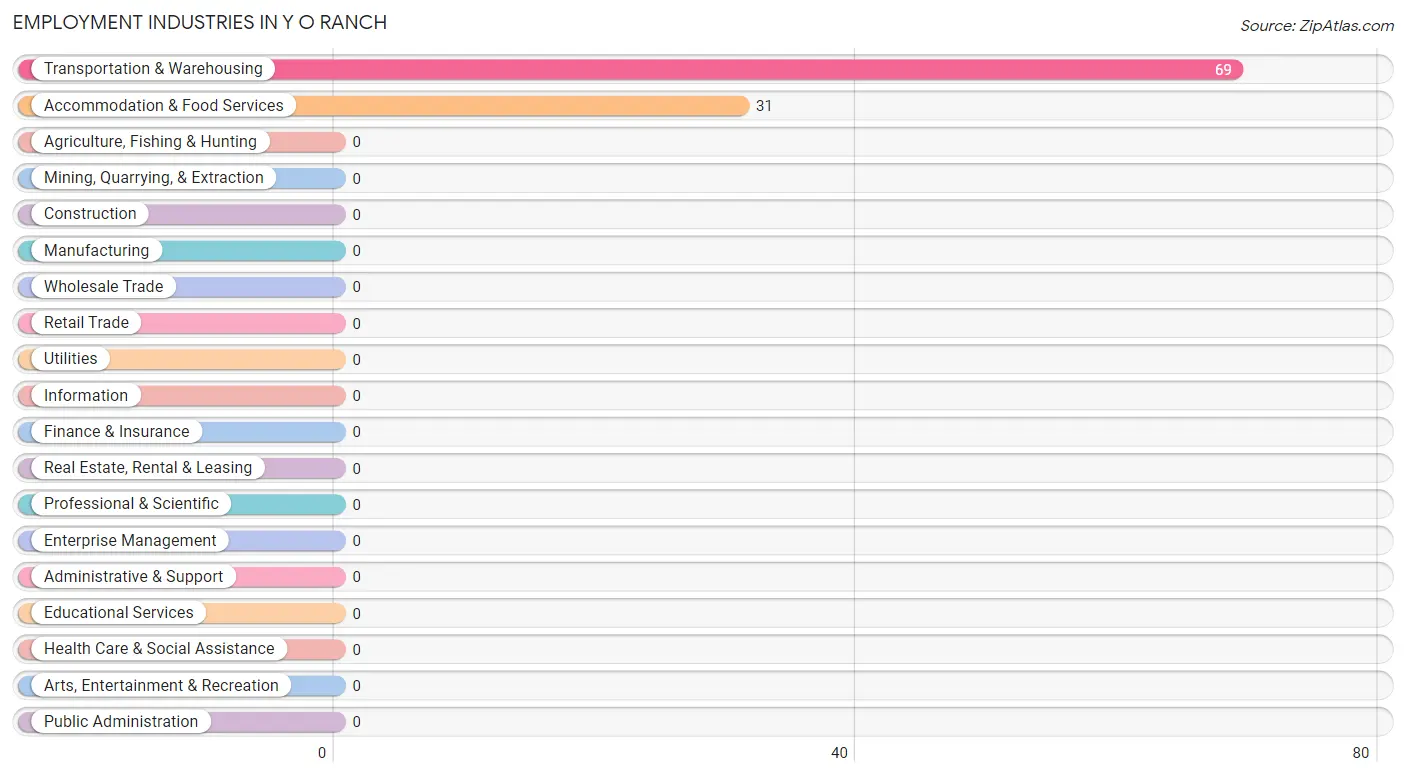
Employment Industries by Sex in Y O Ranch
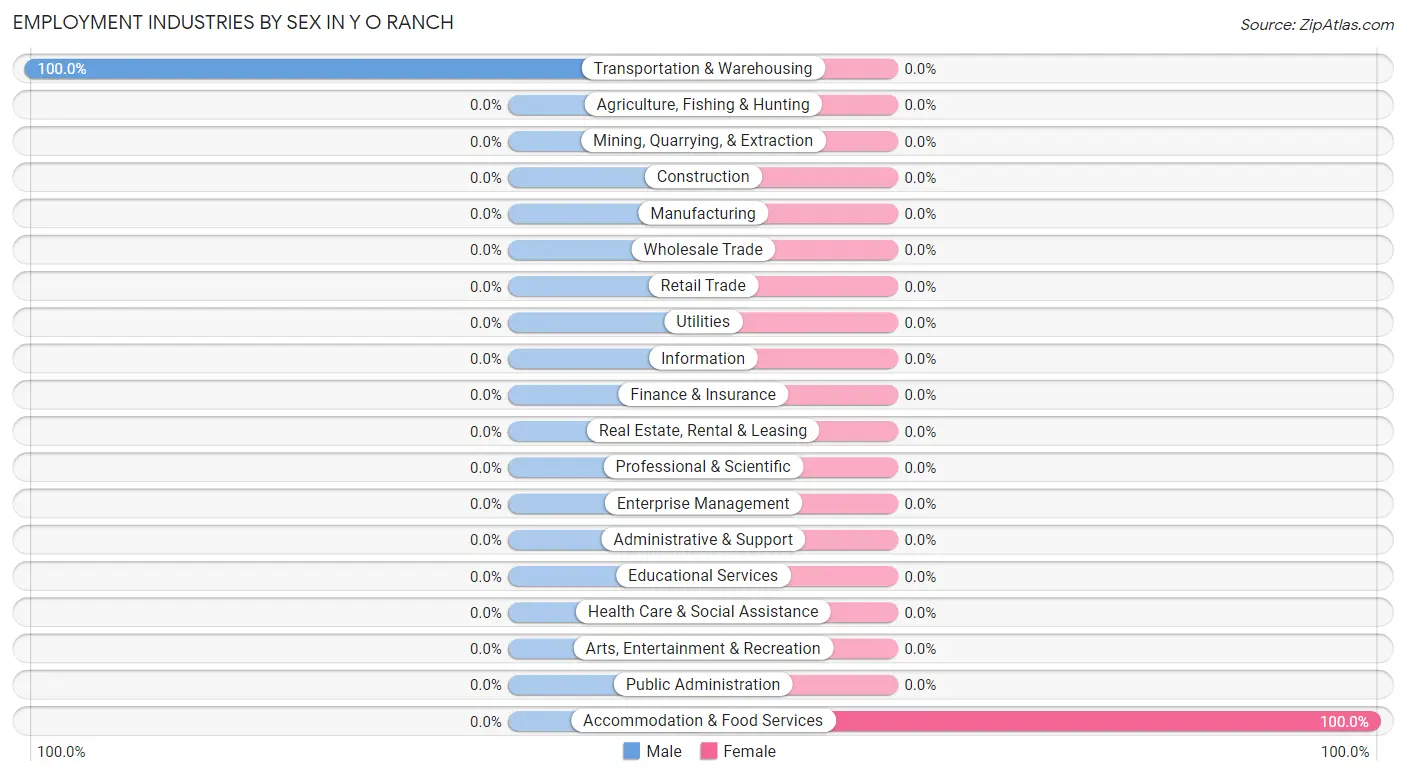
| Industry | Male | Female |
| Agriculture, Fishing & Hunting | 0 (0.0%) | 0 (0.0%) |
| Mining, Quarrying, & Extraction | 0 (0.0%) | 0 (0.0%) |
| Construction | 0 (0.0%) | 0 (0.0%) |
| Manufacturing | 0 (0.0%) | 0 (0.0%) |
| Wholesale Trade | 0 (0.0%) | 0 (0.0%) |
| Retail Trade | 0 (0.0%) | 0 (0.0%) |
| Transportation & Warehousing | 69 (100.0%) | 0 (0.0%) |
| Utilities | 0 (0.0%) | 0 (0.0%) |
| Information | 0 (0.0%) | 0 (0.0%) |
| Finance & Insurance | 0 (0.0%) | 0 (0.0%) |
| Real Estate, Rental & Leasing | 0 (0.0%) | 0 (0.0%) |
| Professional & Scientific | 0 (0.0%) | 0 (0.0%) |
| Enterprise Management | 0 (0.0%) | 0 (0.0%) |
| Administrative & Support | 0 (0.0%) | 0 (0.0%) |
| Educational Services | 0 (0.0%) | 0 (0.0%) |
| Health Care & Social Assistance | 0 (0.0%) | 0 (0.0%) |
| Arts, Entertainment & Recreation | 0 (0.0%) | 0 (0.0%) |
| Accommodation & Food Services | 0 (0.0%) | 31 (100.0%) |
| Public Administration | 0 (0.0%) | 0 (0.0%) |
| Total | 69 (69.0%) | 31 (31.0%) |
Education in Y O Ranch
School Enrollment in Y O Ranch
The most common levels of schooling among the 144 students in Y O Ranch are elementary school (69 | 47.9%), middle school (44 | 30.6%), and high school (31 | 21.5%).
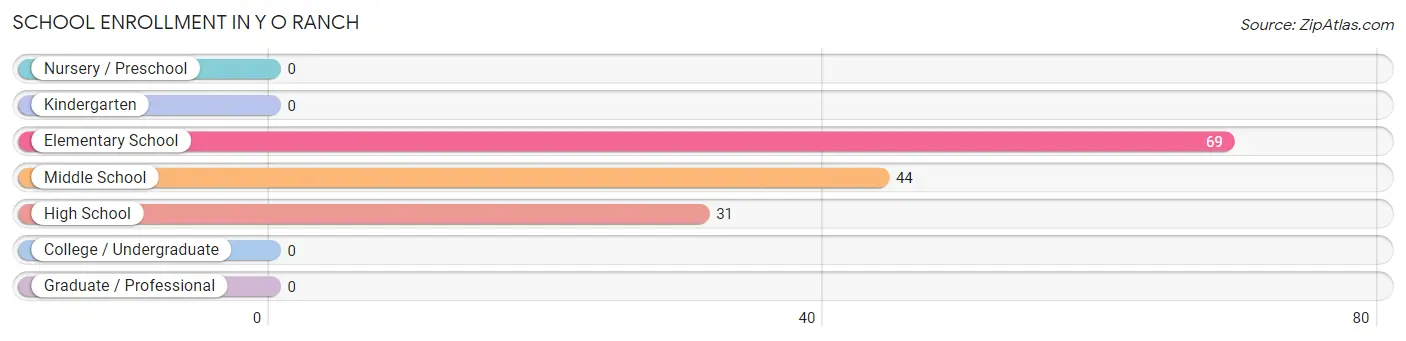
| School Level | # Students | % Students |
| Nursery / Preschool | 0 | 0.0% |
| Kindergarten | 0 | 0.0% |
| Elementary School | 69 | 47.9% |
| Middle School | 44 | 30.6% |
| High School | 31 | 21.5% |
| College / Undergraduate | 0 | 0.0% |
| Graduate / Professional | 0 | 0.0% |
| Total | 144 | 100.0% |
School Enrollment by Age by Funding Source in Y O Ranch
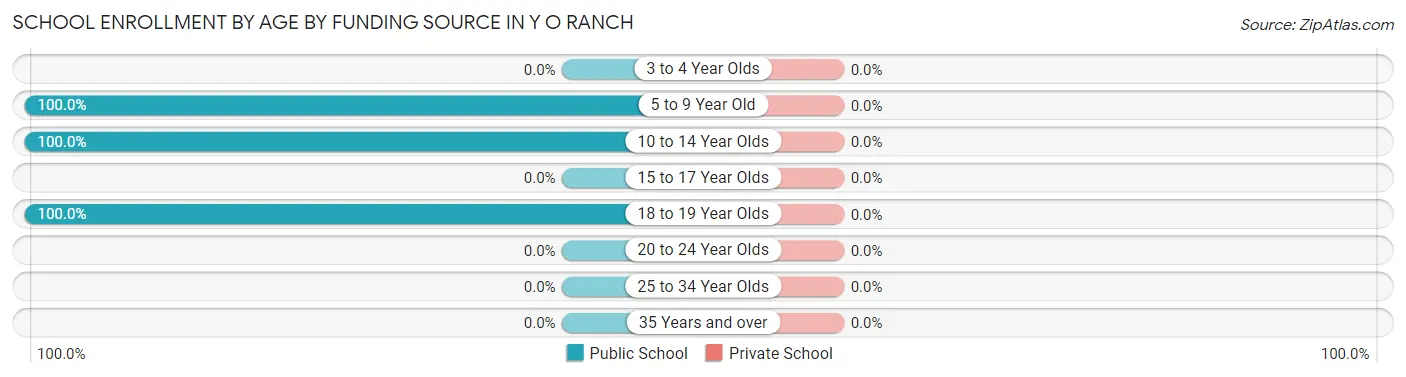
| Age Bracket | Public School | Private School |
| 3 to 4 Year Olds | 0 (0.0%) | 0 (0.0%) |
| 5 to 9 Year Old | 69 (100.0%) | 0 (0.0%) |
| 10 to 14 Year Olds | 44 (100.0%) | 0 (0.0%) |
| 15 to 17 Year Olds | 0 (0.0%) | 0 (0.0%) |
| 18 to 19 Year Olds | 31 (100.0%) | 0 (0.0%) |
| 20 to 24 Year Olds | 0 (0.0%) | 0 (0.0%) |
| 25 to 34 Year Olds | 0 (0.0%) | 0 (0.0%) |
| 35 Years and over | 0 (0.0%) | 0 (0.0%) |
| Total | 144 (100.0%) | 0 (0.0%) |
Educational Attainment by Field of Study in Y O Ranch
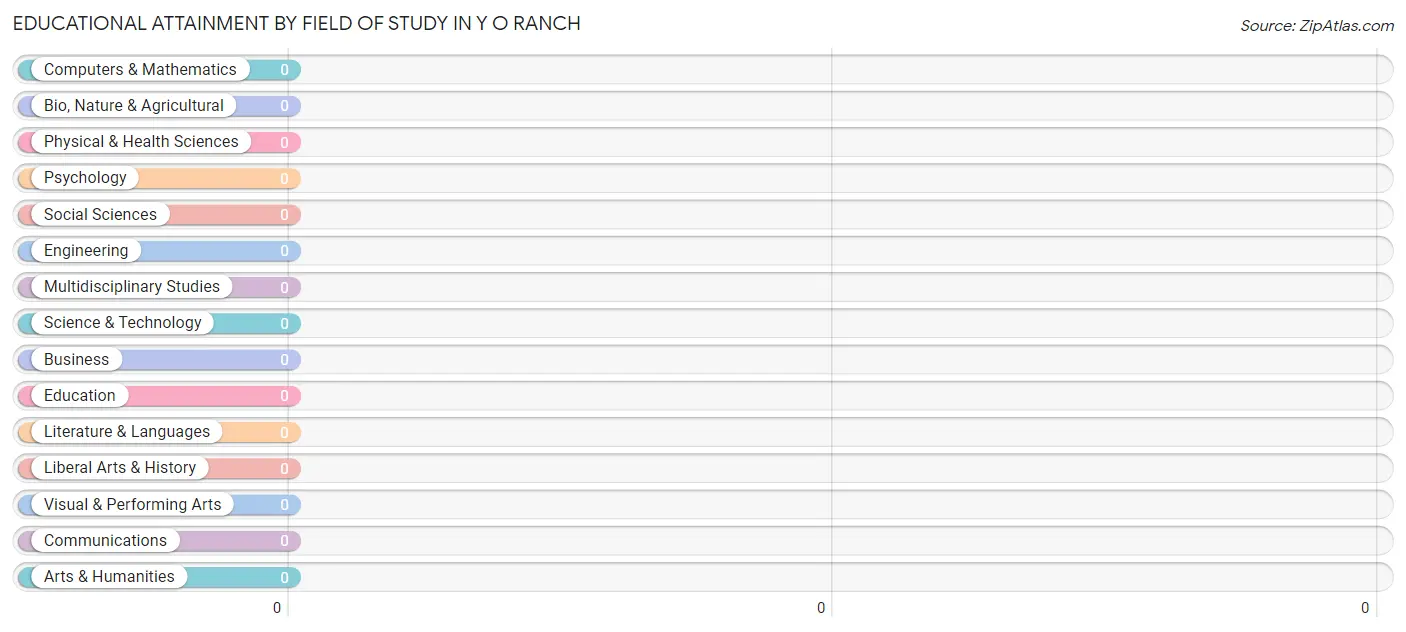
| Field of Study | # Graduates | % Graduates |
| Computers & Mathematics | 0 | 0.0% |
| Bio, Nature & Agricultural | 0 | 0.0% |
| Physical & Health Sciences | 0 | 0.0% |
| Psychology | 0 | 0.0% |
| Social Sciences | 0 | 0.0% |
| Engineering | 0 | 0.0% |
| Multidisciplinary Studies | 0 | 0.0% |
| Science & Technology | 0 | 0.0% |
| Business | 0 | 0.0% |
| Education | 0 | 0.0% |
| Literature & Languages | 0 | 0.0% |
| Liberal Arts & History | 0 | 0.0% |
| Visual & Performing Arts | 0 | 0.0% |
| Communications | 0 | 0.0% |
| Arts & Humanities | 0 | 0.0% |
| Total | 0 | 0.0% |
Transportation & Commute in Y O Ranch
Vehicle Availability by Sex in Y O Ranch
The most prevalent vehicle ownership categories in Y O Ranch are males with 3 vehicles (69, accounting for 100.0%) and females with 3 vehicles (31, making up 222.6%).
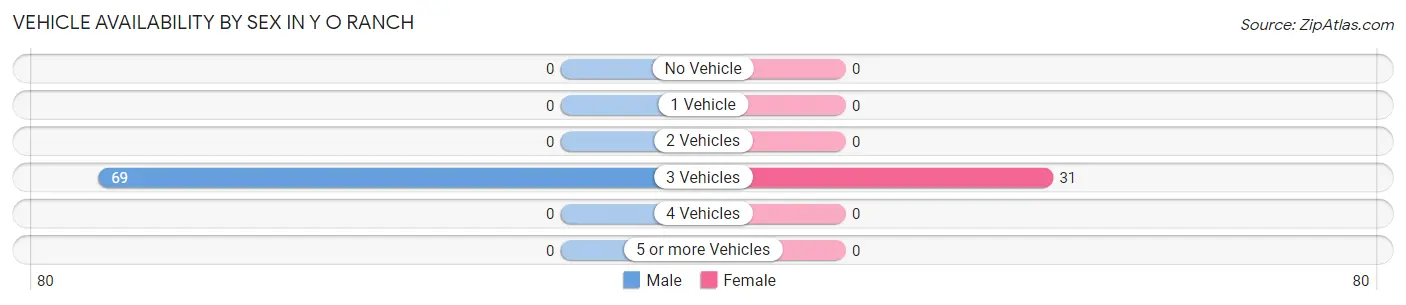
| Vehicles Available | Male | Female |
| No Vehicle | 0 (0.0%) | 0 (0.0%) |
| 1 Vehicle | 0 (0.0%) | 0 (0.0%) |
| 2 Vehicles | 0 (0.0%) | 0 (0.0%) |
| 3 Vehicles | 69 (100.0%) | 31 (100.0%) |
| 4 Vehicles | 0 (0.0%) | 0 (0.0%) |
| 5 or more Vehicles | 0 (0.0%) | 0 (0.0%) |
| Total | 69 (100.0%) | 31 (100.0%) |
Commute Time in Y O Ranch
The most frequently occuring commute durations in Y O Ranch are 5 to 9 minutes (69 commuters, 69.0%), 10 to 14 minutes (31 commuters, 31.0%), and less than 5 minutes (0 commuters, 0.0%).
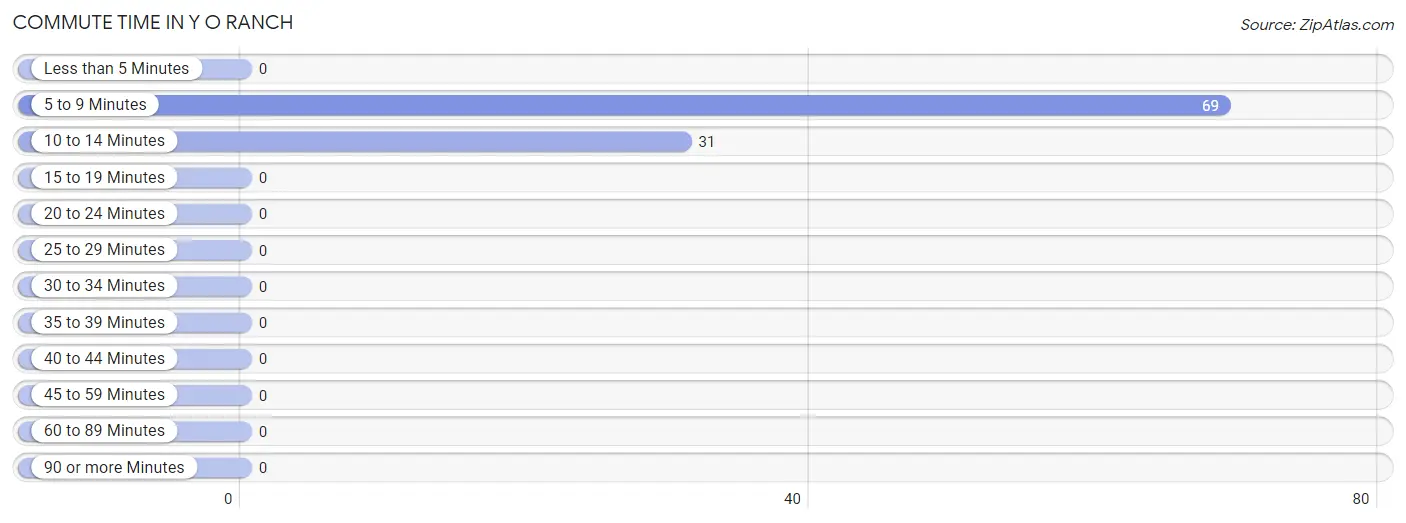
| Commute Time | # Commuters | % Commuters |
| Less than 5 Minutes | 0 | 0.0% |
| 5 to 9 Minutes | 69 | 69.0% |
| 10 to 14 Minutes | 31 | 31.0% |
| 15 to 19 Minutes | 0 | 0.0% |
| 20 to 24 Minutes | 0 | 0.0% |
| 25 to 29 Minutes | 0 | 0.0% |
| 30 to 34 Minutes | 0 | 0.0% |
| 35 to 39 Minutes | 0 | 0.0% |
| 40 to 44 Minutes | 0 | 0.0% |
| 45 to 59 Minutes | 0 | 0.0% |
| 60 to 89 Minutes | 0 | 0.0% |
| 90 or more Minutes | 0 | 0.0% |
Commute Time by Sex in Y O Ranch
The most common commute times in Y O Ranch are 5 to 9 minutes (69 commuters, 100.0%) for males and 10 to 14 minutes (31 commuters, 100.0%) for females.
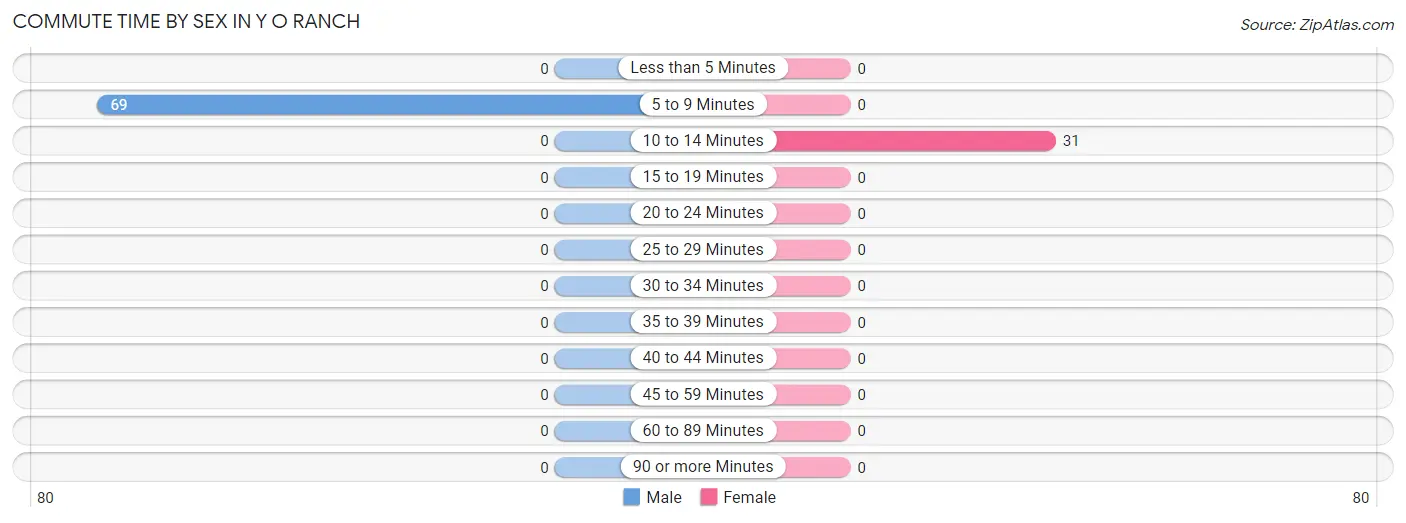
| Commute Time | Male | Female |
| Less than 5 Minutes | 0 (0.0%) | 0 (0.0%) |
| 5 to 9 Minutes | 69 (100.0%) | 0 (0.0%) |
| 10 to 14 Minutes | 0 (0.0%) | 31 (100.0%) |
| 15 to 19 Minutes | 0 (0.0%) | 0 (0.0%) |
| 20 to 24 Minutes | 0 (0.0%) | 0 (0.0%) |
| 25 to 29 Minutes | 0 (0.0%) | 0 (0.0%) |
| 30 to 34 Minutes | 0 (0.0%) | 0 (0.0%) |
| 35 to 39 Minutes | 0 (0.0%) | 0 (0.0%) |
| 40 to 44 Minutes | 0 (0.0%) | 0 (0.0%) |
| 45 to 59 Minutes | 0 (0.0%) | 0 (0.0%) |
| 60 to 89 Minutes | 0 (0.0%) | 0 (0.0%) |
| 90 or more Minutes | 0 (0.0%) | 0 (0.0%) |
Time of Departure to Work by Sex in Y O Ranch
The most frequent times of departure to work in Y O Ranch are 6:00 AM to 6:29 AM (69, 100.0%) for males and 7:00 AM to 7:29 AM (31, 100.0%) for females.
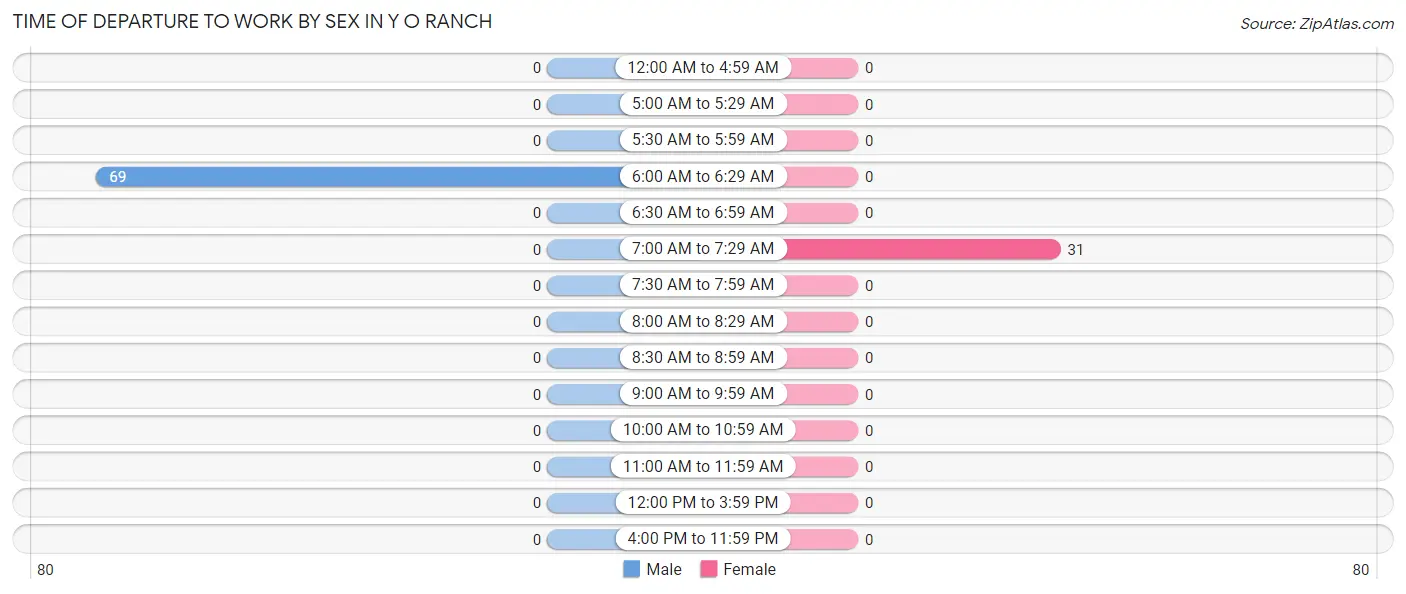
| Time of Departure | Male | Female |
| 12:00 AM to 4:59 AM | 0 (0.0%) | 0 (0.0%) |
| 5:00 AM to 5:29 AM | 0 (0.0%) | 0 (0.0%) |
| 5:30 AM to 5:59 AM | 0 (0.0%) | 0 (0.0%) |
| 6:00 AM to 6:29 AM | 69 (100.0%) | 0 (0.0%) |
| 6:30 AM to 6:59 AM | 0 (0.0%) | 0 (0.0%) |
| 7:00 AM to 7:29 AM | 0 (0.0%) | 31 (100.0%) |
| 7:30 AM to 7:59 AM | 0 (0.0%) | 0 (0.0%) |
| 8:00 AM to 8:29 AM | 0 (0.0%) | 0 (0.0%) |
| 8:30 AM to 8:59 AM | 0 (0.0%) | 0 (0.0%) |
| 9:00 AM to 9:59 AM | 0 (0.0%) | 0 (0.0%) |
| 10:00 AM to 10:59 AM | 0 (0.0%) | 0 (0.0%) |
| 11:00 AM to 11:59 AM | 0 (0.0%) | 0 (0.0%) |
| 12:00 PM to 3:59 PM | 0 (0.0%) | 0 (0.0%) |
| 4:00 PM to 11:59 PM | 0 (0.0%) | 0 (0.0%) |
| Total | 69 (100.0%) | 31 (100.0%) |
Housing Occupancy in Y O Ranch
Occupancy by Ownership in Y O Ranch
Of the total 81 dwellings in Y O Ranch, owner-occupied units account for 20 (24.7%), while renter-occupied units make up 61 (75.3%).
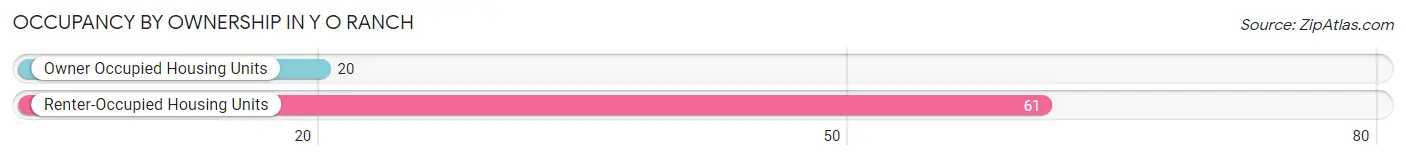
| Occupancy | # Housing Units | % Housing Units |
| Owner Occupied Housing Units | 20 | 24.7% |
| Renter-Occupied Housing Units | 61 | 75.3% |
| Total Occupied Housing Units | 81 | 100.0% |
Occupancy by Household Size in Y O Ranch
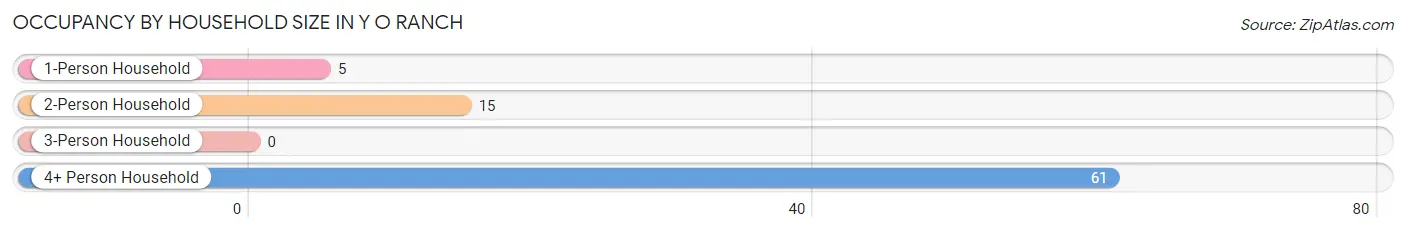
| Household Size | # Housing Units | % Housing Units |
| 1-Person Household | 5 | 6.2% |
| 2-Person Household | 15 | 18.5% |
| 3-Person Household | 0 | 0.0% |
| 4+ Person Household | 61 | 75.3% |
| Total Housing Units | 81 | 100.0% |
Occupancy by Ownership by Household Size in Y O Ranch
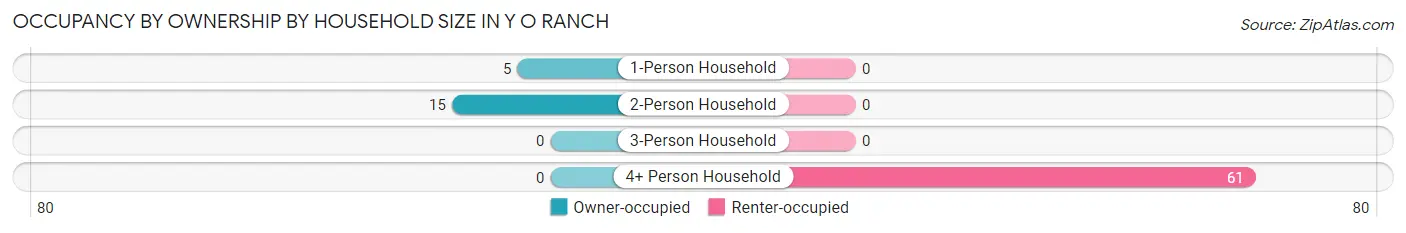
| Household Size | Owner-occupied | Renter-occupied |
| 1-Person Household | 5 (100.0%) | 0 (0.0%) |
| 2-Person Household | 15 (100.0%) | 0 (0.0%) |
| 3-Person Household | 0 (0.0%) | 0 (0.0%) |
| 4+ Person Household | 0 (0.0%) | 61 (100.0%) |
| Total Housing Units | 20 (24.7%) | 61 (75.3%) |
Occupancy by Educational Attainment in Y O Ranch
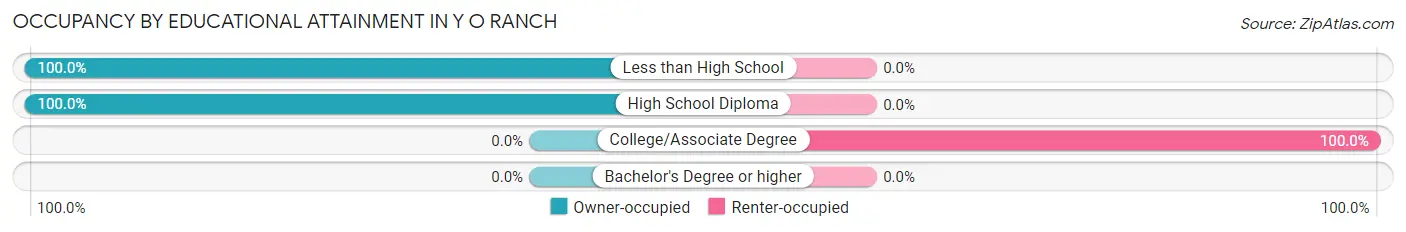
| Household Size | Owner-occupied | Renter-occupied |
| Less than High School | 5 (100.0%) | 0 (0.0%) |
| High School Diploma | 15 (100.0%) | 0 (0.0%) |
| College/Associate Degree | 0 (0.0%) | 61 (100.0%) |
| Bachelor's Degree or higher | 0 (0.0%) | 0 (0.0%) |
Occupancy by Age of Householder in Y O Ranch
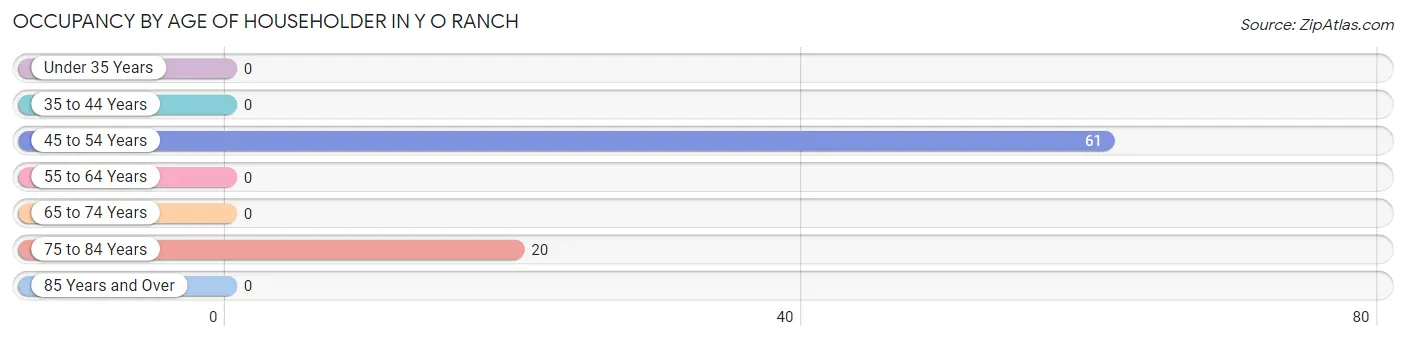
| Age Bracket | # Households | % Households |
| Under 35 Years | 0 | 0.0% |
| 35 to 44 Years | 0 | 0.0% |
| 45 to 54 Years | 61 | 75.3% |
| 55 to 64 Years | 0 | 0.0% |
| 65 to 74 Years | 0 | 0.0% |
| 75 to 84 Years | 20 | 24.7% |
| 85 Years and Over | 0 | 0.0% |
| Total | 81 | 100.0% |
Housing Finances in Y O Ranch
Median Income by Occupancy in Y O Ranch
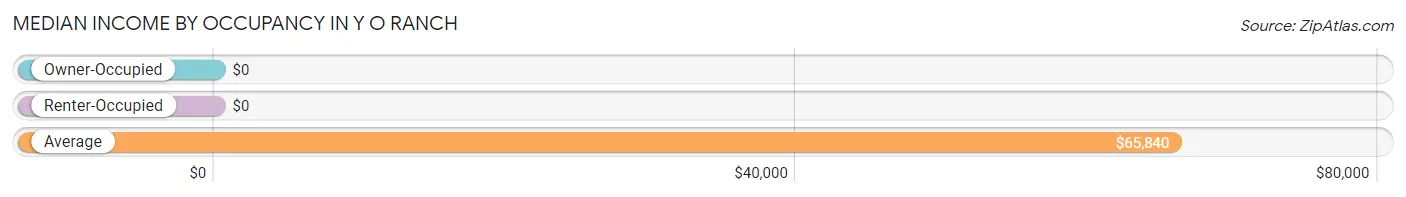
| Occupancy Type | # Households | Median Income |
| Owner-Occupied | 20 (24.7%) | $0 |
| Renter-Occupied | 61 (75.3%) | $0 |
| Average | 81 (100.0%) | $65,840 |
Occupancy by Householder Income Bracket in Y O Ranch
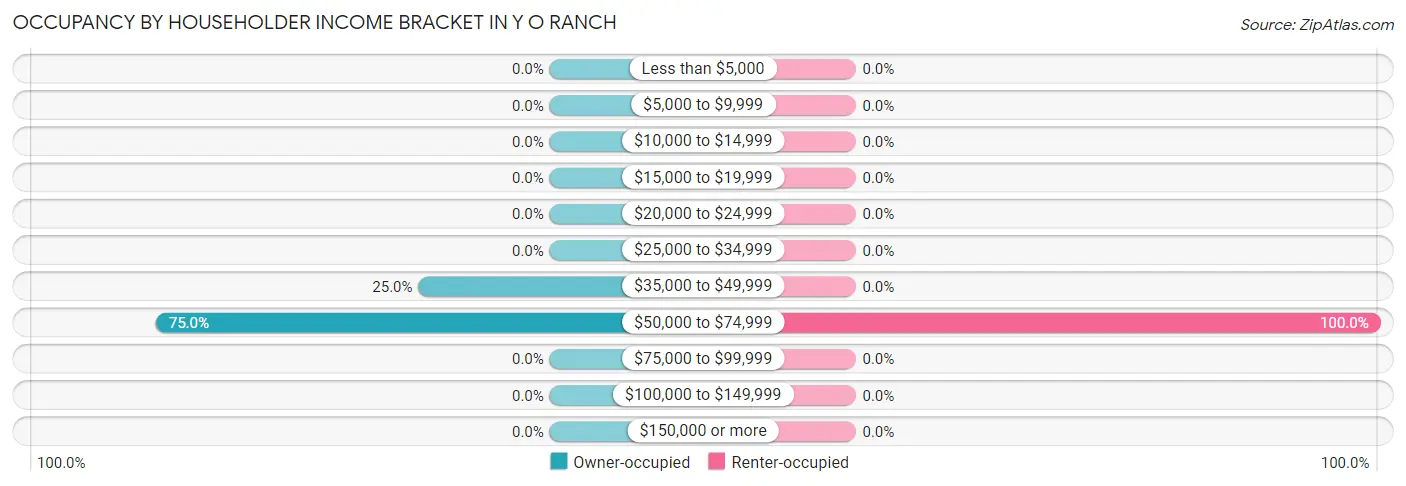
| Income Bracket | Owner-occupied | Renter-occupied |
| Less than $5,000 | 0 (0.0%) | 0 (0.0%) |
| $5,000 to $9,999 | 0 (0.0%) | 0 (0.0%) |
| $10,000 to $14,999 | 0 (0.0%) | 0 (0.0%) |
| $15,000 to $19,999 | 0 (0.0%) | 0 (0.0%) |
| $20,000 to $24,999 | 0 (0.0%) | 0 (0.0%) |
| $25,000 to $34,999 | 0 (0.0%) | 0 (0.0%) |
| $35,000 to $49,999 | 5 (25.0%) | 0 (0.0%) |
| $50,000 to $74,999 | 15 (75.0%) | 61 (100.0%) |
| $75,000 to $99,999 | 0 (0.0%) | 0 (0.0%) |
| $100,000 to $149,999 | 0 (0.0%) | 0 (0.0%) |
| $150,000 or more | 0 (0.0%) | 0 (0.0%) |
| Total | 20 (100.0%) | 61 (100.0%) |
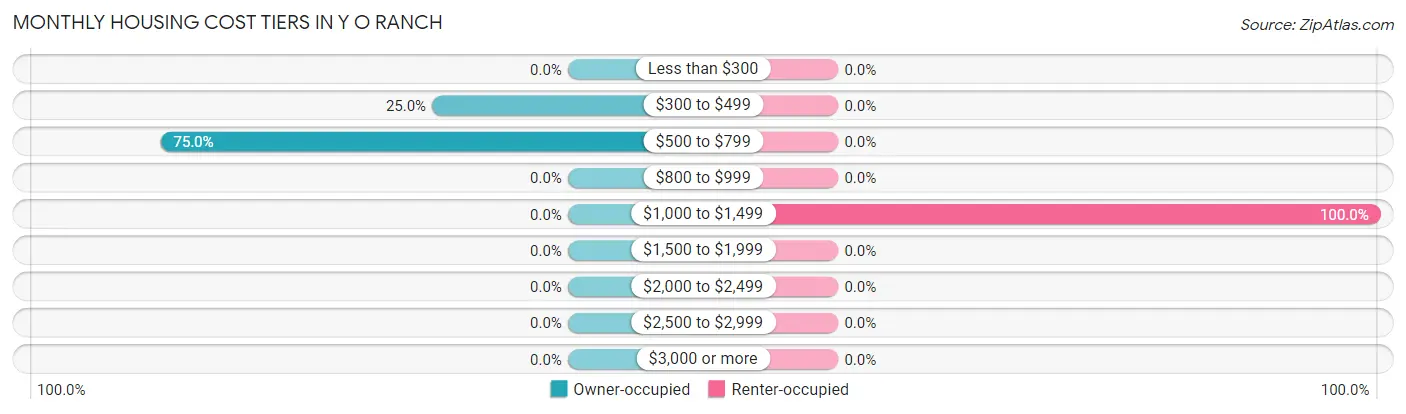
Monthly Housing Cost Tiers in Y O Ranch
| Monthly Cost | Owner-occupied | Renter-occupied |
| Less than $300 | 0 (0.0%) | 0 (0.0%) |
| $300 to $499 | 5 (25.0%) | 0 (0.0%) |
| $500 to $799 | 15 (75.0%) | 0 (0.0%) |
| $800 to $999 | 0 (0.0%) | 0 (0.0%) |
| $1,000 to $1,499 | 0 (0.0%) | 61 (100.0%) |
| $1,500 to $1,999 | 0 (0.0%) | 0 (0.0%) |
| $2,000 to $2,499 | 0 (0.0%) | 0 (0.0%) |
| $2,500 to $2,999 | 0 (0.0%) | 0 (0.0%) |
| $3,000 or more | 0 (0.0%) | 0 (0.0%) |
| Total | 20 (100.0%) | 61 (100.0%) |
Physical Housing Characteristics in Y O Ranch
Housing Structures in Y O Ranch
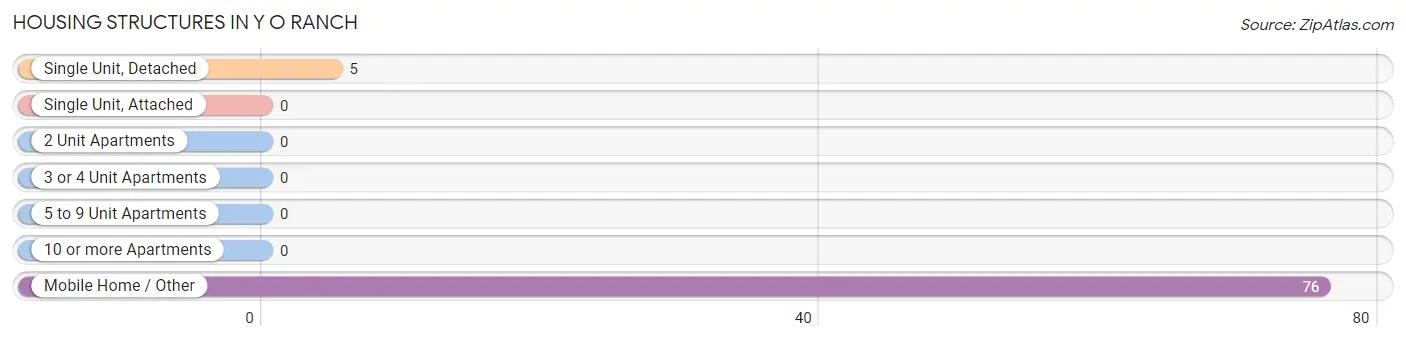
| Structure Type | # Housing Units | % Housing Units |
| Single Unit, Detached | 5 | 6.2% |
| Single Unit, Attached | 0 | 0.0% |
| 2 Unit Apartments | 0 | 0.0% |
| 3 or 4 Unit Apartments | 0 | 0.0% |
| 5 to 9 Unit Apartments | 0 | 0.0% |
| 10 or more Apartments | 0 | 0.0% |
| Mobile Home / Other | 76 | 93.8% |
| Total | 81 | 100.0% |
Housing Structures by Occupancy in Y O Ranch
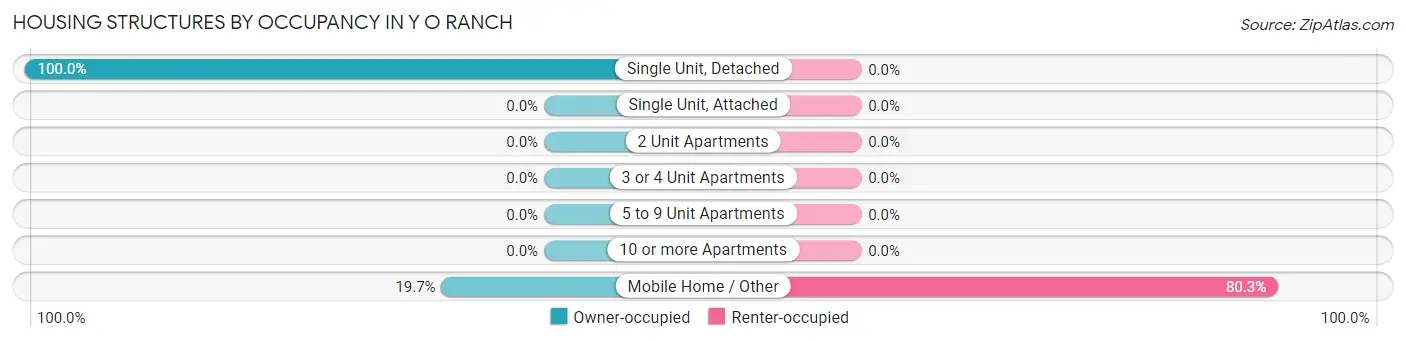
| Structure Type | Owner-occupied | Renter-occupied |
| Single Unit, Detached | 5 (100.0%) | 0 (0.0%) |
| Single Unit, Attached | 0 (0.0%) | 0 (0.0%) |
| 2 Unit Apartments | 0 (0.0%) | 0 (0.0%) |
| 3 or 4 Unit Apartments | 0 (0.0%) | 0 (0.0%) |
| 5 to 9 Unit Apartments | 0 (0.0%) | 0 (0.0%) |
| 10 or more Apartments | 0 (0.0%) | 0 (0.0%) |
| Mobile Home / Other | 15 (19.7%) | 61 (80.3%) |
| Total | 20 (24.7%) | 61 (75.3%) |
Housing Structures by Number of Rooms in Y O Ranch
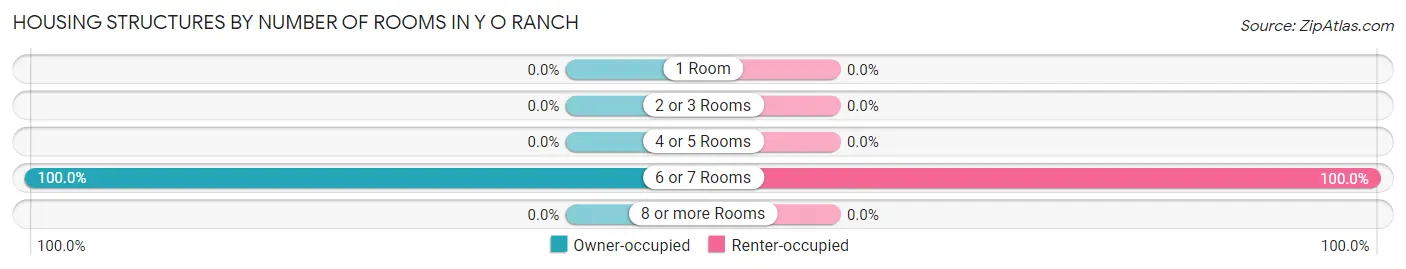
| Number of Rooms | Owner-occupied | Renter-occupied |
| 1 Room | 0 (0.0%) | 0 (0.0%) |
| 2 or 3 Rooms | 0 (0.0%) | 0 (0.0%) |
| 4 or 5 Rooms | 0 (0.0%) | 0 (0.0%) |
| 6 or 7 Rooms | 20 (100.0%) | 61 (100.0%) |
| 8 or more Rooms | 0 (0.0%) | 0 (0.0%) |
| Total | 20 (100.0%) | 61 (100.0%) |
Housing Structure by Heating Type in Y O Ranch
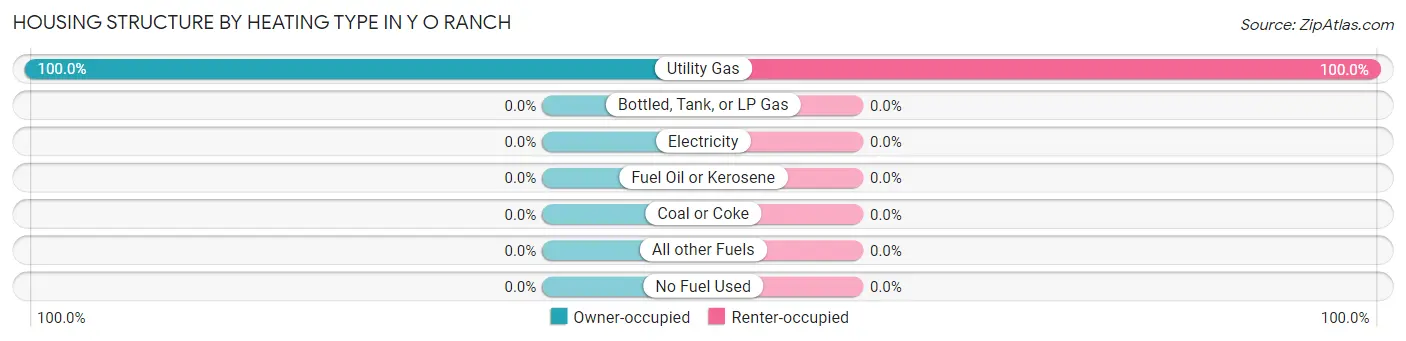
| Heating Type | Owner-occupied | Renter-occupied |
| Utility Gas | 20 (100.0%) | 61 (100.0%) |
| Bottled, Tank, or LP Gas | 0 (0.0%) | 0 (0.0%) |
| Electricity | 0 (0.0%) | 0 (0.0%) |
| Fuel Oil or Kerosene | 0 (0.0%) | 0 (0.0%) |
| Coal or Coke | 0 (0.0%) | 0 (0.0%) |
| All other Fuels | 0 (0.0%) | 0 (0.0%) |
| No Fuel Used | 0 (0.0%) | 0 (0.0%) |
| Total | 20 (100.0%) | 61 (100.0%) |
Household Vehicle Usage in Y O Ranch
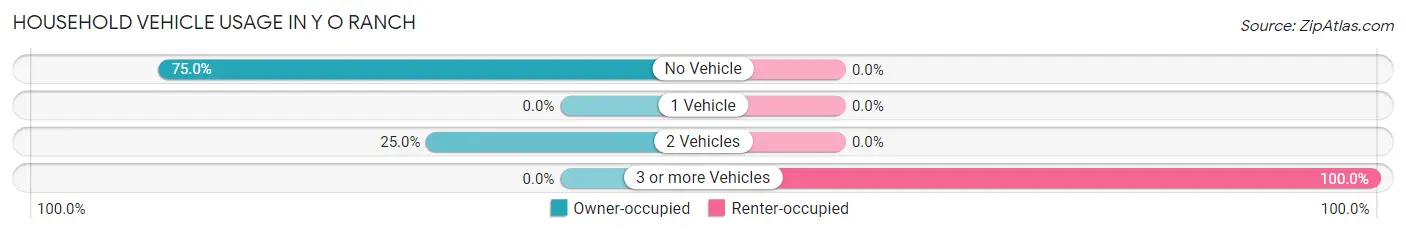
| Vehicles per Household | Owner-occupied | Renter-occupied |
| No Vehicle | 15 (75.0%) | 0 (0.0%) |
| 1 Vehicle | 0 (0.0%) | 0 (0.0%) |
| 2 Vehicles | 5 (25.0%) | 0 (0.0%) |
| 3 or more Vehicles | 0 (0.0%) | 61 (100.0%) |
| Total | 20 (100.0%) | 61 (100.0%) |
Real Estate & Mortgages in Y O Ranch
Real Estate and Mortgage Overview in Y O Ranch
| Characteristic | Without Mortgage | With Mortgage |
| Housing Units | 20 | 0 |
| Median Property Value | - | - |
| Median Household Income | - | - |
| Monthly Housing Costs | - | - |
| Real Estate Taxes | - | - |
Property Value by Mortgage Status in Y O Ranch
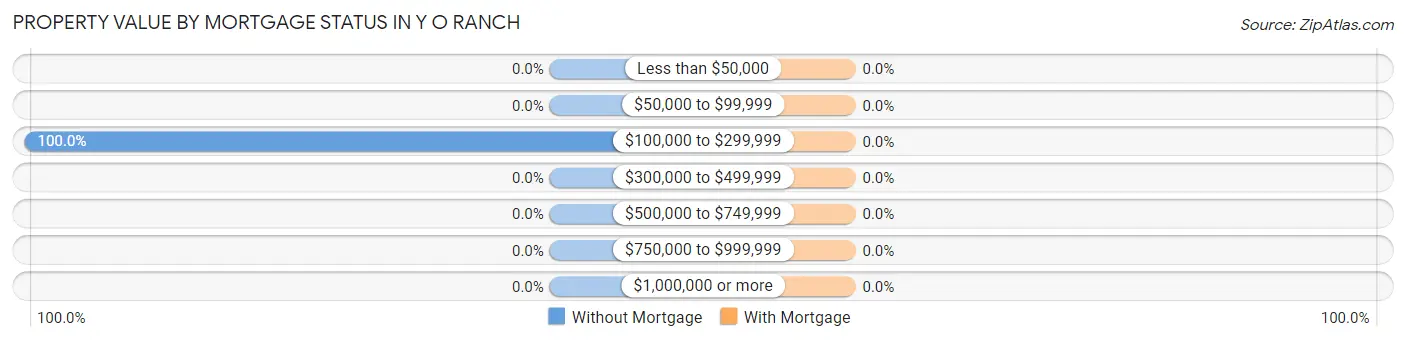
| Property Value | Without Mortgage | With Mortgage |
| Less than $50,000 | 0 (0.0%) | 0 (0.0%) |
| $50,000 to $99,999 | 0 (0.0%) | 0 (0.0%) |
| $100,000 to $299,999 | 20 (100.0%) | 0 (0.0%) |
| $300,000 to $499,999 | 0 (0.0%) | 0 (0.0%) |
| $500,000 to $749,999 | 0 (0.0%) | 0 (0.0%) |
| $750,000 to $999,999 | 0 (0.0%) | 0 (0.0%) |
| $1,000,000 or more | 0 (0.0%) | 0 (0.0%) |
| Total | 20 (100.0%) | 0 (0.0%) |
Household Income by Mortgage Status in Y O Ranch
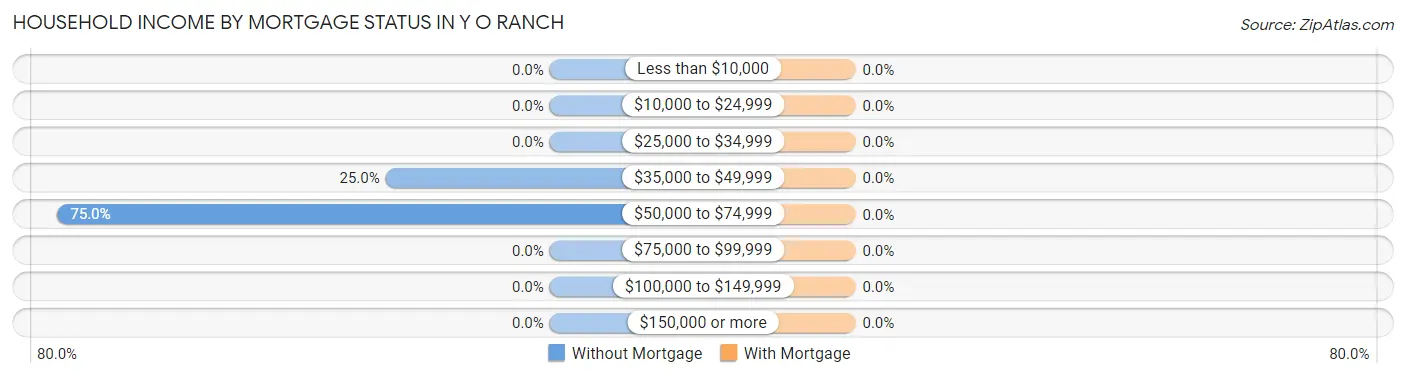
| Household Income | Without Mortgage | With Mortgage |
| Less than $10,000 | 0 (0.0%) | 0 (0.0%) |
| $10,000 to $24,999 | 0 (0.0%) | 0 (0.0%) |
| $25,000 to $34,999 | 0 (0.0%) | 0 (0.0%) |
| $35,000 to $49,999 | 5 (25.0%) | 0 (0.0%) |
| $50,000 to $74,999 | 15 (75.0%) | 0 (0.0%) |
| $75,000 to $99,999 | 0 (0.0%) | 0 (0.0%) |
| $100,000 to $149,999 | 0 (0.0%) | 0 (0.0%) |
| $150,000 or more | 0 (0.0%) | 0 (0.0%) |
| Total | 20 (100.0%) | 0 (0.0%) |
Property Value to Household Income Ratio in Y O Ranch
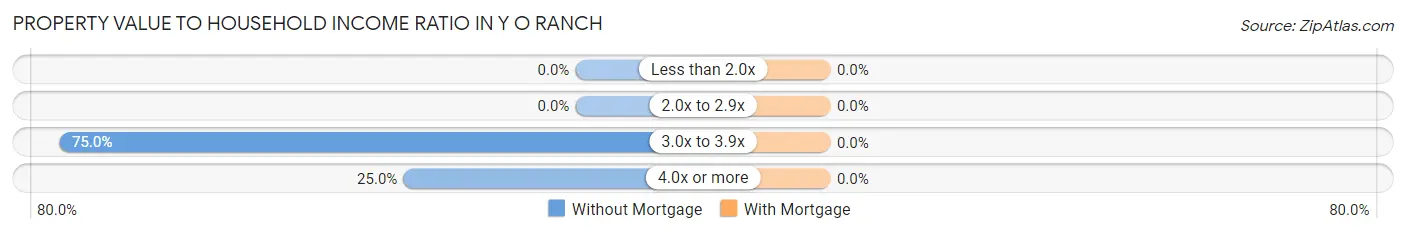
| Value-to-Income Ratio | Without Mortgage | With Mortgage |
| Less than 2.0x | 0 (0.0%) | 0 (0.0%) |
| 2.0x to 2.9x | 0 (0.0%) | 0 (0.0%) |
| 3.0x to 3.9x | 15 (75.0%) | 0 (0.0%) |
| 4.0x or more | 5 (25.0%) | 0 (0.0%) |
| Total | 20 (100.0%) | 0 (0.0%) |
Real Estate Taxes by Mortgage Status in Y O Ranch
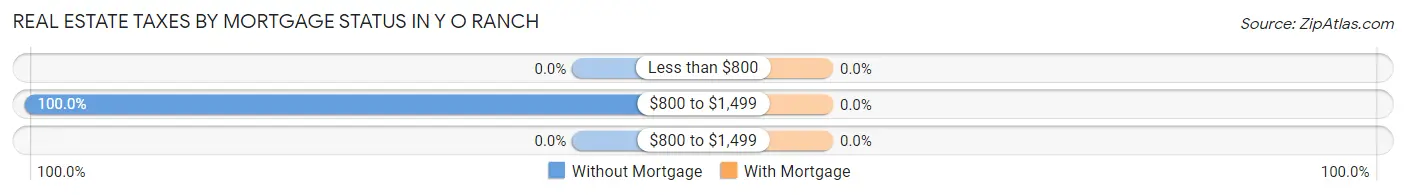
| Property Taxes | Without Mortgage | With Mortgage |
| Less than $800 | 0 (0.0%) | 0 (0.0%) |
| $800 to $1,499 | 20 (100.0%) | 0 (0.0%) |
| $800 to $1,499 | 0 (0.0%) | 0 (0.0%) |
| Total | 20 (100.0%) | 0 (0.0%) |
Health & Disability in Y O Ranch
Health Insurance Coverage by Age in Y O Ranch
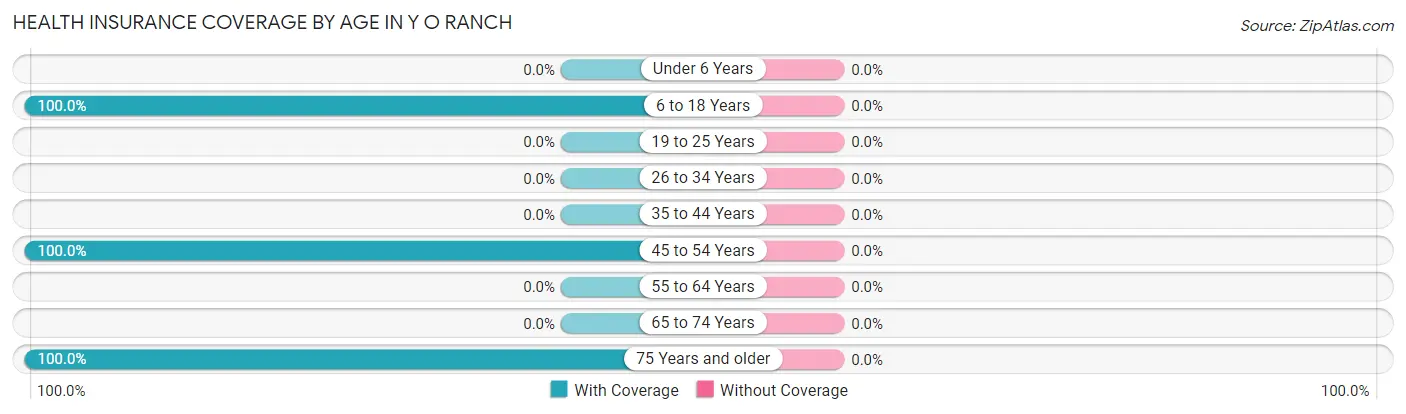
| Age Bracket | With Coverage | Without Coverage |
| Under 6 Years | 0 (0.0%) | 0 (0.0%) |
| 6 to 18 Years | 144 (100.0%) | 0 (0.0%) |
| 19 to 25 Years | 0 (0.0%) | 0 (0.0%) |
| 26 to 34 Years | 0 (0.0%) | 0 (0.0%) |
| 35 to 44 Years | 0 (0.0%) | 0 (0.0%) |
| 45 to 54 Years | 130 (100.0%) | 0 (0.0%) |
| 55 to 64 Years | 0 (0.0%) | 0 (0.0%) |
| 65 to 74 Years | 0 (0.0%) | 0 (0.0%) |
| 75 Years and older | 39 (100.0%) | 0 (0.0%) |
| Total | 313 (100.0%) | 0 (0.0%) |
Health Insurance Coverage by Citizenship Status in Y O Ranch
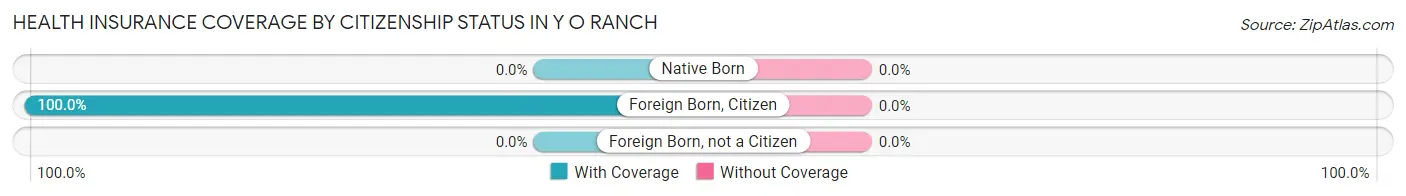
| Citizenship Status | With Coverage | Without Coverage |
| Native Born | 0 (0.0%) | 0 (0.0%) |
| Foreign Born, Citizen | 144 (100.0%) | 0 (0.0%) |
| Foreign Born, not a Citizen | 0 (0.0%) | 0 (0.0%) |
Health Insurance Coverage by Household Income in Y O Ranch
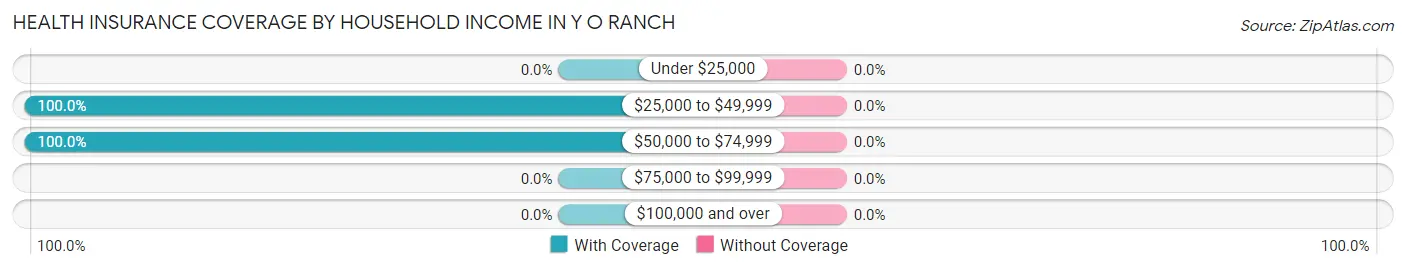
| Household Income | With Coverage | Without Coverage |
| Under $25,000 | 0 (0.0%) | 0 (0.0%) |
| $25,000 to $49,999 | 5 (100.0%) | 0 (0.0%) |
| $50,000 to $74,999 | 308 (100.0%) | 0 (0.0%) |
| $75,000 to $99,999 | 0 (0.0%) | 0 (0.0%) |
| $100,000 and over | 0 (0.0%) | 0 (0.0%) |
Public vs Private Health Insurance Coverage by Age in Y O Ranch
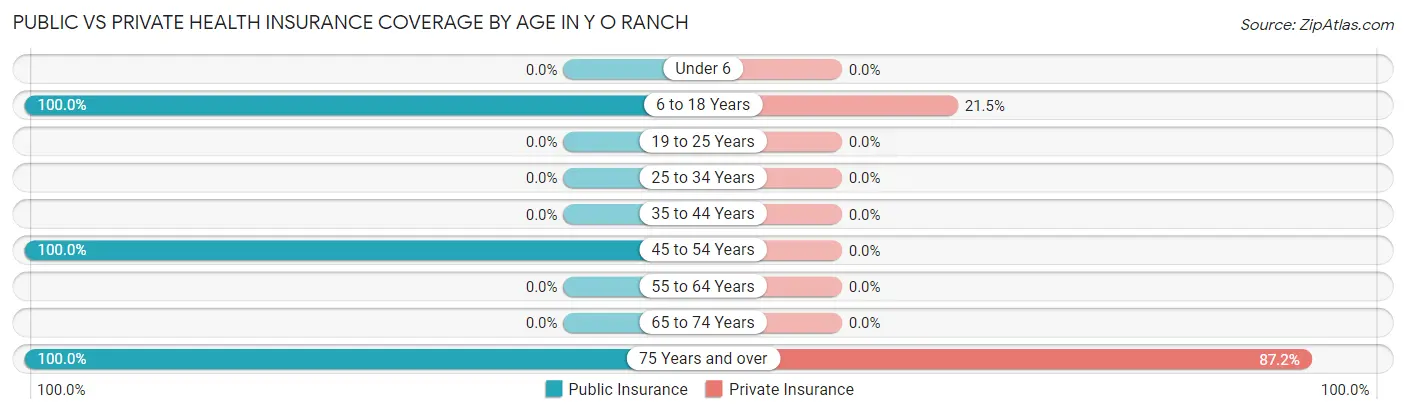
| Age Bracket | Public Insurance | Private Insurance |
| Under 6 | 0 (0.0%) | 0 (0.0%) |
| 6 to 18 Years | 144 (100.0%) | 31 (21.5%) |
| 19 to 25 Years | 0 (0.0%) | 0 (0.0%) |
| 25 to 34 Years | 0 (0.0%) | 0 (0.0%) |
| 35 to 44 Years | 0 (0.0%) | 0 (0.0%) |
| 45 to 54 Years | 130 (100.0%) | 0 (0.0%) |
| 55 to 64 Years | 0 (0.0%) | 0 (0.0%) |
| 65 to 74 Years | 0 (0.0%) | 0 (0.0%) |
| 75 Years and over | 39 (100.0%) | 34 (87.2%) |
| Total | 313 (100.0%) | 65 (20.8%) |
Disability Status by Sex by Age in Y O Ranch
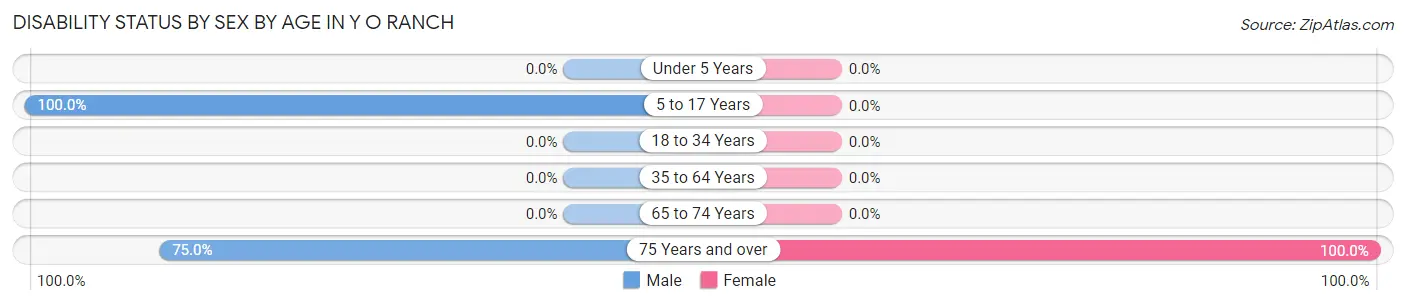
| Age Bracket | Male | Female |
| Under 5 Years | 0 (0.0%) | 0 (0.0%) |
| 5 to 17 Years | 44 (100.0%) | 0 (0.0%) |
| 18 to 34 Years | 0 (0.0%) | 0 (0.0%) |
| 35 to 64 Years | 0 (0.0%) | 0 (0.0%) |
| 65 to 74 Years | 0 (0.0%) | 0 (0.0%) |
| 75 Years and over | 15 (75.0%) | 19 (100.0%) |
Disability Class by Sex by Age in Y O Ranch
Disability Class: Hearing Difficulty
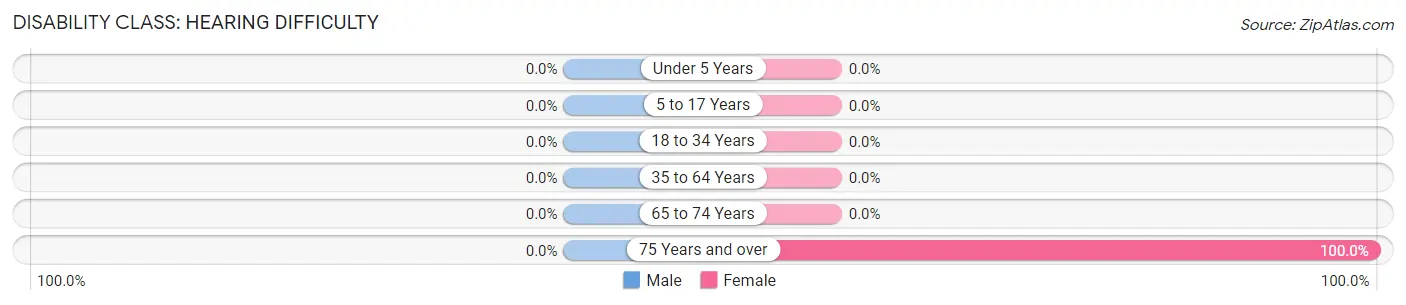
| Age Bracket | Male | Female |
| Under 5 Years | 0 (0.0%) | 0 (0.0%) |
| 5 to 17 Years | 0 (0.0%) | 0 (0.0%) |
| 18 to 34 Years | 0 (0.0%) | 0 (0.0%) |
| 35 to 64 Years | 0 (0.0%) | 0 (0.0%) |
| 65 to 74 Years | 0 (0.0%) | 0 (0.0%) |
| 75 Years and over | 0 (0.0%) | 19 (100.0%) |
Disability Class: Vision Difficulty
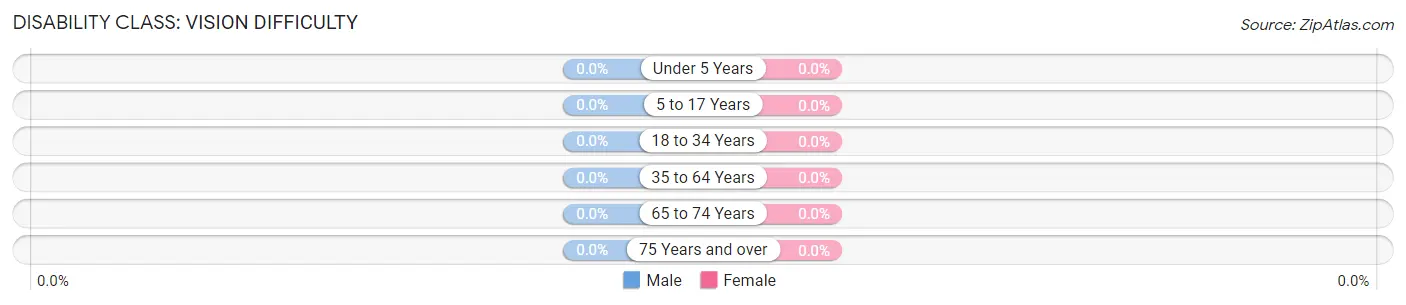
| Age Bracket | Male | Female |
| Under 5 Years | 0 (0.0%) | 0 (0.0%) |
| 5 to 17 Years | 0 (0.0%) | 0 (0.0%) |
| 18 to 34 Years | 0 (0.0%) | 0 (0.0%) |
| 35 to 64 Years | 0 (0.0%) | 0 (0.0%) |
| 65 to 74 Years | 0 (0.0%) | 0 (0.0%) |
| 75 Years and over | 0 (0.0%) | 0 (0.0%) |
Disability Class: Cognitive Difficulty
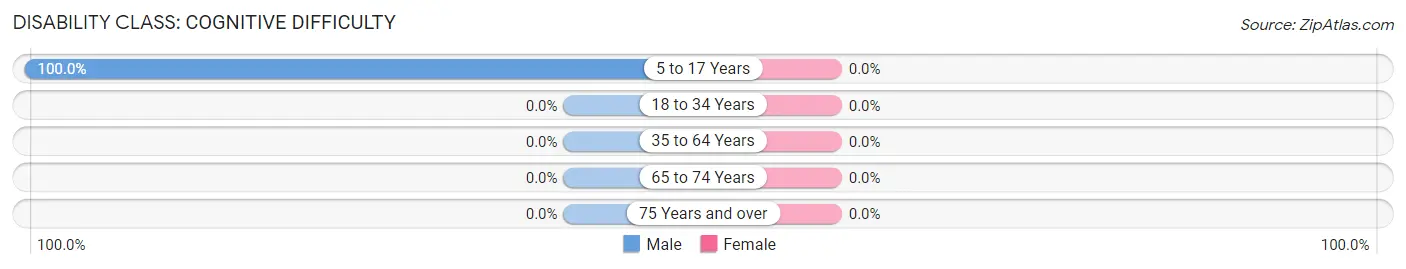
| Age Bracket | Male | Female |
| 5 to 17 Years | 44 (100.0%) | 0 (0.0%) |
| 18 to 34 Years | 0 (0.0%) | 0 (0.0%) |
| 35 to 64 Years | 0 (0.0%) | 0 (0.0%) |
| 65 to 74 Years | 0 (0.0%) | 0 (0.0%) |
| 75 Years and over | 0 (0.0%) | 0 (0.0%) |
Disability Class: Ambulatory Difficulty
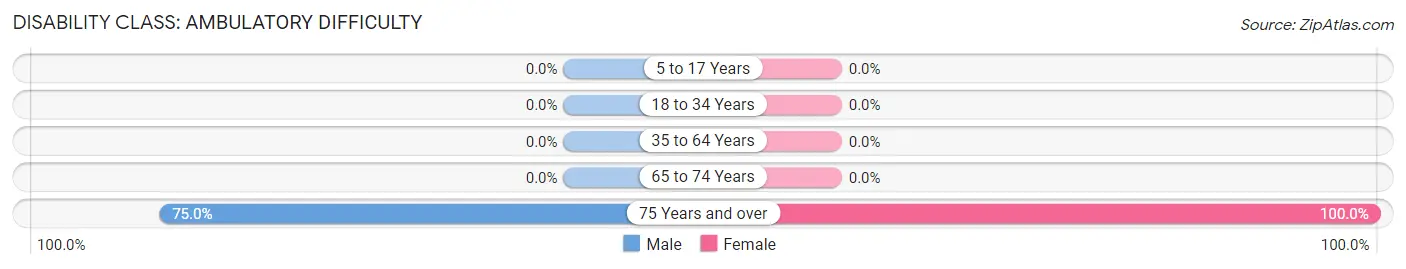
| Age Bracket | Male | Female |
| 5 to 17 Years | 0 (0.0%) | 0 (0.0%) |
| 18 to 34 Years | 0 (0.0%) | 0 (0.0%) |
| 35 to 64 Years | 0 (0.0%) | 0 (0.0%) |
| 65 to 74 Years | 0 (0.0%) | 0 (0.0%) |
| 75 Years and over | 15 (75.0%) | 19 (100.0%) |
Disability Class: Self-Care Difficulty
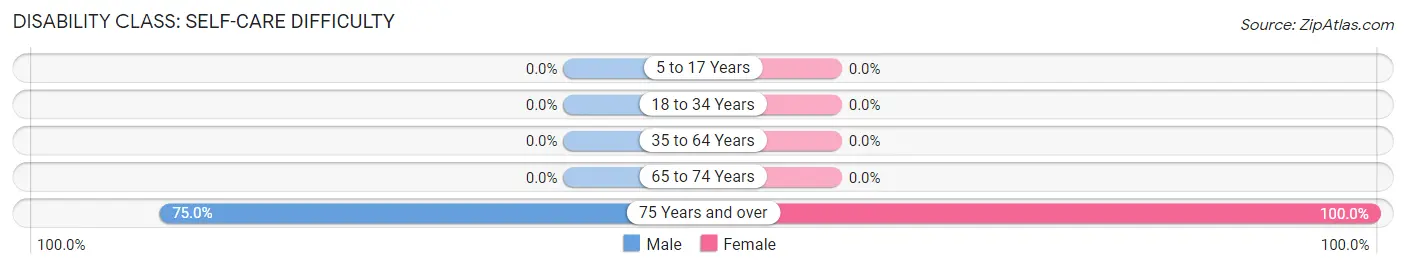
| Age Bracket | Male | Female |
| 5 to 17 Years | 0 (0.0%) | 0 (0.0%) |
| 18 to 34 Years | 0 (0.0%) | 0 (0.0%) |
| 35 to 64 Years | 0 (0.0%) | 0 (0.0%) |
| 65 to 74 Years | 0 (0.0%) | 0 (0.0%) |
| 75 Years and over | 15 (75.0%) | 19 (100.0%) |
Technology Access in Y O Ranch
Computing Device Access in Y O Ranch
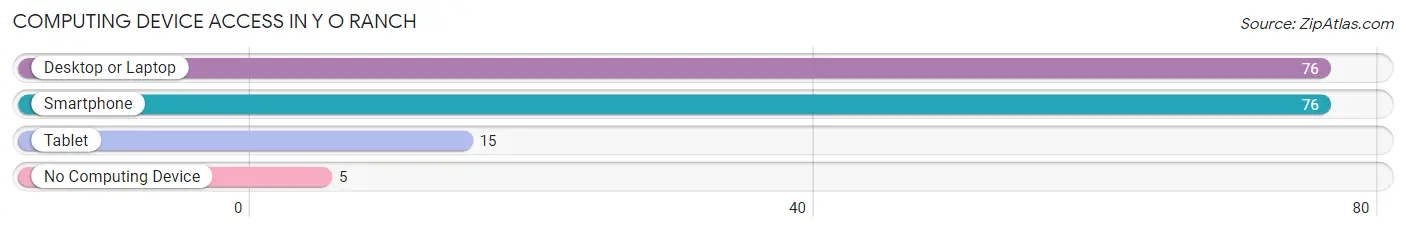
| Device Type | # Households | % Households |
| Desktop or Laptop | 76 | 93.8% |
| Smartphone | 76 | 93.8% |
| Tablet | 15 | 18.5% |
| No Computing Device | 5 | 6.2% |
| Total | 81 | 100.0% |
Internet Access in Y O Ranch
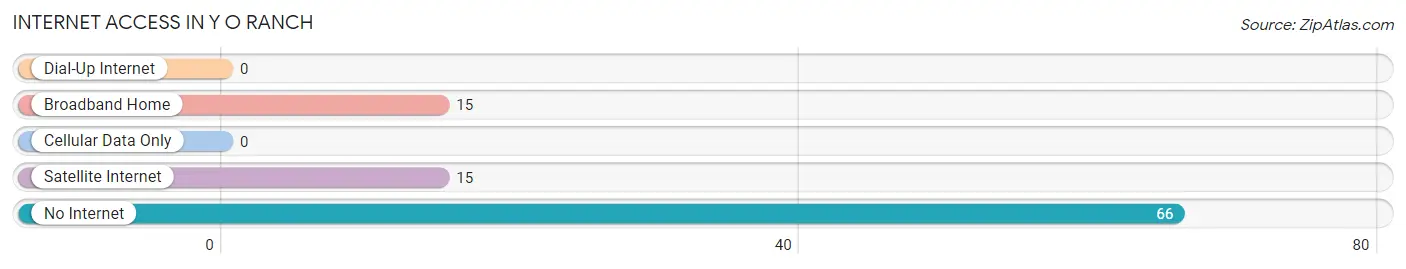
| Internet Type | # Households | % Households |
| Dial-Up Internet | 0 | 0.0% |
| Broadband Home | 15 | 18.5% |
| Cellular Data Only | 0 | 0.0% |
| Satellite Internet | 15 | 18.5% |
| No Internet | 66 | 81.5% |
| Total | 81 | 100.0% |
Y O Ranch Summary
The Y O Ranch is a historic ranch located in the Big Horn Basin of Wyoming. It is one of the oldest ranches in the state, having been established in 1881. The ranch is located in the foothills of the Big Horn Mountains, and covers over 100,000 acres of land. The ranch is home to a variety of wildlife, including elk, deer, antelope, and bighorn sheep.
History
The Y O Ranch was established in 1881 by William O. Owen, a former Texas Ranger. Owen had been searching for a place to settle down and start a ranch, and he found the perfect spot in the Big Horn Basin. He purchased the land from the Northern Arapaho tribe, and began building the ranch. The ranch was named after Owen's initials, and it quickly became a successful operation.
The ranch was passed down through the generations, and it is still owned and operated by the Owen family today. The ranch has been in continuous operation since its founding, and it is one of the oldest ranches in Wyoming.
Geography
The Y O Ranch is located in the Big Horn Basin of Wyoming. The ranch is situated in the foothills of the Big Horn Mountains, and it covers over 100,000 acres of land. The ranch is located in the Big Horn County, and it is bordered by the Big Horn National Forest to the north and the Shoshone National Forest to the south.
The ranch is located in a semi-arid climate, and it receives an average of 10 inches of precipitation per year. The area is known for its wide open spaces and stunning views of the Big Horn Mountains.
Economy
The Y O Ranch is a working cattle ranch, and it is one of the largest in Wyoming. The ranch is home to over 1,000 head of cattle, and it produces a variety of beef products, including steaks, roasts, and ground beef. The ranch also produces hay and other feed for the cattle.
The ranch also offers a variety of recreational activities, including hunting, fishing, and horseback riding. The ranch also offers guided tours of the ranch and its facilities.
Demographics
The Y O Ranch is located in Big Horn County, Wyoming. As of the 2010 census, the county had a population of 11,698. The population is primarily white (94.3%), with small percentages of Native American (2.2%), Hispanic (1.7%), and African American (0.7%) populations.
The median household income in Big Horn County is $45,845, and the median home value is $179,400. The unemployment rate in the county is 4.2%.
Conclusion
The Y O Ranch is a historic ranch located in the Big Horn Basin of Wyoming. It is one of the oldest ranches in the state, having been established in 1881. The ranch is located in the foothills of the Big Horn Mountains, and covers over 100,000 acres of land. The ranch is home to a variety of wildlife, and it is a working cattle ranch. The ranch also offers a variety of recreational activities, and it is located in Big Horn County, Wyoming. The population of the county is primarily white, with small percentages of Native American, Hispanic, and African American populations. The median household income in the county is $45,845, and the median home value is $179,400. The Y O Ranch is a unique and historic ranch that has been in continuous operation since its founding.
Common Questions
What is Per Capita Income in Y O Ranch?
Per Capita income in Y O Ranch is $17,712.
What is the Median Household income in Y O Ranch?
Median Household Income in Y O Ranch is $65,840.
What is Inequality or Gini Index in Y O Ranch?
Inequality or Gini Index in Y O Ranch is 0.03.
What is the Total Population of Y O Ranch?
Total Population of Y O Ranch is 313.
What is the Total Male Population of Y O Ranch?
Total Male Population of Y O Ranch is 133.
What is the Total Female Population of Y O Ranch?
Total Female Population of Y O Ranch is 180.
What is the Ratio of Males per 100 Females in Y O Ranch?
There are 73.89 Males per 100 Females in Y O Ranch.
What is the Ratio of Females per 100 Males in Y O Ranch?
There are 135.34 Females per 100 Males in Y O Ranch.
What is the Median Population Age in Y O Ranch?
Median Population Age in Y O Ranch is 47.2 Years.
What is the Average Family Size in Y O Ranch
Average Family Size in Y O Ranch is 4.0 People.
What is the Average Household Size in Y O Ranch
Average Household Size in Y O Ranch is 3.9 People.
How Large is the Labor Force in Y O Ranch?
There are 161 People in the Labor Forcein in Y O Ranch.
What is the Percentage of People in the Labor Force in Y O Ranch?
80.5% of People are in the Labor Force in Y O Ranch.
What is the Unemployment Rate in Y O Ranch?
Unemployment Rate in Y O Ranch is 37.9%.