Zip Codes with the Highest Percentage of Households Without a Vehicle in Brookfield, WI
RELATED REPORTS & OPTIONS
Households without a Cars
Brookfield
Compare Zip Codes
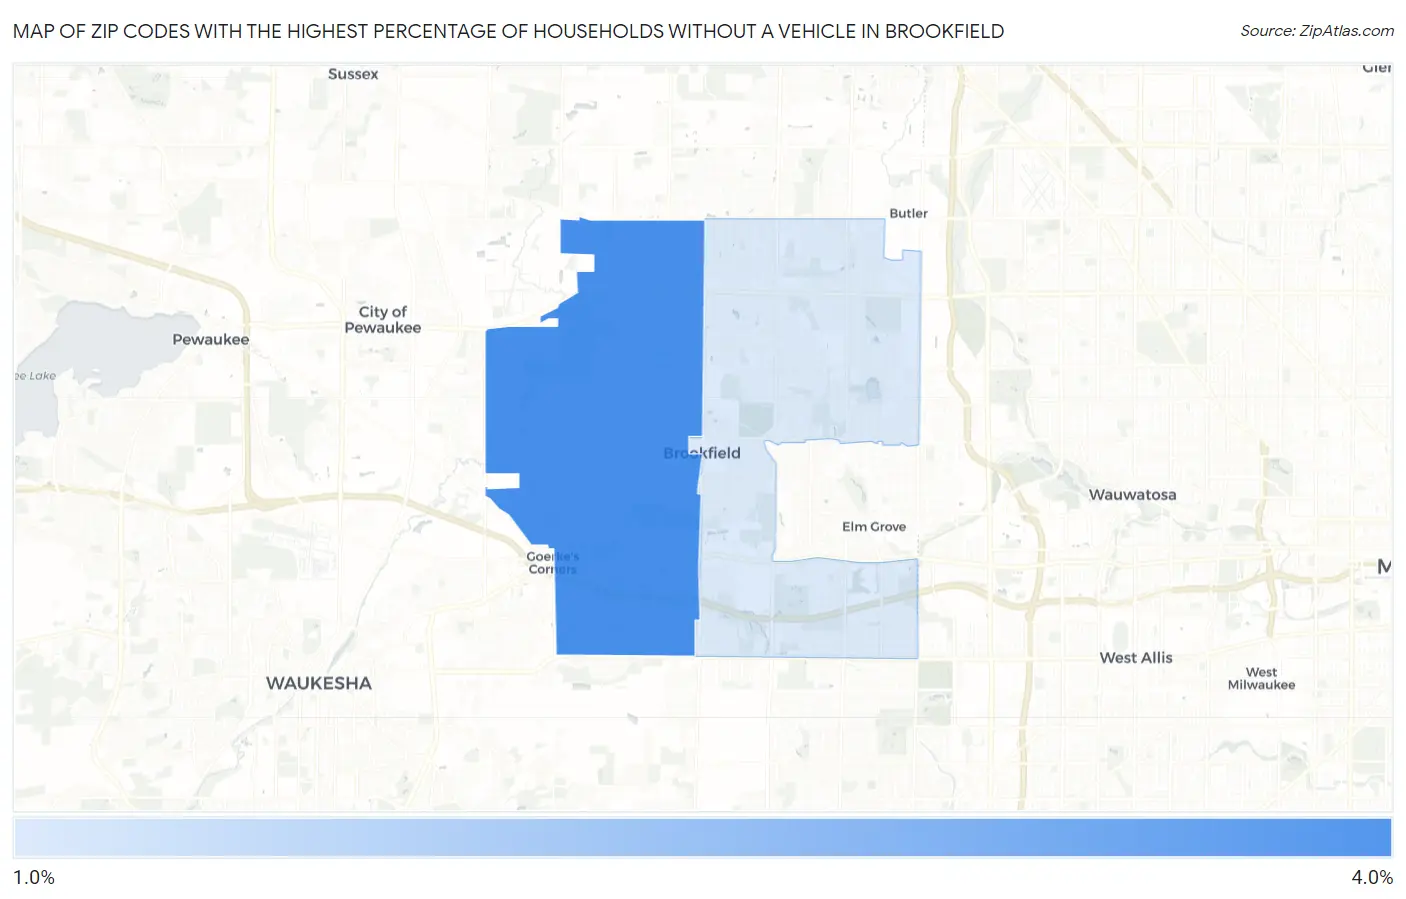
Map of Zip Codes with the Highest Percentage of Households Without a Vehicle in Brookfield
1.5%
3.2%
Zip Codes with the Highest Percentage of Households Without a Vehicle in Brookfield, WI
| Zip Code | Housholds Without a Car | vs State | vs National | |
| 1. | 53045 | 3.2% | 6.3%(-3.10)#395 | 8.3%(-5.10)#18,371 |
| 2. | 53005 | 1.5% | 6.3%(-4.80)#605 | 8.3%(-6.80)#24,117 |
1
Common Questions
What are the Top Zip Codes with the Highest Percentage of Households Without a Vehicle in Brookfield, WI?
Top Zip Codes with the Highest Percentage of Households Without a Vehicle in Brookfield, WI are:
What zip code has the Highest Percentage of Households Without a Vehicle in Brookfield, WI?
53045 has the Highest Percentage of Households Without a Vehicle in Brookfield, WI with 3.2%.
What is the Percentage of Households Without a Vehicle in Brookfield, WI?
Percentage of Households Without a Vehicle in Brookfield is 1.9%.
What is the Percentage of Households Without a Vehicle in Wisconsin?
Percentage of Households Without a Vehicle in Wisconsin is 6.3%.
What is the Percentage of Households Without a Vehicle in the United States?
Percentage of Households Without a Vehicle in the United States is 8.3%.