Zip Codes with the Highest Percentage of Population with a Degree in Psychology in Decatur, AL
RELATED REPORTS & OPTIONS
Psychology
Decatur
Compare Zip Codes
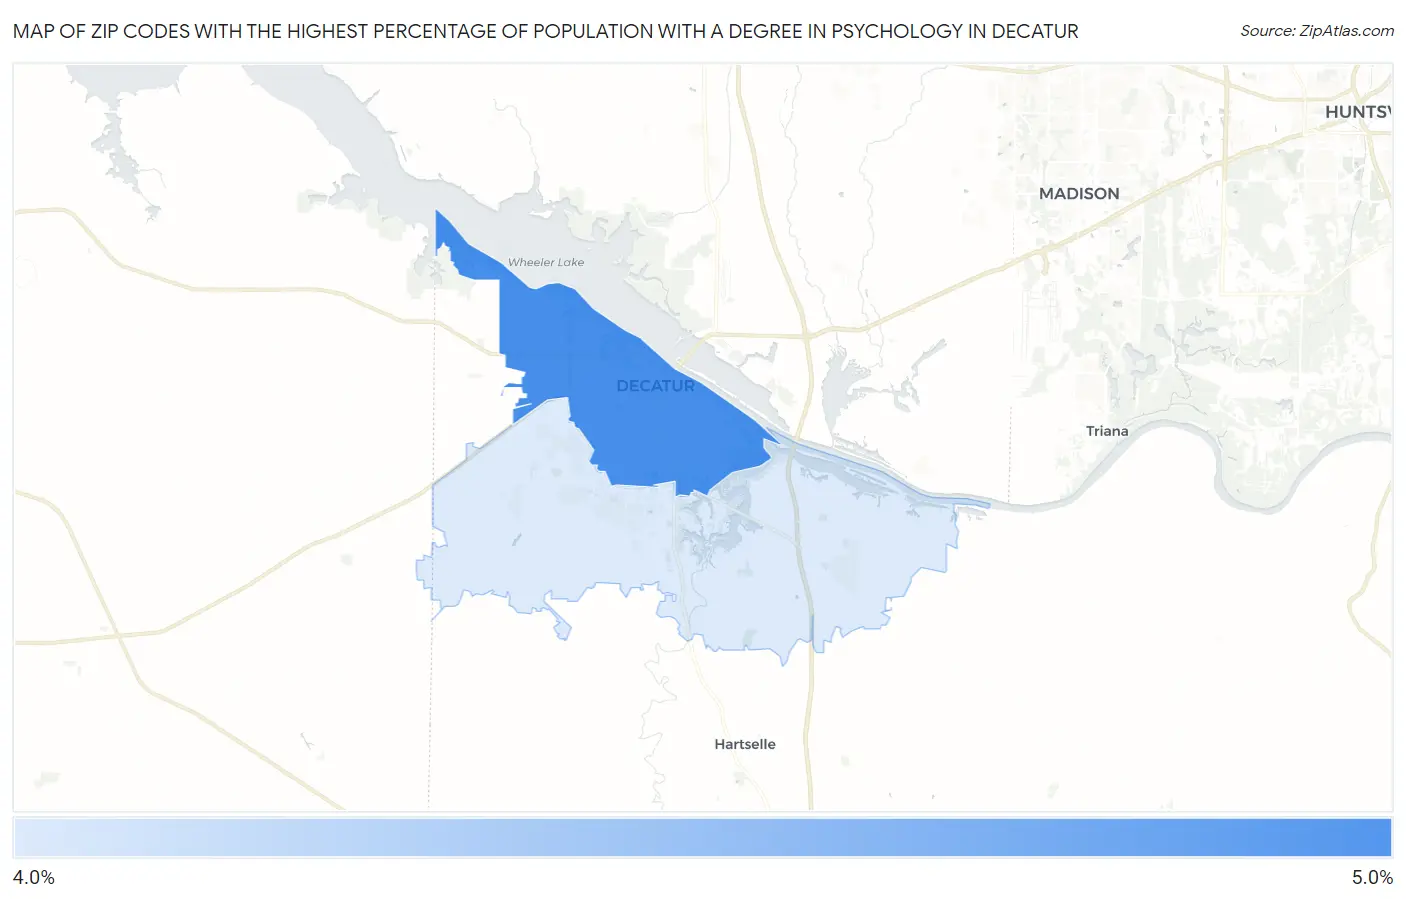
Map of Zip Codes with the Highest Percentage of Population with a Degree in Psychology in Decatur
4.1%
4.8%
Zip Codes with the Highest Percentage of Population with a Degree in Psychology in Decatur, AL
| Zip Code | % Graduates | vs State | vs National | |
| 1. | 35601 | 4.8% | 4.2%(+0.646)#165 | 5.1%(-0.225)#11,877 |
| 2. | 35603 | 4.1% | 4.2%(-0.125)#211 | 5.1%(-0.996)#14,727 |
1
Common Questions
What are the Top Zip Codes with the Highest Percentage of Population with a Degree in Psychology in Decatur, AL?
Top Zip Codes with the Highest Percentage of Population with a Degree in Psychology in Decatur, AL are:
What zip code has the Highest Percentage of Population with a Degree in Psychology in Decatur, AL?
35601 has the Highest Percentage of Population with a Degree in Psychology in Decatur, AL with 4.8%.
What is the Percentage of Population with a Degree in Psychology in Decatur, AL?
Percentage of Population with a Degree in Psychology in Decatur is 4.4%.
What is the Percentage of Population with a Degree in Psychology in Alabama?
Percentage of Population with a Degree in Psychology in Alabama is 4.2%.
What is the Percentage of Population with a Degree in Psychology in the United States?
Percentage of Population with a Degree in Psychology in the United States is 5.1%.