Immigrants from Syria vs Bermudan 3 or more Vehicles in Household

COMPARE

Immigrants from Syria
Race
Ancestry
AfghanAfricanAlaska NativeAlaskan AthabascanAlbanianAleutAlsatianAmericanApacheArabArapahoArgentineanArmenianAssyrian/Chaldean/SyriacAustralianAustrianBahamianBangladeshiBarbadianBasqueBelgianBelizeanBhutaneseBlackfeetBolivianBrazilianBritishBritish West IndianBulgarianBurmeseCajunCambodianCanadianCape VerdeanCarpatho RusynCelticCentral AmericanCentral American IndianCherokeeCheyenneChickasawChileanChineseChippewaChoctawColombianColvilleComancheCosta RicanCreeCreekCroatianCrowCubanCypriotCzechCzechoslovakianDanishDelawareDominicanDutchDutch West IndianEastern EuropeanEcuadorianEgyptianEnglishEstonianEthiopianEuropeanFijianFilipinoFinnishFrenchFrench American IndianFrench CanadianGermanGerman RussianGhanaianGreekGuamanian/ChamorroGuatemalanGuyaneseHaitianHmongHonduranHopiHoumaHungarianIcelanderIndian (Asian)IndonesianInupiatIranianIraqiIrishIroquoisIsraeliItalianJamaicanJapaneseJordanianKenyanKiowaKoreanLaotianLatvianLebaneseLiberianLithuanianLumbeeLuxembourgerMacedonianMalaysianMalteseMarshalleseMenomineeMexicanMexican American IndianMongolianMoroccanNative HawaiianNavajoNepaleseNew ZealanderNicaraguanNigerianNorthern EuropeanNorwegianOkinawanOsageOttawaPaiutePakistaniPalestinianPanamanianParaguayanPennsylvania GermanPeruvianPimaPolishPortuguesePotawatomiPuebloPuerto RicanPuget Sound SalishRomanianRussianSalvadoranSamoanScandinavianScotch-IrishScottishSeminoleSenegaleseSerbianShoshoneSierra LeoneanSiouxSlavicSlovakSloveneSomaliSouth AfricanSouth AmericanSouth American IndianSoviet UnionSpaniardSpanishSpanish AmericanSpanish American IndianSri LankanSubsaharan AfricanSudaneseSwedishSwissSyrianTaiwaneseThaiTlingit-HaidaTohono O'OdhamTonganTrinidadian and TobagonianTsimshianTurkishU.S. Virgin IslanderUgandanUkrainianUruguayanUteVenezuelanVietnameseWelshWest IndianYakamaYaquiYugoslavianYumanYup'ikZimbabwean
Immigration
NonimmigrantsImmigrantsAfghanistanAfricaAlbaniaArgentinaArmeniaAsiaAustraliaAustriaBahamasBangladeshBarbadosBelarusBelgiumBelizeBoliviaBosnia and HerzegovinaBrazilBulgariaBurma/MyanmarCabo VerdeCambodiaCameroonCanadaCaribbeanCentral AmericaChileChinaColombiaCongoCosta RicaCroatiaCubaCzechoslovakiaDenmarkDominicaDominican RepublicEastern AfricaEastern AsiaEastern EuropeEcuadorEgyptEl SalvadorEnglandEritreaEthiopiaEuropeFijiFranceGermanyGhanaGreeceGrenadaGuatemalaGuyanaHaitiHondurasHong KongHungaryIndiaIndonesiaIranIraqIrelandIsraelItalyJamaicaJapanJordanKazakhstanKenyaKoreaKuwaitLaosLatin AmericaLatviaLebanonLiberiaLithuaniaMalaysiaMexicoMicronesiaMiddle AfricaMoldovaMoroccoNepalNetherlandsNicaraguaNigeriaNorth AmericaNorth MacedoniaNorthern AfricaNorthern EuropeNorwayOceaniaPakistanPanamaPeruPhilippinesPolandPortugalRomaniaRussiaSaudi ArabiaScotlandSenegalSerbiaSierra LeoneSingaporeSomaliaSouth AfricaSouth AmericaSouth Central AsiaSouth Eastern AsiaSouthern EuropeSpainSri LankaSt. Vincent and the GrenadinesSudanSwedenSwitzerlandSyriaTaiwanThailandTrinidad and TobagoTurkeyUgandaUkraineUruguayUzbekistanVenezuelaVietnamWest IndiesWestern AfricaWestern AsiaWestern EuropeYemenZaireZimbabweAzores
Bermudan
Race
Ancestry
AfghanAfricanAlaska NativeAlaskan AthabascanAlbanianAleutAlsatianAmericanApacheArabArapahoArgentineanArmenianAssyrian/Chaldean/SyriacAustralianAustrianBahamianBangladeshiBarbadianBasqueBelgianBelizeanBermudanBhutaneseBlackfeetBolivianBrazilianBritishBritish West IndianBulgarianBurmeseCajunCambodianCanadianCape VerdeanCarpatho RusynCelticCentral AmericanCentral American IndianCherokeeCheyenneChickasawChileanChineseChippewaChoctawColombianColvilleComancheCosta RicanCreeCreekCroatianCrowCubanCypriotCzechCzechoslovakianDanishDelawareDominicanDutchDutch West IndianEastern EuropeanEcuadorianEgyptianEnglishEstonianEthiopianEuropeanFijianFilipinoFinnishFrenchFrench American IndianFrench CanadianGermanGerman RussianGhanaianGreekGuamanian/ChamorroGuatemalanGuyaneseHaitianHmongHonduranHopiHoumaHungarianIcelanderIndian (Asian)IndonesianInupiatIranianIraqiIrishIroquoisIsraeliItalianJamaicanJapaneseJordanianKenyanKiowaKoreanLaotianLatvianLebaneseLiberianLithuanianLumbeeLuxembourgerMacedonianMalaysianMalteseMarshalleseMenomineeMexicanMexican American IndianMongolianMoroccanNative HawaiianNavajoNepaleseNew ZealanderNicaraguanNigerianNorthern EuropeanNorwegianOkinawanOsageOttawaPaiutePakistaniPalestinianPanamanianParaguayanPennsylvania GermanPeruvianPimaPolishPortuguesePotawatomiPuebloPuerto RicanPuget Sound SalishRomanianRussianSalvadoranSamoanScandinavianScotch-IrishScottishSeminoleSenegaleseSerbianShoshoneSierra LeoneanSiouxSlavicSlovakSloveneSomaliSouth AfricanSouth AmericanSouth American IndianSoviet UnionSpaniardSpanishSpanish AmericanSpanish American IndianSri LankanSubsaharan AfricanSudaneseSwedishSwissSyrianTaiwaneseThaiTlingit-HaidaTohono O'OdhamTonganTrinidadian and TobagonianTsimshianTurkishU.S. Virgin IslanderUgandanUkrainianUruguayanUteVenezuelanVietnameseWelshWest IndianYakamaYaquiYugoslavianYumanYup'ikZimbabwean
Immigration
NonimmigrantsImmigrantsAfghanistanAfricaAlbaniaArgentinaArmeniaAsiaAustraliaAustriaBahamasBangladeshBarbadosBelarusBelgiumBelizeBoliviaBosnia and HerzegovinaBrazilBulgariaBurma/MyanmarCabo VerdeCambodiaCameroonCanadaCaribbeanCentral AmericaChileChinaColombiaCongoCosta RicaCroatiaCubaCzechoslovakiaDenmarkDominicaDominican RepublicEastern AfricaEastern AsiaEastern EuropeEcuadorEgyptEl SalvadorEnglandEritreaEthiopiaEuropeFijiFranceGermanyGhanaGreeceGrenadaGuatemalaGuyanaHaitiHondurasHong KongHungaryIndiaIndonesiaIranIraqIrelandIsraelItalyJamaicaJapanJordanKazakhstanKenyaKoreaKuwaitLaosLatin AmericaLatviaLebanonLiberiaLithuaniaMalaysiaMexicoMicronesiaMiddle AfricaMoldovaMoroccoNepalNetherlandsNicaraguaNigeriaNorth AmericaNorth MacedoniaNorthern AfricaNorthern EuropeNorwayOceaniaPakistanPanamaPeruPhilippinesPolandPortugalRomaniaRussiaSaudi ArabiaScotlandSenegalSerbiaSierra LeoneSingaporeSomaliaSouth AfricaSouth AmericaSouth Central AsiaSouth Eastern AsiaSouthern EuropeSpainSri LankaSt. Vincent and the GrenadinesSudanSwedenSwitzerlandTaiwanThailandTrinidad and TobagoTurkeyUgandaUkraineUruguayUzbekistanVenezuelaVietnamWest IndiesWestern AfricaWestern AsiaWestern EuropeYemenZaireZimbabweAzores
3 or more Vehicles in Household
Income
Poverty
Unemployment
Labor Participation
Family Structure
Vehicle Availability
Education Level
Disability

3 or more Vehicles in Household Comparison

Immigrants from Syria

Bermudans

Average
Tragic
19.4%
3 OR MORE VEHICLES IN HOUSEHOLD
40.3/ 100
METRIC RATING
178th/ 347
METRIC RANK
17.8%
3 OR MORE VEHICLES IN HOUSEHOLD
0.9/ 100
METRIC RATING
263rd/ 347
METRIC RANK

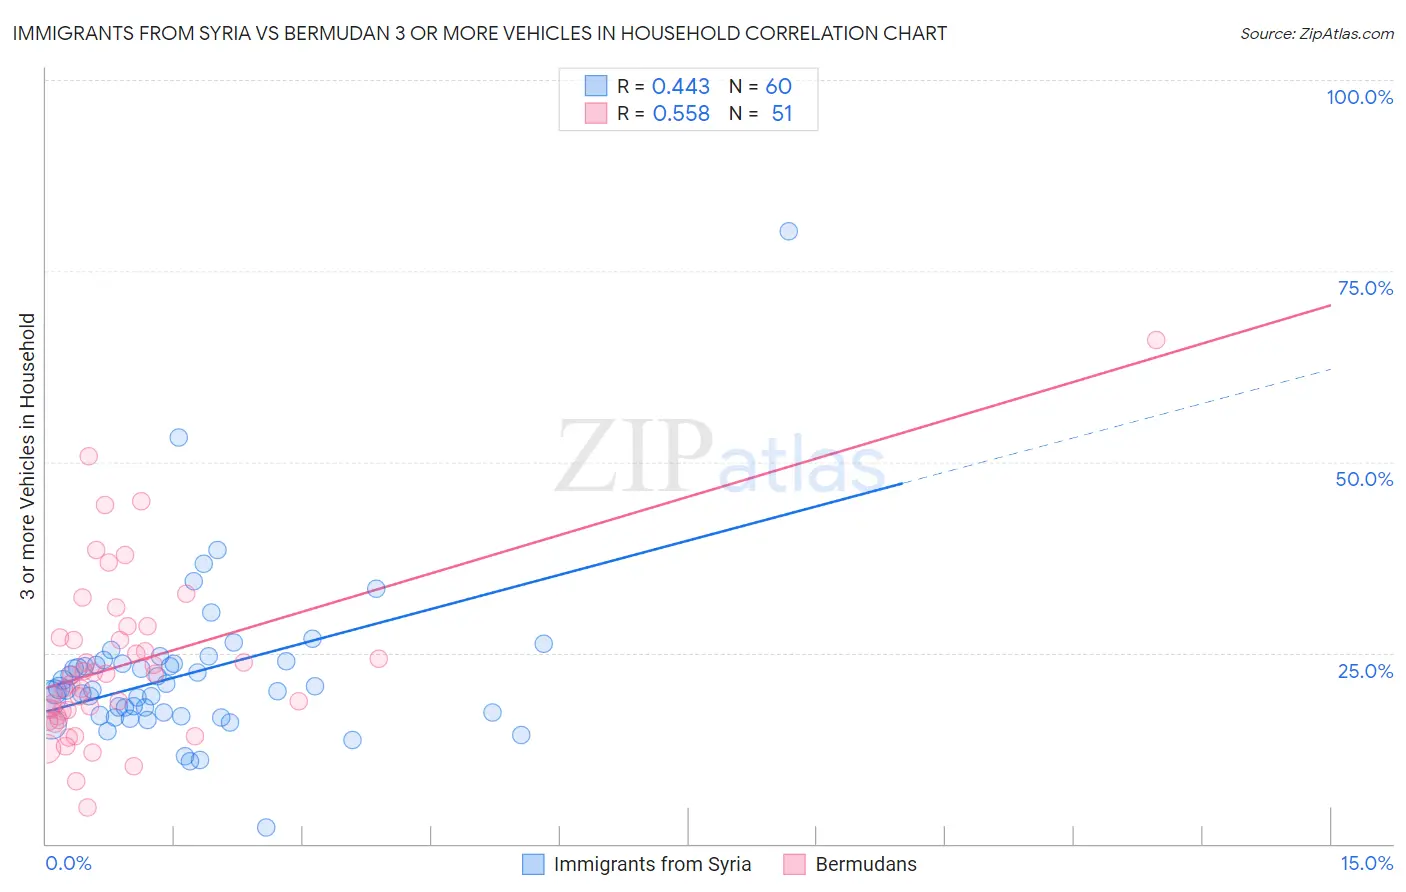
Immigrants from Syria vs Bermudan 3 or more Vehicles in Household Correlation Chart

The statistical analysis conducted on geographies consisting of 174,111,368 people shows a moderate positive correlation between the proportion of Immigrants from Syria and percentage of households with 3 or more vehicles available in the United States with a correlation coefficient (R) of 0.443 and weighted average of 19.4%. Similarly, the statistical analysis conducted on geographies consisting of 55,710,520 people shows a substantial positive correlation between the proportion of Bermudans and percentage of households with 3 or more vehicles available in the United States with a correlation coefficient (R) of 0.558 and weighted average of 17.8%, a difference of 9.0%.
Immigrants from Syria vs Bermudan 3 or more Vehicles in Household

3 or more Vehicles in Household Correlation Summary

MeasurementImmigrants from SyriaBermudan
Minimum2.1%4.8%
Maximum80.2%66.0%
Range78.1%61.2%
Mean22.3%23.6%
Median20.3%22.1%
Interquartile 25% (IQ1)17.0%16.7%
Interquartile 75% (IQ3)23.7%27.0%
Interquartile Range (IQR)6.7%10.3%
Standard Deviation (Sample)10.6%11.2%
Standard Deviation (Population)10.5%11.1%

Similar Demographics by 3 or more Vehicles in Household

Demographics Similar to Immigrants from Syria by 3 or more Vehicles in Household

In terms of 3 or more vehicles in household, the demographic groups most similar to Immigrants from Syria are Immigrants from Peru (19.4%, a difference of 0.070%), Immigrants from South Central Asia (19.3%, a difference of 0.11%), South African (19.3%, a difference of 0.22%), Romanian (19.3%, a difference of 0.25%), and Cuban (19.3%, a difference of 0.30%).
DemographicsRating | Rank3 or more Vehicles in Household
Immigrants | Western Europe
53.2
/100
|
#171
Average
19.5%
Kiowa
50.9
/100
|
#172
Average
19.5%
Immigrants | Northern Europe
50.2
/100
|
#173
Average
19.5%
Immigrants | South Africa
50.0
/100
|
#174
Average
19.5%
Syrians
47.0
/100
|
#175
Average
19.5%
Iroquois
46.0
/100
|
#176
Average
19.4%
Immigrants | Peru
41.1
/100
|
#177
Average
19.4%
Immigrants | Syria
40.3
/100
|
#178
Average
19.4%
Immigrants | South Central Asia
38.9
/100
|
#179
Fair
19.3%
South Africans
37.5
/100
|
#180
Fair
19.3%
Romanians
37.1
/100
|
#181
Fair
19.3%
Cubans
36.6
/100
|
#182
Fair
19.3%
Cajuns
36.0
/100
|
#183
Fair
19.3%
Latvians
35.7
/100
|
#184
Fair
19.3%
Immigrants | Sri Lanka
30.7
/100
|
#185
Fair
19.2%

Demographics Similar to Bermudans by 3 or more Vehicles in Household

In terms of 3 or more vehicles in household, the demographic groups most similar to Bermudans are Cambodian (17.8%, a difference of 0.030%), Colombian (17.8%, a difference of 0.11%), Immigrants from Northern Africa (17.8%, a difference of 0.14%), Ugandan (17.8%, a difference of 0.16%), and Immigrants from Panama (17.7%, a difference of 0.16%).
DemographicsRating | Rank3 or more Vehicles in Household
Sub-Saharan Africans
1.1
/100
|
#256
Tragic
17.9%
Immigrants | Eritrea
1.1
/100
|
#257
Tragic
17.8%
Sudanese
1.1
/100
|
#258
Tragic
17.8%
Uruguayans
1.0
/100
|
#259
Tragic
17.8%
Ugandans
0.9
/100
|
#260
Tragic
17.8%
Immigrants | Northern Africa
0.9
/100
|
#261
Tragic
17.8%
Colombians
0.9
/100
|
#262
Tragic
17.8%
Bermudans
0.9
/100
|
#263
Tragic
17.8%
Cambodians
0.9
/100
|
#264
Tragic
17.8%
Immigrants | Panama
0.8
/100
|
#265
Tragic
17.7%
Macedonians
0.8
/100
|
#266
Tragic
17.7%
Immigrants | Venezuela
0.8
/100
|
#267
Tragic
17.7%
Immigrants | Bulgaria
0.8
/100
|
#268
Tragic
17.7%
Immigrants | France
0.6
/100
|
#269
Tragic
17.6%
Immigrants | Nepal
0.6
/100
|
#270
Tragic
17.6%