Zip Codes with the Highest Percentage of Households with Income Above $100,000 in Warrenton, VA
RELATED REPORTS & OPTIONS
Household Income | $100k+
Warrenton
Compare Zip Codes
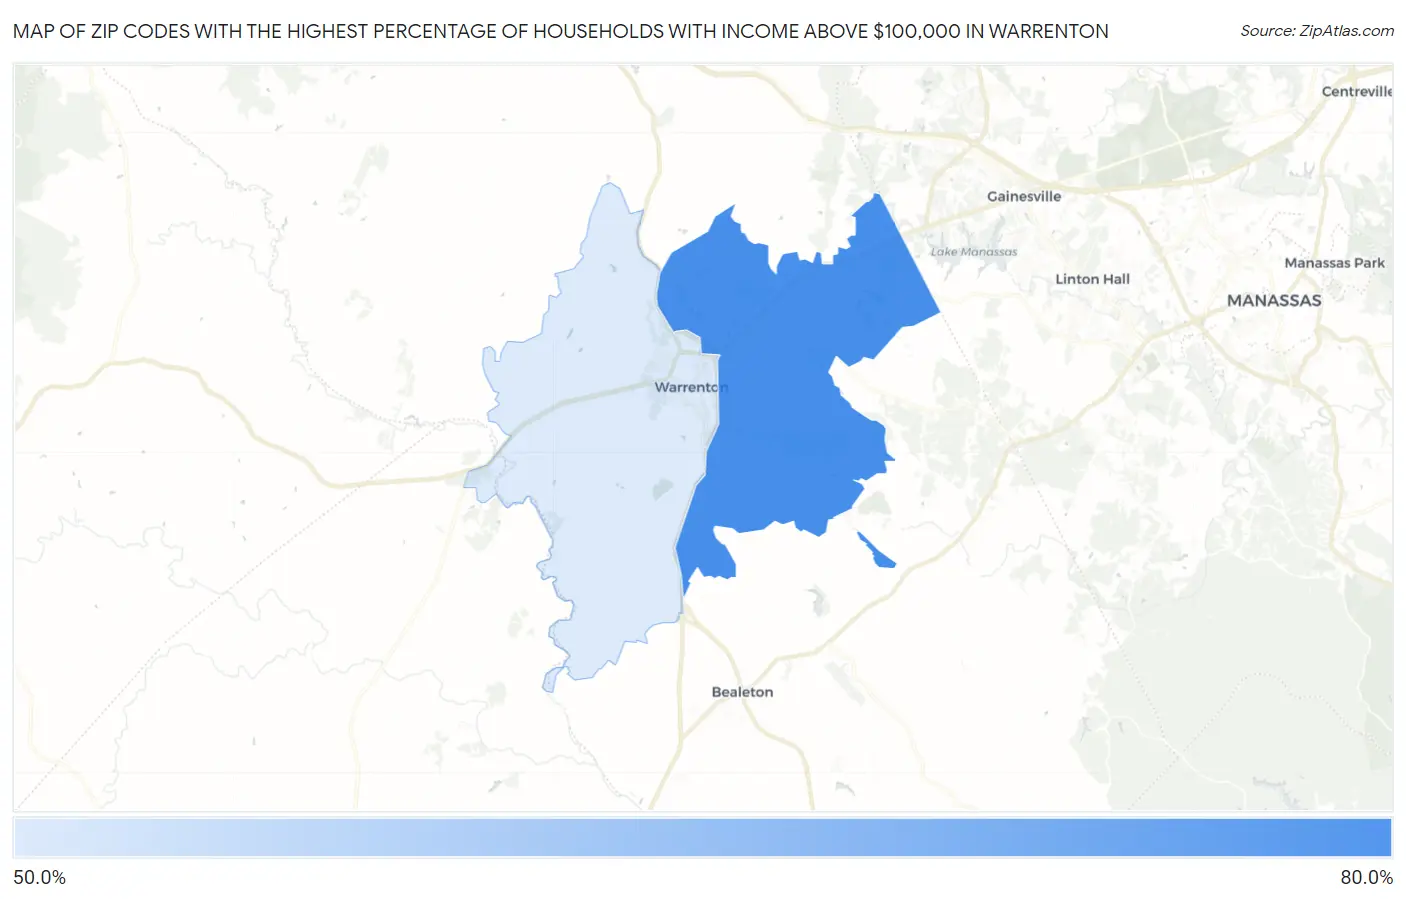
Map of Zip Codes with the Highest Percentage of Households with Income Above $100,000 in Warrenton
50.4%
75.3%
Zip Codes with the Highest Percentage of Households with Income Above $100,000 in Warrenton, VA
| Zip Code | Households with Income > $100k | vs State | vs National | |
| 1. | 20187 | 75.3% | 44.1%(+31.2)#41 | 37.3%(+38.0)#560 |
| 2. | 20186 | 50.4% | 44.1%(+6.30)#184 | 37.3%(+13.1)#4,713 |
1
Common Questions
What are the Top Zip Codes with the Highest Percentage of Households with Income Above $100,000 in Warrenton, VA?
Top Zip Codes with the Highest Percentage of Households with Income Above $100,000 in Warrenton, VA are:
What zip code has the Highest Percentage of Households with Income Above $100,000 in Warrenton, VA?
20187 has the Highest Percentage of Households with Income Above $100,000 in Warrenton, VA with 75.3%.
What is the Percentage of Households with Income Above $100,000 in Warrenton, VA?
Percentage of Households with Income Above $100,000 in Warrenton is 41.5%.
What is the Percentage of Households with Income Above $100,000 in Virginia?
Percentage of Households with Income Above $100,000 in Virginia is 44.1%.
What is the Percentage of Households with Income Above $100,000 in the United States?
Percentage of Households with Income Above $100,000 in the United States is 37.3%.