Zip Codes with the Highest Percentage of Population Employed in Real Estate, Rental & Leasing in Warrenton, VA
RELATED REPORTS & OPTIONS
Real Estate, Rental & Leasing
Warrenton
Compare Zip Codes
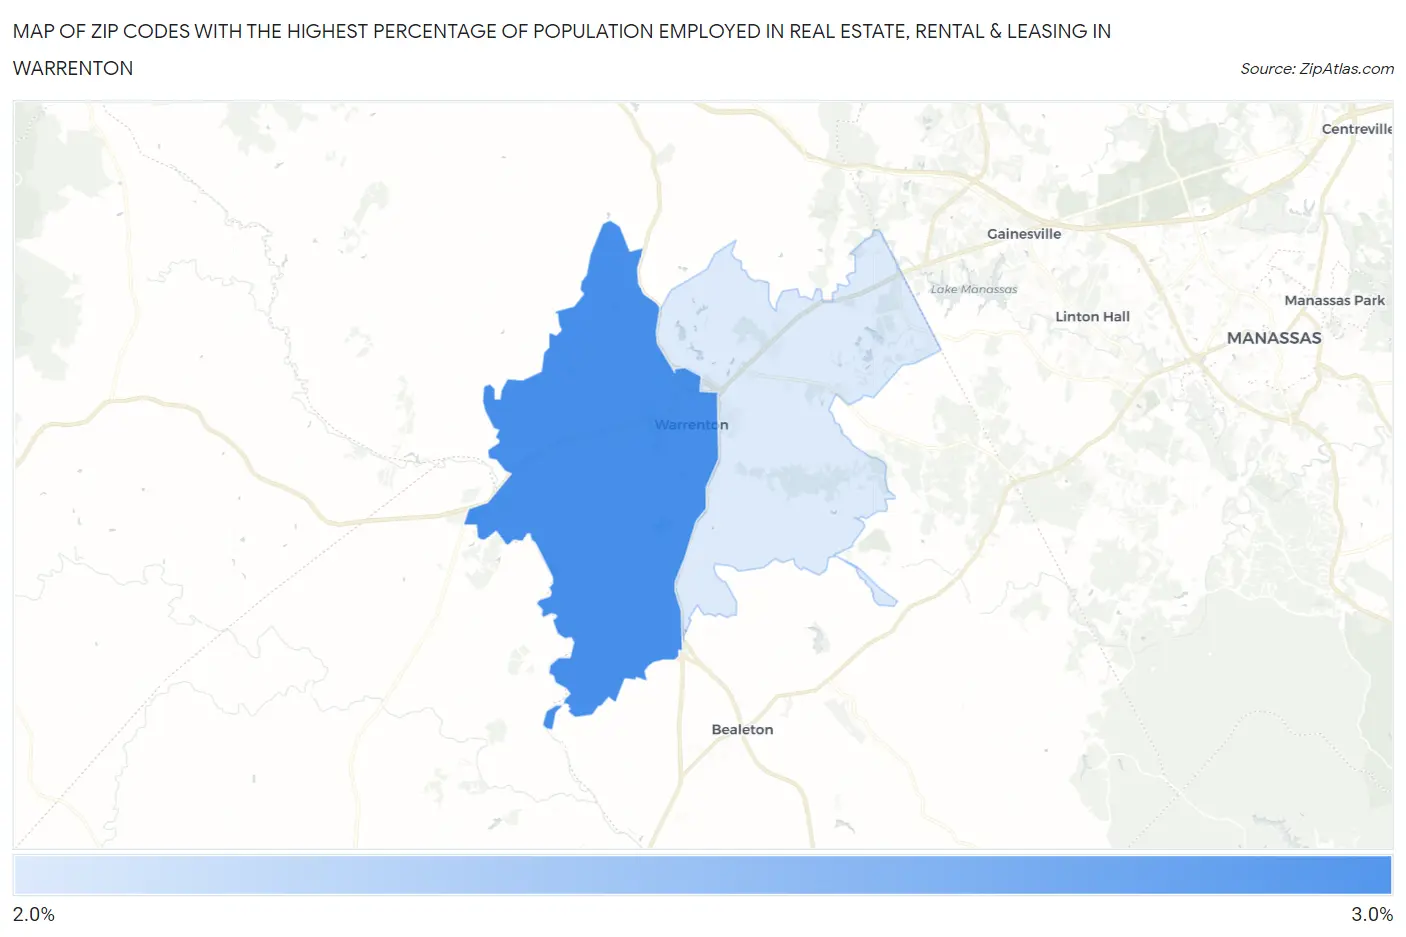
Map of Zip Codes with the Highest Percentage of Population Employed in Real Estate, Rental & Leasing in Warrenton
2.7%
2.8%
Zip Codes with the Highest Percentage of Population Employed in Real Estate, Rental & Leasing in Warrenton, VA
| Zip Code | % Employed | vs State | vs National | |
| 1. | 20186 | 2.8% | 1.9%(+0.983)#126 | 1.9%(+0.949)#4,323 |
| 2. | 20187 | 2.7% | 1.9%(+0.814)#140 | 1.9%(+0.780)#4,843 |
1
Common Questions
What are the Top Zip Codes with the Highest Percentage of Population Employed in Real Estate, Rental & Leasing in Warrenton, VA?
Top Zip Codes with the Highest Percentage of Population Employed in Real Estate, Rental & Leasing in Warrenton, VA are:
What zip code has the Highest Percentage of Population Employed in Real Estate, Rental & Leasing in Warrenton, VA?
20186 has the Highest Percentage of Population Employed in Real Estate, Rental & Leasing in Warrenton, VA with 2.8%.
What is the Percentage of Population Employed in Real Estate, Rental & Leasing in Warrenton, VA?
Percentage of Population Employed in Real Estate, Rental & Leasing in Warrenton is 2.8%.
What is the Percentage of Population Employed in Real Estate, Rental & Leasing in Virginia?
Percentage of Population Employed in Real Estate, Rental & Leasing in Virginia is 1.9%.
What is the Percentage of Population Employed in Real Estate, Rental & Leasing in the United States?
Percentage of Population Employed in Real Estate, Rental & Leasing in the United States is 1.9%.