Victoria, TX Map & Demographics
Victoria Map
Victoria Overview
$30,709
PER CAPITA INCOME
$78,779
AVG FAMILY INCOME
$64,832
AVG HOUSEHOLD INCOME
38.2%
WAGE / INCOME GAP [ % ]
61.8¢/ $1
WAGE / INCOME GAP [ $ ]
$8,285
FAMILY INCOME DEFICIT
0.44
INEQUALITY / GINI INDEX
65,481
TOTAL POPULATION
32,151
MALE POPULATION
33,330
FEMALE POPULATION
96.46
MALES / 100 FEMALES
103.67
FEMALES / 100 MALES
34.7
MEDIAN AGE
3.2
AVG FAMILY SIZE
2.6
AVG HOUSEHOLD SIZE
32,271
LABOR FORCE [ PEOPLE ]
63.8%
PERCENT IN LABOR FORCE
5.5%
UNEMPLOYMENT RATE
Victoria Area Codes
Income in Victoria
Income Overview in Victoria
Per Capita Income in Victoria is $30,709, while median incomes of families and households are $78,779 and $64,832 respectively.
| Characteristic | Number | Measure |
| Per Capita Income | 65,481 | $30,709 |
| Median Family Income | 15,997 | $78,779 |
| Mean Family Income | 15,997 | $91,963 |
| Median Household Income | 24,698 | $64,832 |
| Mean Household Income | 24,698 | $80,502 |
| Income Deficit | 15,997 | $8,285 |
| Wage / Income Gap (%) | 65,481 | 38.15% |
| Wage / Income Gap ($) | 65,481 | 61.85¢ per $1 |
| Gini / Inequality Index | 65,481 | 0.44 |
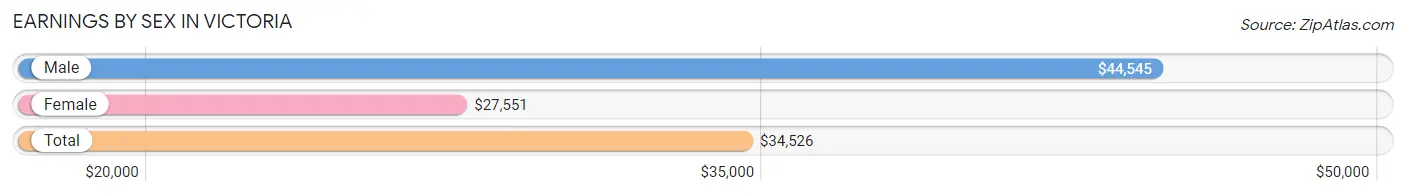
Earnings by Sex in Victoria
Average Earnings in Victoria are $34,526, $44,545 for men and $27,551 for women, a difference of 38.2%.
| Sex | Number | Average Earnings |
| Male | 17,703 (53.1%) | $44,545 |
| Female | 15,608 (46.9%) | $27,551 |
| Total | 33,311 (100.0%) | $34,526 |
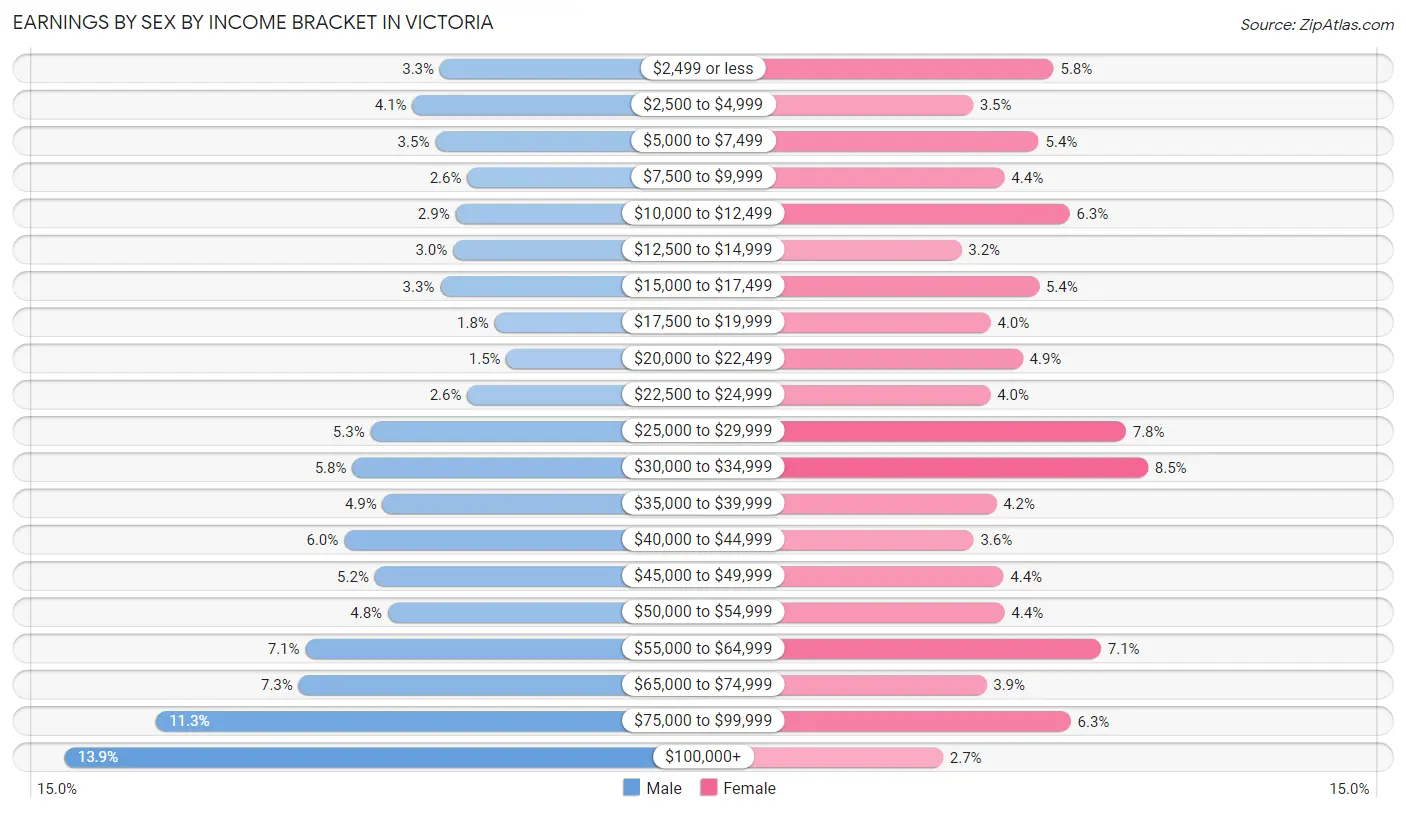
Earnings by Sex by Income Bracket in Victoria
The most common earnings brackets in Victoria are $100,000+ for men (2,456 | 13.9%) and $30,000 to $34,999 for women (1,320 | 8.5%).
| Income | Male | Female |
| $2,499 or less | 590 (3.3%) | 907 (5.8%) |
| $2,500 to $4,999 | 726 (4.1%) | 552 (3.5%) |
| $5,000 to $7,499 | 613 (3.5%) | 842 (5.4%) |
| $7,500 to $9,999 | 454 (2.6%) | 692 (4.4%) |
| $10,000 to $12,499 | 512 (2.9%) | 977 (6.3%) |
| $12,500 to $14,999 | 524 (3.0%) | 503 (3.2%) |
| $15,000 to $17,499 | 588 (3.3%) | 843 (5.4%) |
| $17,500 to $19,999 | 316 (1.8%) | 630 (4.0%) |
| $20,000 to $22,499 | 258 (1.5%) | 771 (4.9%) |
| $22,500 to $24,999 | 453 (2.6%) | 629 (4.0%) |
| $25,000 to $29,999 | 934 (5.3%) | 1,224 (7.8%) |
| $30,000 to $34,999 | 1,025 (5.8%) | 1,320 (8.5%) |
| $35,000 to $39,999 | 874 (4.9%) | 655 (4.2%) |
| $40,000 to $44,999 | 1,065 (6.0%) | 556 (3.6%) |
| $45,000 to $49,999 | 914 (5.2%) | 686 (4.4%) |
| $50,000 to $54,999 | 848 (4.8%) | 692 (4.4%) |
| $55,000 to $64,999 | 1,259 (7.1%) | 1,114 (7.1%) |
| $65,000 to $74,999 | 1,293 (7.3%) | 612 (3.9%) |
| $75,000 to $99,999 | 2,001 (11.3%) | 981 (6.3%) |
| $100,000+ | 2,456 (13.9%) | 422 (2.7%) |
| Total | 17,703 (100.0%) | 15,608 (100.0%) |
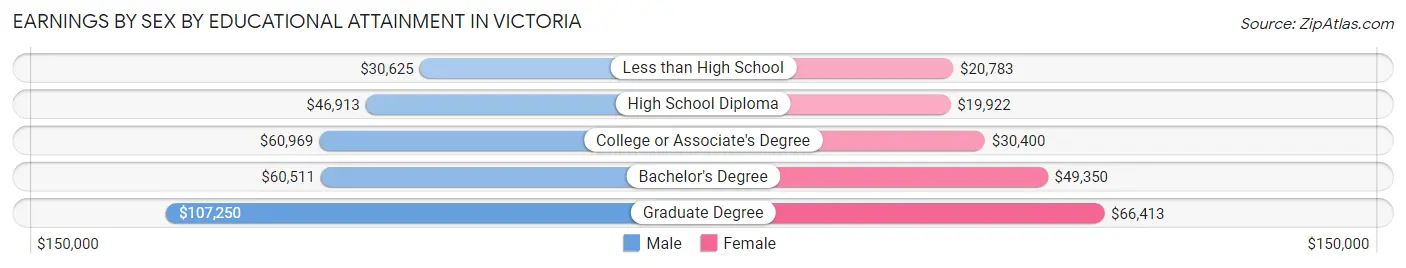
Earnings by Sex by Educational Attainment in Victoria
Average earnings in Victoria are $51,385 for men and $30,470 for women, a difference of 40.7%. Men with an educational attainment of graduate degree enjoy the highest average annual earnings of $107,250, while those with less than high school education earn the least with $30,625. Women with an educational attainment of graduate degree earn the most with the average annual earnings of $66,413, while those with high school diploma education have the smallest earnings of $19,922.
| Educational Attainment | Male Income | Female Income |
| Less than High School | $30,625 | $20,783 |
| High School Diploma | $46,913 | $19,922 |
| College or Associate's Degree | $60,969 | $30,400 |
| Bachelor's Degree | $60,511 | $49,350 |
| Graduate Degree | $107,250 | $66,413 |
| Total | $51,385 | $30,470 |
Family Income in Victoria
Family Income Brackets in Victoria
According to the Victoria family income data, there are 3,407 families falling into the $100,000 to $149,999 income range, which is the most common income bracket and makes up 21.3% of all families. Conversely, the less than $10,000 income bracket is the least frequent group with only 384 families (2.4%) belonging to this category.
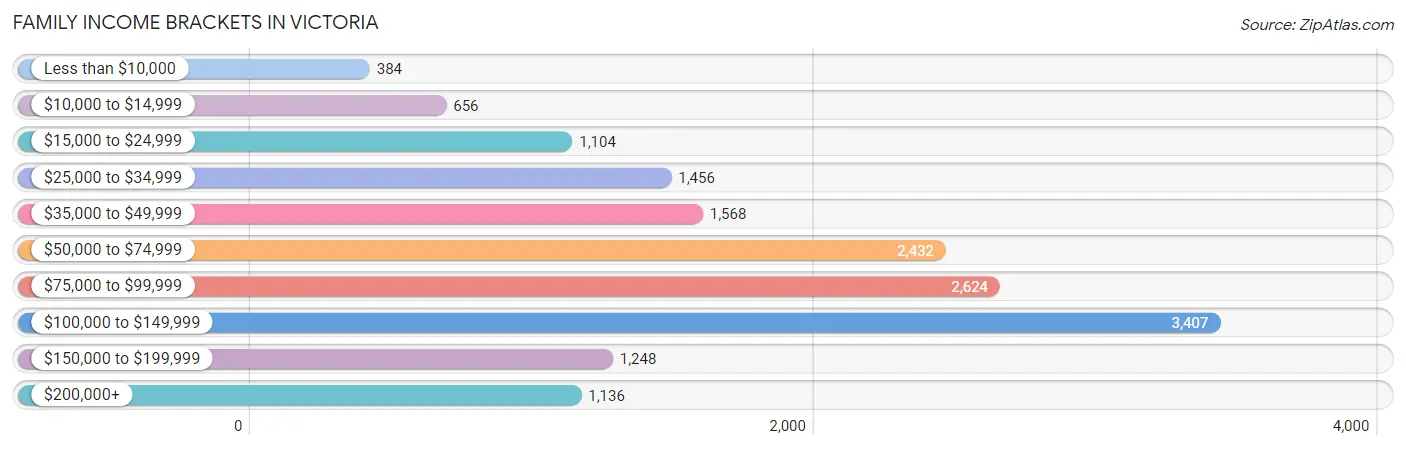
| Income Bracket | # Families | % Families |
| Less than $10,000 | 384 | 2.4% |
| $10,000 to $14,999 | 656 | 4.1% |
| $15,000 to $24,999 | 1,104 | 6.9% |
| $25,000 to $34,999 | 1,456 | 9.1% |
| $35,000 to $49,999 | 1,568 | 9.8% |
| $50,000 to $74,999 | 2,432 | 15.2% |
| $75,000 to $99,999 | 2,624 | 16.4% |
| $100,000 to $149,999 | 3,407 | 21.3% |
| $150,000 to $199,999 | 1,248 | 7.8% |
| $200,000+ | 1,136 | 7.1% |
Family Income by Famaliy Size in Victoria
4-person families (2,421 | 15.1%) account for the highest median family income in Victoria with $92,637 per family, while 2-person families (7,283 | 45.5%) have the highest median income of $33,998 per family member.
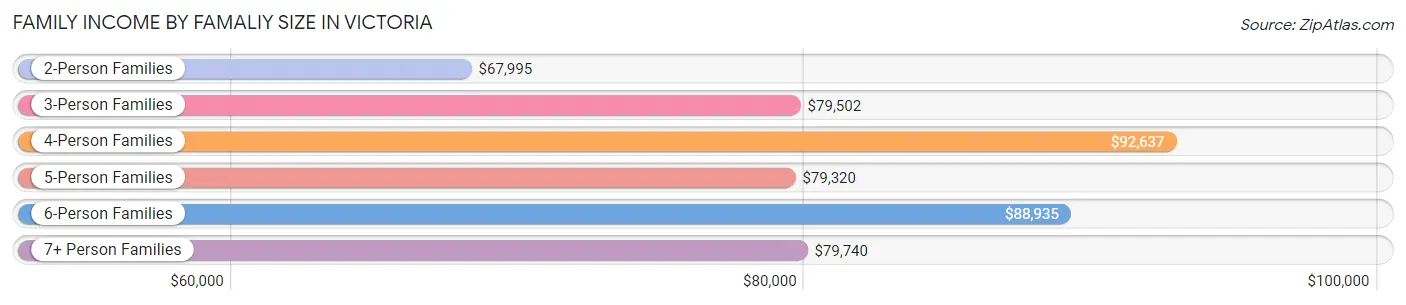
| Income Bracket | # Families | Median Income |
| 2-Person Families | 7,283 (45.5%) | $67,995 |
| 3-Person Families | 3,693 (23.1%) | $79,502 |
| 4-Person Families | 2,421 (15.1%) | $92,637 |
| 5-Person Families | 1,715 (10.7%) | $79,320 |
| 6-Person Families | 549 (3.4%) | $88,935 |
| 7+ Person Families | 336 (2.1%) | $79,740 |
| Total | 15,997 (100.0%) | $78,779 |
Family Income by Number of Earners in Victoria
The median family income in Victoria is $78,779, with families comprising 3+ earners (1,694) having the highest median family income of $116,739, while families with 1 earner (6,031) have the lowest median family income of $49,382, accounting for 10.6% and 37.7% of families, respectively.
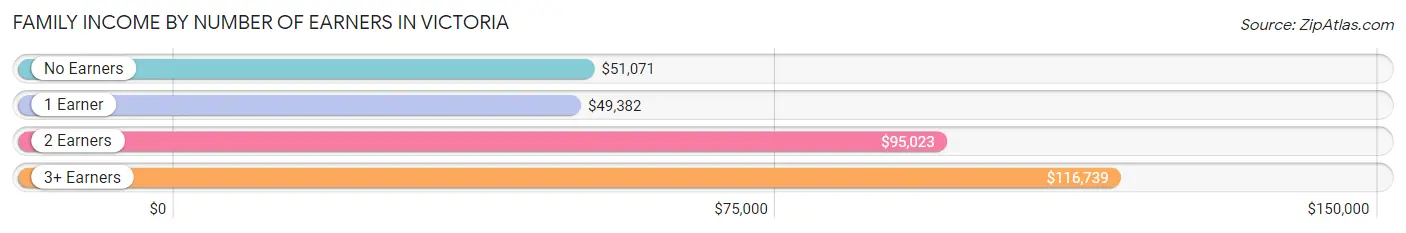
| Number of Earners | # Families | Median Income |
| No Earners | 2,048 (12.8%) | $51,071 |
| 1 Earner | 6,031 (37.7%) | $49,382 |
| 2 Earners | 6,224 (38.9%) | $95,023 |
| 3+ Earners | 1,694 (10.6%) | $116,739 |
| Total | 15,997 (100.0%) | $78,779 |
Household Income in Victoria
Household Income Brackets in Victoria
With 4,199 households falling in the category, the $50,000 to $74,999 income range is the most frequent in Victoria, accounting for 17.0% of all households. In contrast, only 1,136 households (4.6%) fall into the less than $10,000 income bracket, making it the least populous group.
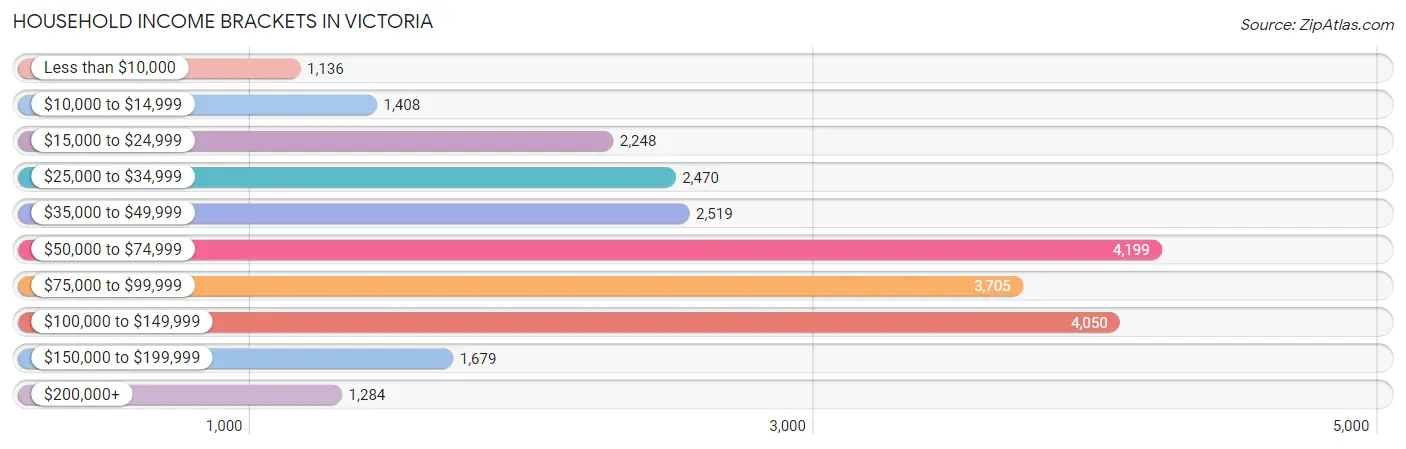
| Income Bracket | # Households | % Households |
| Less than $10,000 | 1,136 | 4.6% |
| $10,000 to $14,999 | 1,408 | 5.7% |
| $15,000 to $24,999 | 2,248 | 9.1% |
| $25,000 to $34,999 | 2,470 | 10.0% |
| $35,000 to $49,999 | 2,519 | 10.2% |
| $50,000 to $74,999 | 4,199 | 17.0% |
| $75,000 to $99,999 | 3,705 | 15.0% |
| $100,000 to $149,999 | 4,050 | 16.4% |
| $150,000 to $199,999 | 1,679 | 6.8% |
| $200,000+ | 1,284 | 5.2% |
Household Income by Householder Age in Victoria
The median household income in Victoria is $64,832, with the highest median household income of $78,750 found in the 45 to 64 years age bracket for the primary householder. A total of 8,247 households (33.4%) fall into this category. Meanwhile, the 15 to 24 years age bracket for the primary householder has the lowest median household income of $32,182, with 1,099 households (4.4%) in this group.
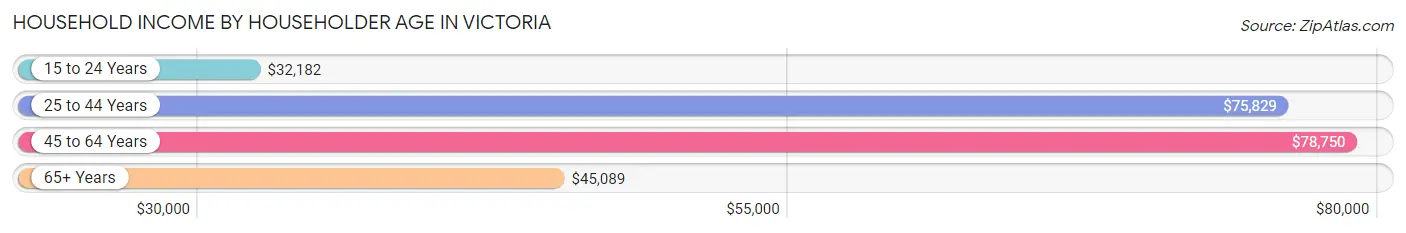
| Income Bracket | # Households | Median Income |
| 15 to 24 Years | 1,099 (4.4%) | $32,182 |
| 25 to 44 Years | 9,109 (36.9%) | $75,829 |
| 45 to 64 Years | 8,247 (33.4%) | $78,750 |
| 65+ Years | 6,243 (25.3%) | $45,089 |
| Total | 24,698 (100.0%) | $64,832 |
Poverty in Victoria
Income Below Poverty by Sex and Age in Victoria
With 15.8% poverty level for males and 20.2% for females among the residents of Victoria, 15 year old males and 5 year old females are the most vulnerable to poverty, with 145 males (28.4%) and 199 females (54.4%) in their respective age groups living below the poverty level.
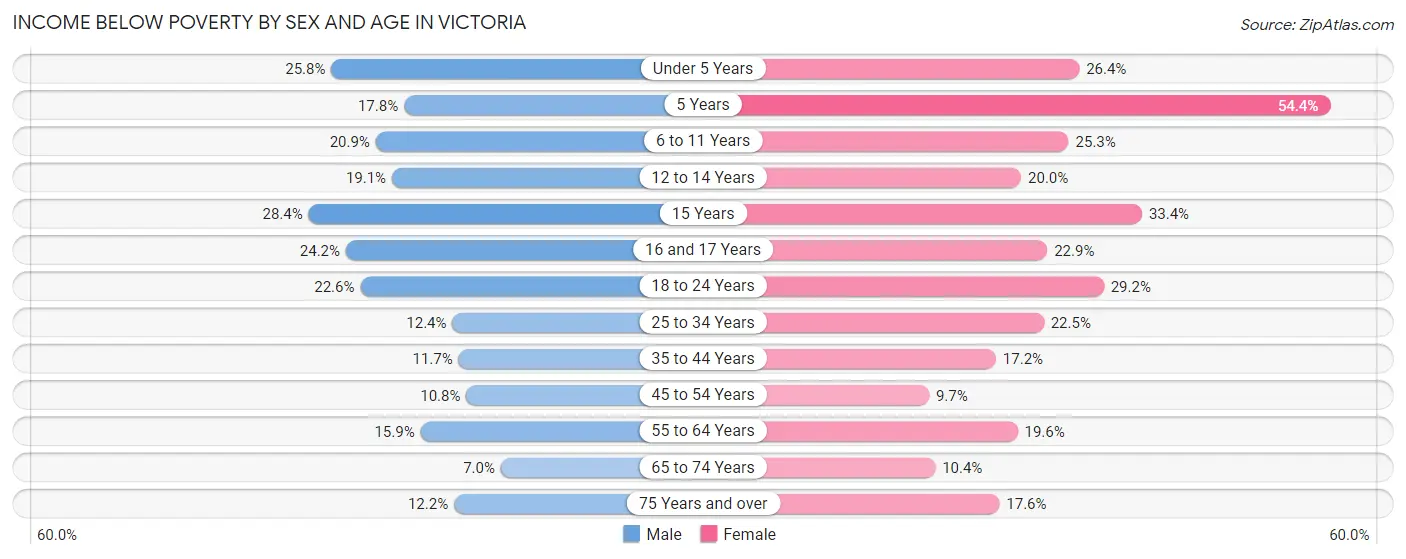
| Age Bracket | Male | Female |
| Under 5 Years | 556 (25.8%) | 582 (26.4%) |
| 5 Years | 60 (17.7%) | 199 (54.4%) |
| 6 to 11 Years | 509 (20.9%) | 655 (25.3%) |
| 12 to 14 Years | 289 (19.1%) | 251 (20.0%) |
| 15 Years | 145 (28.4%) | 234 (33.4%) |
| 16 and 17 Years | 240 (24.2%) | 165 (22.9%) |
| 18 to 24 Years | 749 (22.6%) | 901 (29.2%) |
| 25 to 34 Years | 629 (12.4%) | 1,070 (22.5%) |
| 35 to 44 Years | 449 (11.7%) | 709 (17.2%) |
| 45 to 54 Years | 343 (10.8%) | 339 (9.7%) |
| 55 to 64 Years | 568 (15.9%) | 788 (19.6%) |
| 65 to 74 Years | 188 (7.0%) | 313 (10.4%) |
| 75 Years and over | 187 (12.2%) | 406 (17.5%) |
| Total | 4,912 (15.8%) | 6,612 (20.2%) |
Income Above Poverty by Sex and Age in Victoria
According to the poverty statistics in Victoria, males aged 65 to 74 years and females aged 45 to 54 years are the age groups that are most secure financially, with 93.0% of males and 90.3% of females in these age groups living above the poverty line.
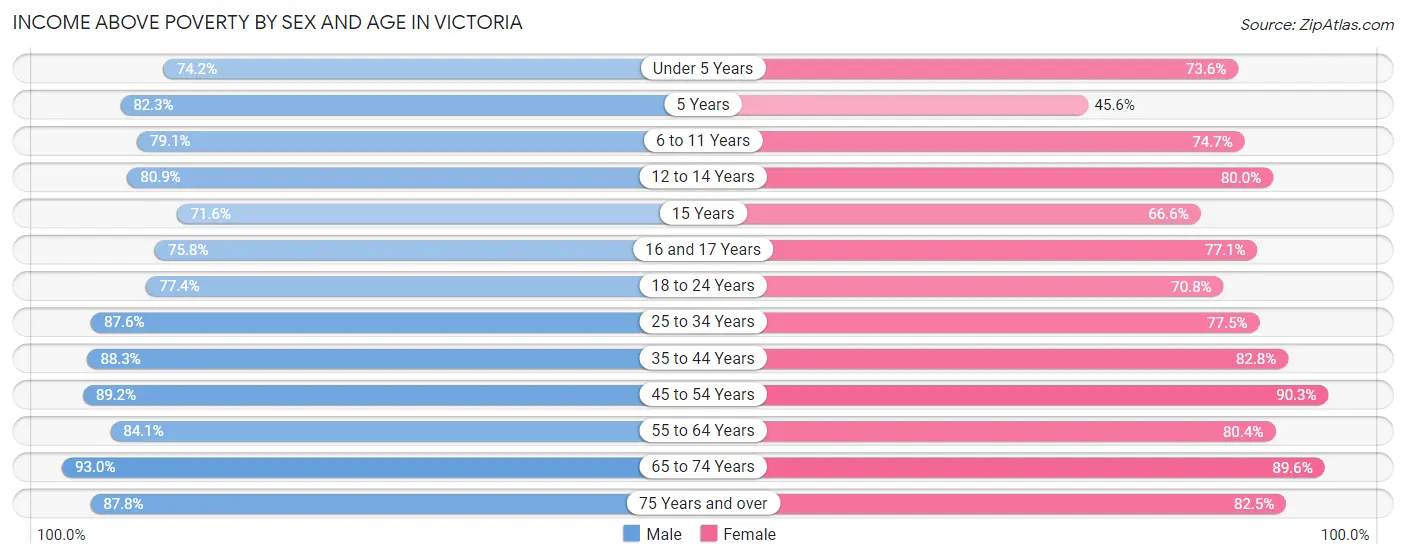
| Age Bracket | Male | Female |
| Under 5 Years | 1,596 (74.2%) | 1,619 (73.6%) |
| 5 Years | 278 (82.3%) | 167 (45.6%) |
| 6 to 11 Years | 1,926 (79.1%) | 1,938 (74.7%) |
| 12 to 14 Years | 1,225 (80.9%) | 1,006 (80.0%) |
| 15 Years | 366 (71.6%) | 466 (66.6%) |
| 16 and 17 Years | 751 (75.8%) | 556 (77.1%) |
| 18 to 24 Years | 2,564 (77.4%) | 2,188 (70.8%) |
| 25 to 34 Years | 4,459 (87.6%) | 3,688 (77.5%) |
| 35 to 44 Years | 3,399 (88.3%) | 3,423 (82.8%) |
| 45 to 54 Years | 2,829 (89.2%) | 3,153 (90.3%) |
| 55 to 64 Years | 3,003 (84.1%) | 3,239 (80.4%) |
| 65 to 74 Years | 2,508 (93.0%) | 2,697 (89.6%) |
| 75 Years and over | 1,348 (87.8%) | 1,908 (82.5%) |
| Total | 26,252 (84.2%) | 26,048 (79.8%) |
Income Below Poverty Among Married-Couple Families in Victoria
The poverty statistics for married-couple families in Victoria show that 7.3% or 804 of the total 10,946 families live below the poverty line. Families with 5 or more children have the highest poverty rate of 33.7%, comprising of 35 families. On the other hand, families with no children have the lowest poverty rate of 4.3%, which includes 273 families.
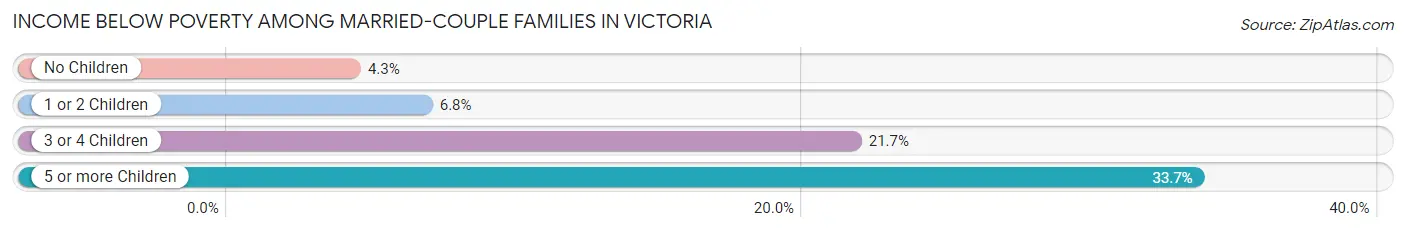
| Children | Above Poverty | Below Poverty |
| No Children | 6,104 (95.7%) | 273 (4.3%) |
| 1 or 2 Children | 2,956 (93.2%) | 215 (6.8%) |
| 3 or 4 Children | 1,013 (78.3%) | 281 (21.7%) |
| 5 or more Children | 69 (66.3%) | 35 (33.7%) |
| Total | 10,142 (92.6%) | 804 (7.3%) |
Income Below Poverty Among Single-Parent Households in Victoria
According to the poverty data in Victoria, 15.8% or 221 single-father households and 33.9% or 1,239 single-mother households are living below the poverty line. Among single-father households, those with 1 or 2 children have the highest poverty rate, with 143 households (21.1%) experiencing poverty. Likewise, among single-mother households, those with 5 or more children have the highest poverty rate, with 27 households (100.0%) falling below the poverty line.
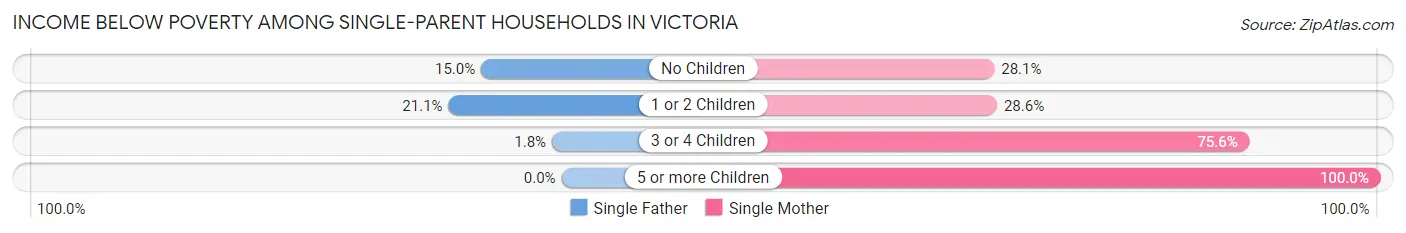
| Children | Single Father | Single Mother |
| No Children | 74 (15.0%) | 371 (28.1%) |
| 1 or 2 Children | 143 (21.1%) | 547 (28.6%) |
| 3 or 4 Children | 4 (1.8%) | 294 (75.6%) |
| 5 or more Children | 0 (0.0%) | 27 (100.0%) |
| Total | 221 (15.8%) | 1,239 (33.9%) |
Income Below Poverty Among Married-Couple vs Single-Parent Households in Victoria
The poverty data for Victoria shows that 804 of the married-couple family households (7.3%) and 1,460 of the single-parent households (28.9%) are living below the poverty level. Within the married-couple family households, those with 5 or more children have the highest poverty rate, with 35 households (33.7%) falling below the poverty line. Among the single-parent households, those with 5 or more children have the highest poverty rate, with 27 household (100.0%) living below poverty.
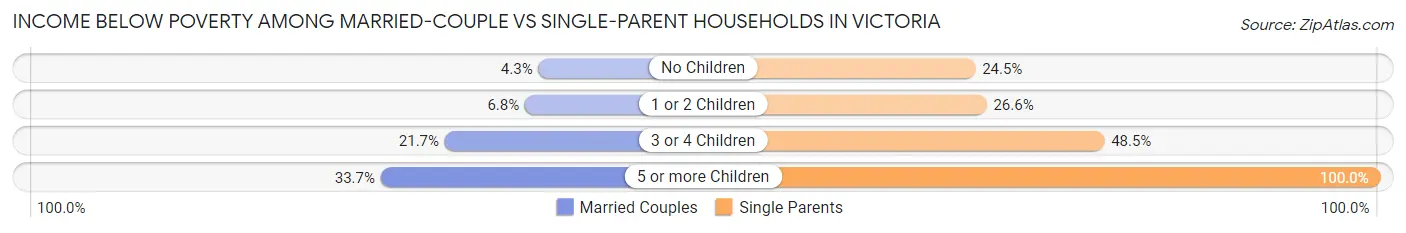
| Children | Married-Couple Families | Single-Parent Households |
| No Children | 273 (4.3%) | 445 (24.5%) |
| 1 or 2 Children | 215 (6.8%) | 690 (26.6%) |
| 3 or 4 Children | 281 (21.7%) | 298 (48.5%) |
| 5 or more Children | 35 (33.7%) | 27 (100.0%) |
| Total | 804 (7.3%) | 1,460 (28.9%) |
Race in Victoria
The most populous races in Victoria are White / Caucasian (41,971 | 64.1%), Hispanic or Latino (36,358 | 55.5%), and Two or more Races (13,789 | 21.1%).
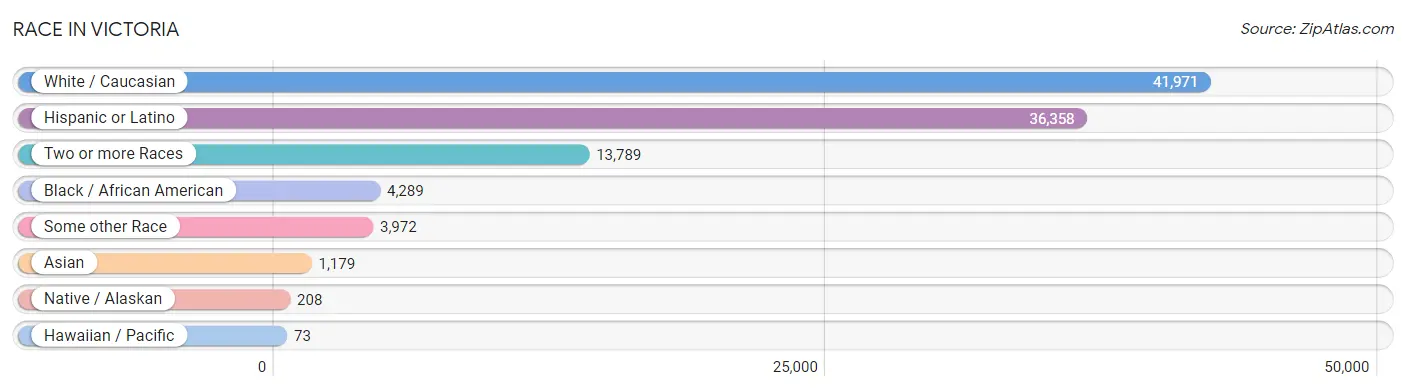
| Race | # Population | % Population |
| Asian | 1,179 | 1.8% |
| Black / African American | 4,289 | 6.6% |
| Hawaiian / Pacific | 73 | 0.1% |
| Hispanic or Latino | 36,358 | 55.5% |
| Native / Alaskan | 208 | 0.3% |
| White / Caucasian | 41,971 | 64.1% |
| Two or more Races | 13,789 | 21.1% |
| Some other Race | 3,972 | 6.1% |
| Total | 65,481 | 100.0% |
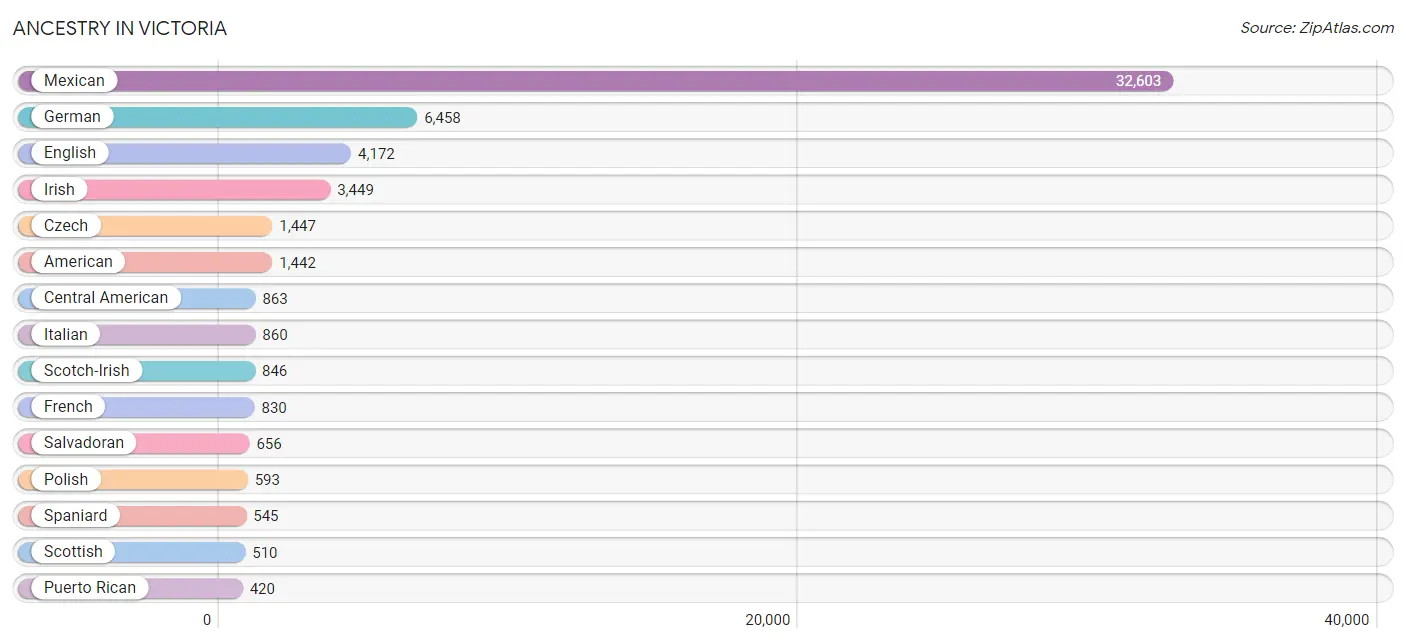
Ancestry in Victoria
The most populous ancestries reported in Victoria are Mexican (32,603 | 49.8%), German (6,458 | 9.9%), English (4,172 | 6.4%), Irish (3,449 | 5.3%), and Czech (1,447 | 2.2%), together accounting for 73.5% of all Victoria residents.
| Ancestry | # Population | % Population |
| African | 192 | 0.3% |
| American | 1,442 | 2.2% |
| Apache | 21 | 0.0% |
| Arab | 202 | 0.3% |
| Argentinean | 16 | 0.0% |
| Australian | 48 | 0.1% |
| Austrian | 8 | 0.0% |
| Belgian | 12 | 0.0% |
| Bhutanese | 80 | 0.1% |
| Blackfeet | 9 | 0.0% |
| British | 124 | 0.2% |
| Burmese | 53 | 0.1% |
| Canadian | 42 | 0.1% |
| Central American | 863 | 1.3% |
| Central American Indian | 142 | 0.2% |
| Cherokee | 128 | 0.2% |
| Chickasaw | 11 | 0.0% |
| Choctaw | 167 | 0.3% |
| Colombian | 236 | 0.4% |
| Comanche | 9 | 0.0% |
| Cuban | 47 | 0.1% |
| Czech | 1,447 | 2.2% |
| Czechoslovakian | 58 | 0.1% |
| Danish | 59 | 0.1% |
| Dominican | 55 | 0.1% |
| Dutch | 325 | 0.5% |
| Eastern European | 11 | 0.0% |
| Ecuadorian | 6 | 0.0% |
| English | 4,172 | 6.4% |
| Estonian | 17 | 0.0% |
| European | 400 | 0.6% |
| Filipino | 150 | 0.2% |
| Finnish | 12 | 0.0% |
| French | 830 | 1.3% |
| French American Indian | 14 | 0.0% |
| French Canadian | 235 | 0.4% |
| German | 6,458 | 9.9% |
| Greek | 34 | 0.1% |
| Guamanian / Chamorro | 94 | 0.1% |
| Guatemalan | 49 | 0.1% |
| Honduran | 87 | 0.1% |
| Hungarian | 15 | 0.0% |
| Indian (Asian) | 173 | 0.3% |
| Iranian | 19 | 0.0% |
| Irish | 3,449 | 5.3% |
| Italian | 860 | 1.3% |
| Jamaican | 51 | 0.1% |
| Korean | 338 | 0.5% |
| Lebanese | 89 | 0.1% |
| Mexican | 32,603 | 49.8% |
| Mexican American Indian | 3 | 0.0% |
| Navajo | 7 | 0.0% |
| Nigerian | 97 | 0.2% |
| Northern European | 7 | 0.0% |
| Norwegian | 189 | 0.3% |
| Palestinian | 38 | 0.1% |
| Panamanian | 71 | 0.1% |
| Pennsylvania German | 19 | 0.0% |
| Peruvian | 82 | 0.1% |
| Polish | 593 | 0.9% |
| Portuguese | 99 | 0.2% |
| Potawatomi | 20 | 0.0% |
| Puerto Rican | 420 | 0.6% |
| Romanian | 58 | 0.1% |
| Russian | 10 | 0.0% |
| Salvadoran | 656 | 1.0% |
| Scandinavian | 102 | 0.2% |
| Scotch-Irish | 846 | 1.3% |
| Scottish | 510 | 0.8% |
| Sioux | 68 | 0.1% |
| Slovak | 25 | 0.0% |
| Slovene | 54 | 0.1% |
| South American | 340 | 0.5% |
| Spaniard | 545 | 0.8% |
| Spanish | 62 | 0.1% |
| Spanish American Indian | 13 | 0.0% |
| Sri Lankan | 342 | 0.5% |
| Subsaharan African | 313 | 0.5% |
| Sudanese | 4 | 0.0% |
| Swedish | 132 | 0.2% |
| Swiss | 77 | 0.1% |
| Syrian | 75 | 0.1% |
| Thai | 119 | 0.2% |
| Turkish | 44 | 0.1% |
| Ukrainian | 53 | 0.1% |
| Welsh | 120 | 0.2% |
| West Indian | 72 | 0.1% | View All 87 Rows |
Immigrants in Victoria
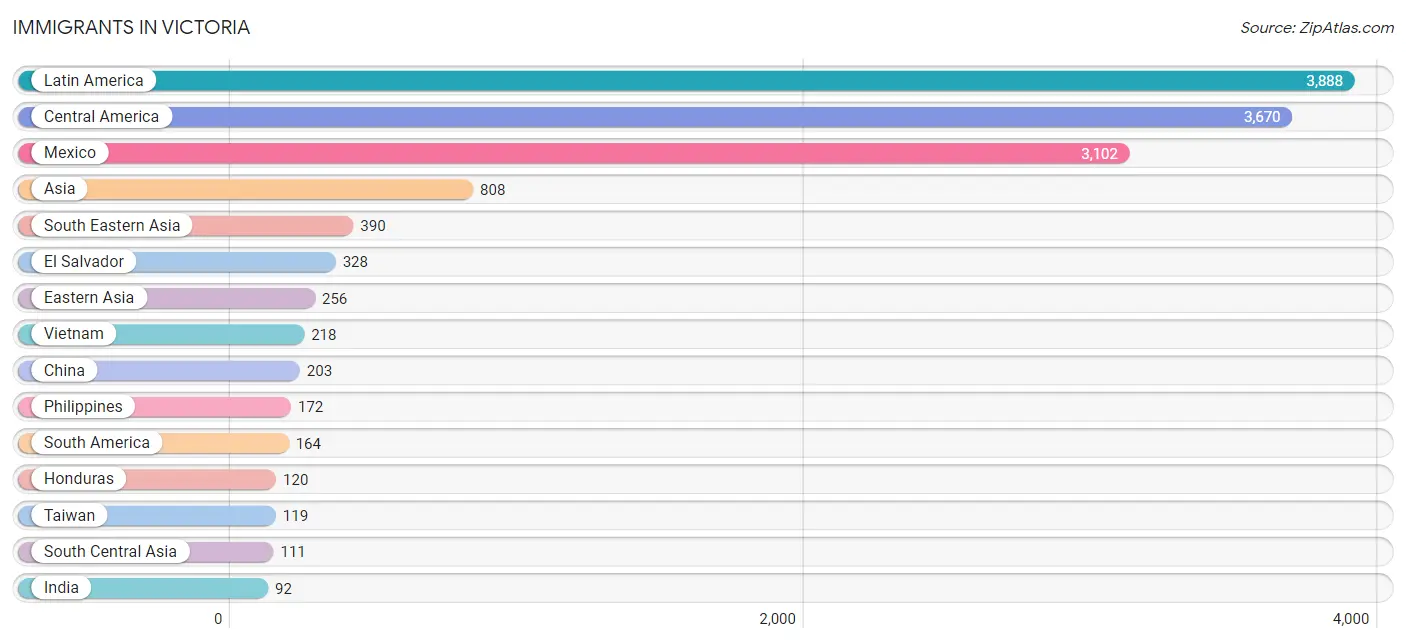
The most numerous immigrant groups reported in Victoria came from Latin America (3,888 | 5.9%), Central America (3,670 | 5.6%), Mexico (3,102 | 4.7%), Asia (808 | 1.2%), and South Eastern Asia (390 | 0.6%), together accounting for 18.1% of all Victoria residents.
| Immigration Origin | # Population | % Population |
| Africa | 56 | 0.1% |
| Argentina | 2 | 0.0% |
| Asia | 808 | 1.2% |
| Canada | 55 | 0.1% |
| Caribbean | 54 | 0.1% |
| Central America | 3,670 | 5.6% |
| China | 203 | 0.3% |
| Colombia | 74 | 0.1% |
| Dominican Republic | 14 | 0.0% |
| Eastern Asia | 256 | 0.4% |
| Eastern Europe | 45 | 0.1% |
| Ecuador | 6 | 0.0% |
| El Salvador | 328 | 0.5% |
| England | 21 | 0.0% |
| Europe | 82 | 0.1% |
| France | 7 | 0.0% |
| Guatemala | 49 | 0.1% |
| Honduras | 120 | 0.2% |
| Hungary | 8 | 0.0% |
| India | 92 | 0.1% |
| Iran | 19 | 0.0% |
| Italy | 1 | 0.0% |
| Jamaica | 32 | 0.1% |
| Jordan | 29 | 0.0% |
| Korea | 53 | 0.1% |
| Latin America | 3,888 | 5.9% |
| Mexico | 3,102 | 4.7% |
| Nigeria | 20 | 0.0% |
| Northern Africa | 4 | 0.0% |
| Northern Europe | 29 | 0.0% |
| Panama | 71 | 0.1% |
| Peru | 82 | 0.1% |
| Philippines | 172 | 0.3% |
| Poland | 18 | 0.0% |
| South Africa | 32 | 0.1% |
| South America | 164 | 0.3% |
| South Central Asia | 111 | 0.2% |
| South Eastern Asia | 390 | 0.6% |
| Southern Europe | 1 | 0.0% |
| Sudan | 4 | 0.0% |
| Taiwan | 119 | 0.2% |
| Trinidad and Tobago | 8 | 0.0% |
| Turkey | 22 | 0.0% |
| Ukraine | 19 | 0.0% |
| Vietnam | 218 | 0.3% |
| Western Africa | 20 | 0.0% |
| Western Asia | 51 | 0.1% |
| Western Europe | 7 | 0.0% | View All 48 Rows |
Sex and Age in Victoria
Sex and Age in Victoria
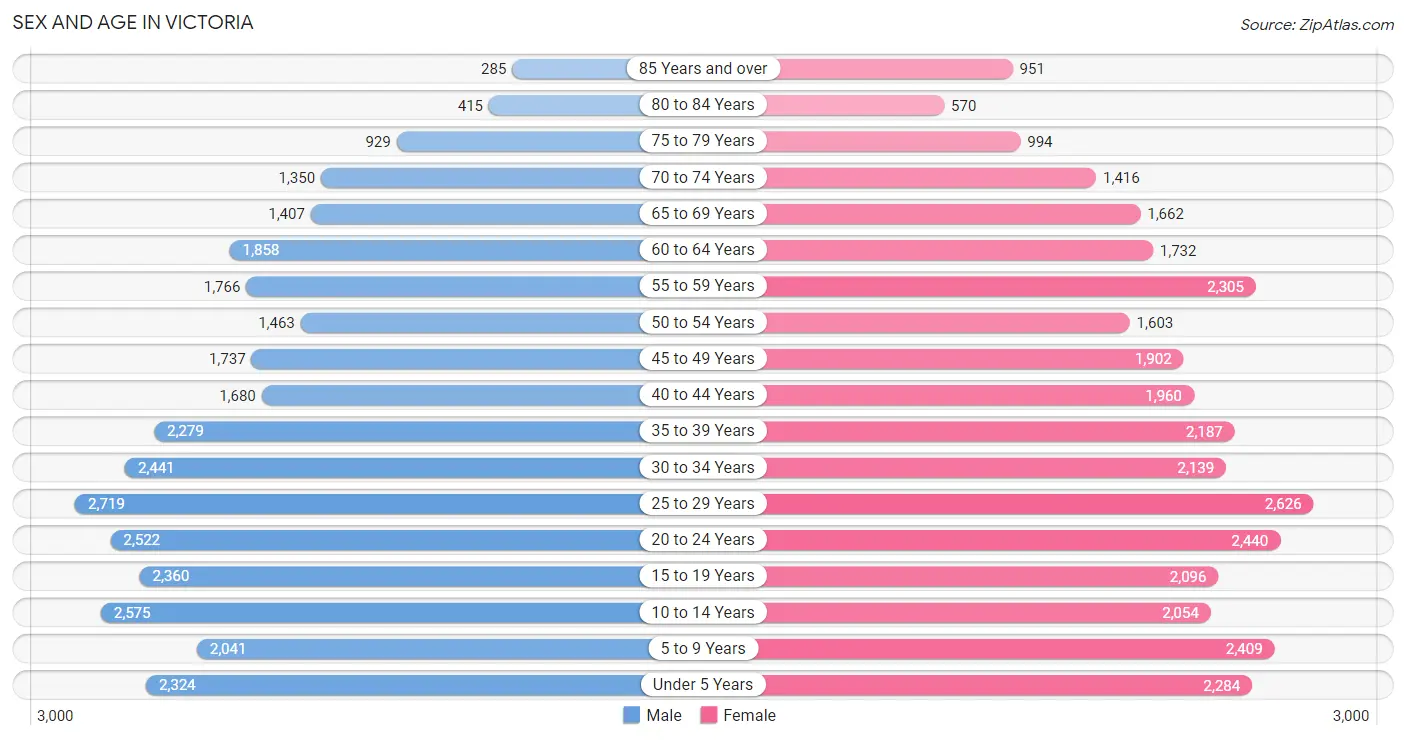
The most populous age groups in Victoria are 25 to 29 Years (2,719 | 8.5%) for men and 25 to 29 Years (2,626 | 7.9%) for women.
| Age Bracket | Male | Female |
| Under 5 Years | 2,324 (7.2%) | 2,284 (6.9%) |
| 5 to 9 Years | 2,041 (6.4%) | 2,409 (7.2%) |
| 10 to 14 Years | 2,575 (8.0%) | 2,054 (6.2%) |
| 15 to 19 Years | 2,360 (7.3%) | 2,096 (6.3%) |
| 20 to 24 Years | 2,522 (7.8%) | 2,440 (7.3%) |
| 25 to 29 Years | 2,719 (8.5%) | 2,626 (7.9%) |
| 30 to 34 Years | 2,441 (7.6%) | 2,139 (6.4%) |
| 35 to 39 Years | 2,279 (7.1%) | 2,187 (6.6%) |
| 40 to 44 Years | 1,680 (5.2%) | 1,960 (5.9%) |
| 45 to 49 Years | 1,737 (5.4%) | 1,902 (5.7%) |
| 50 to 54 Years | 1,463 (4.5%) | 1,603 (4.8%) |
| 55 to 59 Years | 1,766 (5.5%) | 2,305 (6.9%) |
| 60 to 64 Years | 1,858 (5.8%) | 1,732 (5.2%) |
| 65 to 69 Years | 1,407 (4.4%) | 1,662 (5.0%) |
| 70 to 74 Years | 1,350 (4.2%) | 1,416 (4.3%) |
| 75 to 79 Years | 929 (2.9%) | 994 (3.0%) |
| 80 to 84 Years | 415 (1.3%) | 570 (1.7%) |
| 85 Years and over | 285 (0.9%) | 951 (2.9%) |
| Total | 32,151 (100.0%) | 33,330 (100.0%) |
Families and Households in Victoria
Median Family Size in Victoria
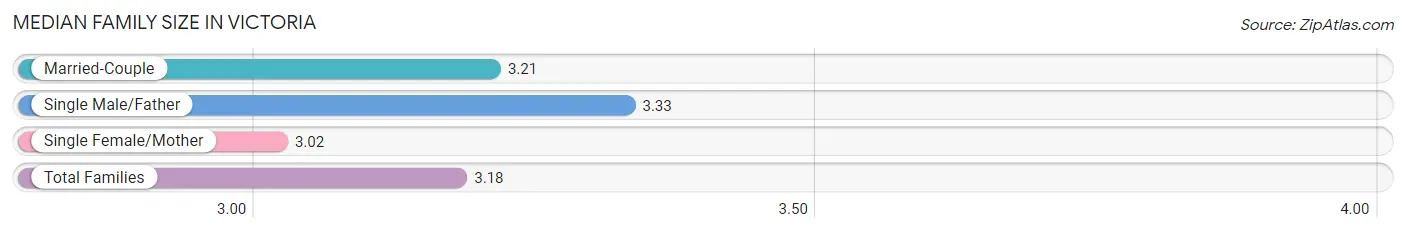
The median family size in Victoria is 3.18 persons per family, with single male/father families (1,398 | 8.7%) accounting for the largest median family size of 3.33 persons per family. On the other hand, single female/mother families (3,653 | 22.8%) represent the smallest median family size with 3.02 persons per family.
| Family Type | # Families | Family Size |
| Married-Couple | 10,946 (68.4%) | 3.21 |
| Single Male/Father | 1,398 (8.7%) | 3.33 |
| Single Female/Mother | 3,653 (22.8%) | 3.02 |
| Total Families | 15,997 (100.0%) | 3.18 |
Median Household Size in Victoria
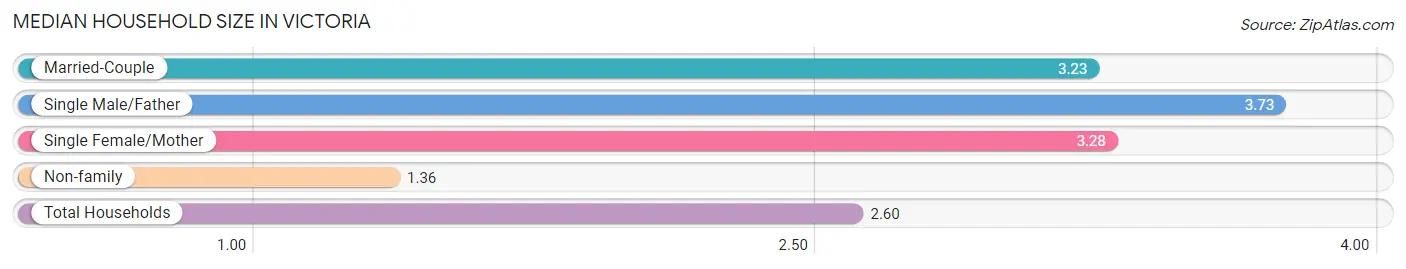
The median household size in Victoria is 2.60 persons per household, with single male/father households (1,398 | 5.7%) accounting for the largest median household size of 3.73 persons per household. non-family households (8,701 | 35.2%) represent the smallest median household size with 1.36 persons per household.
| Household Type | # Households | Household Size |
| Married-Couple | 10,946 (44.3%) | 3.23 |
| Single Male/Father | 1,398 (5.7%) | 3.73 |
| Single Female/Mother | 3,653 (14.8%) | 3.28 |
| Non-family | 8,701 (35.2%) | 1.36 |
| Total Households | 24,698 (100.0%) | 2.60 |
Household Size by Marriage Status in Victoria
Out of a total of 24,698 households in Victoria, 15,997 (64.8%) are family households, while 8,701 (35.2%) are nonfamily households. The most numerous type of family households are 2-person households, comprising 6,539, and the most common type of nonfamily households are 1-person households, comprising 6,550.
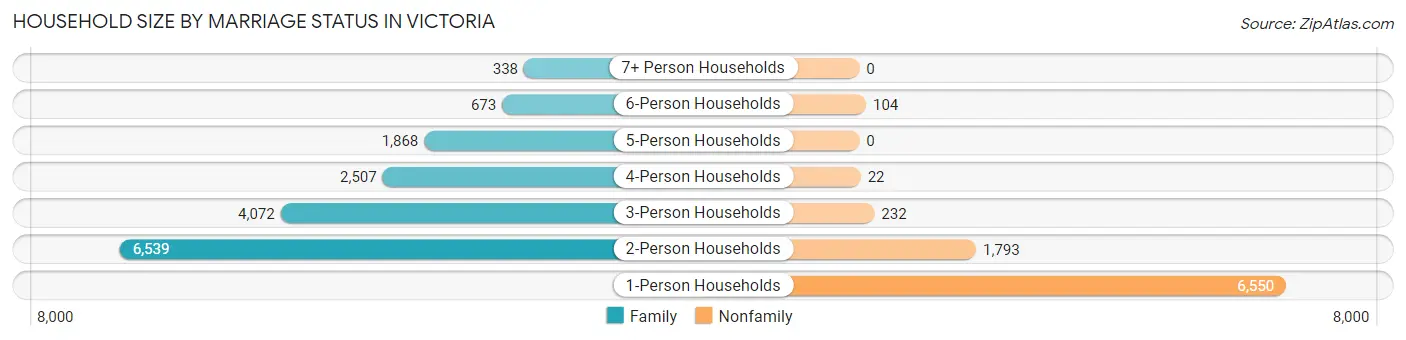
| Household Size | Family Households | Nonfamily Households |
| 1-Person Households | - | 6,550 (26.5%) |
| 2-Person Households | 6,539 (26.5%) | 1,793 (7.3%) |
| 3-Person Households | 4,072 (16.5%) | 232 (0.9%) |
| 4-Person Households | 2,507 (10.2%) | 22 (0.1%) |
| 5-Person Households | 1,868 (7.6%) | 0 (0.0%) |
| 6-Person Households | 673 (2.7%) | 104 (0.4%) |
| 7+ Person Households | 338 (1.4%) | 0 (0.0%) |
| Total | 15,997 (64.8%) | 8,701 (35.2%) |
Female Fertility in Victoria
Fertility by Age in Victoria
Average fertility rate in Victoria is 53.0 births per 1,000 women. Women in the age bracket of 20 to 34 years have the highest fertility rate with 91.0 births per 1,000 women. Women in the age bracket of 20 to 34 years acount for 78.2% of all women with births.
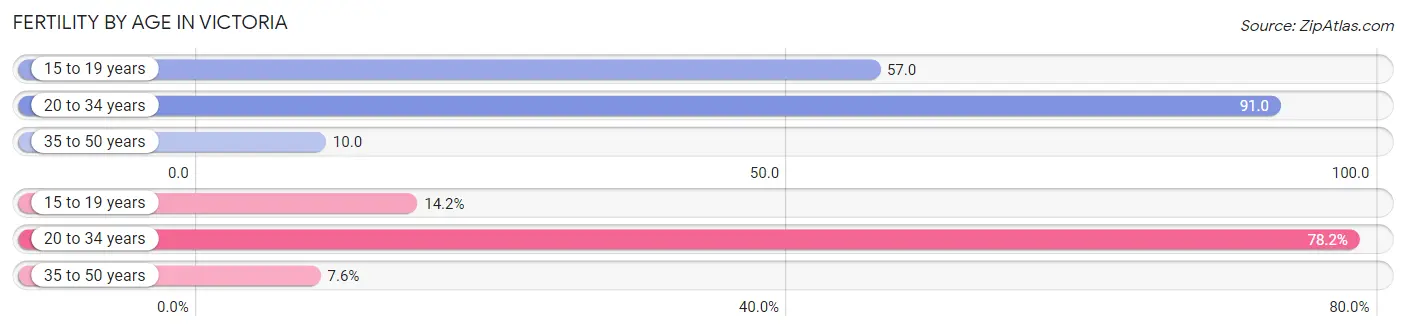
| Age Bracket | Women with Births | Births / 1,000 Women |
| 15 to 19 years | 119 (14.2%) | 57.0 |
| 20 to 34 years | 655 (78.2%) | 91.0 |
| 35 to 50 years | 64 (7.6%) | 10.0 |
| Total | 838 (100.0%) | 53.0 |
Fertility by Age by Marriage Status in Victoria
44.7% of women with births (838) in Victoria are married. The highest percentage of unmarried women with births falls into 15 to 19 years age bracket with 100.0% of them unmarried at the time of birth, while the lowest percentage of unmarried women with births belong to 20 to 34 years age bracket with 46.3% of them unmarried.
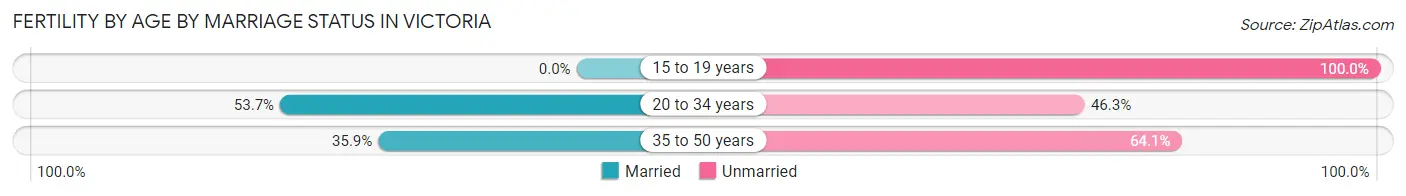
| Age Bracket | Married | Unmarried |
| 15 to 19 years | 0 (0.0%) | 119 (100.0%) |
| 20 to 34 years | 352 (53.7%) | 303 (46.3%) |
| 35 to 50 years | 23 (35.9%) | 41 (64.1%) |
| Total | 375 (44.8%) | 463 (55.2%) |
Fertility by Education in Victoria
Average fertility rate in Victoria is 53.0 births per 1,000 women. Women with the education attainment of less than high school have the highest fertility rate of 69.0 births per 1,000 women, while women with the education attainment of graduate degree have the lowest fertility at 16.0 births per 1,000 women. Women with the education attainment of college or associate's degree represent 44.2% of all women with births.
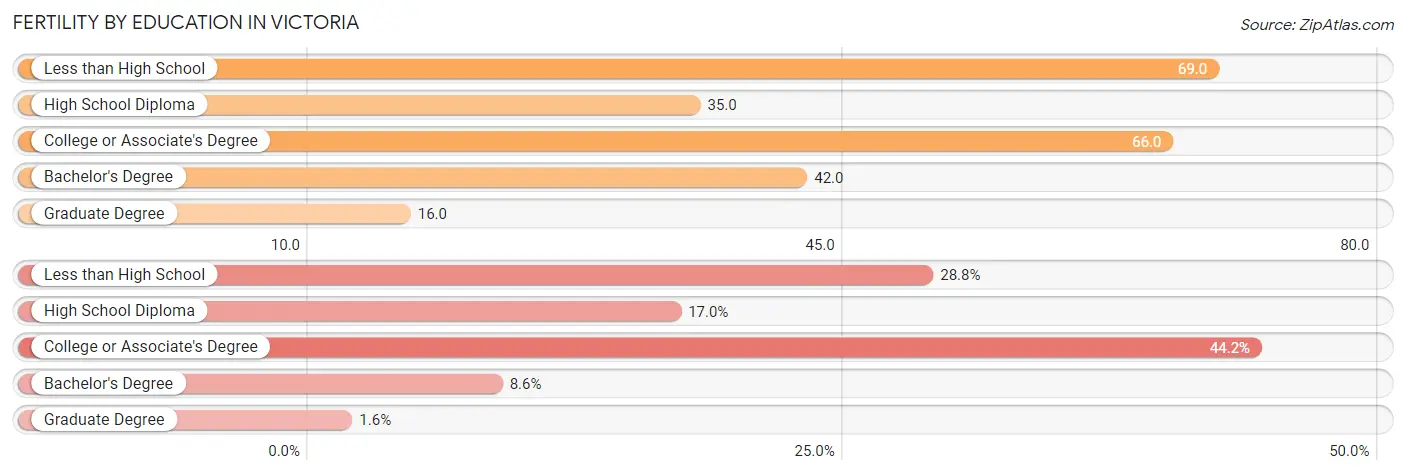
| Educational Attainment | Women with Births | Births / 1,000 Women |
| Less than High School | 241 (28.8%) | 69.0 |
| High School Diploma | 142 (17.0%) | 35.0 |
| College or Associate's Degree | 370 (44.2%) | 66.0 |
| Bachelor's Degree | 72 (8.6%) | 42.0 |
| Graduate Degree | 13 (1.5%) | 16.0 |
| Total | 838 (100.0%) | 53.0 |
Fertility by Education by Marriage Status in Victoria
55.2% of women with births in Victoria are unmarried. Women with the educational attainment of graduate degree are most likely to be married with 100.0% of them married at childbirth, while women with the educational attainment of college or associate's degree are least likely to be married with 62.2% of them unmarried at childbirth.
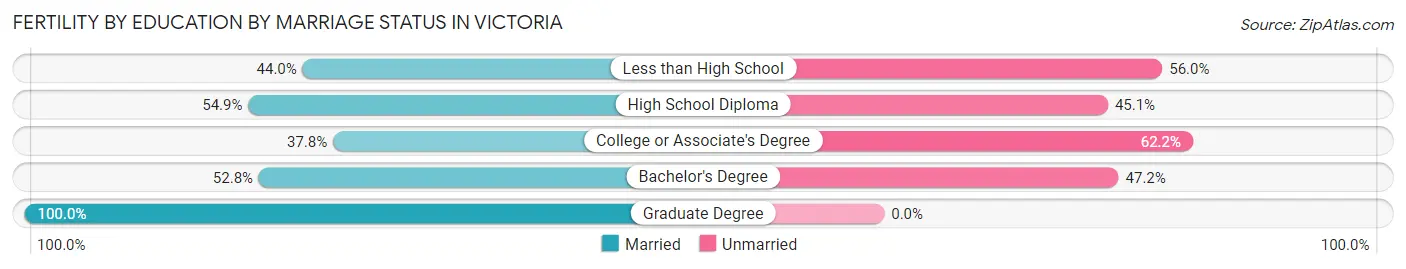
| Educational Attainment | Married | Unmarried |
| Less than High School | 106 (44.0%) | 135 (56.0%) |
| High School Diploma | 78 (54.9%) | 64 (45.1%) |
| College or Associate's Degree | 140 (37.8%) | 230 (62.2%) |
| Bachelor's Degree | 38 (52.8%) | 34 (47.2%) |
| Graduate Degree | 13 (100.0%) | 0 (0.0%) |
| Total | 375 (44.8%) | 463 (55.2%) |
Employment Characteristics in Victoria
Employment by Class of Employer in Victoria
Among the 30,082 employed individuals in Victoria, private company employees (22,427 | 74.6%), local government employees (2,517 | 8.4%), and self-employed (not incorporated) (1,891 | 6.3%) make up the most common classes of employment.
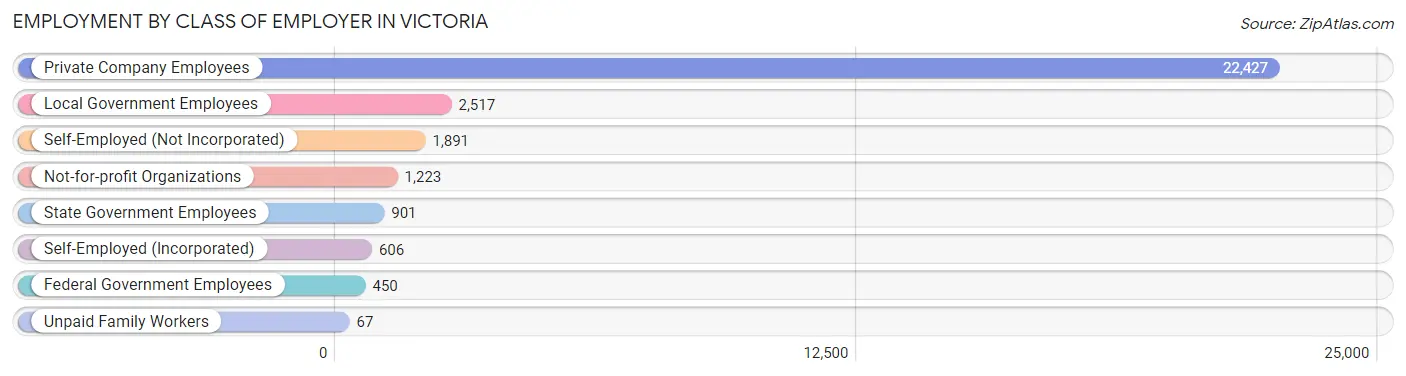
| Employer Class | # Employees | % Employees |
| Private Company Employees | 22,427 | 74.6% |
| Self-Employed (Incorporated) | 606 | 2.0% |
| Self-Employed (Not Incorporated) | 1,891 | 6.3% |
| Not-for-profit Organizations | 1,223 | 4.1% |
| Local Government Employees | 2,517 | 8.4% |
| State Government Employees | 901 | 3.0% |
| Federal Government Employees | 450 | 1.5% |
| Unpaid Family Workers | 67 | 0.2% |
| Total | 30,082 | 100.0% |
Employment Status by Age in Victoria
According to the labor force statistics for Victoria, out of the total population over 16 years of age (50,581), 63.8% or 32,271 individuals are in the labor force, with 5.5% or 1,775 of them unemployed. The age group with the highest labor force participation rate is 25 to 29 years, with 89.5% or 4,784 individuals in the labor force. Within the labor force, the 20 to 24 years age range has the highest percentage of unemployed individuals, with 11.7% or 450 of them being unemployed.
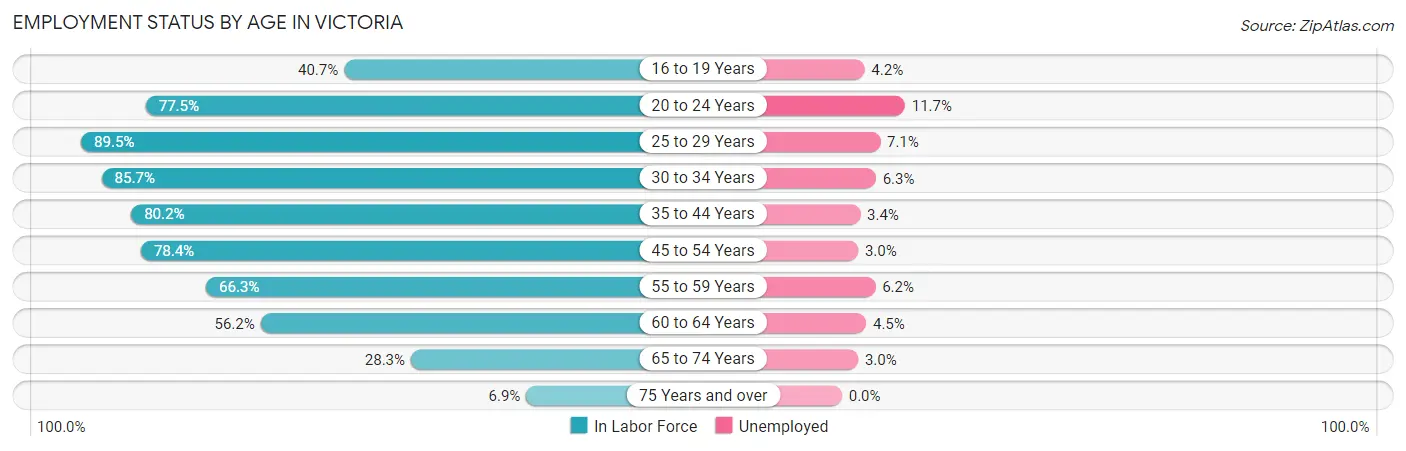
| Age Bracket | In Labor Force | Unemployed |
| 16 to 19 Years | 1,320 (40.7%) | 55 (4.2%) |
| 20 to 24 Years | 3,846 (77.5%) | 450 (11.7%) |
| 25 to 29 Years | 4,784 (89.5%) | 340 (7.1%) |
| 30 to 34 Years | 3,925 (85.7%) | 247 (6.3%) |
| 35 to 44 Years | 6,501 (80.2%) | 221 (3.4%) |
| 45 to 54 Years | 5,257 (78.4%) | 158 (3.0%) |
| 55 to 59 Years | 2,699 (66.3%) | 167 (6.2%) |
| 60 to 64 Years | 2,018 (56.2%) | 91 (4.5%) |
| 65 to 74 Years | 1,651 (28.3%) | 50 (3.0%) |
| 75 Years and over | 286 (6.9%) | 0 (0.0%) |
| Total | 32,271 (63.8%) | 1,775 (5.5%) |
Employment Status by Educational Attainment in Victoria
According to labor force statistics for Victoria, 77.7% of individuals (25,172) out of the total population between 25 and 64 years of age (32,397) are in the labor force, with 4.9% or 1,233 of them being unemployed. The group with the highest labor force participation rate are those with the educational attainment of bachelor's degree or higher, with 83.9% or 5,134 individuals in the labor force. Within the labor force, individuals with less than high school education have the highest percentage of unemployment, with 11.1% or 374 of them being unemployed.
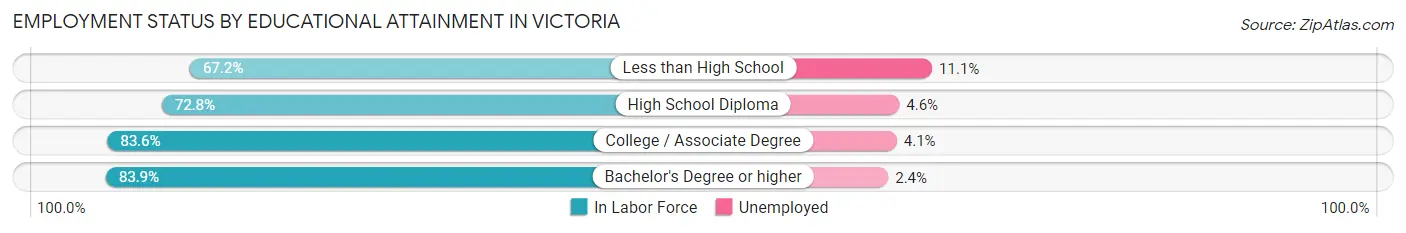
| Educational Attainment | In Labor Force | Unemployed |
| Less than High School | 3,370 (67.2%) | 557 (11.1%) |
| High School Diploma | 7,338 (72.8%) | 464 (4.6%) |
| College / Associate Degree | 9,349 (83.6%) | 459 (4.1%) |
| Bachelor's Degree or higher | 5,134 (83.9%) | 147 (2.4%) |
| Total | 25,172 (77.7%) | 1,587 (4.9%) |
Employment Occupations by Sex in Victoria
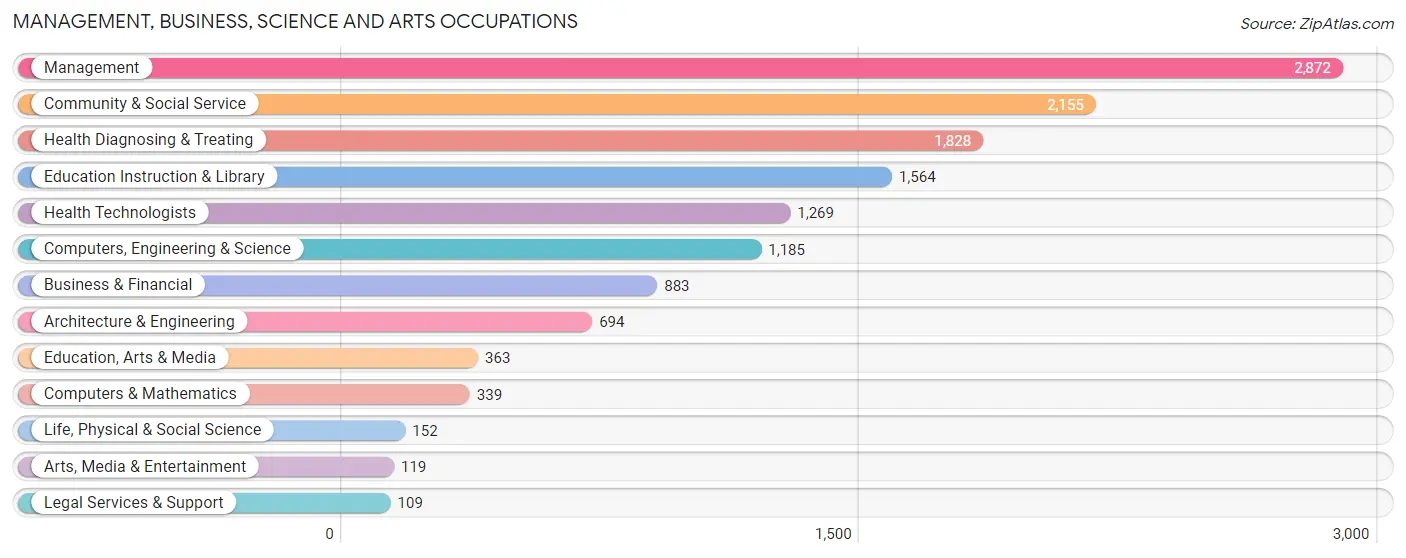
Management, Business, Science and Arts Occupations
The most common Management, Business, Science and Arts occupations in Victoria are Management (2,872 | 9.5%), Community & Social Service (2,155 | 7.1%), Health Diagnosing & Treating (1,828 | 6.0%), Education Instruction & Library (1,564 | 5.1%), and Health Technologists (1,269 | 4.2%).
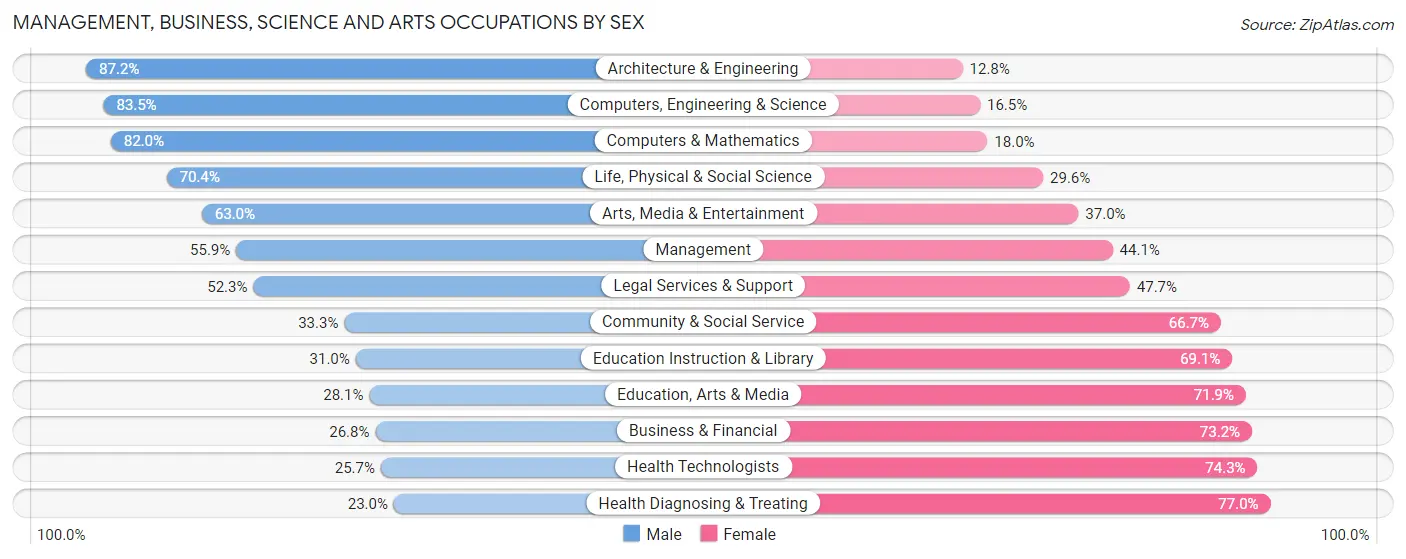
Management, Business, Science and Arts Occupations by Sex
Within the Management, Business, Science and Arts occupations in Victoria, the most male-oriented occupations are Architecture & Engineering (87.2%), Computers, Engineering & Science (83.5%), and Computers & Mathematics (82.0%), while the most female-oriented occupations are Health Diagnosing & Treating (77.0%), Health Technologists (74.3%), and Business & Financial (73.2%).
| Occupation | Male | Female |
| Management | 1,605 (55.9%) | 1,267 (44.1%) |
| Business & Financial | 237 (26.8%) | 646 (73.2%) |
| Computers, Engineering & Science | 990 (83.5%) | 195 (16.5%) |
| Computers & Mathematics | 278 (82.0%) | 61 (18.0%) |
| Architecture & Engineering | 605 (87.2%) | 89 (12.8%) |
| Life, Physical & Social Science | 107 (70.4%) | 45 (29.6%) |
| Community & Social Service | 718 (33.3%) | 1,437 (66.7%) |
| Education, Arts & Media | 102 (28.1%) | 261 (71.9%) |
| Legal Services & Support | 57 (52.3%) | 52 (47.7%) |
| Education Instruction & Library | 484 (30.9%) | 1,080 (69.1%) |
| Arts, Media & Entertainment | 75 (63.0%) | 44 (37.0%) |
| Health Diagnosing & Treating | 420 (23.0%) | 1,408 (77.0%) |
| Health Technologists | 326 (25.7%) | 943 (74.3%) |
| Total (Category) | 3,970 (44.5%) | 4,953 (55.5%) |
| Total (Overall) | 16,170 (53.2%) | 14,195 (46.8%) |
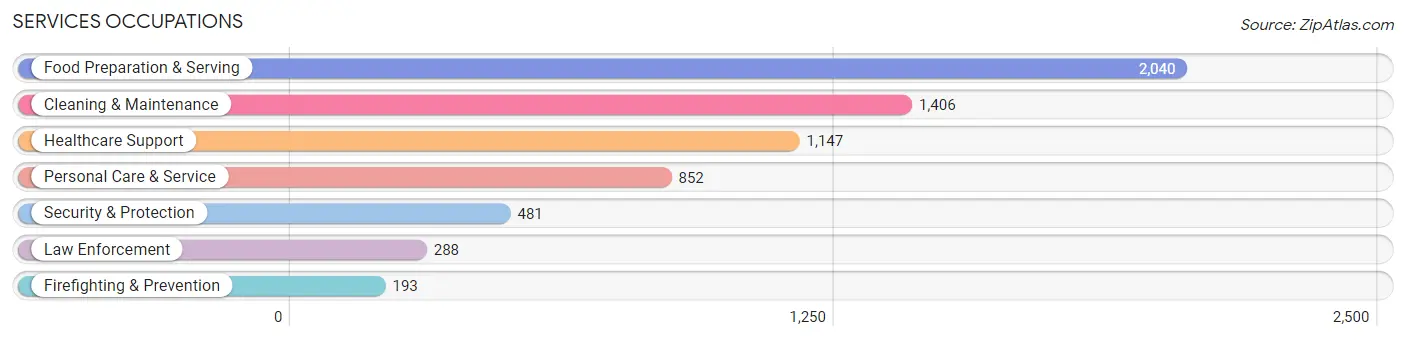
Services Occupations
The most common Services occupations in Victoria are Food Preparation & Serving (2,040 | 6.7%), Cleaning & Maintenance (1,406 | 4.6%), Healthcare Support (1,147 | 3.8%), Personal Care & Service (852 | 2.8%), and Security & Protection (481 | 1.6%).
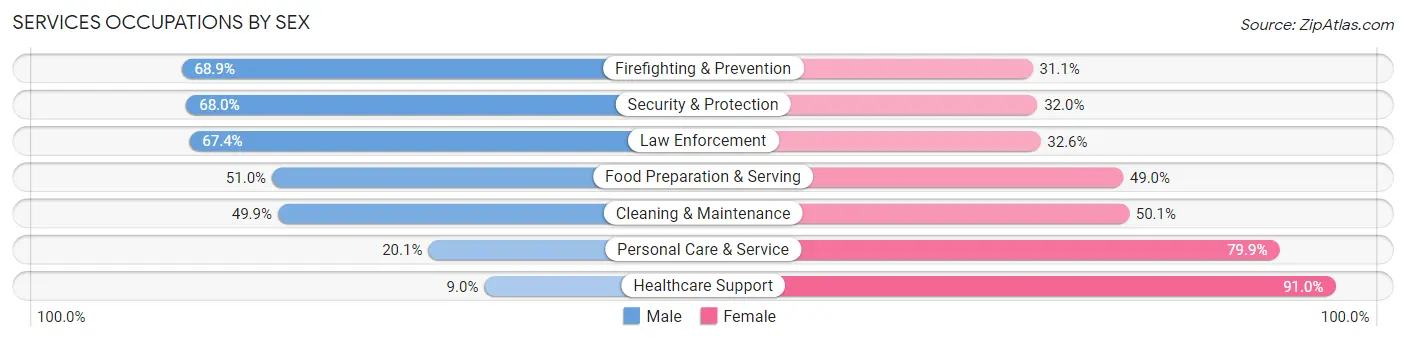
Services Occupations by Sex
Within the Services occupations in Victoria, the most male-oriented occupations are Firefighting & Prevention (68.9%), Security & Protection (68.0%), and Law Enforcement (67.4%), while the most female-oriented occupations are Healthcare Support (91.0%), Personal Care & Service (79.9%), and Cleaning & Maintenance (50.1%).
| Occupation | Male | Female |
| Healthcare Support | 103 (9.0%) | 1,044 (91.0%) |
| Security & Protection | 327 (68.0%) | 154 (32.0%) |
| Firefighting & Prevention | 133 (68.9%) | 60 (31.1%) |
| Law Enforcement | 194 (67.4%) | 94 (32.6%) |
| Food Preparation & Serving | 1,041 (51.0%) | 999 (49.0%) |
| Cleaning & Maintenance | 701 (49.9%) | 705 (50.1%) |
| Personal Care & Service | 171 (20.1%) | 681 (79.9%) |
| Total (Category) | 2,343 (39.5%) | 3,583 (60.5%) |
| Total (Overall) | 16,170 (53.2%) | 14,195 (46.8%) |
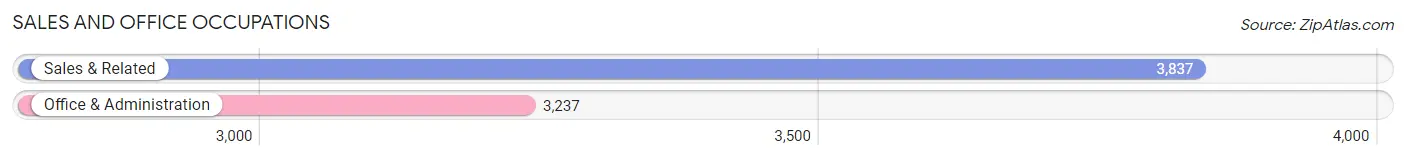
Sales and Office Occupations
The most common Sales and Office occupations in Victoria are Sales & Related (3,837 | 12.6%), and Office & Administration (3,237 | 10.7%).
Sales and Office Occupations by Sex
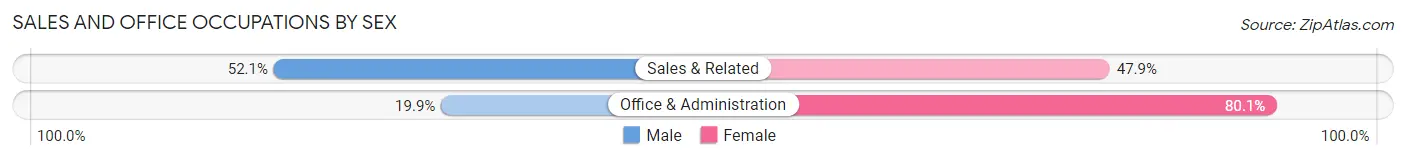
| Occupation | Male | Female |
| Sales & Related | 1,998 (52.1%) | 1,839 (47.9%) |
| Office & Administration | 644 (19.9%) | 2,593 (80.1%) |
| Total (Category) | 2,642 (37.3%) | 4,432 (62.6%) |
| Total (Overall) | 16,170 (53.2%) | 14,195 (46.8%) |
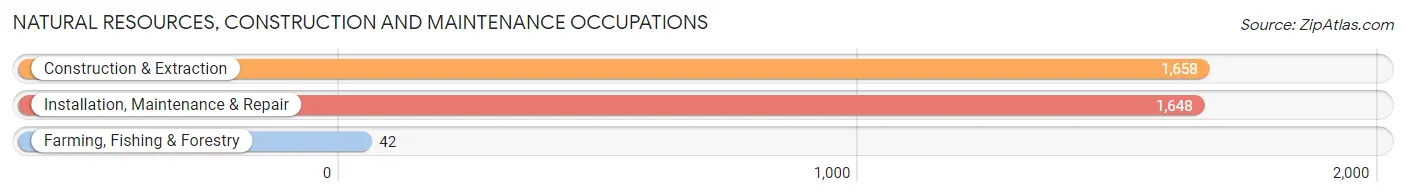
Natural Resources, Construction and Maintenance Occupations
The most common Natural Resources, Construction and Maintenance occupations in Victoria are Construction & Extraction (1,658 | 5.5%), Installation, Maintenance & Repair (1,648 | 5.4%), and Farming, Fishing & Forestry (42 | 0.1%).
Natural Resources, Construction and Maintenance Occupations by Sex
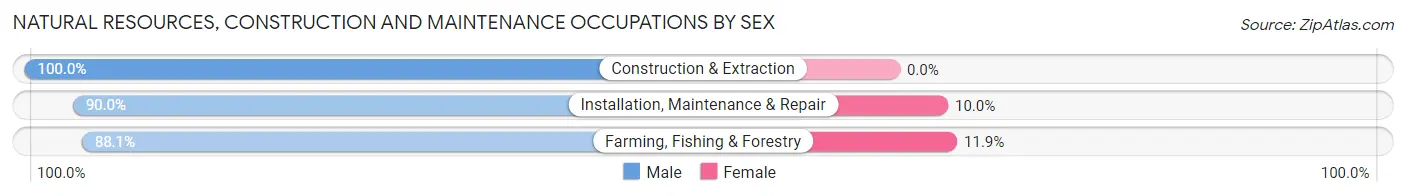
| Occupation | Male | Female |
| Farming, Fishing & Forestry | 37 (88.1%) | 5 (11.9%) |
| Construction & Extraction | 1,658 (100.0%) | 0 (0.0%) |
| Installation, Maintenance & Repair | 1,483 (90.0%) | 165 (10.0%) |
| Total (Category) | 3,178 (94.9%) | 170 (5.1%) |
| Total (Overall) | 16,170 (53.2%) | 14,195 (46.8%) |
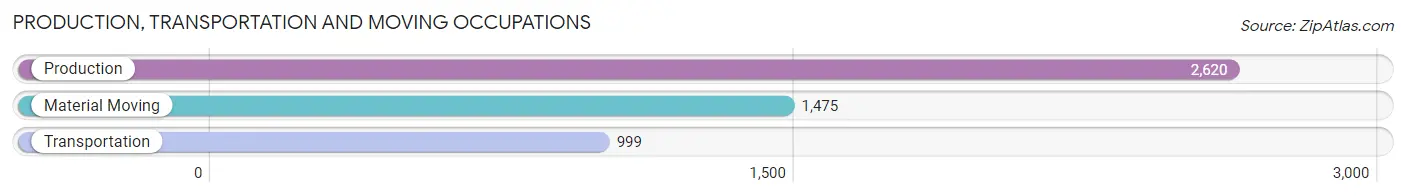
Production, Transportation and Moving Occupations
The most common Production, Transportation and Moving occupations in Victoria are Production (2,620 | 8.6%), Material Moving (1,475 | 4.9%), and Transportation (999 | 3.3%).
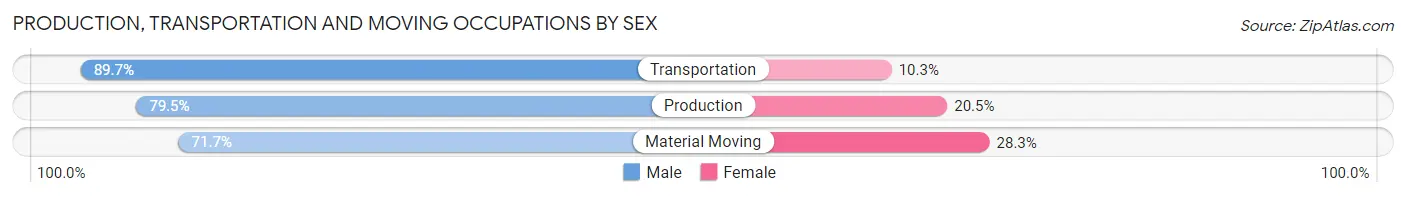
Production, Transportation and Moving Occupations by Sex
| Occupation | Male | Female |
| Production | 2,083 (79.5%) | 537 (20.5%) |
| Transportation | 896 (89.7%) | 103 (10.3%) |
| Material Moving | 1,058 (71.7%) | 417 (28.3%) |
| Total (Category) | 4,037 (79.2%) | 1,057 (20.7%) |
| Total (Overall) | 16,170 (53.2%) | 14,195 (46.8%) |
Employment Industries by Sex in Victoria
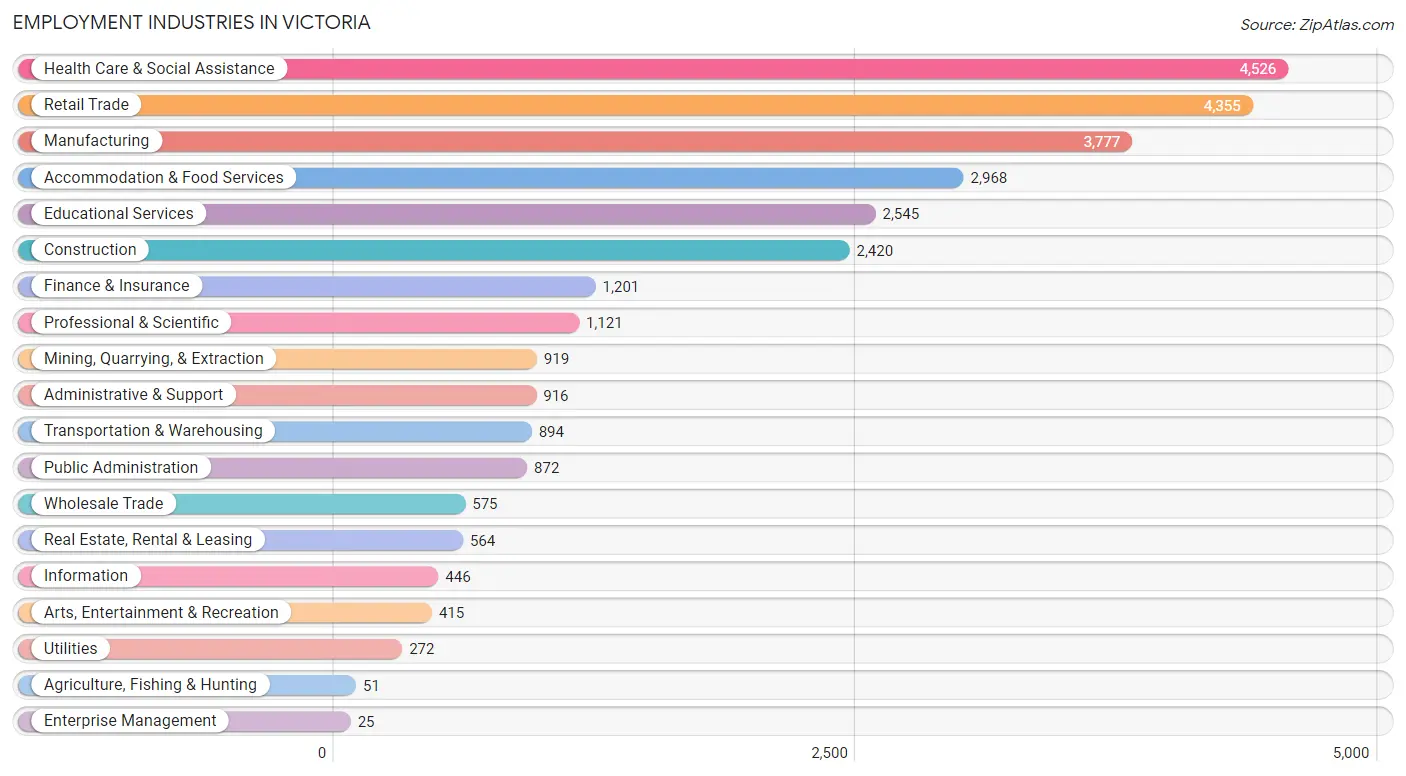
Employment Industries in Victoria
The major employment industries in Victoria include Health Care & Social Assistance (4,526 | 14.9%), Retail Trade (4,355 | 14.3%), Manufacturing (3,777 | 12.4%), Accommodation & Food Services (2,968 | 9.8%), and Educational Services (2,545 | 8.4%).
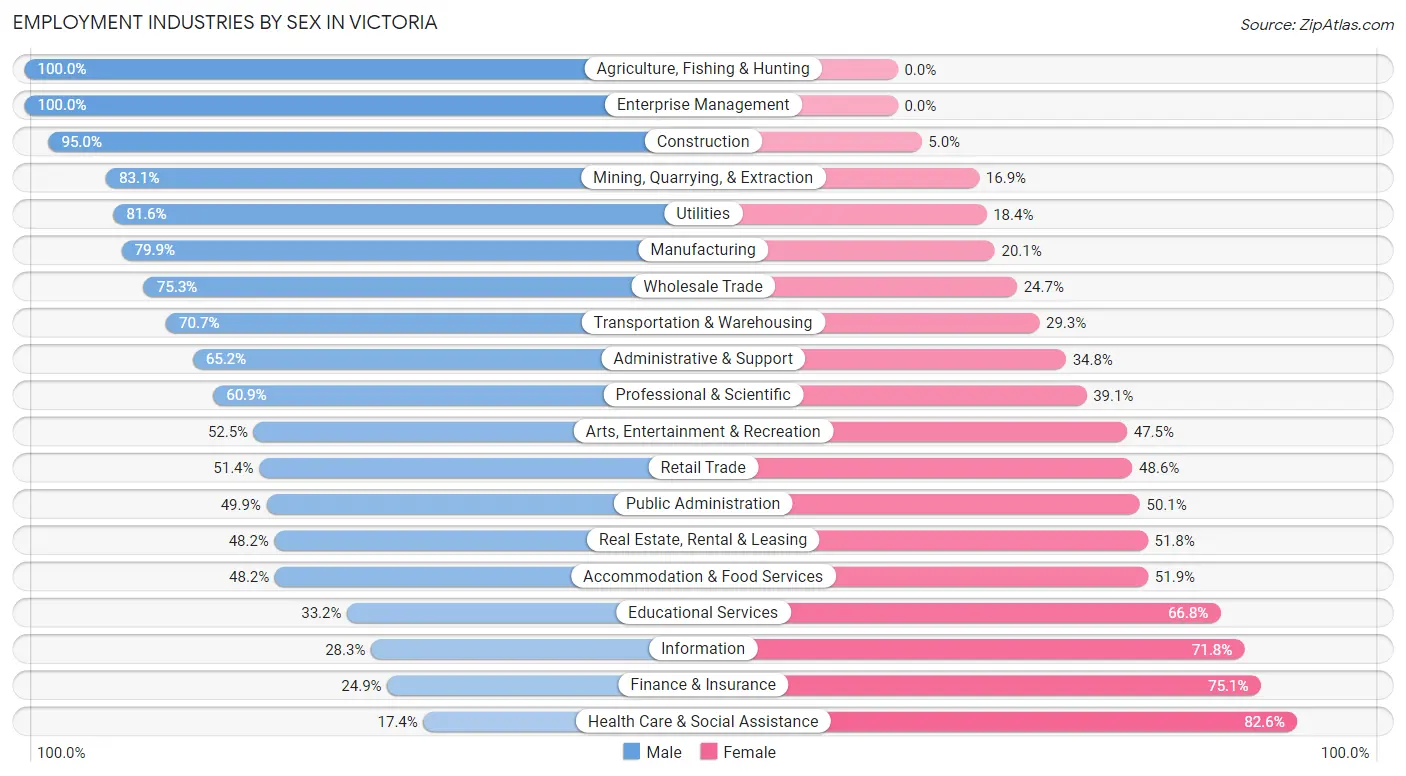
Employment Industries by Sex in Victoria
The Victoria industries that see more men than women are Agriculture, Fishing & Hunting (100.0%), Enterprise Management (100.0%), and Construction (95.0%), whereas the industries that tend to have a higher number of women are Health Care & Social Assistance (82.6%), Finance & Insurance (75.1%), and Information (71.8%).
| Industry | Male | Female |
| Agriculture, Fishing & Hunting | 51 (100.0%) | 0 (0.0%) |
| Mining, Quarrying, & Extraction | 764 (83.1%) | 155 (16.9%) |
| Construction | 2,300 (95.0%) | 120 (5.0%) |
| Manufacturing | 3,018 (79.9%) | 759 (20.1%) |
| Wholesale Trade | 433 (75.3%) | 142 (24.7%) |
| Retail Trade | 2,239 (51.4%) | 2,116 (48.6%) |
| Transportation & Warehousing | 632 (70.7%) | 262 (29.3%) |
| Utilities | 222 (81.6%) | 50 (18.4%) |
| Information | 126 (28.2%) | 320 (71.8%) |
| Finance & Insurance | 299 (24.9%) | 902 (75.1%) |
| Real Estate, Rental & Leasing | 272 (48.2%) | 292 (51.8%) |
| Professional & Scientific | 683 (60.9%) | 438 (39.1%) |
| Enterprise Management | 25 (100.0%) | 0 (0.0%) |
| Administrative & Support | 597 (65.2%) | 319 (34.8%) |
| Educational Services | 845 (33.2%) | 1,700 (66.8%) |
| Health Care & Social Assistance | 788 (17.4%) | 3,738 (82.6%) |
| Arts, Entertainment & Recreation | 218 (52.5%) | 197 (47.5%) |
| Accommodation & Food Services | 1,429 (48.1%) | 1,539 (51.8%) |
| Public Administration | 435 (49.9%) | 437 (50.1%) |
| Total | 16,170 (53.2%) | 14,195 (46.8%) |
Education in Victoria
School Enrollment in Victoria
The most common levels of schooling among the 15,986 students in Victoria are middle school (3,952 | 24.7%), high school (3,670 | 23.0%), and elementary school (3,426 | 21.4%).
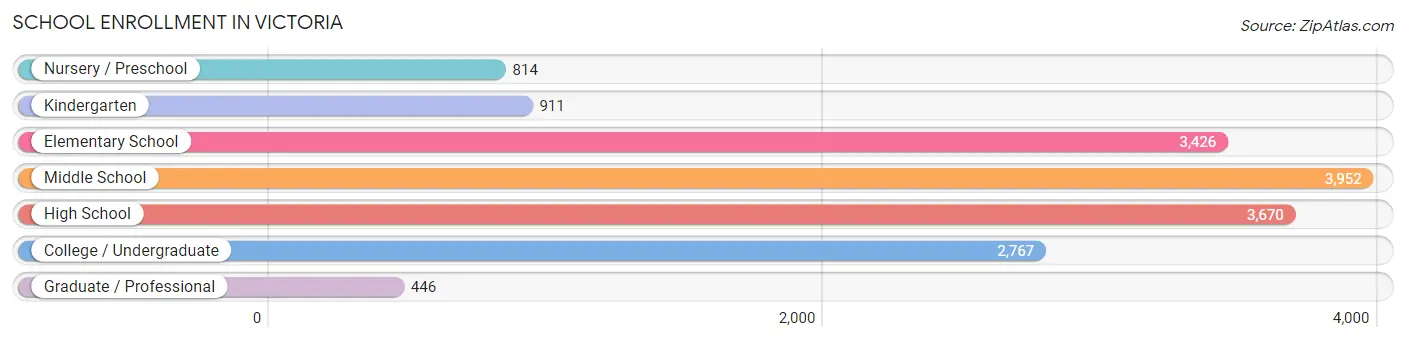
| School Level | # Students | % Students |
| Nursery / Preschool | 814 | 5.1% |
| Kindergarten | 911 | 5.7% |
| Elementary School | 3,426 | 21.4% |
| Middle School | 3,952 | 24.7% |
| High School | 3,670 | 23.0% |
| College / Undergraduate | 2,767 | 17.3% |
| Graduate / Professional | 446 | 2.8% |
| Total | 15,986 | 100.0% |
School Enrollment by Age by Funding Source in Victoria
Out of a total of 15,986 students who are enrolled in schools in Victoria, 2,270 (14.2%) attend a private institution, while the remaining 13,716 (85.8%) are enrolled in public schools. The age group of 3 to 4 year olds has the highest likelihood of being enrolled in private schools, with 209 (28.2% in the age bracket) enrolled. Conversely, the age group of 20 to 24 year olds has the lowest likelihood of being enrolled in a private school, with 1,342 (94.4% in the age bracket) attending a public institution.
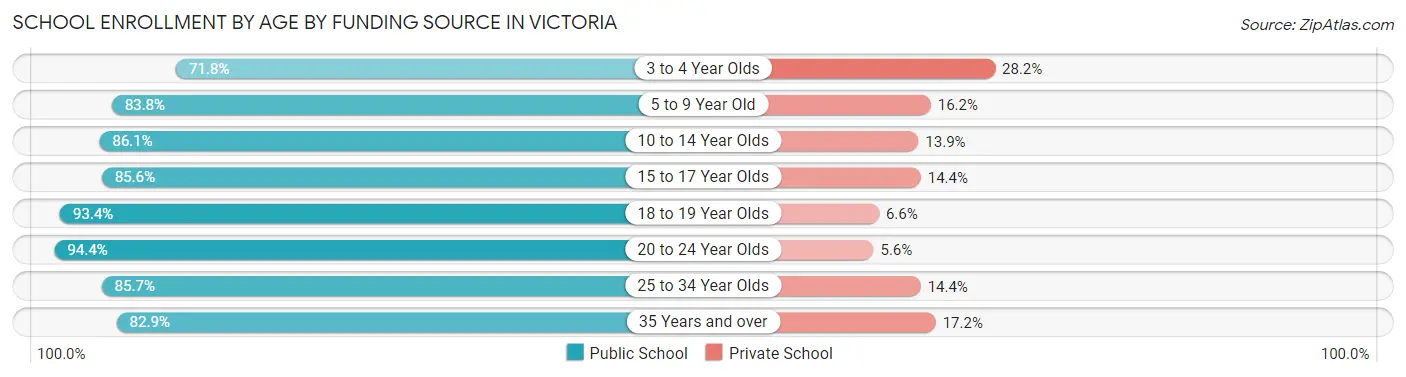
| Age Bracket | Public School | Private School |
| 3 to 4 Year Olds | 532 (71.8%) | 209 (28.2%) |
| 5 to 9 Year Old | 3,401 (83.8%) | 659 (16.2%) |
| 10 to 14 Year Olds | 3,944 (86.1%) | 638 (13.9%) |
| 15 to 17 Year Olds | 2,395 (85.6%) | 402 (14.4%) |
| 18 to 19 Year Olds | 838 (93.4%) | 59 (6.6%) |
| 20 to 24 Year Olds | 1,342 (94.4%) | 79 (5.6%) |
| 25 to 34 Year Olds | 740 (85.7%) | 124 (14.3%) |
| 35 Years and over | 517 (82.9%) | 107 (17.2%) |
| Total | 13,716 (85.8%) | 2,270 (14.2%) |
Educational Attainment by Field of Study in Victoria
Business (1,755 | 20.6%), education (1,059 | 12.4%), science & technology (893 | 10.5%), engineering (715 | 8.4%), and arts & humanities (707 | 8.3%) are the most common fields of study among 8,527 individuals in Victoria who have obtained a bachelor's degree or higher.
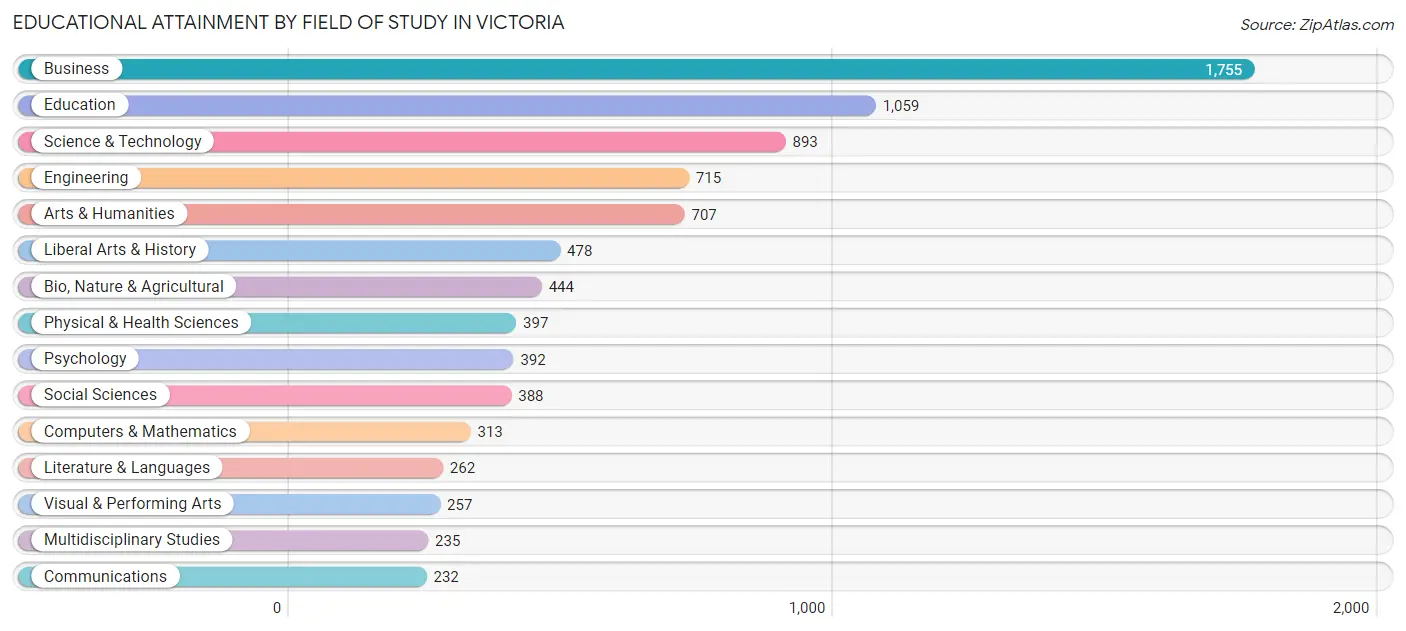
| Field of Study | # Graduates | % Graduates |
| Computers & Mathematics | 313 | 3.7% |
| Bio, Nature & Agricultural | 444 | 5.2% |
| Physical & Health Sciences | 397 | 4.7% |
| Psychology | 392 | 4.6% |
| Social Sciences | 388 | 4.5% |
| Engineering | 715 | 8.4% |
| Multidisciplinary Studies | 235 | 2.8% |
| Science & Technology | 893 | 10.5% |
| Business | 1,755 | 20.6% |
| Education | 1,059 | 12.4% |
| Literature & Languages | 262 | 3.1% |
| Liberal Arts & History | 478 | 5.6% |
| Visual & Performing Arts | 257 | 3.0% |
| Communications | 232 | 2.7% |
| Arts & Humanities | 707 | 8.3% |
| Total | 8,527 | 100.0% |
Transportation & Commute in Victoria
Vehicle Availability by Sex in Victoria
The most prevalent vehicle ownership categories in Victoria are males with 2 vehicles (7,662, accounting for 47.8%) and females with 2 vehicles (6,267, making up 55.1%).
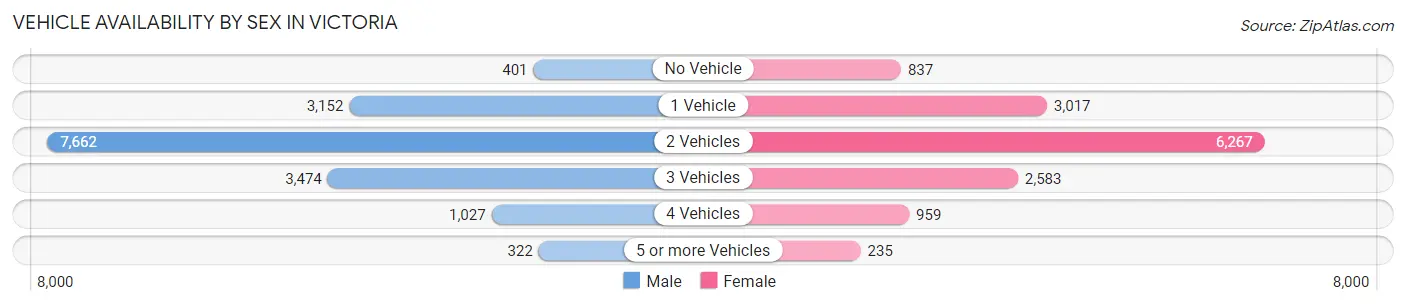
| Vehicles Available | Male | Female |
| No Vehicle | 401 (2.5%) | 837 (6.0%) |
| 1 Vehicle | 3,152 (19.7%) | 3,017 (21.7%) |
| 2 Vehicles | 7,662 (47.8%) | 6,267 (45.1%) |
| 3 Vehicles | 3,474 (21.7%) | 2,583 (18.6%) |
| 4 Vehicles | 1,027 (6.4%) | 959 (6.9%) |
| 5 or more Vehicles | 322 (2.0%) | 235 (1.7%) |
| Total | 16,038 (100.0%) | 13,898 (100.0%) |
Commute Time in Victoria
The most frequently occuring commute durations in Victoria are 10 to 14 minutes (7,495 commuters, 26.5%), 15 to 19 minutes (5,521 commuters, 19.5%), and 5 to 9 minutes (4,696 commuters, 16.6%).
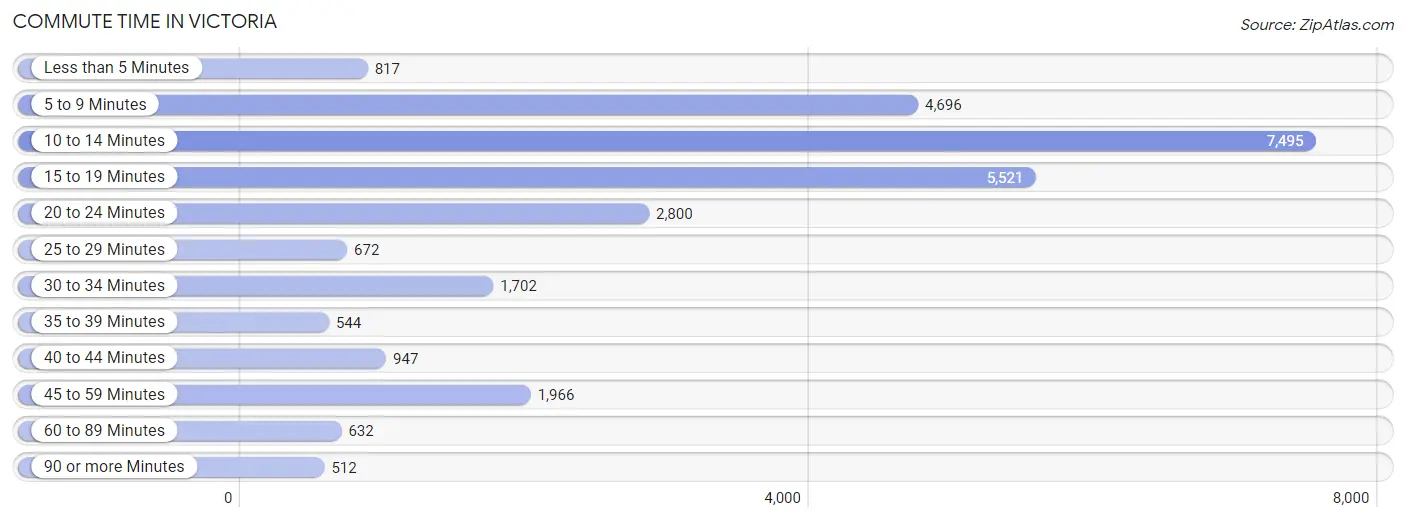
| Commute Time | # Commuters | % Commuters |
| Less than 5 Minutes | 817 | 2.9% |
| 5 to 9 Minutes | 4,696 | 16.6% |
| 10 to 14 Minutes | 7,495 | 26.5% |
| 15 to 19 Minutes | 5,521 | 19.5% |
| 20 to 24 Minutes | 2,800 | 9.9% |
| 25 to 29 Minutes | 672 | 2.4% |
| 30 to 34 Minutes | 1,702 | 6.0% |
| 35 to 39 Minutes | 544 | 1.9% |
| 40 to 44 Minutes | 947 | 3.4% |
| 45 to 59 Minutes | 1,966 | 7.0% |
| 60 to 89 Minutes | 632 | 2.2% |
| 90 or more Minutes | 512 | 1.8% |
Commute Time by Sex in Victoria
The most common commute times in Victoria are 10 to 14 minutes (3,485 commuters, 23.1%) for males and 10 to 14 minutes (4,010 commuters, 30.3%) for females.
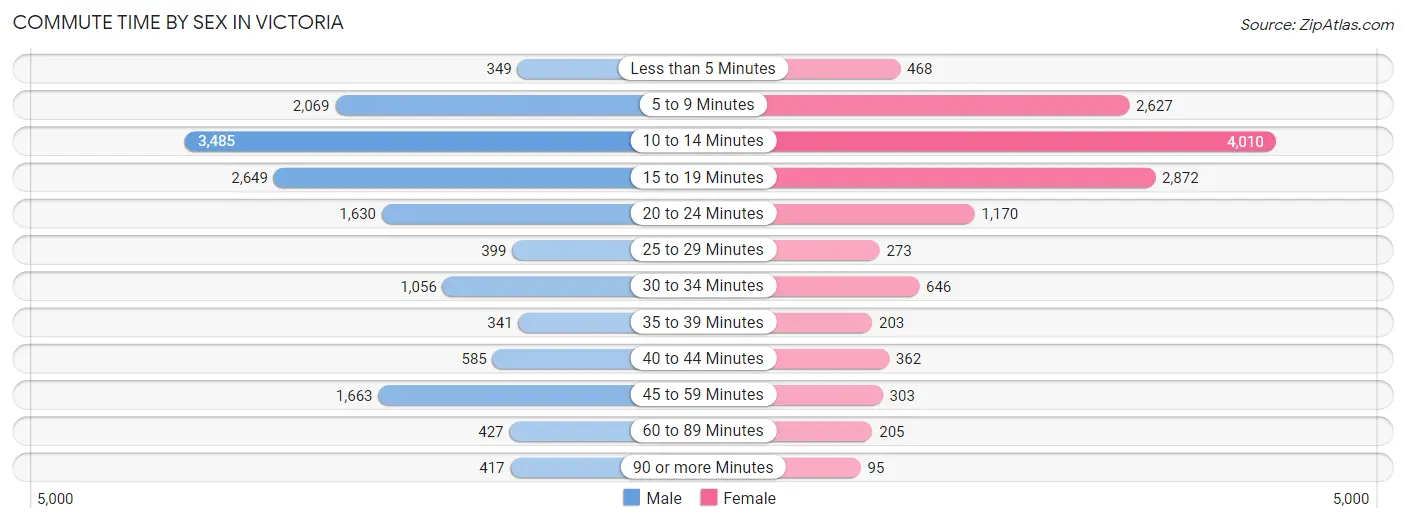
| Commute Time | Male | Female |
| Less than 5 Minutes | 349 (2.3%) | 468 (3.5%) |
| 5 to 9 Minutes | 2,069 (13.7%) | 2,627 (19.9%) |
| 10 to 14 Minutes | 3,485 (23.1%) | 4,010 (30.3%) |
| 15 to 19 Minutes | 2,649 (17.6%) | 2,872 (21.7%) |
| 20 to 24 Minutes | 1,630 (10.8%) | 1,170 (8.8%) |
| 25 to 29 Minutes | 399 (2.6%) | 273 (2.1%) |
| 30 to 34 Minutes | 1,056 (7.0%) | 646 (4.9%) |
| 35 to 39 Minutes | 341 (2.3%) | 203 (1.5%) |
| 40 to 44 Minutes | 585 (3.9%) | 362 (2.7%) |
| 45 to 59 Minutes | 1,663 (11.0%) | 303 (2.3%) |
| 60 to 89 Minutes | 427 (2.8%) | 205 (1.5%) |
| 90 or more Minutes | 417 (2.8%) | 95 (0.7%) |
Time of Departure to Work by Sex in Victoria
The most frequent times of departure to work in Victoria are 7:30 AM to 7:59 AM (2,321, 15.4%) for males and 7:00 AM to 7:29 AM (1,872, 14.1%) for females.
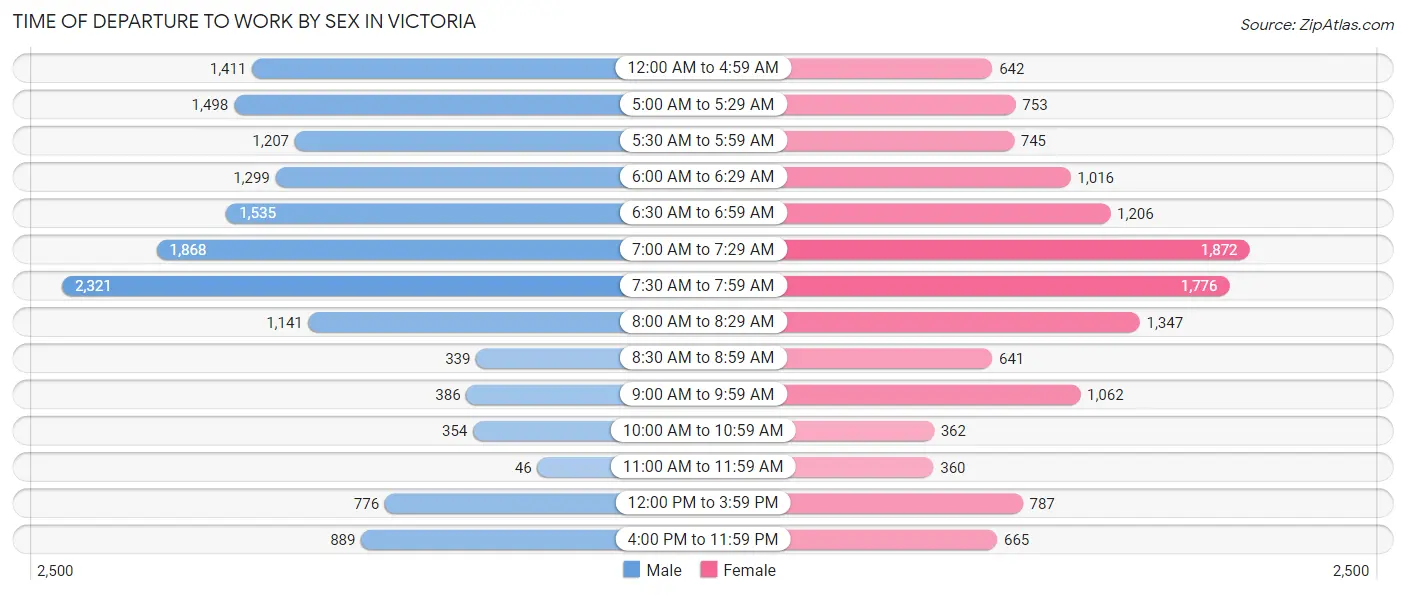
| Time of Departure | Male | Female |
| 12:00 AM to 4:59 AM | 1,411 (9.4%) | 642 (4.9%) |
| 5:00 AM to 5:29 AM | 1,498 (9.9%) | 753 (5.7%) |
| 5:30 AM to 5:59 AM | 1,207 (8.0%) | 745 (5.6%) |
| 6:00 AM to 6:29 AM | 1,299 (8.6%) | 1,016 (7.7%) |
| 6:30 AM to 6:59 AM | 1,535 (10.2%) | 1,206 (9.1%) |
| 7:00 AM to 7:29 AM | 1,868 (12.4%) | 1,872 (14.1%) |
| 7:30 AM to 7:59 AM | 2,321 (15.4%) | 1,776 (13.4%) |
| 8:00 AM to 8:29 AM | 1,141 (7.6%) | 1,347 (10.2%) |
| 8:30 AM to 8:59 AM | 339 (2.2%) | 641 (4.8%) |
| 9:00 AM to 9:59 AM | 386 (2.6%) | 1,062 (8.0%) |
| 10:00 AM to 10:59 AM | 354 (2.4%) | 362 (2.7%) |
| 11:00 AM to 11:59 AM | 46 (0.3%) | 360 (2.7%) |
| 12:00 PM to 3:59 PM | 776 (5.1%) | 787 (5.9%) |
| 4:00 PM to 11:59 PM | 889 (5.9%) | 665 (5.0%) |
| Total | 15,070 (100.0%) | 13,234 (100.0%) |
Housing Occupancy in Victoria
Occupancy by Ownership in Victoria
Of the total 24,698 dwellings in Victoria, owner-occupied units account for 15,009 (60.8%), while renter-occupied units make up 9,689 (39.2%).
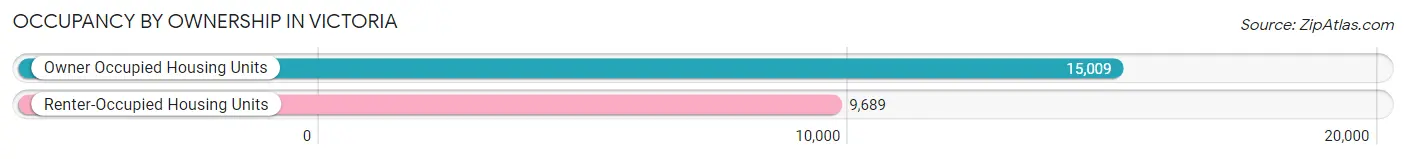
| Occupancy | # Housing Units | % Housing Units |
| Owner Occupied Housing Units | 15,009 | 60.8% |
| Renter-Occupied Housing Units | 9,689 | 39.2% |
| Total Occupied Housing Units | 24,698 | 100.0% |
Occupancy by Household Size in Victoria
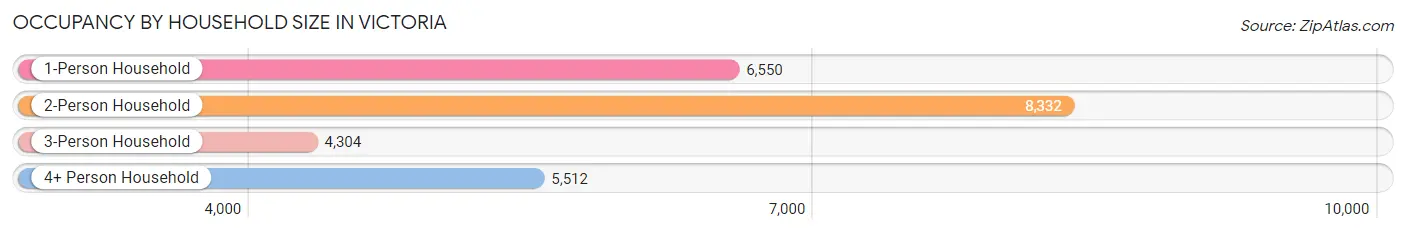
| Household Size | # Housing Units | % Housing Units |
| 1-Person Household | 6,550 | 26.5% |
| 2-Person Household | 8,332 | 33.7% |
| 3-Person Household | 4,304 | 17.4% |
| 4+ Person Household | 5,512 | 22.3% |
| Total Housing Units | 24,698 | 100.0% |
Occupancy by Ownership by Household Size in Victoria
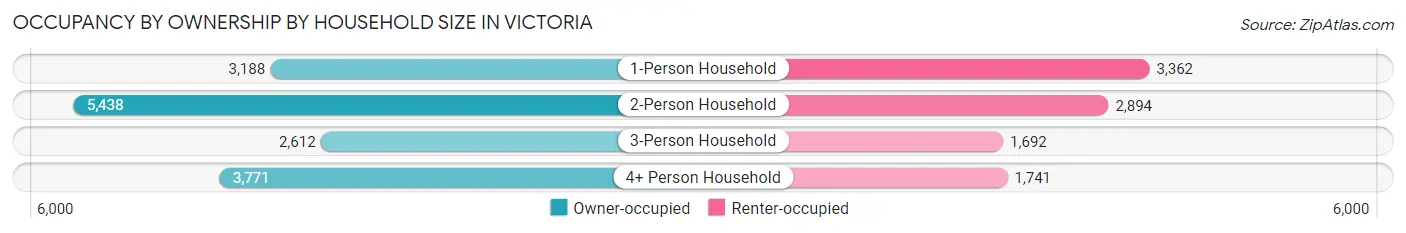
| Household Size | Owner-occupied | Renter-occupied |
| 1-Person Household | 3,188 (48.7%) | 3,362 (51.3%) |
| 2-Person Household | 5,438 (65.3%) | 2,894 (34.7%) |
| 3-Person Household | 2,612 (60.7%) | 1,692 (39.3%) |
| 4+ Person Household | 3,771 (68.4%) | 1,741 (31.6%) |
| Total Housing Units | 15,009 (60.8%) | 9,689 (39.2%) |
Occupancy by Educational Attainment in Victoria
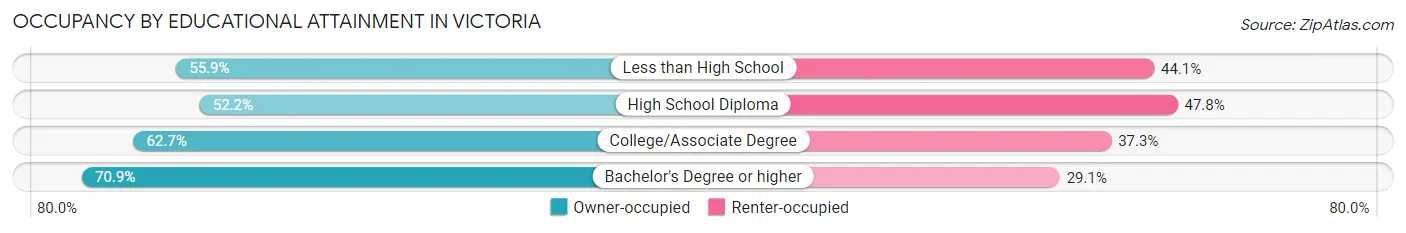
| Household Size | Owner-occupied | Renter-occupied |
| Less than High School | 2,121 (55.9%) | 1,671 (44.1%) |
| High School Diploma | 3,296 (52.2%) | 3,018 (47.8%) |
| College/Associate Degree | 5,769 (62.7%) | 3,429 (37.3%) |
| Bachelor's Degree or higher | 3,823 (70.9%) | 1,571 (29.1%) |
Occupancy by Age of Householder in Victoria
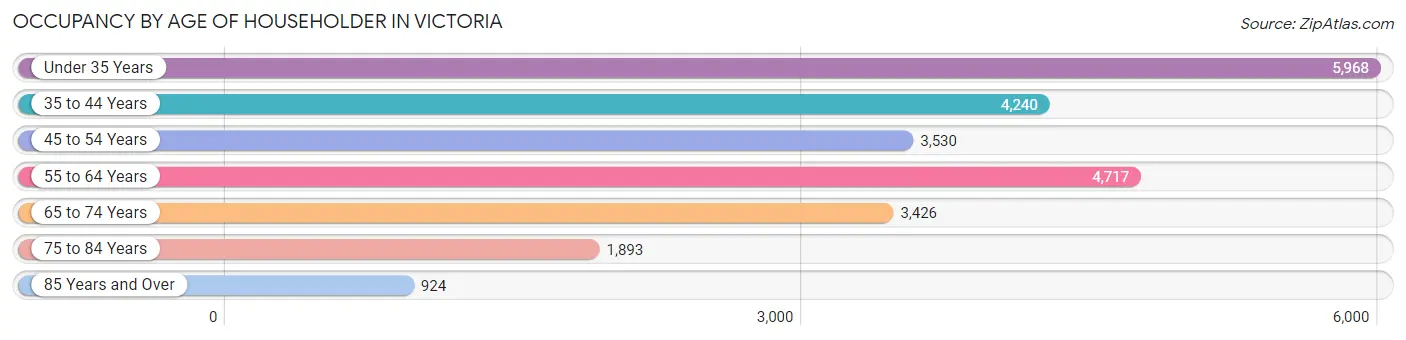
| Age Bracket | # Households | % Households |
| Under 35 Years | 5,968 | 24.2% |
| 35 to 44 Years | 4,240 | 17.2% |
| 45 to 54 Years | 3,530 | 14.3% |
| 55 to 64 Years | 4,717 | 19.1% |
| 65 to 74 Years | 3,426 | 13.9% |
| 75 to 84 Years | 1,893 | 7.7% |
| 85 Years and Over | 924 | 3.7% |
| Total | 24,698 | 100.0% |
Housing Finances in Victoria
Median Income by Occupancy in Victoria
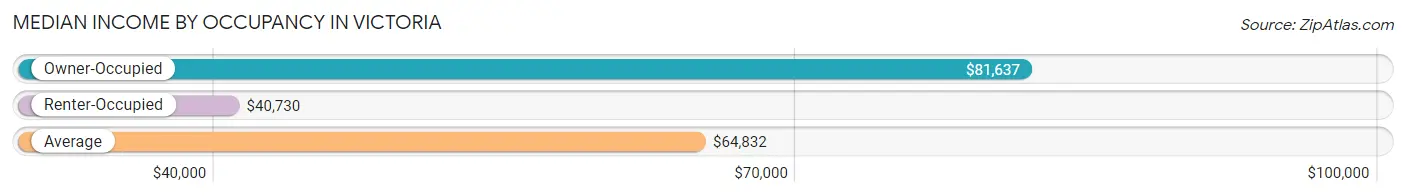
| Occupancy Type | # Households | Median Income |
| Owner-Occupied | 15,009 (60.8%) | $81,637 |
| Renter-Occupied | 9,689 (39.2%) | $40,730 |
| Average | 24,698 (100.0%) | $64,832 |
Occupancy by Householder Income Bracket in Victoria
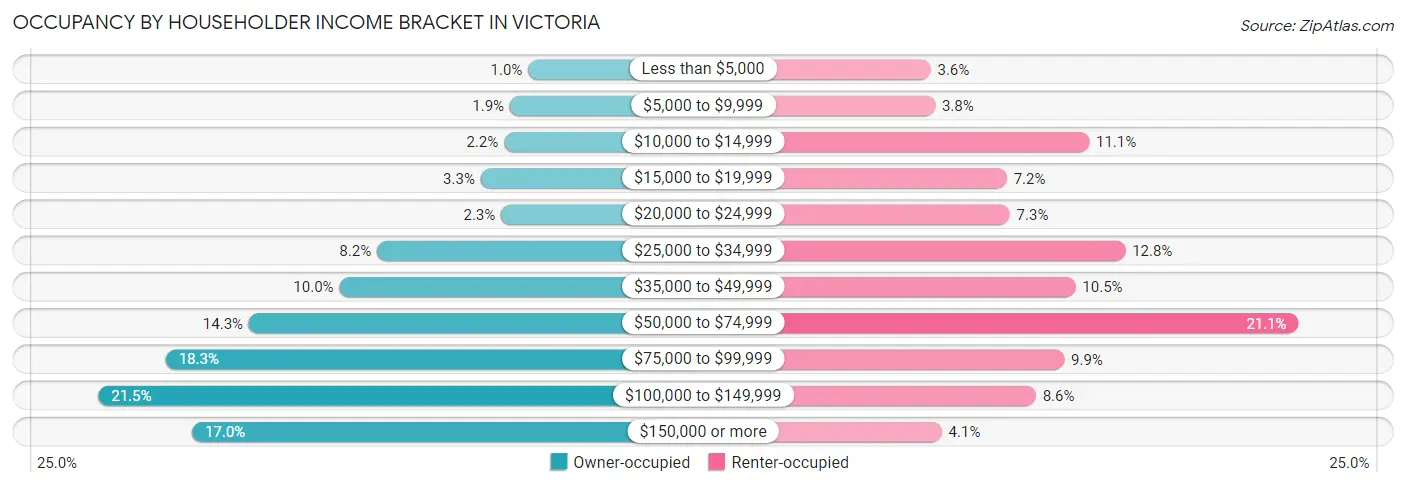
| Income Bracket | Owner-occupied | Renter-occupied |
| Less than $5,000 | 153 (1.0%) | 346 (3.6%) |
| $5,000 to $9,999 | 283 (1.9%) | 366 (3.8%) |
| $10,000 to $14,999 | 325 (2.2%) | 1,077 (11.1%) |
| $15,000 to $19,999 | 492 (3.3%) | 698 (7.2%) |
| $20,000 to $24,999 | 346 (2.3%) | 711 (7.3%) |
| $25,000 to $34,999 | 1,234 (8.2%) | 1,244 (12.8%) |
| $35,000 to $49,999 | 1,502 (10.0%) | 1,014 (10.5%) |
| $50,000 to $74,999 | 2,149 (14.3%) | 2,043 (21.1%) |
| $75,000 to $99,999 | 2,744 (18.3%) | 962 (9.9%) |
| $100,000 to $149,999 | 3,225 (21.5%) | 831 (8.6%) |
| $150,000 or more | 2,556 (17.0%) | 397 (4.1%) |
| Total | 15,009 (100.0%) | 9,689 (100.0%) |
Monthly Housing Cost Tiers in Victoria
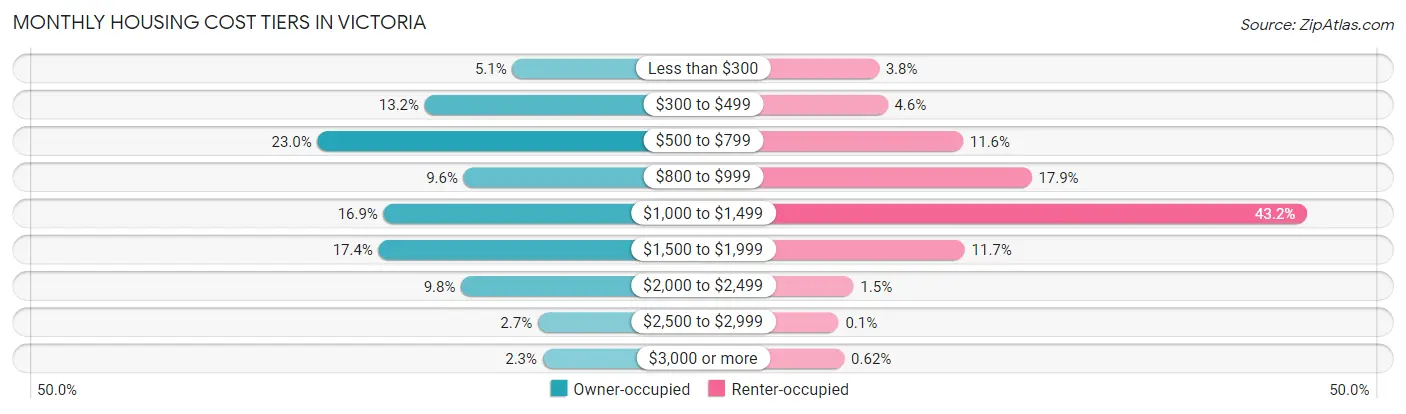
| Monthly Cost | Owner-occupied | Renter-occupied |
| Less than $300 | 763 (5.1%) | 368 (3.8%) |
| $300 to $499 | 1,973 (13.2%) | 447 (4.6%) |
| $500 to $799 | 3,456 (23.0%) | 1,119 (11.6%) |
| $800 to $999 | 1,437 (9.6%) | 1,730 (17.9%) |
| $1,000 to $1,499 | 2,542 (16.9%) | 4,190 (43.2%) |
| $1,500 to $1,999 | 2,612 (17.4%) | 1,135 (11.7%) |
| $2,000 to $2,499 | 1,471 (9.8%) | 142 (1.5%) |
| $2,500 to $2,999 | 411 (2.7%) | 10 (0.1%) |
| $3,000 or more | 344 (2.3%) | 60 (0.6%) |
| Total | 15,009 (100.0%) | 9,689 (100.0%) |
Physical Housing Characteristics in Victoria
Housing Structures in Victoria
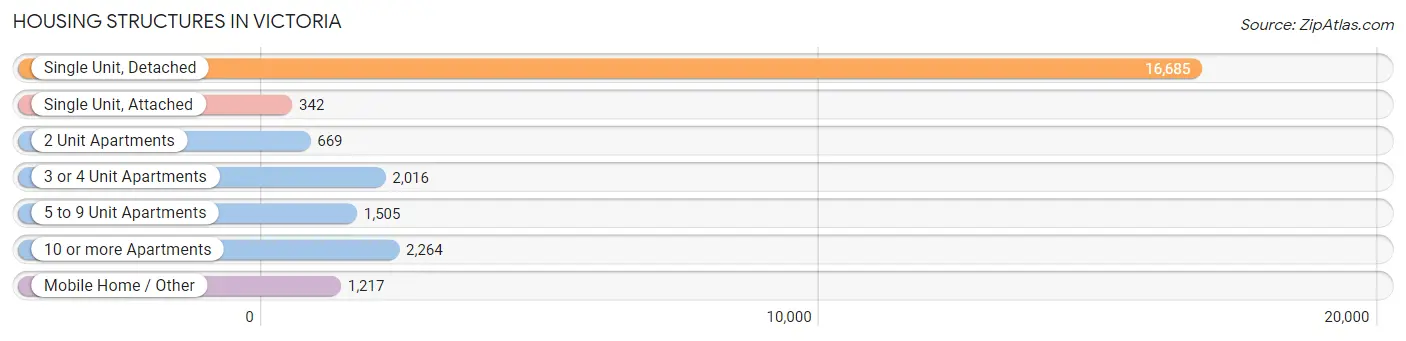
| Structure Type | # Housing Units | % Housing Units |
| Single Unit, Detached | 16,685 | 67.6% |
| Single Unit, Attached | 342 | 1.4% |
| 2 Unit Apartments | 669 | 2.7% |
| 3 or 4 Unit Apartments | 2,016 | 8.2% |
| 5 to 9 Unit Apartments | 1,505 | 6.1% |
| 10 or more Apartments | 2,264 | 9.2% |
| Mobile Home / Other | 1,217 | 4.9% |
| Total | 24,698 | 100.0% |
Housing Structures by Occupancy in Victoria
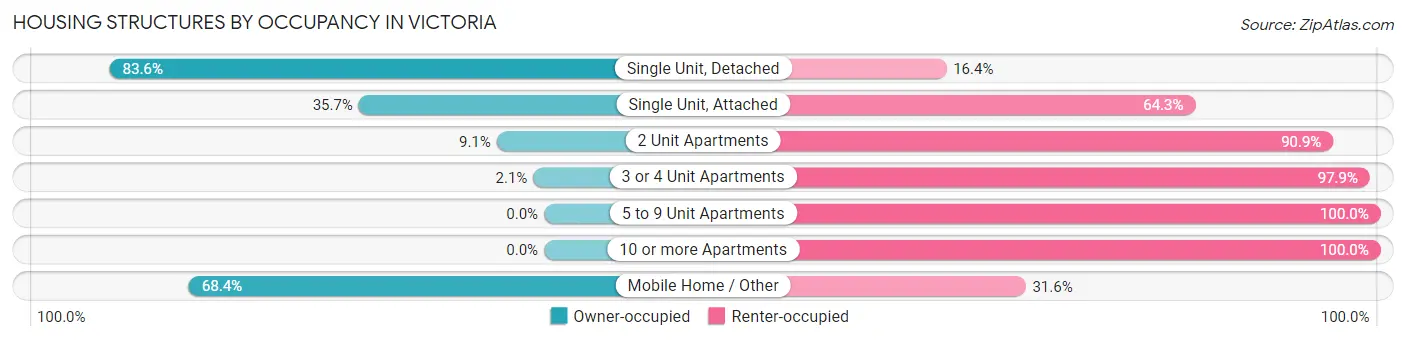
| Structure Type | Owner-occupied | Renter-occupied |
| Single Unit, Detached | 13,952 (83.6%) | 2,733 (16.4%) |
| Single Unit, Attached | 122 (35.7%) | 220 (64.3%) |
| 2 Unit Apartments | 61 (9.1%) | 608 (90.9%) |
| 3 or 4 Unit Apartments | 42 (2.1%) | 1,974 (97.9%) |
| 5 to 9 Unit Apartments | 0 (0.0%) | 1,505 (100.0%) |
| 10 or more Apartments | 0 (0.0%) | 2,264 (100.0%) |
| Mobile Home / Other | 832 (68.4%) | 385 (31.6%) |
| Total | 15,009 (60.8%) | 9,689 (39.2%) |
Housing Structures by Number of Rooms in Victoria
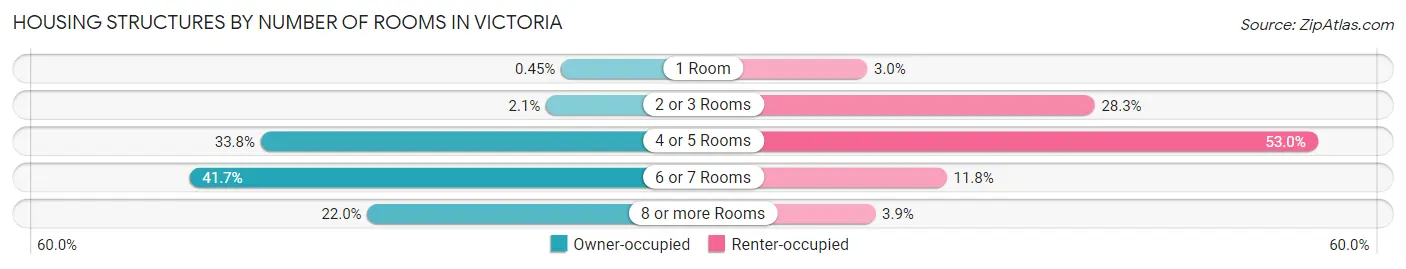
| Number of Rooms | Owner-occupied | Renter-occupied |
| 1 Room | 67 (0.4%) | 292 (3.0%) |
| 2 or 3 Rooms | 316 (2.1%) | 2,737 (28.2%) |
| 4 or 5 Rooms | 5,072 (33.8%) | 5,136 (53.0%) |
| 6 or 7 Rooms | 6,260 (41.7%) | 1,146 (11.8%) |
| 8 or more Rooms | 3,294 (22.0%) | 378 (3.9%) |
| Total | 15,009 (100.0%) | 9,689 (100.0%) |
Housing Structure by Heating Type in Victoria
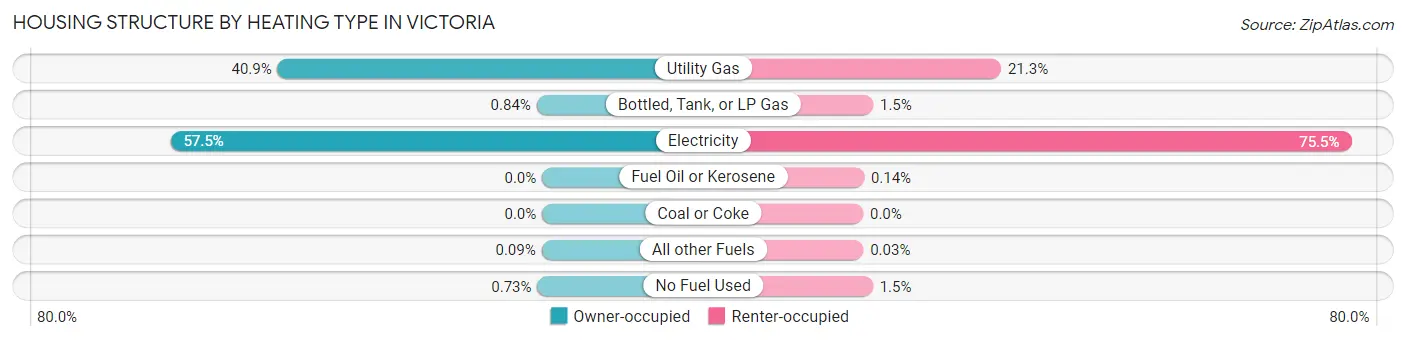
| Heating Type | Owner-occupied | Renter-occupied |
| Utility Gas | 6,138 (40.9%) | 2,066 (21.3%) |
| Bottled, Tank, or LP Gas | 126 (0.8%) | 149 (1.5%) |
| Electricity | 8,623 (57.5%) | 7,313 (75.5%) |
| Fuel Oil or Kerosene | 0 (0.0%) | 14 (0.1%) |
| Coal or Coke | 0 (0.0%) | 0 (0.0%) |
| All other Fuels | 13 (0.1%) | 3 (0.0%) |
| No Fuel Used | 109 (0.7%) | 144 (1.5%) |
| Total | 15,009 (100.0%) | 9,689 (100.0%) |
Household Vehicle Usage in Victoria
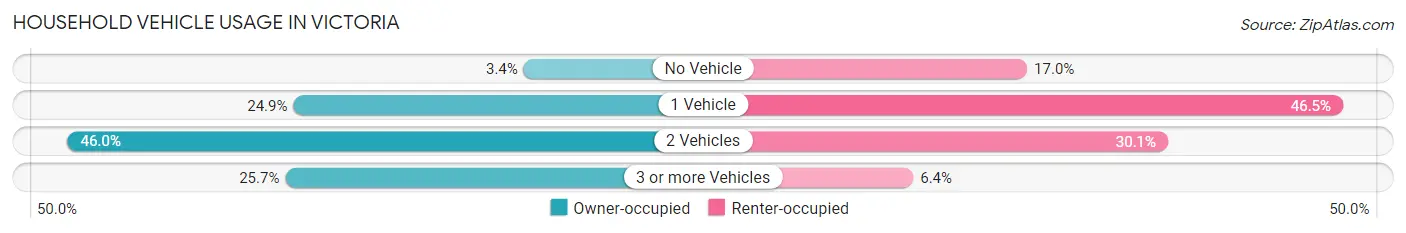
| Vehicles per Household | Owner-occupied | Renter-occupied |
| No Vehicle | 513 (3.4%) | 1,648 (17.0%) |
| 1 Vehicle | 3,740 (24.9%) | 4,503 (46.5%) |
| 2 Vehicles | 6,903 (46.0%) | 2,920 (30.1%) |
| 3 or more Vehicles | 3,853 (25.7%) | 618 (6.4%) |
| Total | 15,009 (100.0%) | 9,689 (100.0%) |
Real Estate & Mortgages in Victoria
Real Estate and Mortgage Overview in Victoria
| Characteristic | Without Mortgage | With Mortgage |
| Housing Units | 7,307 | 7,702 |
| Median Property Value | $159,200 | $189,200 |
| Median Household Income | $64,381 | $1,660 |
| Monthly Housing Costs | $587 | $335 |
| Real Estate Taxes | $2,444 | $172 |
Property Value by Mortgage Status in Victoria
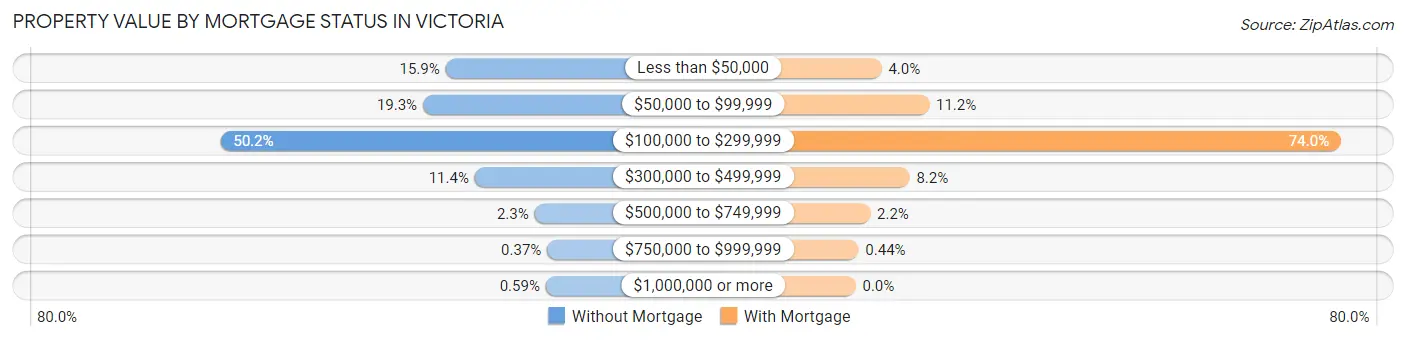
| Property Value | Without Mortgage | With Mortgage |
| Less than $50,000 | 1,159 (15.9%) | 304 (4.0%) |
| $50,000 to $99,999 | 1,410 (19.3%) | 863 (11.2%) |
| $100,000 to $299,999 | 3,667 (50.2%) | 5,697 (74.0%) |
| $300,000 to $499,999 | 834 (11.4%) | 633 (8.2%) |
| $500,000 to $749,999 | 167 (2.3%) | 171 (2.2%) |
| $750,000 to $999,999 | 27 (0.4%) | 34 (0.4%) |
| $1,000,000 or more | 43 (0.6%) | 0 (0.0%) |
| Total | 7,307 (100.0%) | 7,702 (100.0%) |
Household Income by Mortgage Status in Victoria
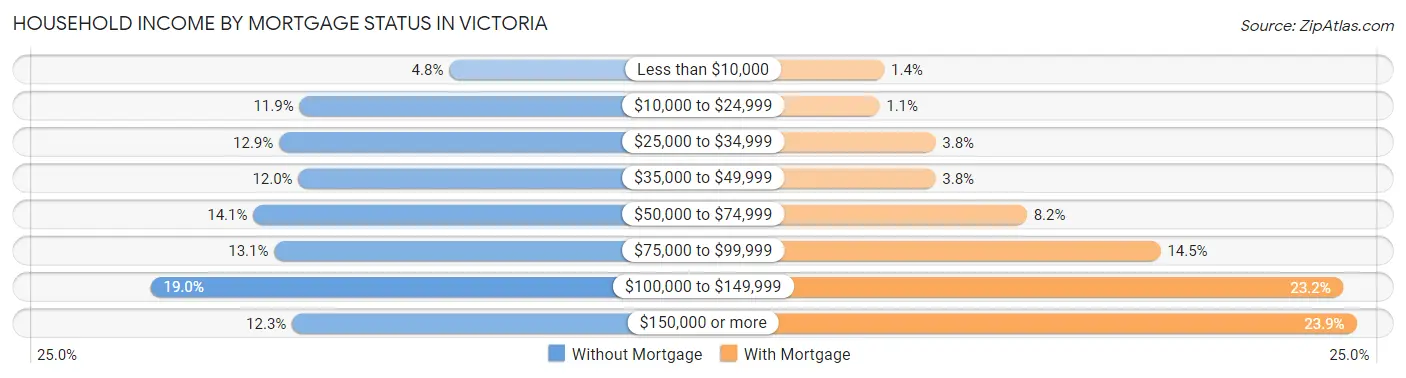
| Household Income | Without Mortgage | With Mortgage |
| Less than $10,000 | 349 (4.8%) | 105 (1.4%) |
| $10,000 to $24,999 | 870 (11.9%) | 87 (1.1%) |
| $25,000 to $34,999 | 941 (12.9%) | 293 (3.8%) |
| $35,000 to $49,999 | 874 (12.0%) | 293 (3.8%) |
| $50,000 to $74,999 | 1,031 (14.1%) | 628 (8.2%) |
| $75,000 to $99,999 | 958 (13.1%) | 1,118 (14.5%) |
| $100,000 to $149,999 | 1,388 (19.0%) | 1,786 (23.2%) |
| $150,000 or more | 896 (12.3%) | 1,837 (23.8%) |
| Total | 7,307 (100.0%) | 7,702 (100.0%) |
Property Value to Household Income Ratio in Victoria
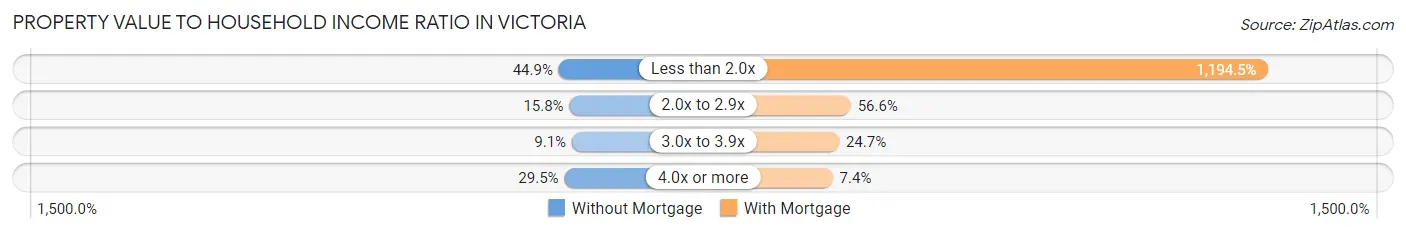
| Value-to-Income Ratio | Without Mortgage | With Mortgage |
| Less than 2.0x | 3,278 (44.9%) | 92,000 (1,194.5%) |
| 2.0x to 2.9x | 1,152 (15.8%) | 4,358 (56.6%) |
| 3.0x to 3.9x | 664 (9.1%) | 1,905 (24.7%) |
| 4.0x or more | 2,153 (29.5%) | 573 (7.4%) |
| Total | 7,307 (100.0%) | 7,702 (100.0%) |
Real Estate Taxes by Mortgage Status in Victoria
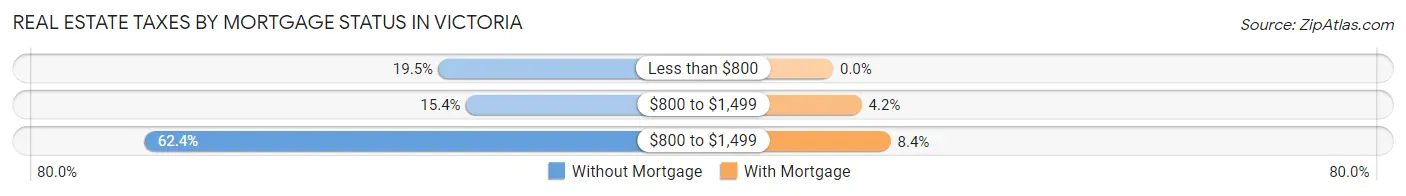
| Property Taxes | Without Mortgage | With Mortgage |
| Less than $800 | 1,422 (19.5%) | 0 (0.0%) |
| $800 to $1,499 | 1,128 (15.4%) | 321 (4.2%) |
| $800 to $1,499 | 4,561 (62.4%) | 648 (8.4%) |
| Total | 7,307 (100.0%) | 7,702 (100.0%) |
Health & Disability in Victoria
Health Insurance Coverage by Age in Victoria
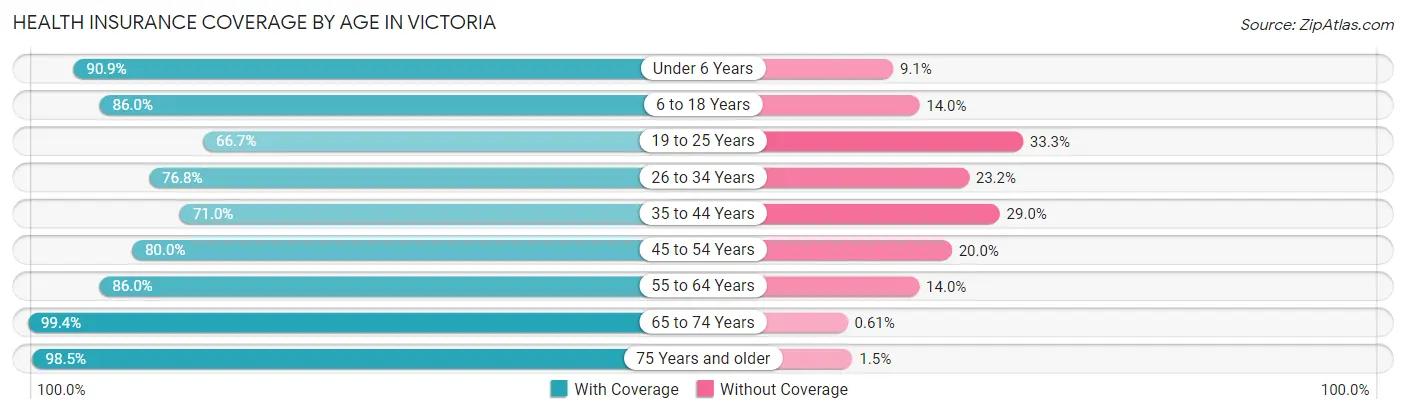
| Age Bracket | With Coverage | Without Coverage |
| Under 6 Years | 4,990 (90.9%) | 499 (9.1%) |
| 6 to 18 Years | 10,200 (86.0%) | 1,658 (14.0%) |
| 19 to 25 Years | 4,672 (66.7%) | 2,332 (33.3%) |
| 26 to 34 Years | 6,408 (76.8%) | 1,938 (23.2%) |
| 35 to 44 Years | 5,668 (71.0%) | 2,312 (29.0%) |
| 45 to 54 Years | 5,329 (80.0%) | 1,335 (20.0%) |
| 55 to 64 Years | 6,537 (86.0%) | 1,061 (14.0%) |
| 65 to 74 Years | 5,671 (99.4%) | 35 (0.6%) |
| 75 Years and older | 3,791 (98.5%) | 58 (1.5%) |
| Total | 53,266 (82.6%) | 11,228 (17.4%) |
Health Insurance Coverage by Citizenship Status in Victoria
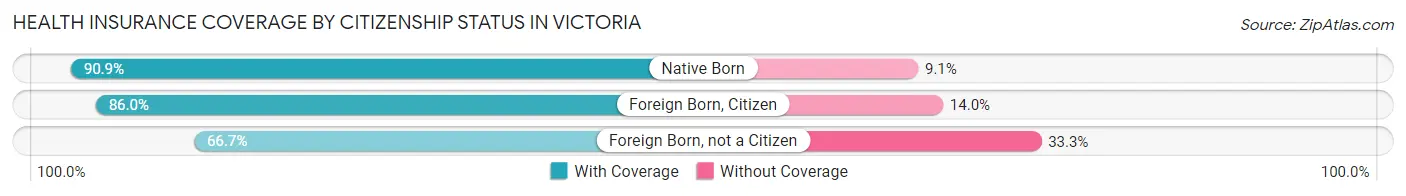
| Citizenship Status | With Coverage | Without Coverage |
| Native Born | 4,990 (90.9%) | 499 (9.1%) |
| Foreign Born, Citizen | 10,200 (86.0%) | 1,658 (14.0%) |
| Foreign Born, not a Citizen | 4,672 (66.7%) | 2,332 (33.3%) |
Health Insurance Coverage by Household Income in Victoria
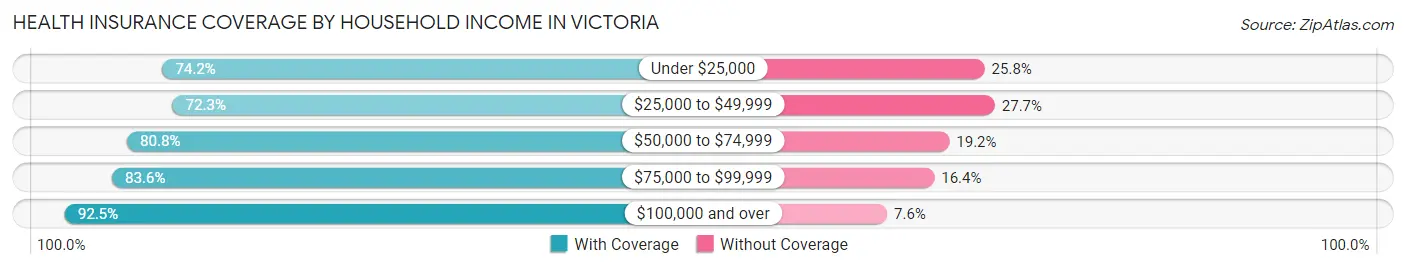
| Household Income | With Coverage | Without Coverage |
| Under $25,000 | 6,919 (74.2%) | 2,410 (25.8%) |
| $25,000 to $49,999 | 8,519 (72.3%) | 3,271 (27.7%) |
| $50,000 to $74,999 | 8,155 (80.8%) | 1,940 (19.2%) |
| $75,000 to $99,999 | 9,374 (83.6%) | 1,838 (16.4%) |
| $100,000 and over | 20,096 (92.4%) | 1,640 (7.5%) |
Public vs Private Health Insurance Coverage by Age in Victoria
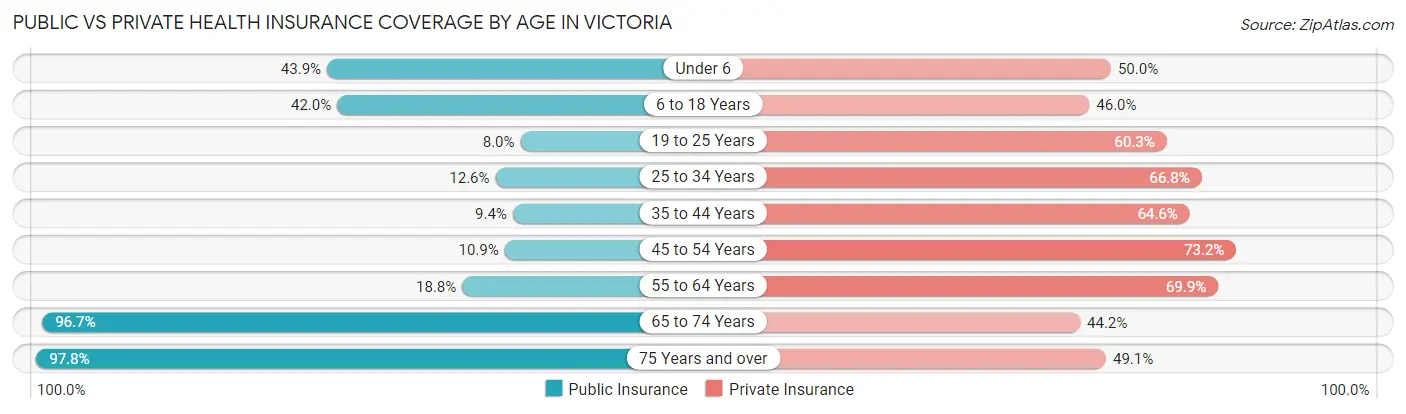
| Age Bracket | Public Insurance | Private Insurance |
| Under 6 | 2,409 (43.9%) | 2,743 (50.0%) |
| 6 to 18 Years | 4,982 (42.0%) | 5,449 (46.0%) |
| 19 to 25 Years | 559 (8.0%) | 4,222 (60.3%) |
| 25 to 34 Years | 1,053 (12.6%) | 5,572 (66.8%) |
| 35 to 44 Years | 750 (9.4%) | 5,153 (64.6%) |
| 45 to 54 Years | 727 (10.9%) | 4,878 (73.2%) |
| 55 to 64 Years | 1,428 (18.8%) | 5,307 (69.9%) |
| 65 to 74 Years | 5,519 (96.7%) | 2,524 (44.2%) |
| 75 Years and over | 3,765 (97.8%) | 1,888 (49.0%) |
| Total | 21,192 (32.9%) | 37,736 (58.5%) |
Disability Status by Sex by Age in Victoria
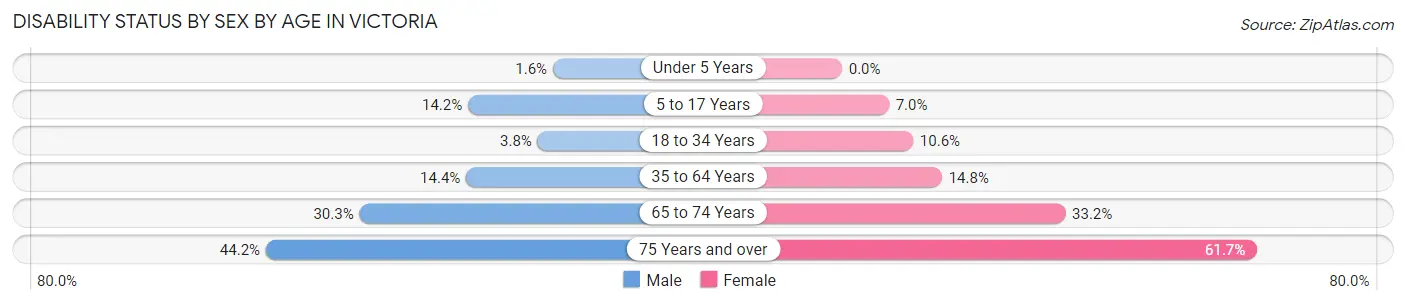
| Age Bracket | Male | Female |
| Under 5 Years | 36 (1.5%) | 0 (0.0%) |
| 5 to 17 Years | 865 (14.1%) | 410 (7.0%) |
| 18 to 34 Years | 314 (3.8%) | 829 (10.6%) |
| 35 to 64 Years | 1,528 (14.4%) | 1,729 (14.8%) |
| 65 to 74 Years | 816 (30.3%) | 998 (33.2%) |
| 75 Years and over | 678 (44.2%) | 1,427 (61.7%) |
Disability Class by Sex by Age in Victoria
Disability Class: Hearing Difficulty
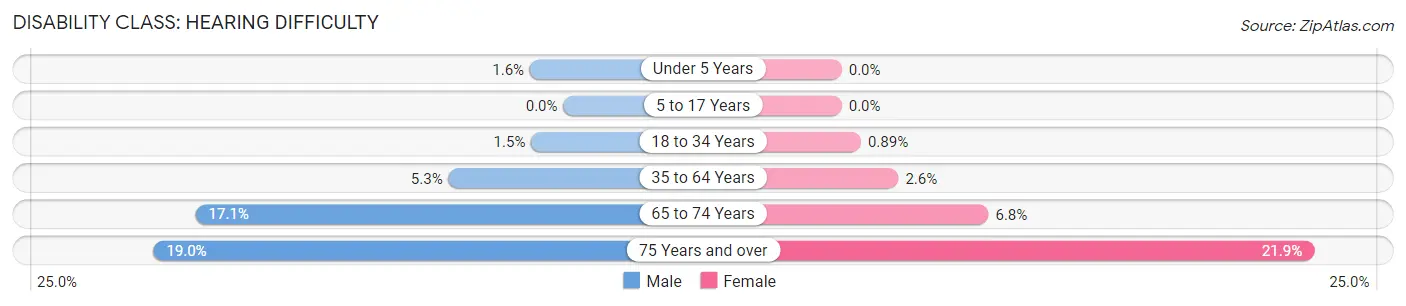
| Age Bracket | Male | Female |
| Under 5 Years | 36 (1.5%) | 0 (0.0%) |
| 5 to 17 Years | 0 (0.0%) | 0 (0.0%) |
| 18 to 34 Years | 123 (1.5%) | 70 (0.9%) |
| 35 to 64 Years | 564 (5.3%) | 307 (2.6%) |
| 65 to 74 Years | 460 (17.1%) | 205 (6.8%) |
| 75 Years and over | 292 (19.0%) | 507 (21.9%) |
Disability Class: Vision Difficulty
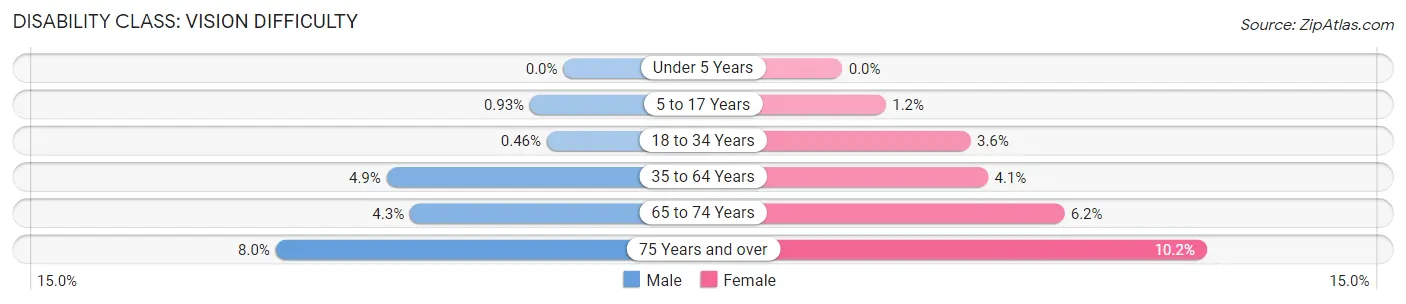
| Age Bracket | Male | Female |
| Under 5 Years | 0 (0.0%) | 0 (0.0%) |
| 5 to 17 Years | 57 (0.9%) | 71 (1.2%) |
| 18 to 34 Years | 38 (0.5%) | 280 (3.6%) |
| 35 to 64 Years | 521 (4.9%) | 473 (4.1%) |
| 65 to 74 Years | 115 (4.3%) | 186 (6.2%) |
| 75 Years and over | 123 (8.0%) | 235 (10.2%) |
Disability Class: Cognitive Difficulty
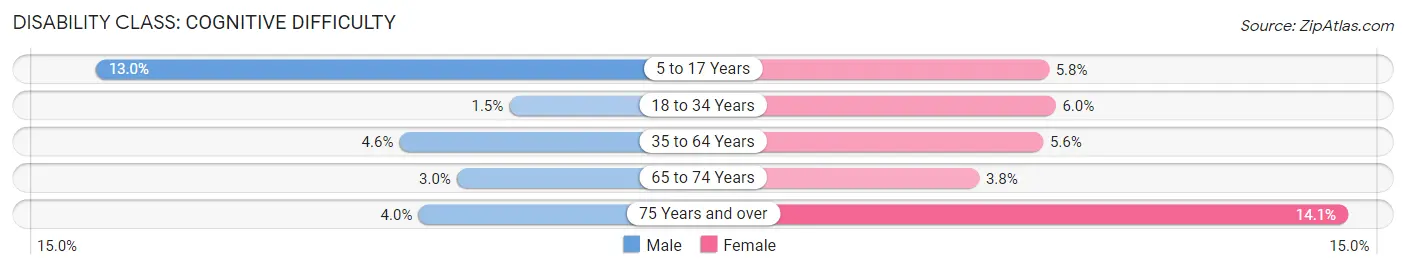
| Age Bracket | Male | Female |
| 5 to 17 Years | 796 (13.0%) | 339 (5.8%) |
| 18 to 34 Years | 124 (1.5%) | 467 (5.9%) |
| 35 to 64 Years | 484 (4.6%) | 653 (5.6%) |
| 65 to 74 Years | 80 (3.0%) | 115 (3.8%) |
| 75 Years and over | 62 (4.0%) | 326 (14.1%) |
Disability Class: Ambulatory Difficulty
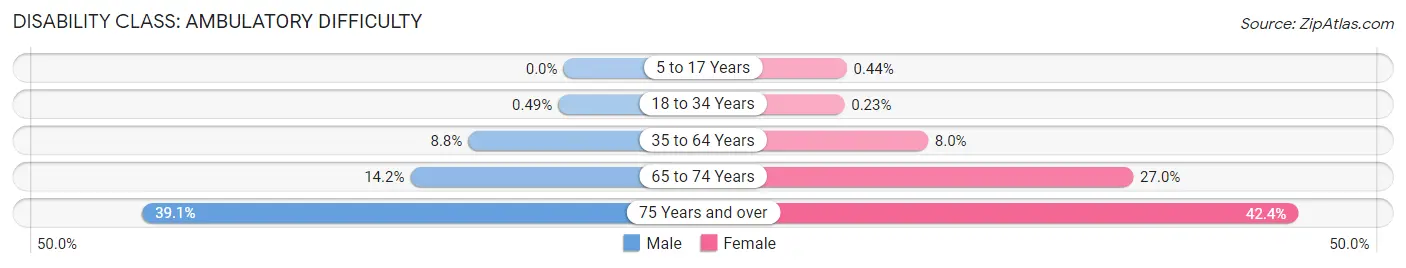
| Age Bracket | Male | Female |
| 5 to 17 Years | 0 (0.0%) | 26 (0.4%) |
| 18 to 34 Years | 40 (0.5%) | 18 (0.2%) |
| 35 to 64 Years | 936 (8.8%) | 931 (8.0%) |
| 65 to 74 Years | 383 (14.2%) | 814 (27.0%) |
| 75 Years and over | 600 (39.1%) | 980 (42.3%) |
Disability Class: Self-Care Difficulty
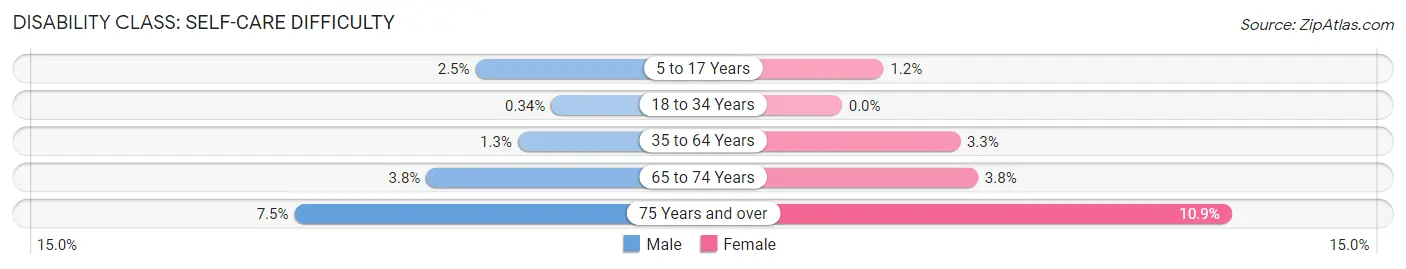
| Age Bracket | Male | Female |
| 5 to 17 Years | 150 (2.5%) | 68 (1.2%) |
| 18 to 34 Years | 28 (0.3%) | 0 (0.0%) |
| 35 to 64 Years | 135 (1.3%) | 383 (3.3%) |
| 65 to 74 Years | 103 (3.8%) | 114 (3.8%) |
| 75 Years and over | 115 (7.5%) | 251 (10.8%) |
Technology Access in Victoria
Computing Device Access in Victoria
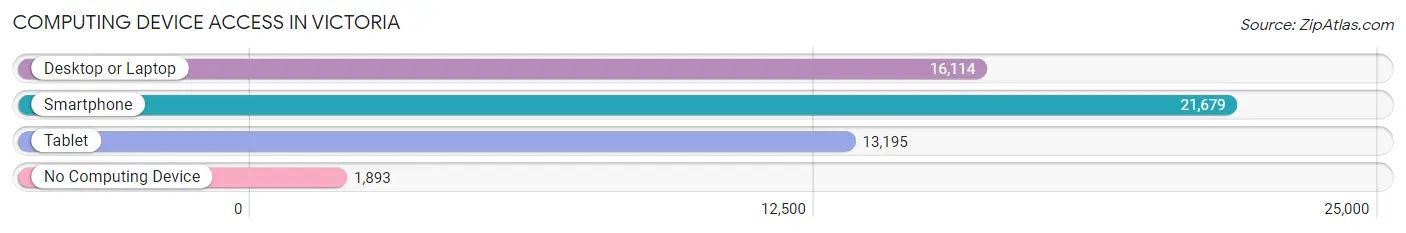
| Device Type | # Households | % Households |
| Desktop or Laptop | 16,114 | 65.2% |
| Smartphone | 21,679 | 87.8% |
| Tablet | 13,195 | 53.4% |
| No Computing Device | 1,893 | 7.7% |
| Total | 24,698 | 100.0% |
Internet Access in Victoria
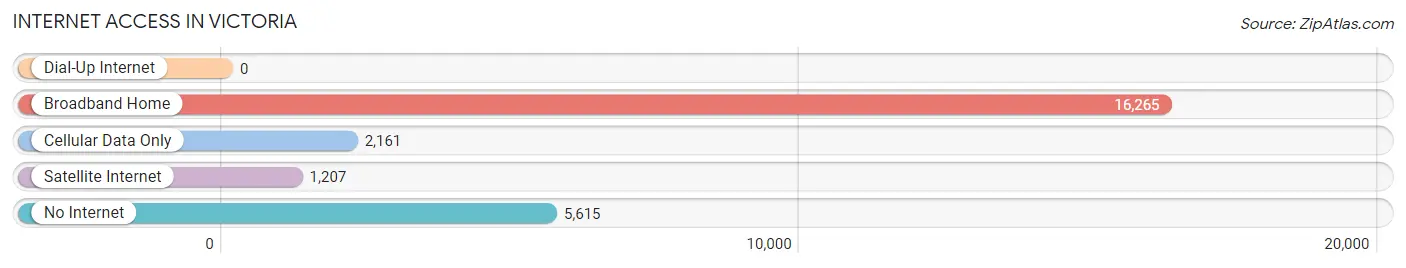
| Internet Type | # Households | % Households |
| Dial-Up Internet | 0 | 0.0% |
| Broadband Home | 16,265 | 65.9% |
| Cellular Data Only | 2,161 | 8.7% |
| Satellite Internet | 1,207 | 4.9% |
| No Internet | 5,615 | 22.7% |
| Total | 24,698 | 100.0% |
Victoria Summary
Victoria, Texas is a city located in the south-central part of the state, in Victoria County. It is the county seat and the largest city in the county. The city is located on the Guadalupe River, about 30 miles inland from the Gulf of Mexico. The city is part of the Victoria Metropolitan Statistical Area, which includes all of Victoria County and DeWitt County.
History
The area that is now Victoria was first settled by Europeans in the early 1800s. The first settlers were Spanish missionaries, who established a mission in the area in 1722. The mission was abandoned in 1726, but the area continued to be inhabited by Native Americans. In 1824, the Mexican government granted land in the area to empresario Martín De León, who established the town of La Bahía. The town was renamed Victoria in 1834, after the newly-independent Republic of Texas.
In 1836, the Texas Revolution began, and Victoria was the site of several battles between the Texan and Mexican forces. After the war, Victoria became an important trading center for the region. The city was incorporated in 1839, and by the 1850s, it had become a major port for cotton and other goods.
In the late 19th century, Victoria became an important railroad hub, with several lines connecting the city to other parts of Texas and the United States. The city also became a center for oil production, and by the early 20th century, it was one of the largest cities in the state.
Geography
Victoria is located in south-central Texas, in Victoria County. The city is situated on the Guadalupe River, about 30 miles inland from the Gulf of Mexico. The city is part of the Victoria Metropolitan Statistical Area, which includes all of Victoria County and DeWitt County.
The city has a total area of 24.3 square miles, of which 24.2 square miles is land and 0.1 square miles is water. The city is located in a humid subtropical climate zone, with hot, humid summers and mild winters.
Economy
Victoria’s economy is largely based on the oil and gas industry, as well as agriculture and manufacturing. The city is home to several major oil and gas companies, including Chevron, ExxonMobil, and Valero. The city is also home to several manufacturing companies, including Caterpillar, Dow Chemical, and 3M.
Agriculture is also an important part of the local economy. The area is known for its production of cotton, corn, sorghum, and hay. The city is also home to several food processing plants, including a Tyson Foods plant and a Cargill plant.
Demographics
As of the 2010 census, the city of Victoria had a population of 62,592. The racial makeup of the city was 75.3% White, 8.2% African American, 0.7% Native American, 0.9% Asian, 0.1% Pacific Islander, 12.3% from other races, and 2.5% from two or more races. Hispanic or Latino of any race were 33.2% of the population.
The median household income in the city was $41,945, and the median family income was $50,919. The per capita income for the city was $20,945. About 17.2% of the population was below the poverty line.
Common Questions
What is Per Capita Income in Victoria?
Per Capita income in Victoria is $30,709.
What is the Median Family Income in Victoria?
Median Family Income in Victoria is $78,779.
What is the Median Household income in Victoria?
Median Household Income in Victoria is $64,832.
What is Income or Wage Gap in Victoria?
Income or Wage Gap in Victoria is 38.2%.
Women in Victoria earn 61.8 cents for every dollar earned by a man.
What is Family Income Deficit in Victoria?
Family Income Deficit in Victoria is $8,285.
Families that are below poverty line in Victoria earn $8,285 less on average than the poverty threshold level.
What is Inequality or Gini Index in Victoria?
Inequality or Gini Index in Victoria is 0.44.
What is the Total Population of Victoria?
Total Population of Victoria is 65,481.
What is the Total Male Population of Victoria?
Total Male Population of Victoria is 32,151.
What is the Total Female Population of Victoria?
Total Female Population of Victoria is 33,330.
What is the Ratio of Males per 100 Females in Victoria?
There are 96.46 Males per 100 Females in Victoria.
What is the Ratio of Females per 100 Males in Victoria?
There are 103.67 Females per 100 Males in Victoria.
What is the Median Population Age in Victoria?
Median Population Age in Victoria is 34.7 Years.
What is the Average Family Size in Victoria
Average Family Size in Victoria is 3.2 People.
What is the Average Household Size in Victoria
Average Household Size in Victoria is 2.6 People.
How Large is the Labor Force in Victoria?
There are 32,271 People in the Labor Forcein in Victoria.
What is the Percentage of People in the Labor Force in Victoria?
63.8% of People are in the Labor Force in Victoria.
What is the Unemployment Rate in Victoria?
Unemployment Rate in Victoria is 5.5%.