Zip Codes with the Highest Percentage of Population Employed in Administrative & Support Services in Killeen, TX
RELATED REPORTS & OPTIONS
Administrative & Support Services
Killeen
Compare Zip Codes
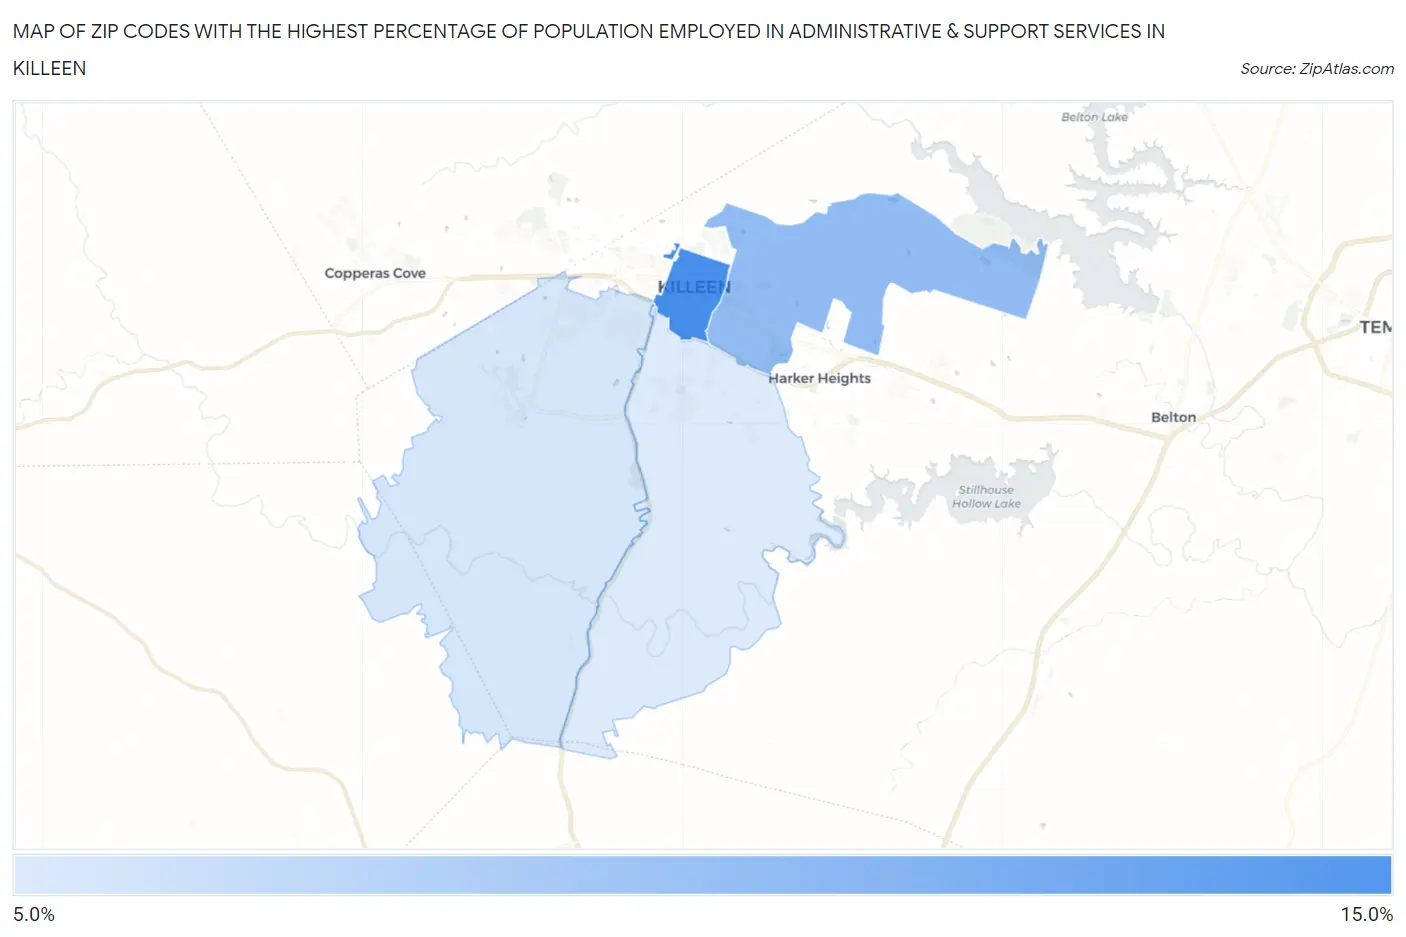
Map of Zip Codes with the Highest Percentage of Population Employed in Administrative & Support Services in Killeen
5.7%
14.5%
Zip Codes with the Highest Percentage of Population Employed in Administrative & Support Services in Killeen, TX
| Zip Code | % Employed | vs State | vs National | |
| 1. | 76541 | 14.5% | 4.4%(+10.1)#37 | 4.1%(+10.3)#575 |
| 2. | 76543 | 10.1% | 4.4%(+5.73)#87 | 4.1%(+6.00)#1,237 |
| 3. | 76549 | 6.1% | 4.4%(+1.66)#349 | 4.1%(+1.92)#4,641 |
| 4. | 76542 | 5.7% | 4.4%(+1.32)#398 | 4.1%(+1.58)#5,294 |
1
Common Questions
What are the Top 3 Zip Codes with the Highest Percentage of Population Employed in Administrative & Support Services in Killeen, TX?
Top 3 Zip Codes with the Highest Percentage of Population Employed in Administrative & Support Services in Killeen, TX are:
What zip code has the Highest Percentage of Population Employed in Administrative & Support Services in Killeen, TX?
76541 has the Highest Percentage of Population Employed in Administrative & Support Services in Killeen, TX with 14.5%.
What is the Percentage of Population Employed in Administrative & Support Services in Killeen, TX?
Percentage of Population Employed in Administrative & Support Services in Killeen is 7.9%.
What is the Percentage of Population Employed in Administrative & Support Services in Texas?
Percentage of Population Employed in Administrative & Support Services in Texas is 4.4%.
What is the Percentage of Population Employed in Administrative & Support Services in the United States?
Percentage of Population Employed in Administrative & Support Services in the United States is 4.1%.