Zip Codes with the Highest Percentage of Population with a Degree in Engineering in Paris, TX
RELATED REPORTS & OPTIONS
Engineering
Paris
Compare Zip Codes
Map of Zip Codes with the Highest Percentage of Population with a Degree in Engineering in Paris
3.7%
4.7%
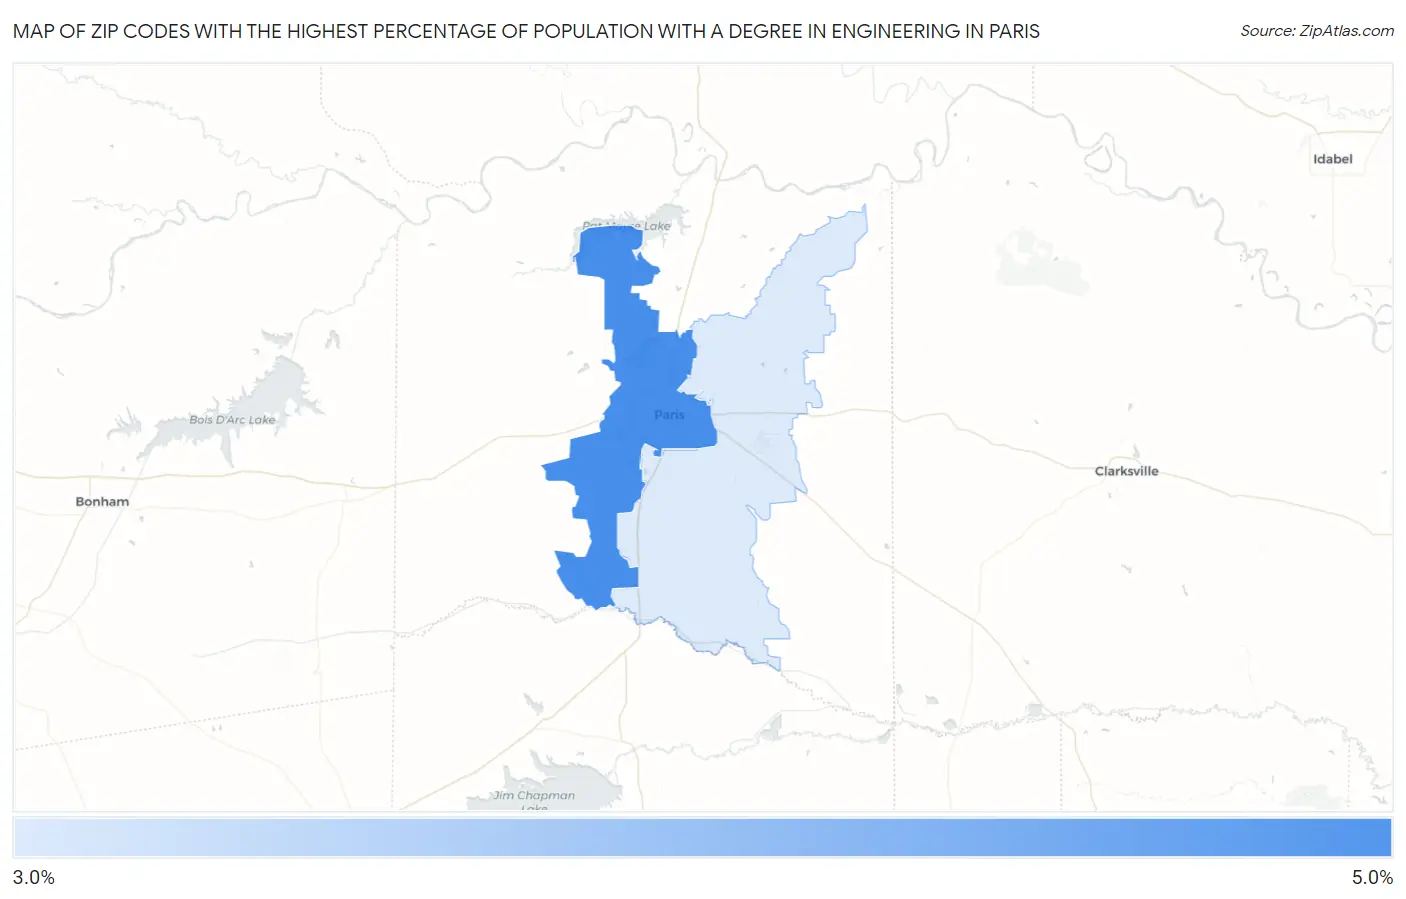
Zip Codes with the Highest Percentage of Population with a Degree in Engineering in Paris, TX
| Zip Code | % Graduates | vs State | vs National | |
| 1. | 75460 | 4.7% | 9.5%(-4.83)#955 | 7.6%(-2.93)#14,474 |
| 2. | 75462 | 3.7% | 9.5%(-5.84)#1,082 | 7.6%(-3.95)#17,168 |
1
Common Questions
What are the Top Zip Codes with the Highest Percentage of Population with a Degree in Engineering in Paris, TX?
Top Zip Codes with the Highest Percentage of Population with a Degree in Engineering in Paris, TX are:
What zip code has the Highest Percentage of Population with a Degree in Engineering in Paris, TX?
75460 has the Highest Percentage of Population with a Degree in Engineering in Paris, TX with 4.7%.
What is the Percentage of Population with a Degree in Engineering in Paris, TX?
Percentage of Population with a Degree in Engineering in Paris is 3.1%.
What is the Percentage of Population with a Degree in Engineering in Texas?
Percentage of Population with a Degree in Engineering in Texas is 9.5%.
What is the Percentage of Population with a Degree in Engineering in the United States?
Percentage of Population with a Degree in Engineering in the United States is 7.6%.