Zip Codes with the Highest Percentage of Population Employed in Education Instruction & Library in Corpus Christi, TX
RELATED REPORTS & OPTIONS
Education Instruction & Library
Corpus Christi
Compare Zip Codes
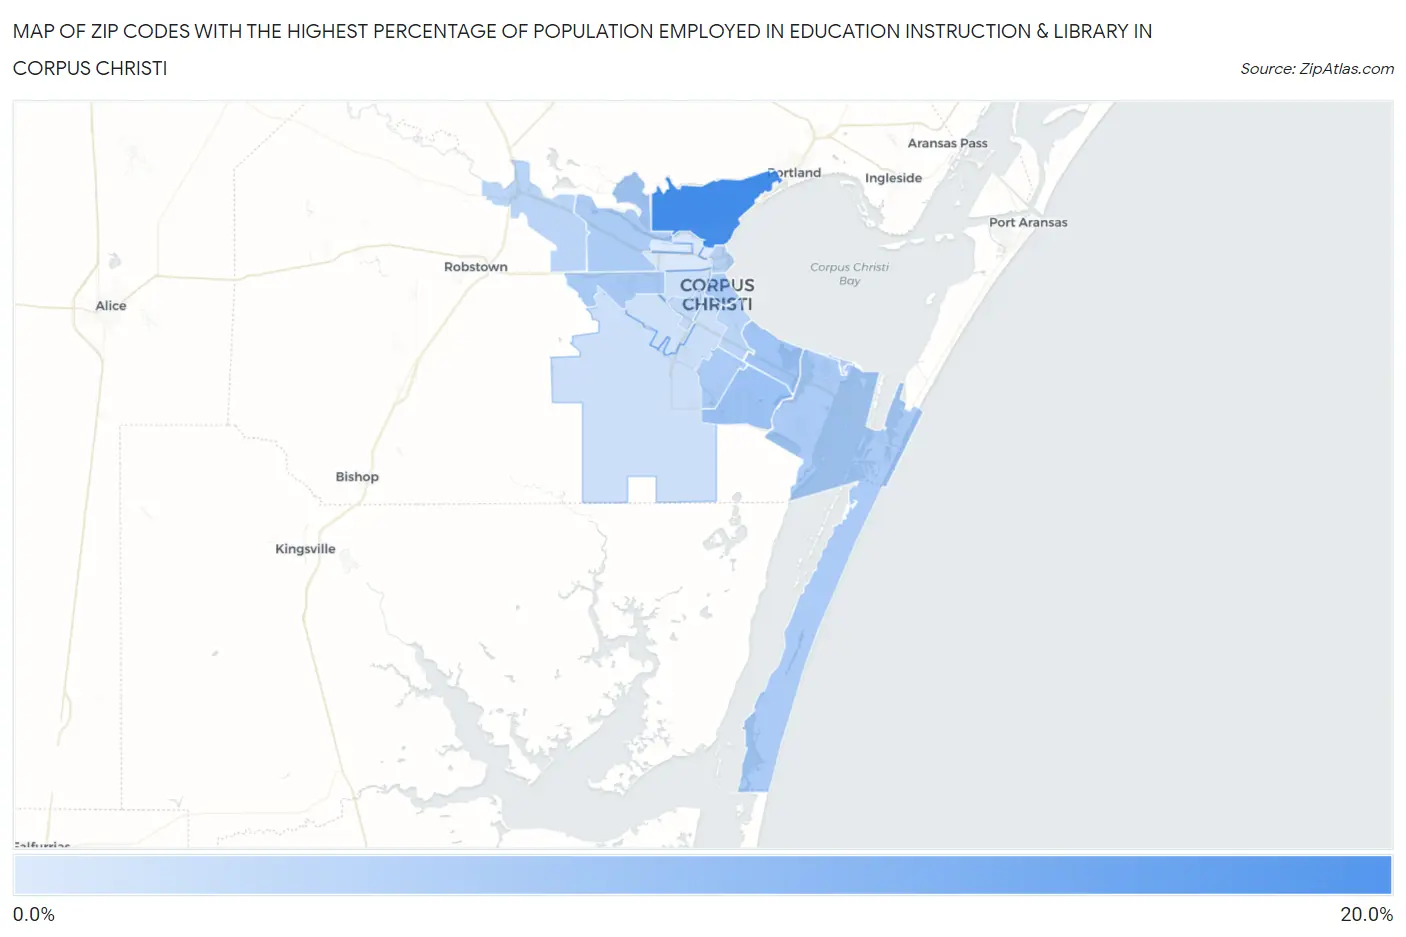
Map of Zip Codes with the Highest Percentage of Population Employed in Education Instruction & Library in Corpus Christi
1.7%
18.3%
Zip Codes with the Highest Percentage of Population Employed in Education Instruction & Library in Corpus Christi, TX
| Zip Code | % Employed | vs State | vs National | |
| 1. | 78402 | 18.3% | 6.4%(+11.9)#55 | 6.2%(+12.1)#804 |
| 2. | 78414 | 8.8% | 6.4%(+2.43)#376 | 6.2%(+2.62)#5,539 |
| 3. | 78412 | 8.1% | 6.4%(+1.76)#460 | 6.2%(+1.94)#6,876 |
| 4. | 78406 | 7.3% | 6.4%(+0.933)#605 | 6.2%(+1.12)#8,995 |
| 5. | 78418 | 7.1% | 6.4%(+0.700)#654 | 6.2%(+0.882)#9,698 |
| 6. | 78413 | 6.9% | 6.4%(+0.562)#682 | 6.2%(+0.744)#10,145 |
| 7. | 78409 | 6.8% | 6.4%(+0.415)#714 | 6.2%(+0.598)#10,642 |
| 8. | 78404 | 6.7% | 6.4%(+0.373)#724 | 6.2%(+0.555)#10,778 |
| 9. | 78419 | 6.7% | 6.4%(+0.357)#727 | 6.2%(+0.539)#10,833 |
| 10. | 78401 | 5.7% | 6.4%(-0.675)#955 | 6.2%(-0.493)#14,782 |
| 11. | 78411 | 5.3% | 6.4%(-1.08)#1,065 | 6.2%(-0.902)#16,447 |
| 12. | 78410 | 5.2% | 6.4%(-1.13)#1,081 | 6.2%(-0.948)#16,647 |
| 13. | 78416 | 4.5% | 6.4%(-1.89)#1,240 | 6.2%(-1.70)#19,807 |
| 14. | 78405 | 3.3% | 6.4%(-3.10)#1,489 | 6.2%(-2.92)#24,157 |
| 15. | 78415 | 3.3% | 6.4%(-3.11)#1,491 | 6.2%(-2.93)#24,180 |
| 16. | 78417 | 3.0% | 6.4%(-3.36)#1,517 | 6.2%(-3.18)#24,847 |
| 17. | 78408 | 1.9% | 6.4%(-4.44)#1,632 | 6.2%(-4.26)#27,056 |
| 18. | 78407 | 1.7% | 6.4%(-4.67)#1,641 | 6.2%(-4.49)#27,408 |
1
Common Questions
What are the Top 10 Zip Codes with the Highest Percentage of Population Employed in Education Instruction & Library in Corpus Christi, TX?
Top 10 Zip Codes with the Highest Percentage of Population Employed in Education Instruction & Library in Corpus Christi, TX are:
What zip code has the Highest Percentage of Population Employed in Education Instruction & Library in Corpus Christi, TX?
78402 has the Highest Percentage of Population Employed in Education Instruction & Library in Corpus Christi, TX with 18.3%.
What is the Percentage of Population Employed in Education Instruction & Library in Corpus Christi, TX?
Percentage of Population Employed in Education Instruction & Library in Corpus Christi is 6.2%.
What is the Percentage of Population Employed in Education Instruction & Library in Texas?
Percentage of Population Employed in Education Instruction & Library in Texas is 6.4%.
What is the Percentage of Population Employed in Education Instruction & Library in the United States?
Percentage of Population Employed in Education Instruction & Library in the United States is 6.2%.