Cities with the Highest Percentage of Population Employed in Farming, Fishing & Forestry in South Dakota
RELATED REPORTS & OPTIONS
Farming, Fishing & Forestry
South Dakota
Compare Cities
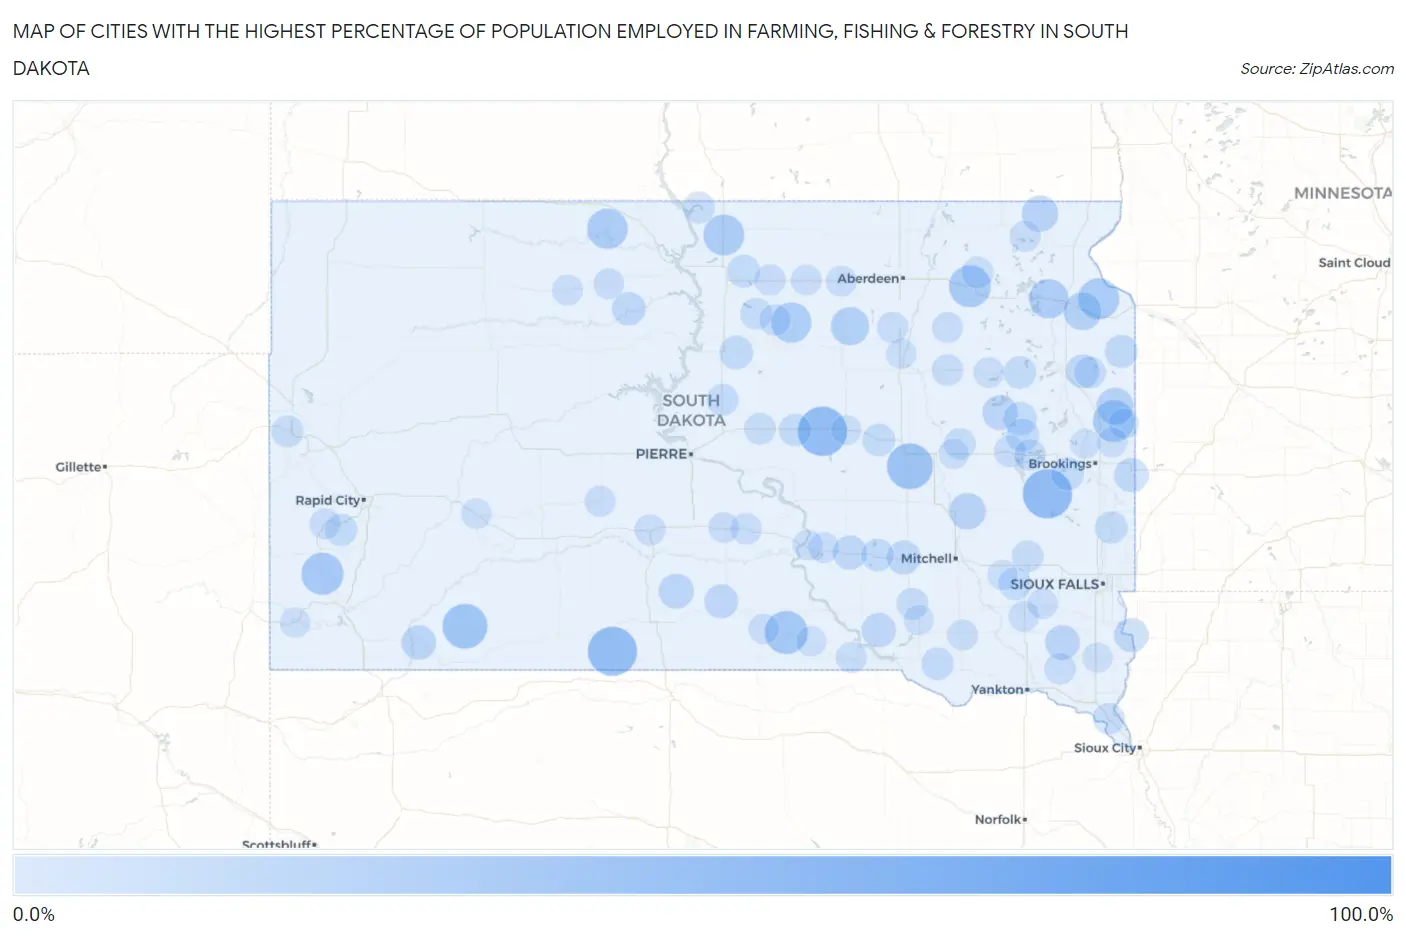
Map of Cities with the Highest Percentage of Population Employed in Farming, Fishing & Forestry in South Dakota
0.0%
100.0%
Cities with the Highest Percentage of Population Employed in Farming, Fishing & Forestry in South Dakota
| City | % Employed | vs State | vs National | |
| 1. | Brentwood Colony | 100.0% | 1.7%(+98.3)#1 | 0.61%(+99.4)#6 |
| 2. | Sunset Colony | 100.0% | 1.7%(+98.3)#2 | 0.61%(+99.4)#8 |
| 3. | Spring Creek Colony | 50.0% | 1.7%(+48.3)#3 | 0.61%(+49.4)#77 |
| 4. | Ramona | 44.8% | 1.7%(+43.1)#4 | 0.61%(+44.2)#97 |
| 5. | Ree Heights | 44.4% | 1.7%(+42.7)#5 | 0.61%(+43.8)#101 |
| 6. | Spring Creek | 44.1% | 1.7%(+42.4)#6 | 0.61%(+43.5)#103 |
| 7. | Virgil | 37.5% | 1.7%(+35.8)#7 | 0.61%(+36.9)#143 |
| 8. | Porcupine | 35.1% | 1.7%(+33.4)#8 | 0.61%(+34.5)#162 |
| 9. | Dallas | 31.1% | 1.7%(+29.4)#9 | 0.61%(+30.5)#204 |
| 10. | Pringle | 29.0% | 1.7%(+27.3)#10 | 0.61%(+28.4)#234 |
| 11. | Andover | 28.6% | 1.7%(+26.8)#11 | 0.61%(+28.0)#249 |
| 12. | Toronto | 28.1% | 1.7%(+26.3)#12 | 0.61%(+27.5)#257 |
| 13. | Corona | 27.1% | 1.7%(+25.3)#13 | 0.61%(+26.5)#275 |
| 14. | Mound City | 26.3% | 1.7%(+24.6)#14 | 0.61%(+25.7)#295 |
| 15. | Bullhead | 25.6% | 1.7%(+23.8)#15 | 0.61%(+25.0)#314 |
| 16. | Onaka | 25.0% | 1.7%(+23.3)#16 | 0.61%(+24.4)#327 |
| 17. | Ortley | 23.5% | 1.7%(+21.8)#17 | 0.61%(+22.9)#351 |
| 18. | Cresbard | 20.9% | 1.7%(+19.2)#18 | 0.61%(+20.3)#415 |
| 19. | Marvin | 20.0% | 1.7%(+18.3)#19 | 0.61%(+19.4)#448 |
| 20. | Brandt | 18.3% | 1.7%(+16.6)#20 | 0.61%(+17.7)#497 |
| 21. | Artesian | 17.3% | 1.7%(+15.6)#21 | 0.61%(+16.7)#544 |
| 22. | Veblen | 17.0% | 1.7%(+15.2)#22 | 0.61%(+16.4)#560 |
| 23. | Boulder Canyon | 15.4% | 1.7%(+13.6)#23 | 0.61%(+14.8)#627 |
| 24. | Wood | 14.3% | 1.7%(+12.5)#24 | 0.61%(+13.7)#694 |
| 25. | Willow Lake | 14.0% | 1.7%(+12.3)#25 | 0.61%(+13.4)#706 |
| 26. | Viborg | 13.4% | 1.7%(+11.6)#26 | 0.61%(+12.7)#755 |
| 27. | Oglala | 12.9% | 1.7%(+11.1)#27 | 0.61%(+12.3)#794 |
| 28. | Kimball | 12.7% | 1.7%(+11.0)#28 | 0.61%(+12.1)#805 |
| 29. | Geddes | 12.7% | 1.7%(+10.9)#29 | 0.61%(+12.1)#807 |
| 30. | Elkton | 12.6% | 1.7%(+10.8)#30 | 0.61%(+12.0)#815 |
| 31. | Fairview | 12.5% | 1.7%(+10.8)#31 | 0.61%(+11.9)#826 |
| 32. | New Witten | 12.1% | 1.7%(+10.4)#32 | 0.61%(+11.5)#859 |
| 33. | Plankinton | 11.8% | 1.7%(+10.1)#33 | 0.61%(+11.2)#881 |
| 34. | Kranzburg | 11.3% | 1.7%(+9.55)#34 | 0.61%(+10.7)#921 |
| 35. | Whitehorse | 11.3% | 1.7%(+9.55)#35 | 0.61%(+10.7)#922 |
| 36. | Gettysburg | 11.1% | 1.7%(+9.34)#36 | 0.61%(+10.5)#944 |
| 37. | Bryant | 10.9% | 1.7%(+9.11)#37 | 0.61%(+10.2)#969 |
| 38. | Erwin | 10.0% | 1.7%(+8.26)#38 | 0.61%(+9.39)#1,077 |
| 39. | Sinai | 9.6% | 1.7%(+7.90)#39 | 0.61%(+9.03)#1,125 |
| 40. | Revillo | 9.6% | 1.7%(+7.90)#40 | 0.61%(+9.03)#1,126 |
| 41. | Java | 9.5% | 1.7%(+7.78)#41 | 0.61%(+8.92)#1,143 |
| 42. | Henry | 9.4% | 1.7%(+7.63)#42 | 0.61%(+8.77)#1,171 |
| 43. | Dante | 9.2% | 1.7%(+7.49)#43 | 0.61%(+8.63)#1,191 |
| 44. | Wessington | 9.2% | 1.7%(+7.43)#44 | 0.61%(+8.57)#1,196 |
| 45. | Bridgewater | 9.1% | 1.7%(+7.40)#45 | 0.61%(+8.53)#1,201 |
| 46. | White Lake | 9.0% | 1.7%(+7.30)#46 | 0.61%(+8.43)#1,220 |
| 47. | Trent | 9.0% | 1.7%(+7.29)#47 | 0.61%(+8.43)#1,221 |
| 48. | Highmore | 8.5% | 1.7%(+6.78)#48 | 0.61%(+7.92)#1,318 |
| 49. | Keystone | 8.4% | 1.7%(+6.63)#49 | 0.61%(+7.77)#1,346 |
| 50. | Onida | 8.0% | 1.7%(+6.21)#50 | 0.61%(+7.35)#1,443 |
| 51. | North Spearfish | 7.8% | 1.7%(+6.06)#51 | 0.61%(+7.20)#1,473 |
| 52. | Pollock | 7.7% | 1.7%(+6.00)#52 | 0.61%(+7.14)#1,484 |
| 53. | Harrold | 7.5% | 1.7%(+5.80)#53 | 0.61%(+6.94)#1,538 |
| 54. | Goodwin | 7.5% | 1.7%(+5.76)#54 | 0.61%(+6.89)#1,546 |
| 55. | Hoven | 7.4% | 1.7%(+5.69)#55 | 0.61%(+6.83)#1,562 |
| 56. | De Smet | 7.4% | 1.7%(+5.66)#56 | 0.61%(+6.80)#1,566 |
| 57. | Corsica | 7.3% | 1.7%(+5.60)#57 | 0.61%(+6.74)#1,586 |
| 58. | Salem | 7.0% | 1.7%(+5.30)#58 | 0.61%(+6.44)#1,652 |
| 59. | Elk Point | 7.0% | 1.7%(+5.29)#59 | 0.61%(+6.42)#1,658 |
| 60. | Pierpont | 6.9% | 1.7%(+5.20)#60 | 0.61%(+6.34)#1,681 |
| 61. | Tolstoy | 6.9% | 1.7%(+5.15)#61 | 0.61%(+6.29)#1,697 |
| 62. | Lake Preston | 6.7% | 1.7%(+4.98)#62 | 0.61%(+6.11)#1,725 |
| 63. | Doland | 6.7% | 1.7%(+4.92)#63 | 0.61%(+6.06)#1,741 |
| 64. | Wakonda | 6.5% | 1.7%(+4.76)#64 | 0.61%(+5.90)#1,788 |
| 65. | Yale | 6.4% | 1.7%(+4.66)#65 | 0.61%(+5.79)#1,810 |
| 66. | Kennebec | 6.3% | 1.7%(+4.59)#66 | 0.61%(+5.72)#1,829 |
| 67. | Northville | 6.3% | 1.7%(+4.59)#67 | 0.61%(+5.72)#1,830 |
| 68. | Hill City | 6.2% | 1.7%(+4.42)#68 | 0.61%(+5.56)#1,868 |
| 69. | Enemy Swim | 6.1% | 1.7%(+4.38)#69 | 0.61%(+5.52)#1,883 |
| 70. | Bowdle | 6.1% | 1.7%(+4.32)#70 | 0.61%(+5.46)#1,906 |
| 71. | Lake City | 6.1% | 1.7%(+4.32)#71 | 0.61%(+5.46)#1,910 |
| 72. | Conde | 6.0% | 1.7%(+4.26)#72 | 0.61%(+5.39)#1,924 |
| 73. | Murdo | 6.0% | 1.7%(+4.25)#73 | 0.61%(+5.39)#1,925 |
| 74. | Wakpala | 5.7% | 1.7%(+3.97)#74 | 0.61%(+5.11)#2,014 |
| 75. | Midland | 5.6% | 1.7%(+3.89)#75 | 0.61%(+5.03)#2,042 |
| 76. | Bonesteel | 5.6% | 1.7%(+3.87)#76 | 0.61%(+5.01)#2,048 |
| 77. | Timber Lake | 5.6% | 1.7%(+3.83)#77 | 0.61%(+4.97)#2,061 |
| 78. | Tripp | 5.6% | 1.7%(+3.81)#78 | 0.61%(+4.95)#2,069 |
| 79. | Pukwana | 5.5% | 1.7%(+3.75)#79 | 0.61%(+4.89)#2,098 |
| 80. | Isabel | 5.4% | 1.7%(+3.69)#80 | 0.61%(+4.83)#2,133 |
| 81. | Ipswich | 5.4% | 1.7%(+3.66)#81 | 0.61%(+4.80)#2,150 |
| 82. | Clark | 5.3% | 1.7%(+3.52)#82 | 0.61%(+4.66)#2,197 |
| 83. | Presho | 5.1% | 1.7%(+3.36)#83 | 0.61%(+4.50)#2,262 |
| 84. | Freeman | 4.9% | 1.7%(+3.14)#84 | 0.61%(+4.28)#2,349 |
| 85. | Roscoe | 4.9% | 1.7%(+3.11)#85 | 0.61%(+4.25)#2,368 |
| 86. | Colome | 4.8% | 1.7%(+3.05)#86 | 0.61%(+4.18)#2,399 |
| 87. | Marion | 4.7% | 1.7%(+3.00)#87 | 0.61%(+4.14)#2,425 |
| 88. | Wall | 4.7% | 1.7%(+2.94)#88 | 0.61%(+4.08)#2,449 |
| 89. | Cavour | 4.6% | 1.7%(+2.89)#89 | 0.61%(+4.02)#2,473 |
| 90. | Ashton | 4.5% | 1.7%(+2.75)#90 | 0.61%(+3.89)#2,547 |
| 91. | Astoria | 4.4% | 1.7%(+2.70)#91 | 0.61%(+3.84)#2,573 |
| 92. | Chamberlain | 4.4% | 1.7%(+2.67)#92 | 0.61%(+3.81)#2,585 |
| 93. | Emery | 4.4% | 1.7%(+2.62)#93 | 0.61%(+3.76)#2,608 |
| 94. | Armour | 4.3% | 1.7%(+2.59)#94 | 0.61%(+3.73)#2,633 |
| 95. | Edgemont | 4.3% | 1.7%(+2.56)#95 | 0.61%(+3.70)#2,646 |
| 96. | Miller | 4.2% | 1.7%(+2.43)#96 | 0.61%(+3.57)#2,716 |
| 97. | Beresford | 4.1% | 1.7%(+2.34)#97 | 0.61%(+3.48)#2,772 |
| 98. | White | 4.1% | 1.7%(+2.32)#98 | 0.61%(+3.46)#2,781 |
| 99. | Burke | 4.1% | 1.7%(+2.32)#99 | 0.61%(+3.45)#2,788 |
| 100. | Bruce | 3.9% | 1.7%(+2.19)#100 | 0.61%(+3.33)#2,873 |
Common Questions
What are the Top 10 Cities with the Highest Percentage of Population Employed in Farming, Fishing & Forestry in South Dakota?
Top 10 Cities with the Highest Percentage of Population Employed in Farming, Fishing & Forestry in South Dakota are:
#1
44.8%
#2
44.4%
#3
44.1%
#4
37.5%
#5
35.1%
#6
31.1%
#7
29.0%
#8
28.6%
#9
28.1%
#10
27.1%
What city has the Highest Percentage of Population Employed in Farming, Fishing & Forestry in South Dakota?
Ramona has the Highest Percentage of Population Employed in Farming, Fishing & Forestry in South Dakota with 44.8%.
What is the Percentage of Population Employed in Farming, Fishing & Forestry in the State of South Dakota?
Percentage of Population Employed in Farming, Fishing & Forestry in South Dakota is 1.7%.
What is the Percentage of Population Employed in Farming, Fishing & Forestry in the United States?
Percentage of Population Employed in Farming, Fishing & Forestry in the United States is 0.61%.