Gettysburg, SD Map & Demographics
Gettysburg Map
Gettysburg Overview
$31,629
PER CAPITA INCOME
$87,969
AVG FAMILY INCOME
$66,094
AVG HOUSEHOLD INCOME
46.8%
WAGE / INCOME GAP [ % ]
53.2¢/ $1
WAGE / INCOME GAP [ $ ]
0.38
INEQUALITY / GINI INDEX
1,440
TOTAL POPULATION
676
MALE POPULATION
764
FEMALE POPULATION
88.48
MALES / 100 FEMALES
113.02
FEMALES / 100 MALES
43.3
MEDIAN AGE
3.3
AVG FAMILY SIZE
2.5
AVG HOUSEHOLD SIZE
760
LABOR FORCE [ PEOPLE ]
66.7%
PERCENT IN LABOR FORCE
2.6%
UNEMPLOYMENT RATE
Gettysburg Zip Codes
Gettysburg Area Codes
Income in Gettysburg
Income Overview in Gettysburg
Per Capita Income in Gettysburg is $31,629, while median incomes of families and households are $87,969 and $66,094 respectively.
| Characteristic | Number | Measure |
| Per Capita Income | 1,440 | $31,629 |
| Median Family Income | 345 | $87,969 |
| Mean Family Income | 345 | $93,206 |
| Median Household Income | 568 | $66,094 |
| Mean Household Income | 568 | $77,980 |
| Income Deficit | 345 | $0 |
| Wage / Income Gap (%) | 1,440 | 46.83% |
| Wage / Income Gap ($) | 1,440 | 53.17¢ per $1 |
| Gini / Inequality Index | 1,440 | 0.38 |
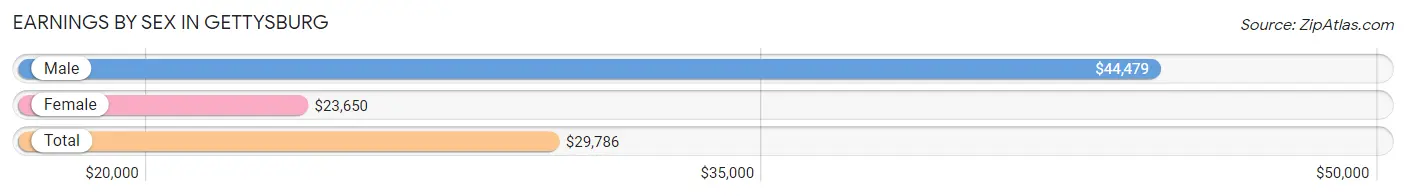
Earnings by Sex in Gettysburg
Average Earnings in Gettysburg are $29,786, $44,479 for men and $23,650 for women, a difference of 46.8%.
| Sex | Number | Average Earnings |
| Male | 420 (51.8%) | $44,479 |
| Female | 390 (48.1%) | $23,650 |
| Total | 810 (100.0%) | $29,786 |
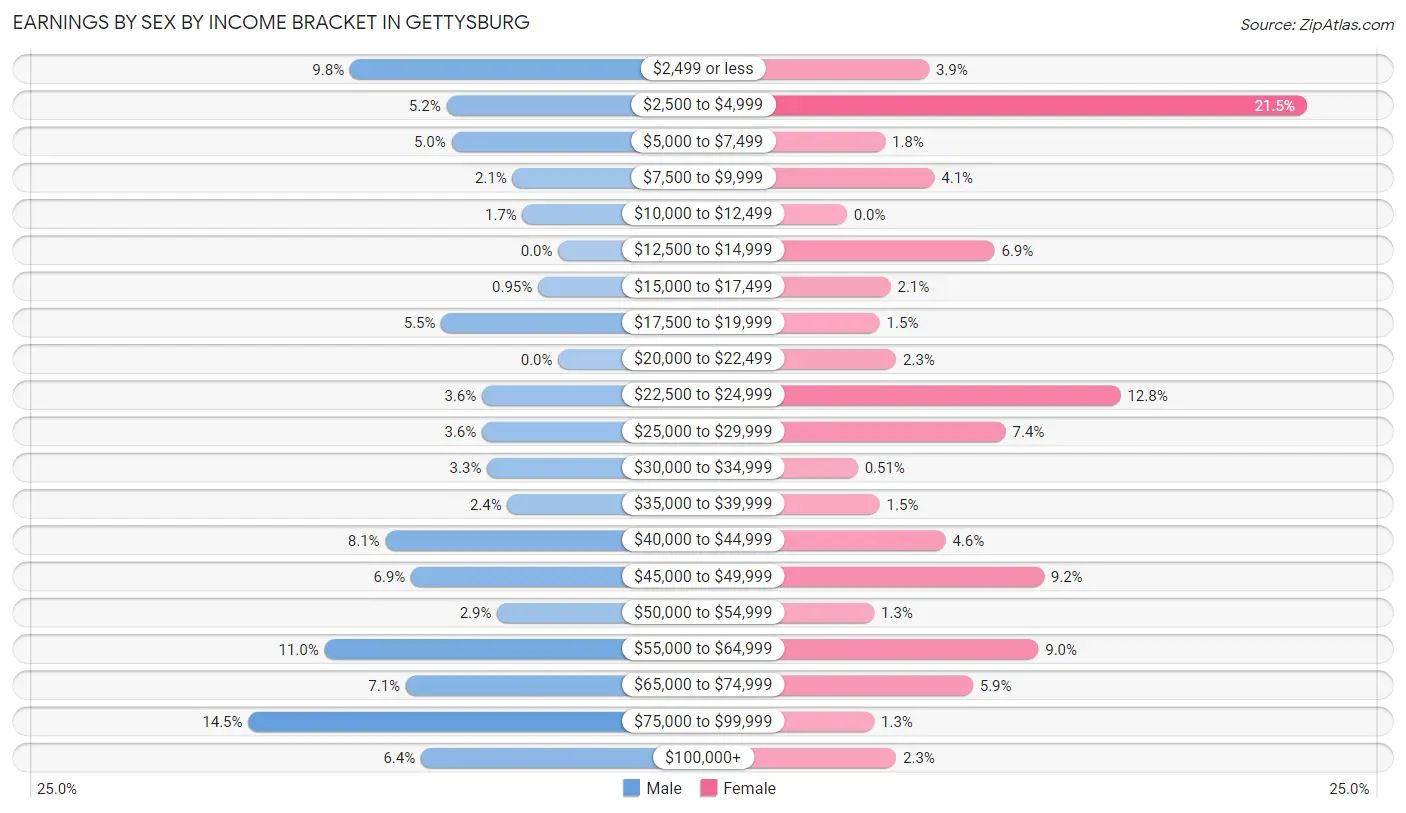
Earnings by Sex by Income Bracket in Gettysburg
The most common earnings brackets in Gettysburg are $75,000 to $99,999 for men (61 | 14.5%) and $2,500 to $4,999 for women (84 | 21.5%).
| Income | Male | Female |
| $2,499 or less | 41 (9.8%) | 15 (3.8%) |
| $2,500 to $4,999 | 22 (5.2%) | 84 (21.5%) |
| $5,000 to $7,499 | 21 (5.0%) | 7 (1.8%) |
| $7,500 to $9,999 | 9 (2.1%) | 16 (4.1%) |
| $10,000 to $12,499 | 7 (1.7%) | 0 (0.0%) |
| $12,500 to $14,999 | 0 (0.0%) | 27 (6.9%) |
| $15,000 to $17,499 | 4 (0.9%) | 8 (2.1%) |
| $17,500 to $19,999 | 23 (5.5%) | 6 (1.5%) |
| $20,000 to $22,499 | 0 (0.0%) | 9 (2.3%) |
| $22,500 to $24,999 | 15 (3.6%) | 50 (12.8%) |
| $25,000 to $29,999 | 15 (3.6%) | 29 (7.4%) |
| $30,000 to $34,999 | 14 (3.3%) | 2 (0.5%) |
| $35,000 to $39,999 | 10 (2.4%) | 6 (1.5%) |
| $40,000 to $44,999 | 34 (8.1%) | 18 (4.6%) |
| $45,000 to $49,999 | 29 (6.9%) | 36 (9.2%) |
| $50,000 to $54,999 | 12 (2.9%) | 5 (1.3%) |
| $55,000 to $64,999 | 46 (11.0%) | 35 (9.0%) |
| $65,000 to $74,999 | 30 (7.1%) | 23 (5.9%) |
| $75,000 to $99,999 | 61 (14.5%) | 5 (1.3%) |
| $100,000+ | 27 (6.4%) | 9 (2.3%) |
| Total | 420 (100.0%) | 390 (100.0%) |
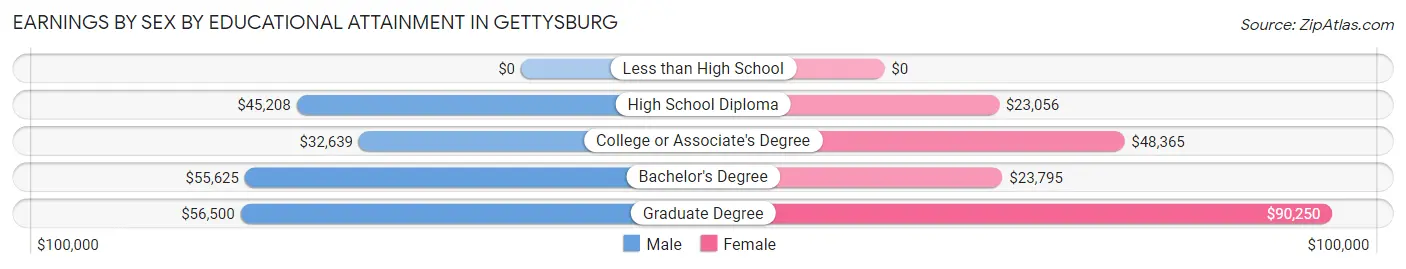
Earnings by Sex by Educational Attainment in Gettysburg
Average earnings in Gettysburg are $47,222 for men and $24,925 for women, a difference of 47.2%. Men with an educational attainment of graduate degree enjoy the highest average annual earnings of $56,500, while those with college or associate's degree education earn the least with $32,639. Women with an educational attainment of graduate degree earn the most with the average annual earnings of $90,250, while those with high school diploma education have the smallest earnings of $23,056.
| Educational Attainment | Male Income | Female Income |
| Less than High School | - | - |
| High School Diploma | $45,208 | $23,056 |
| College or Associate's Degree | $32,639 | $48,365 |
| Bachelor's Degree | $55,625 | $23,795 |
| Graduate Degree | $56,500 | $90,250 |
| Total | $47,222 | $24,925 |
Family Income in Gettysburg
Family Income Brackets in Gettysburg
According to the Gettysburg family income data, there are 75 families falling into the $100,000 to $149,999 income range, which is the most common income bracket and makes up 21.7% of all families.
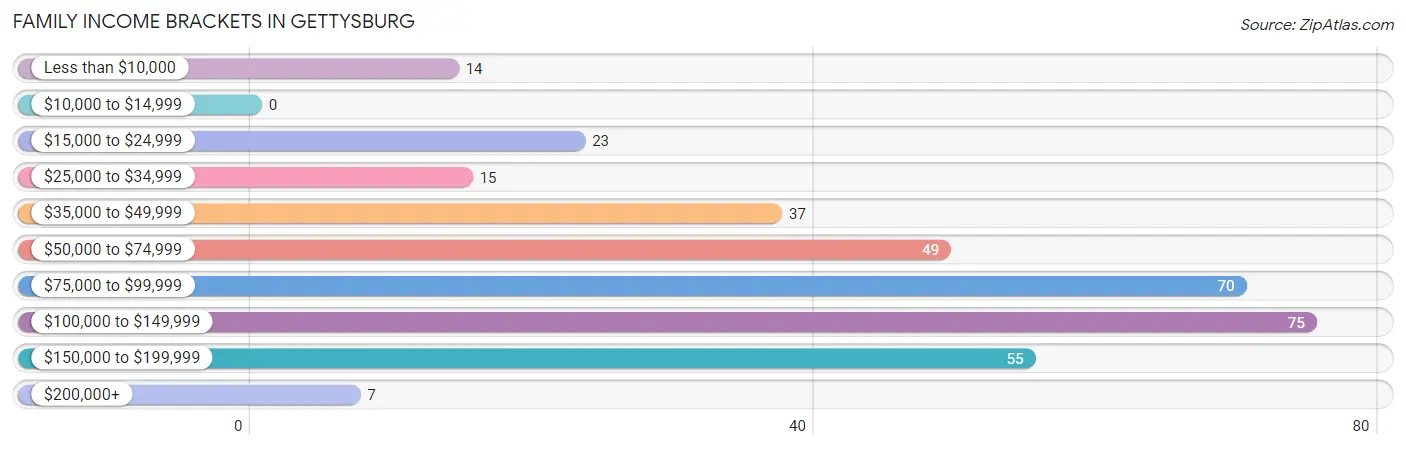
| Income Bracket | # Families | % Families |
| Less than $10,000 | 14 | 4.1% |
| $10,000 to $14,999 | 0 | 0.0% |
| $15,000 to $24,999 | 23 | 6.7% |
| $25,000 to $34,999 | 15 | 4.3% |
| $35,000 to $49,999 | 37 | 10.7% |
| $50,000 to $74,999 | 49 | 14.2% |
| $75,000 to $99,999 | 70 | 20.3% |
| $100,000 to $149,999 | 75 | 21.7% |
| $150,000 to $199,999 | 55 | 15.9% |
| $200,000+ | 7 | 2.0% |
Family Income by Famaliy Size in Gettysburg
4-person families (82 | 23.8%) account for the highest median family income in Gettysburg with $118,125 per family, while 2-person families (195 | 56.5%) have the highest median income of $39,258 per family member.
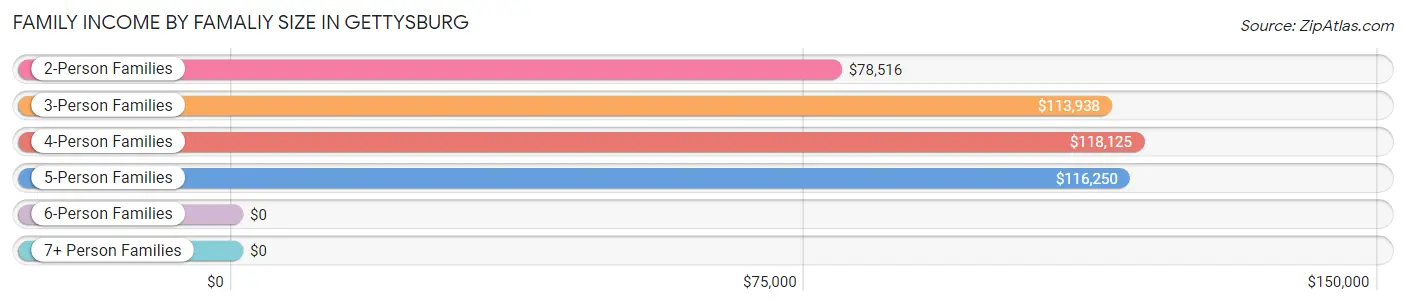
| Income Bracket | # Families | Median Income |
| 2-Person Families | 195 (56.5%) | $78,516 |
| 3-Person Families | 45 (13.0%) | $113,938 |
| 4-Person Families | 82 (23.8%) | $118,125 |
| 5-Person Families | 16 (4.6%) | $116,250 |
| 6-Person Families | 2 (0.6%) | $0 |
| 7+ Person Families | 5 (1.5%) | $0 |
| Total | 345 (100.0%) | $87,969 |
Family Income by Number of Earners in Gettysburg
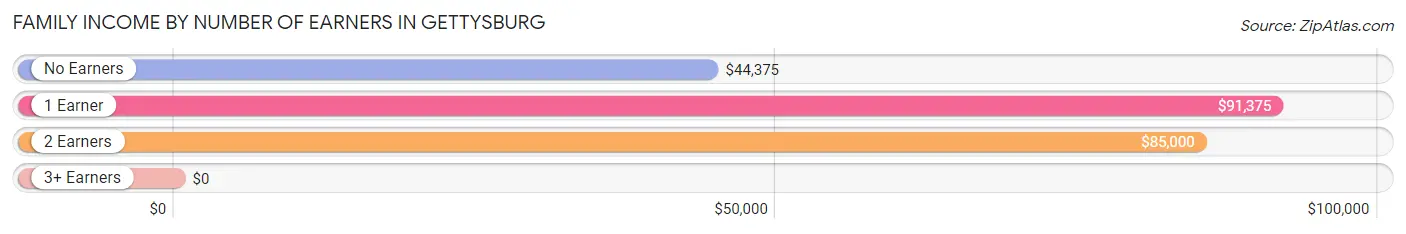
| Number of Earners | # Families | Median Income |
| No Earners | 32 (9.3%) | $44,375 |
| 1 Earner | 99 (28.7%) | $91,375 |
| 2 Earners | 194 (56.2%) | $85,000 |
| 3+ Earners | 20 (5.8%) | $0 |
| Total | 345 (100.0%) | $87,969 |
Household Income in Gettysburg
Household Income Brackets in Gettysburg
With 118 households falling in the category, the $35,000 to $49,999 income range is the most frequent in Gettysburg, accounting for 20.8% of all households. In contrast, only 11 households (1.9%) fall into the $200,000+ income bracket, making it the least populous group.
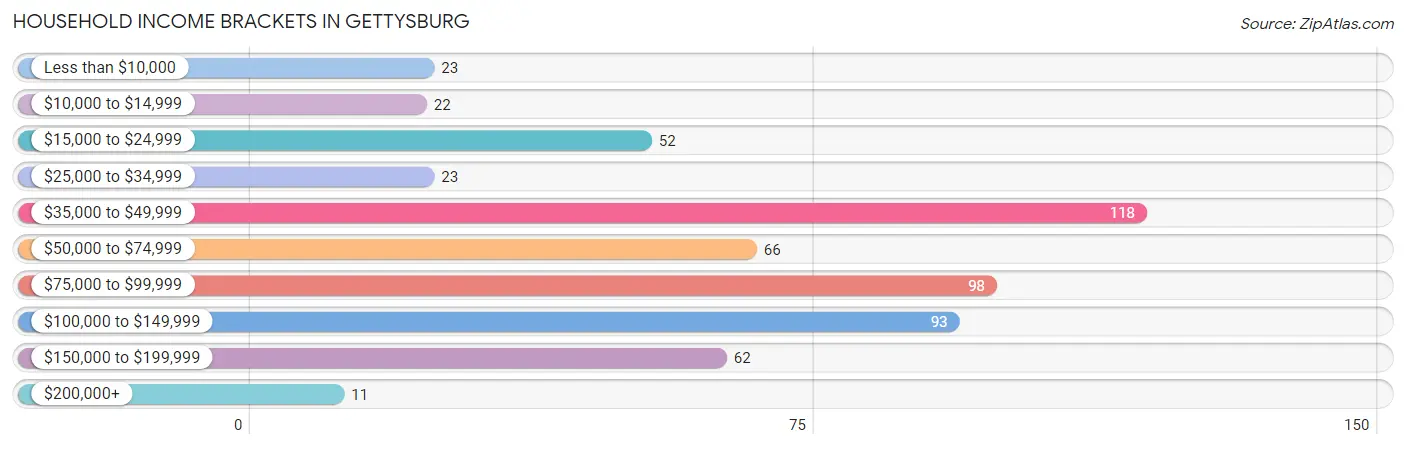
| Income Bracket | # Households | % Households |
| Less than $10,000 | 23 | 4.0% |
| $10,000 to $14,999 | 22 | 3.9% |
| $15,000 to $24,999 | 52 | 9.2% |
| $25,000 to $34,999 | 23 | 4.0% |
| $35,000 to $49,999 | 118 | 20.8% |
| $50,000 to $74,999 | 66 | 11.6% |
| $75,000 to $99,999 | 98 | 17.3% |
| $100,000 to $149,999 | 93 | 16.4% |
| $150,000 to $199,999 | 62 | 10.9% |
| $200,000+ | 11 | 1.9% |
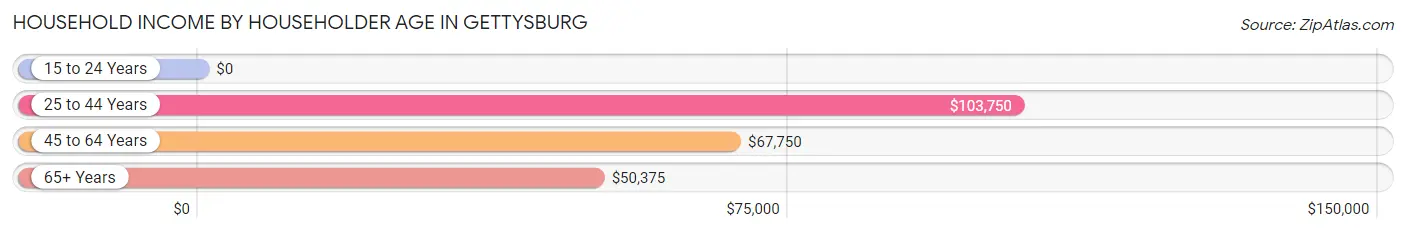
Household Income by Householder Age in Gettysburg
The median household income in Gettysburg is $66,094, with the highest median household income of $103,750 found in the 25 to 44 years age bracket for the primary householder. A total of 124 households (21.8%) fall into this category. Meanwhile, the 15 to 24 years age bracket for the primary householder has the lowest median household income of $0, with 10 households (1.8%) in this group.
| Income Bracket | # Households | Median Income |
| 15 to 24 Years | 10 (1.8%) | $0 |
| 25 to 44 Years | 124 (21.8%) | $103,750 |
| 45 to 64 Years | 211 (37.1%) | $67,750 |
| 65+ Years | 223 (39.3%) | $50,375 |
| Total | 568 (100.0%) | $66,094 |
Poverty in Gettysburg
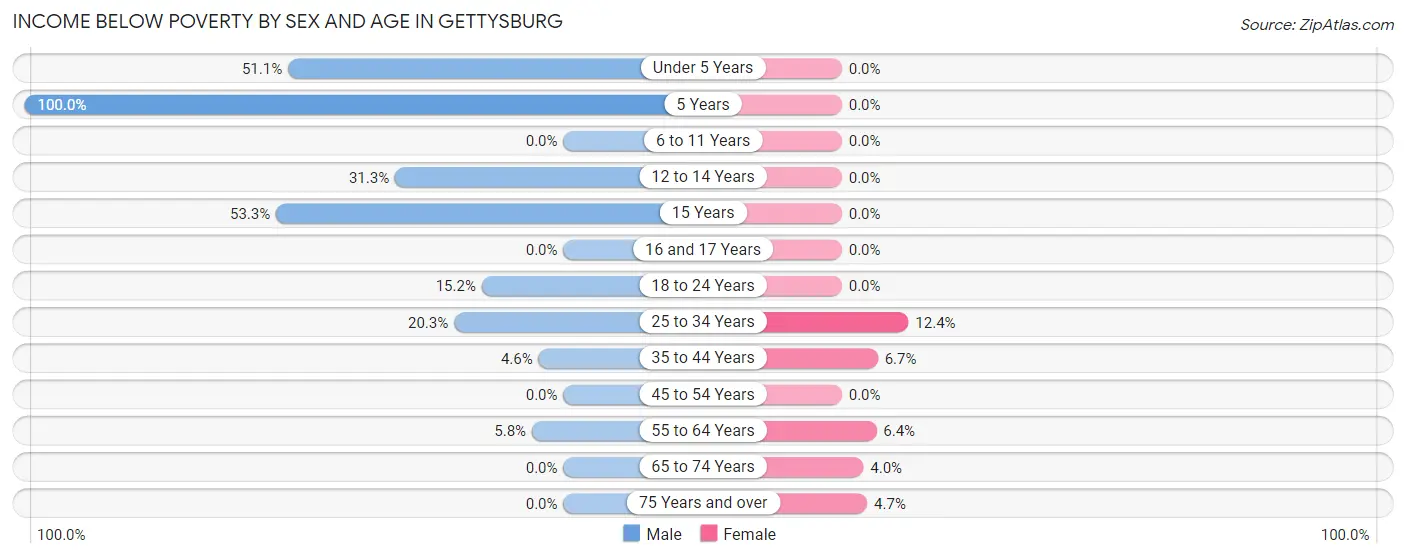
Income Below Poverty by Sex and Age in Gettysburg
With 13.4% poverty level for males and 3.8% for females among the residents of Gettysburg, 5 year old males and 25 to 34 year old females are the most vulnerable to poverty, with 23 males (100.0%) and 11 females (12.4%) in their respective age groups living below the poverty level.
| Age Bracket | Male | Female |
| Under 5 Years | 23 (51.1%) | 0 (0.0%) |
| 5 Years | 23 (100.0%) | 0 (0.0%) |
| 6 to 11 Years | 0 (0.0%) | 0 (0.0%) |
| 12 to 14 Years | 5 (31.2%) | 0 (0.0%) |
| 15 Years | 8 (53.3%) | 0 (0.0%) |
| 16 and 17 Years | 0 (0.0%) | 0 (0.0%) |
| 18 to 24 Years | 5 (15.1%) | 0 (0.0%) |
| 25 to 34 Years | 14 (20.3%) | 11 (12.4%) |
| 35 to 44 Years | 4 (4.6%) | 4 (6.7%) |
| 45 to 54 Years | 0 (0.0%) | 0 (0.0%) |
| 55 to 64 Years | 6 (5.8%) | 5 (6.4%) |
| 65 to 74 Years | 0 (0.0%) | 4 (4.0%) |
| 75 Years and over | 0 (0.0%) | 4 (4.7%) |
| Total | 88 (13.4%) | 28 (3.8%) |
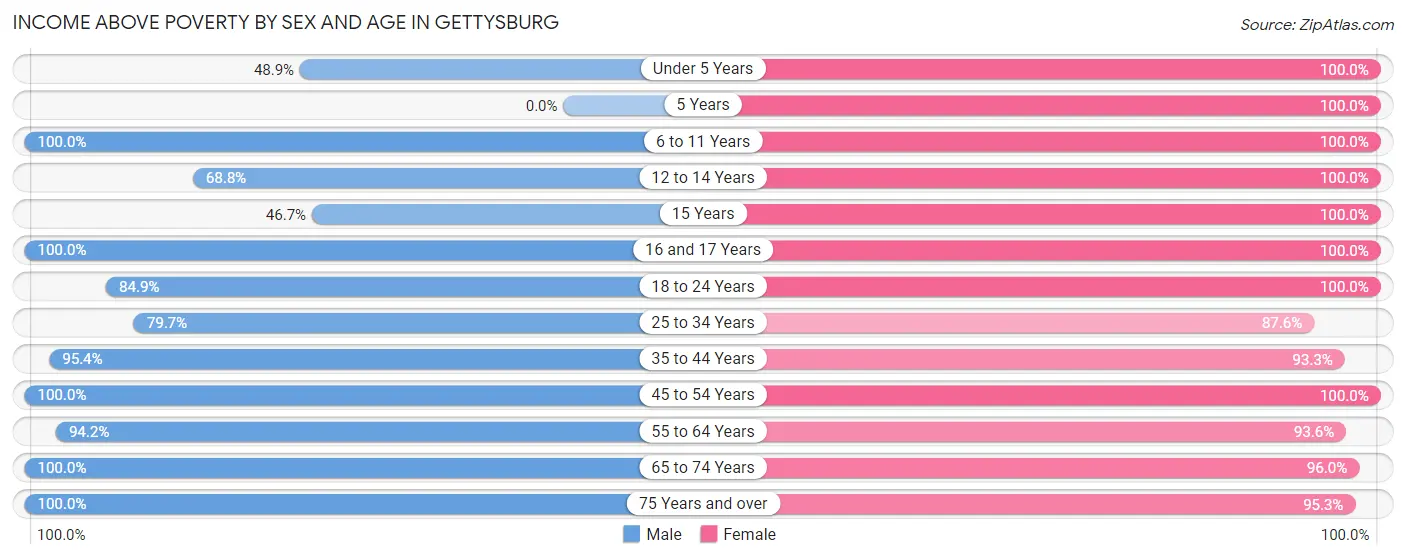
Income Above Poverty by Sex and Age in Gettysburg
According to the poverty statistics in Gettysburg, males aged 6 to 11 years and females aged under 5 years are the age groups that are most secure financially, with 100.0% of males and 100.0% of females in these age groups living above the poverty line.
| Age Bracket | Male | Female |
| Under 5 Years | 22 (48.9%) | 32 (100.0%) |
| 5 Years | 0 (0.0%) | 12 (100.0%) |
| 6 to 11 Years | 52 (100.0%) | 43 (100.0%) |
| 12 to 14 Years | 11 (68.8%) | 28 (100.0%) |
| 15 Years | 7 (46.7%) | 35 (100.0%) |
| 16 and 17 Years | 20 (100.0%) | 21 (100.0%) |
| 18 to 24 Years | 28 (84.9%) | 65 (100.0%) |
| 25 to 34 Years | 55 (79.7%) | 78 (87.6%) |
| 35 to 44 Years | 83 (95.4%) | 56 (93.3%) |
| 45 to 54 Years | 76 (100.0%) | 91 (100.0%) |
| 55 to 64 Years | 97 (94.2%) | 73 (93.6%) |
| 65 to 74 Years | 59 (100.0%) | 96 (96.0%) |
| 75 Years and over | 58 (100.0%) | 81 (95.3%) |
| Total | 568 (86.6%) | 711 (96.2%) |
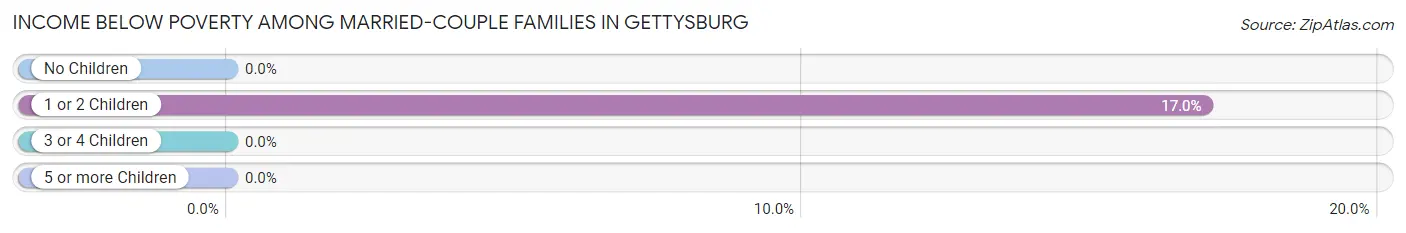
Income Below Poverty Among Married-Couple Families in Gettysburg
The poverty statistics for married-couple families in Gettysburg show that 5.8% or 18 of the total 312 families live below the poverty line. Families with 1 or 2 children have the highest poverty rate of 17.0%, comprising of 18 families. On the other hand, families with no children have the lowest poverty rate of 0.0%, which includes 0 families.
| Children | Above Poverty | Below Poverty |
| No Children | 186 (100.0%) | 0 (0.0%) |
| 1 or 2 Children | 88 (83.0%) | 18 (17.0%) |
| 3 or 4 Children | 15 (100.0%) | 0 (0.0%) |
| 5 or more Children | 5 (100.0%) | 0 (0.0%) |
| Total | 294 (94.2%) | 18 (5.8%) |
Income Below Poverty Among Single-Parent Households in Gettysburg
| Children | Single Father | Single Mother |
| No Children | 0 (0.0%) | 0 (0.0%) |
| 1 or 2 Children | 0 (0.0%) | 0 (0.0%) |
| 3 or 4 Children | 0 (0.0%) | 0 (0.0%) |
| 5 or more Children | 0 (0.0%) | 0 (0.0%) |
| Total | 0 (0.0%) | 0 (0.0%) |
Income Below Poverty Among Married-Couple vs Single-Parent Households in Gettysburg
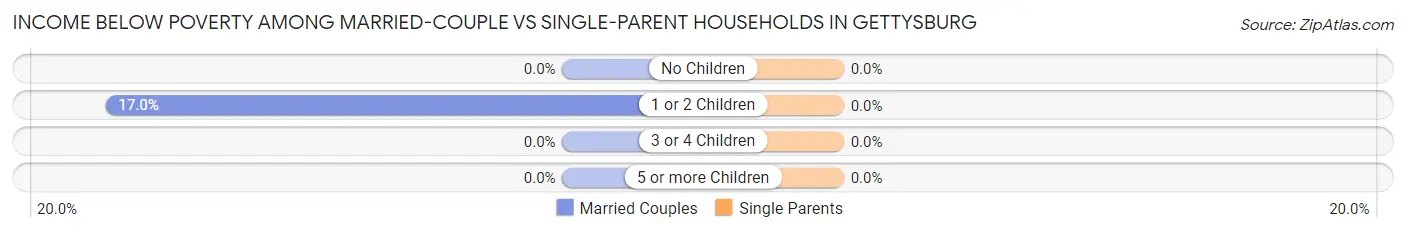
| Children | Married-Couple Families | Single-Parent Households |
| No Children | 0 (0.0%) | 0 (0.0%) |
| 1 or 2 Children | 18 (17.0%) | 0 (0.0%) |
| 3 or 4 Children | 0 (0.0%) | 0 (0.0%) |
| 5 or more Children | 0 (0.0%) | 0 (0.0%) |
| Total | 18 (5.8%) | 0 (0.0%) |
Race in Gettysburg
The most populous races in Gettysburg are White / Caucasian (1,233 | 85.6%), Two or more Races (104 | 7.2%), and Black / African American (39 | 2.7%).
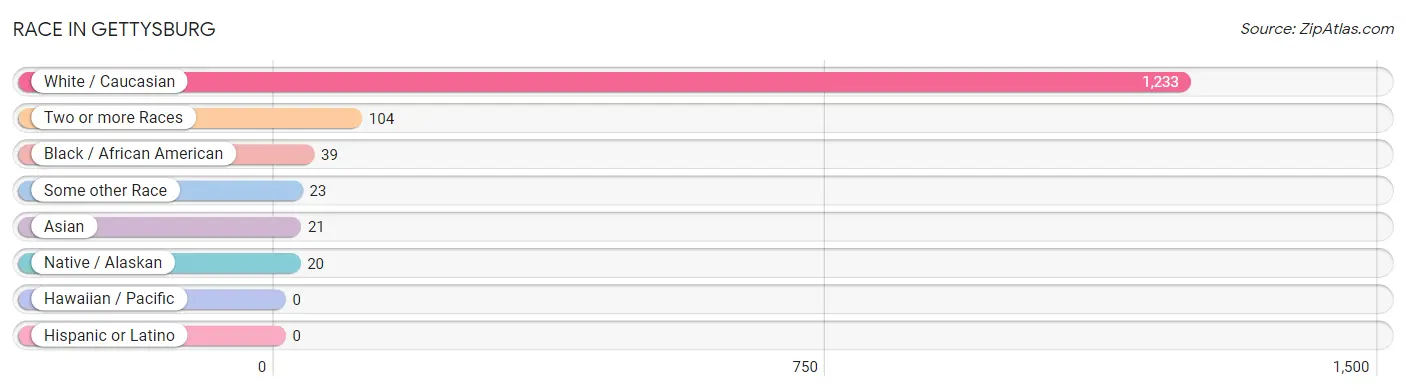
| Race | # Population | % Population |
| Asian | 21 | 1.5% |
| Black / African American | 39 | 2.7% |
| Hawaiian / Pacific | 0 | 0.0% |
| Hispanic or Latino | 0 | 0.0% |
| Native / Alaskan | 20 | 1.4% |
| White / Caucasian | 1,233 | 85.6% |
| Two or more Races | 104 | 7.2% |
| Some other Race | 23 | 1.6% |
| Total | 1,440 | 100.0% |
Ancestry in Gettysburg
The most populous ancestries reported in Gettysburg are German (660 | 45.8%), Norwegian (121 | 8.4%), American (119 | 8.3%), English (92 | 6.4%), and Irish (81 | 5.6%), together accounting for 74.5% of all Gettysburg residents.
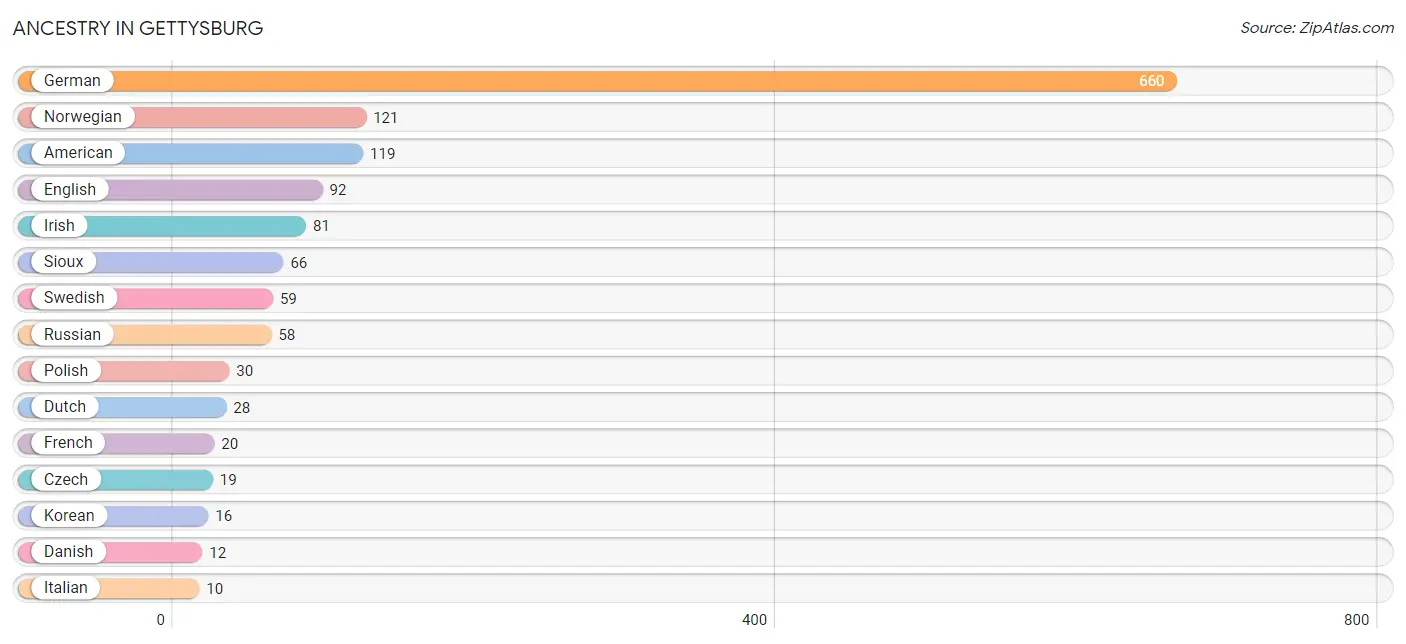
| Ancestry | # Population | % Population |
| American | 119 | 8.3% |
| Burmese | 5 | 0.4% |
| Cherokee | 4 | 0.3% |
| Cheyenne | 6 | 0.4% |
| Czech | 19 | 1.3% |
| Danish | 12 | 0.8% |
| Dutch | 28 | 1.9% |
| English | 92 | 6.4% |
| French | 20 | 1.4% |
| German | 660 | 45.8% |
| Greek | 6 | 0.4% |
| Irish | 81 | 5.6% |
| Italian | 10 | 0.7% |
| Korean | 16 | 1.1% |
| Northern European | 6 | 0.4% |
| Norwegian | 121 | 8.4% |
| Polish | 30 | 2.1% |
| Russian | 58 | 4.0% |
| Scotch-Irish | 3 | 0.2% |
| Scottish | 3 | 0.2% |
| Sioux | 66 | 4.6% |
| Swedish | 59 | 4.1% |
| Welsh | 6 | 0.4% | View All 23 Rows |
Immigrants in Gettysburg
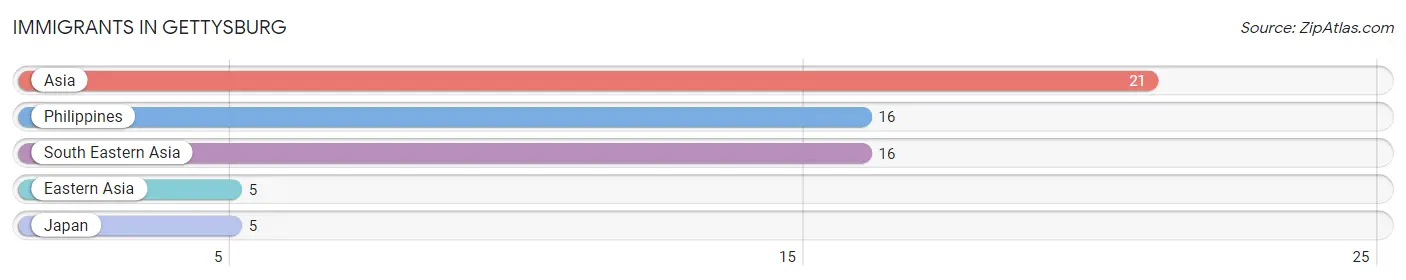
The most numerous immigrant groups reported in Gettysburg came from Asia (21 | 1.5%), Philippines (16 | 1.1%), South Eastern Asia (16 | 1.1%), Eastern Asia (5 | 0.4%), and Japan (5 | 0.4%), together accounting for 4.4% of all Gettysburg residents.
| Immigration Origin | # Population | % Population |
| Asia | 21 | 1.5% |
| Eastern Asia | 5 | 0.4% |
| Japan | 5 | 0.4% |
| Philippines | 16 | 1.1% |
| South Eastern Asia | 16 | 1.1% | View All 5 Rows |
Sex and Age in Gettysburg
Sex and Age in Gettysburg
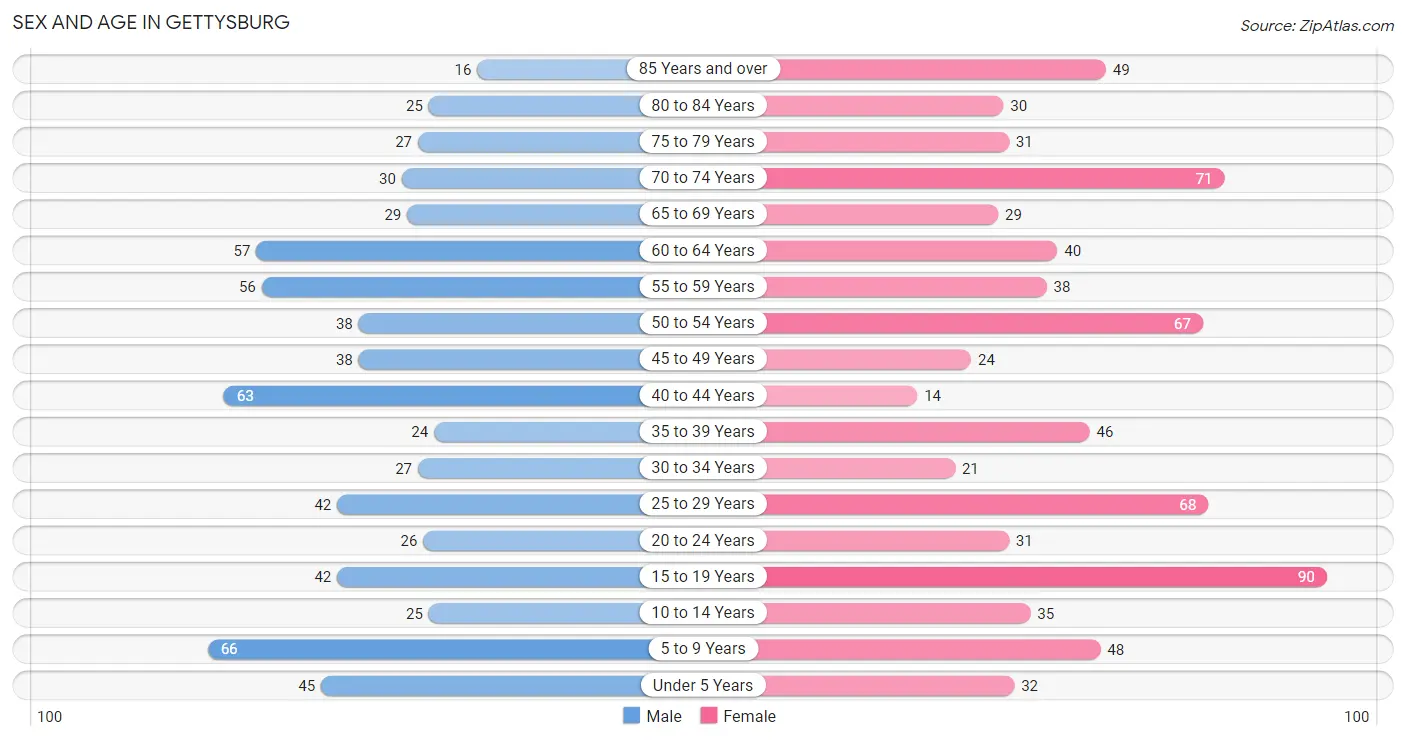
The most populous age groups in Gettysburg are 5 to 9 Years (66 | 9.8%) for men and 15 to 19 Years (90 | 11.8%) for women.
| Age Bracket | Male | Female |
| Under 5 Years | 45 (6.7%) | 32 (4.2%) |
| 5 to 9 Years | 66 (9.8%) | 48 (6.3%) |
| 10 to 14 Years | 25 (3.7%) | 35 (4.6%) |
| 15 to 19 Years | 42 (6.2%) | 90 (11.8%) |
| 20 to 24 Years | 26 (3.8%) | 31 (4.1%) |
| 25 to 29 Years | 42 (6.2%) | 68 (8.9%) |
| 30 to 34 Years | 27 (4.0%) | 21 (2.8%) |
| 35 to 39 Years | 24 (3.5%) | 46 (6.0%) |
| 40 to 44 Years | 63 (9.3%) | 14 (1.8%) |
| 45 to 49 Years | 38 (5.6%) | 24 (3.1%) |
| 50 to 54 Years | 38 (5.6%) | 67 (8.8%) |
| 55 to 59 Years | 56 (8.3%) | 38 (5.0%) |
| 60 to 64 Years | 57 (8.4%) | 40 (5.2%) |
| 65 to 69 Years | 29 (4.3%) | 29 (3.8%) |
| 70 to 74 Years | 30 (4.4%) | 71 (9.3%) |
| 75 to 79 Years | 27 (4.0%) | 31 (4.1%) |
| 80 to 84 Years | 25 (3.7%) | 30 (3.9%) |
| 85 Years and over | 16 (2.4%) | 49 (6.4%) |
| Total | 676 (100.0%) | 764 (100.0%) |
Families and Households in Gettysburg
Median Family Size in Gettysburg
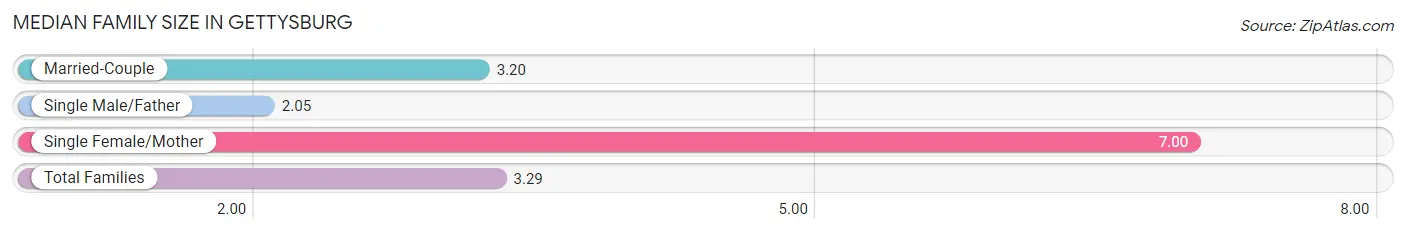
The median family size in Gettysburg is 3.29 persons per family, with single female/mother families (14 | 4.1%) accounting for the largest median family size of 7 persons per family. On the other hand, single male/father families (19 | 5.5%) represent the smallest median family size with 2.05 persons per family.
| Family Type | # Families | Family Size |
| Married-Couple | 312 (90.4%) | 3.20 |
| Single Male/Father | 19 (5.5%) | 2.05 |
| Single Female/Mother | 14 (4.1%) | 7.00 |
| Total Families | 345 (100.0%) | 3.29 |
Median Household Size in Gettysburg
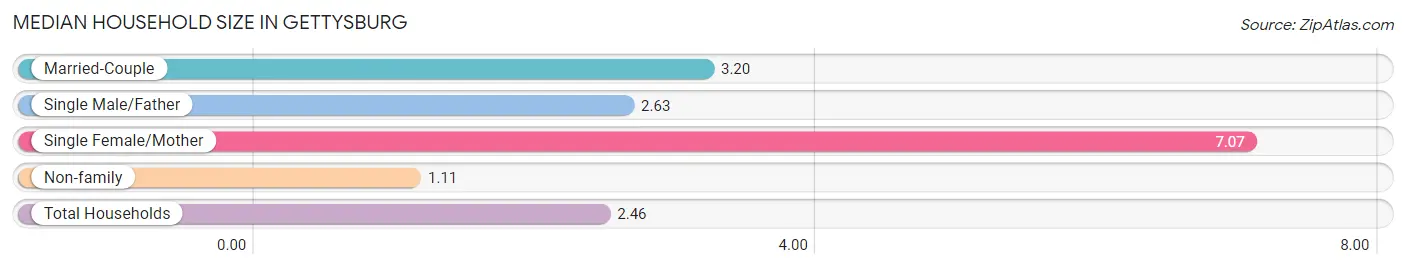
The median household size in Gettysburg is 2.46 persons per household, with single female/mother households (14 | 2.5%) accounting for the largest median household size of 7.07 persons per household. non-family households (223 | 39.3%) represent the smallest median household size with 1.11 persons per household.
| Household Type | # Households | Household Size |
| Married-Couple | 312 (54.9%) | 3.20 |
| Single Male/Father | 19 (3.4%) | 2.63 |
| Single Female/Mother | 14 (2.5%) | 7.07 |
| Non-family | 223 (39.3%) | 1.11 |
| Total Households | 568 (100.0%) | 2.46 |
Household Size by Marriage Status in Gettysburg
Out of a total of 568 households in Gettysburg, 345 (60.7%) are family households, while 223 (39.3%) are nonfamily households. The most numerous type of family households are 2-person households, comprising 180, and the most common type of nonfamily households are 1-person households, comprising 207.
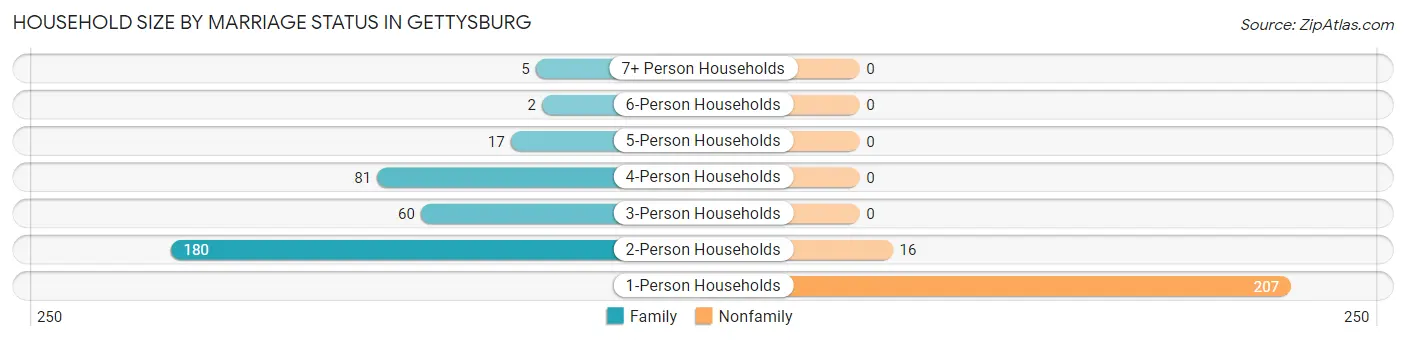
| Household Size | Family Households | Nonfamily Households |
| 1-Person Households | - | 207 (36.4%) |
| 2-Person Households | 180 (31.7%) | 16 (2.8%) |
| 3-Person Households | 60 (10.6%) | 0 (0.0%) |
| 4-Person Households | 81 (14.3%) | 0 (0.0%) |
| 5-Person Households | 17 (3.0%) | 0 (0.0%) |
| 6-Person Households | 2 (0.4%) | 0 (0.0%) |
| 7+ Person Households | 5 (0.9%) | 0 (0.0%) |
| Total | 345 (60.7%) | 223 (39.3%) |
Female Fertility in Gettysburg
Fertility by Age in Gettysburg
Average fertility rate in Gettysburg is 16.0 births per 1,000 women. Women in the age bracket of 20 to 34 years have the highest fertility rate with 42.0 births per 1,000 women. Women in the age bracket of 20 to 34 years acount for 100.0% of all women with births.
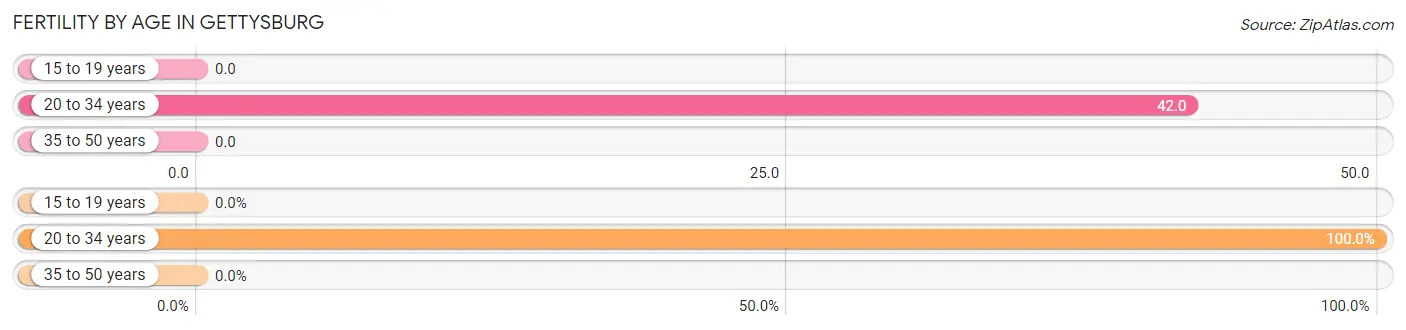
| Age Bracket | Women with Births | Births / 1,000 Women |
| 15 to 19 years | 0 (0.0%) | 0.0 |
| 20 to 34 years | 5 (100.0%) | 42.0 |
| 35 to 50 years | 0 (0.0%) | 0.0 |
| Total | 5 (100.0%) | 16.0 |
Fertility by Age by Marriage Status in Gettysburg
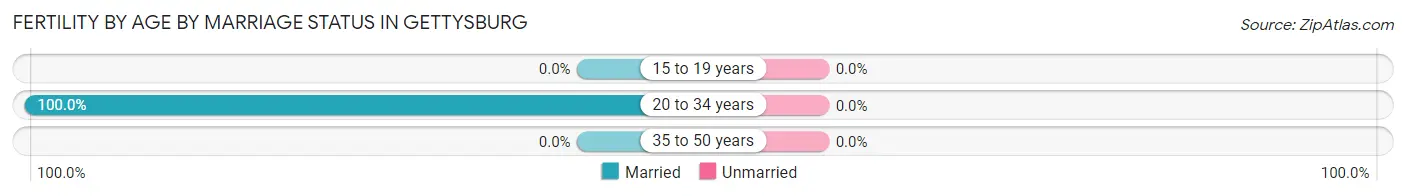
| Age Bracket | Married | Unmarried |
| 15 to 19 years | 0 (0.0%) | 0 (0.0%) |
| 20 to 34 years | 5 (100.0%) | 0 (0.0%) |
| 35 to 50 years | 0 (0.0%) | 0 (0.0%) |
| Total | 5 (100.0%) | 0 (0.0%) |
Fertility by Education in Gettysburg
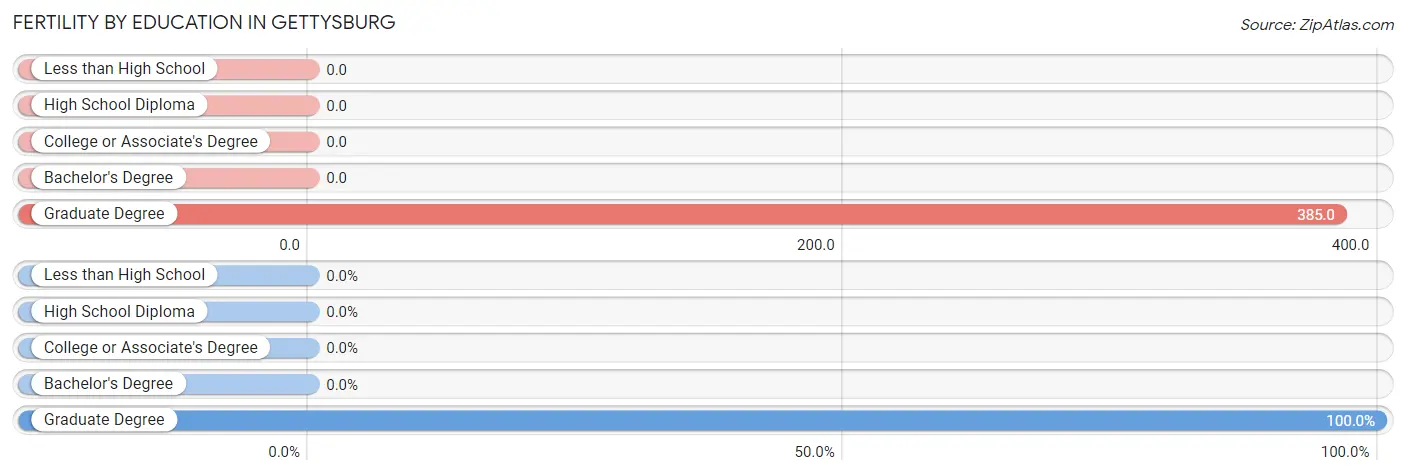
| Educational Attainment | Women with Births | Births / 1,000 Women |
| Less than High School | 0 (0.0%) | 0.0 |
| High School Diploma | 0 (0.0%) | 0.0 |
| College or Associate's Degree | 0 (0.0%) | 0.0 |
| Bachelor's Degree | 0 (0.0%) | 0.0 |
| Graduate Degree | 5 (100.0%) | 385.0 |
| Total | 5 (100.0%) | 16.0 |
Fertility by Education by Marriage Status in Gettysburg
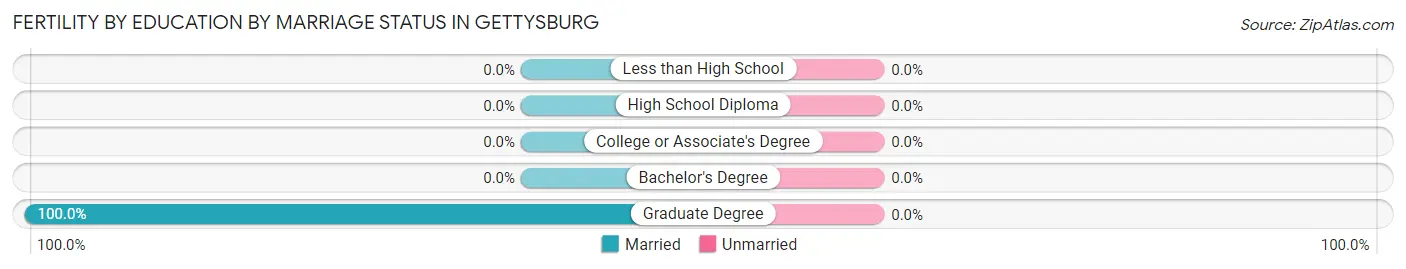
| Educational Attainment | Married | Unmarried |
| Less than High School | 0 (0.0%) | 0 (0.0%) |
| High School Diploma | 0 (0.0%) | 0 (0.0%) |
| College or Associate's Degree | 0 (0.0%) | 0 (0.0%) |
| Bachelor's Degree | 0 (0.0%) | 0 (0.0%) |
| Graduate Degree | 5 (100.0%) | 0 (0.0%) |
| Total | 5 (100.0%) | 0 (0.0%) |
Employment Characteristics in Gettysburg
Employment by Class of Employer in Gettysburg
Among the 723 employed individuals in Gettysburg, private company employees (426 | 58.9%), self-employed (incorporated) (84 | 11.6%), and self-employed (not incorporated) (67 | 9.3%) make up the most common classes of employment.
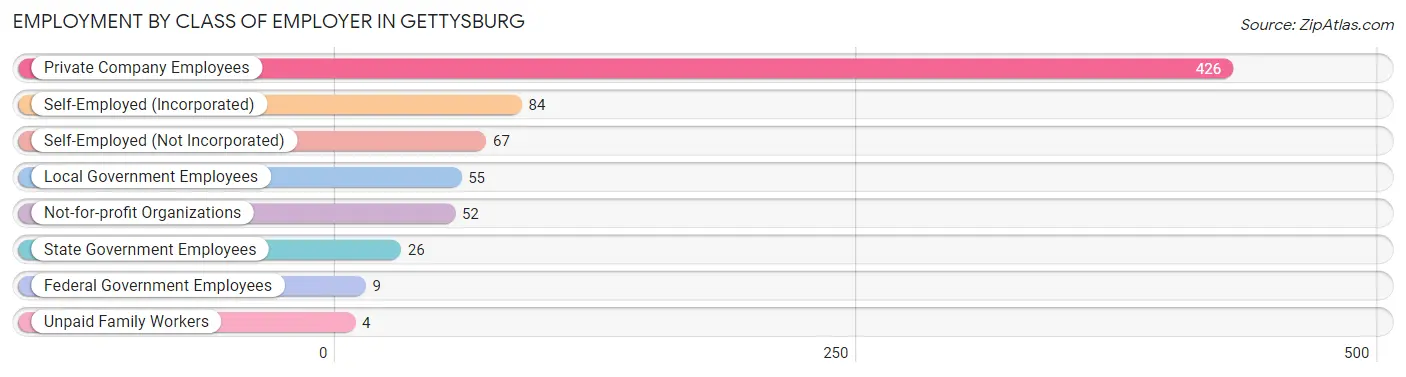
| Employer Class | # Employees | % Employees |
| Private Company Employees | 426 | 58.9% |
| Self-Employed (Incorporated) | 84 | 11.6% |
| Self-Employed (Not Incorporated) | 67 | 9.3% |
| Not-for-profit Organizations | 52 | 7.2% |
| Local Government Employees | 55 | 7.6% |
| State Government Employees | 26 | 3.6% |
| Federal Government Employees | 9 | 1.2% |
| Unpaid Family Workers | 4 | 0.5% |
| Total | 723 | 100.0% |
Employment Status by Age in Gettysburg
According to the labor force statistics for Gettysburg, out of the total population over 16 years of age (1,139), 66.7% or 760 individuals are in the labor force, with 2.6% or 20 of them unemployed. The age group with the highest labor force participation rate is 25 to 29 years, with 100.0% or 110 individuals in the labor force. Within the labor force, the 60 to 64 years age range has the highest percentage of unemployed individuals, with 29.4% or 20 of them being unemployed.
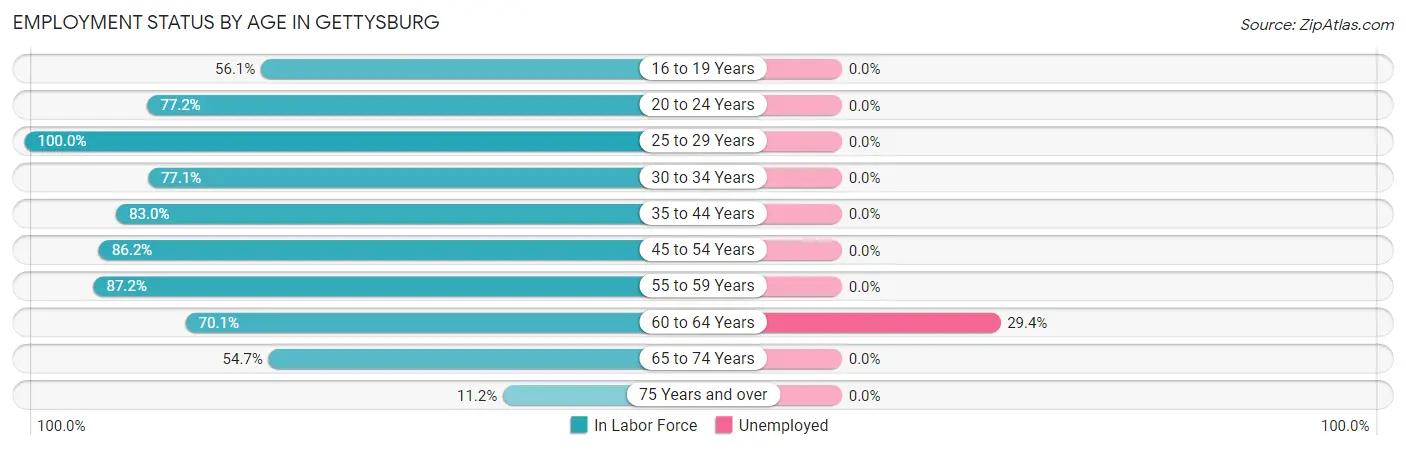
| Age Bracket | In Labor Force | Unemployed |
| 16 to 19 Years | 46 (56.1%) | 0 (0.0%) |
| 20 to 24 Years | 44 (77.2%) | 0 (0.0%) |
| 25 to 29 Years | 110 (100.0%) | 0 (0.0%) |
| 30 to 34 Years | 37 (77.1%) | 0 (0.0%) |
| 35 to 44 Years | 122 (83.0%) | 0 (0.0%) |
| 45 to 54 Years | 144 (86.2%) | 0 (0.0%) |
| 55 to 59 Years | 82 (87.2%) | 0 (0.0%) |
| 60 to 64 Years | 68 (70.1%) | 20 (29.4%) |
| 65 to 74 Years | 87 (54.7%) | 0 (0.0%) |
| 75 Years and over | 20 (11.2%) | 0 (0.0%) |
| Total | 760 (66.7%) | 20 (2.6%) |
Employment Status by Educational Attainment in Gettysburg
According to labor force statistics for Gettysburg, 84.9% of individuals (563) out of the total population between 25 and 64 years of age (663) are in the labor force, with 3.6% or 20 of them being unemployed. The group with the highest labor force participation rate are those with the educational attainment of less than high school, with 100.0% or 9 individuals in the labor force. Within the labor force, individuals with high school diploma education have the highest percentage of unemployment, with 8.2% or 20 of them being unemployed.
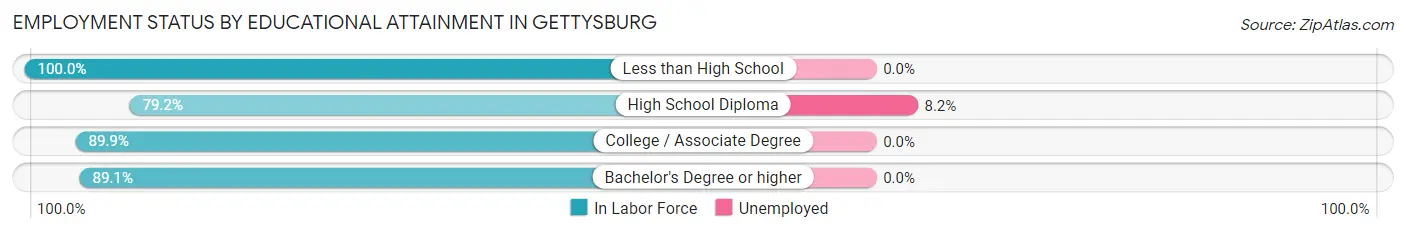
| Educational Attainment | In Labor Force | Unemployed |
| Less than High School | 9 (100.0%) | 0 (0.0%) |
| High School Diploma | 244 (79.2%) | 25 (8.2%) |
| College / Associate Degree | 187 (89.9%) | 0 (0.0%) |
| Bachelor's Degree or higher | 123 (89.1%) | 0 (0.0%) |
| Total | 563 (84.9%) | 24 (3.6%) |
Employment Occupations by Sex in Gettysburg
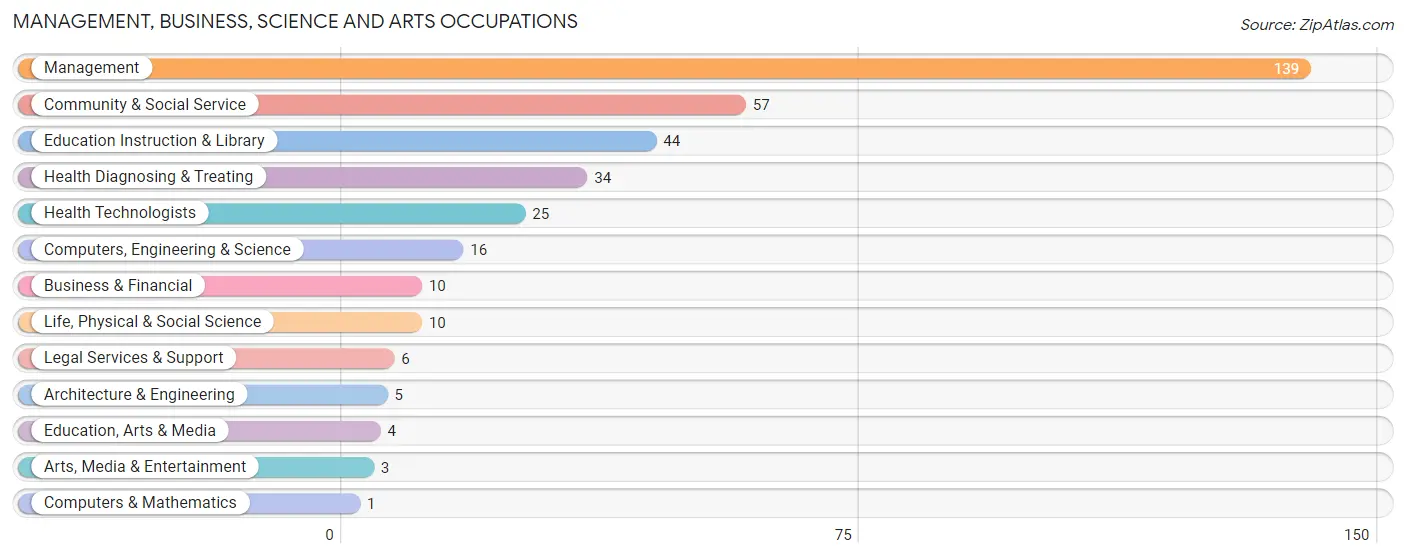
Management, Business, Science and Arts Occupations
The most common Management, Business, Science and Arts occupations in Gettysburg are Management (139 | 18.8%), Community & Social Service (57 | 7.7%), Education Instruction & Library (44 | 5.9%), Health Diagnosing & Treating (34 | 4.6%), and Health Technologists (25 | 3.4%).
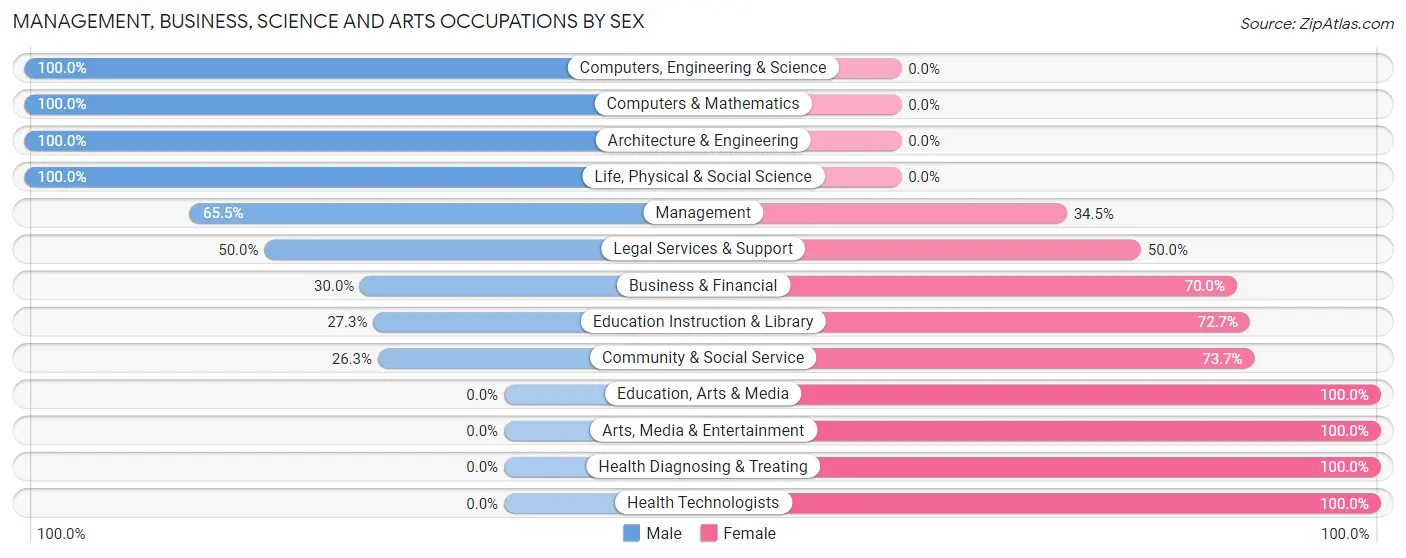
Management, Business, Science and Arts Occupations by Sex
Within the Management, Business, Science and Arts occupations in Gettysburg, the most male-oriented occupations are Computers, Engineering & Science (100.0%), Computers & Mathematics (100.0%), and Architecture & Engineering (100.0%), while the most female-oriented occupations are Education, Arts & Media (100.0%), Arts, Media & Entertainment (100.0%), and Health Diagnosing & Treating (100.0%).
| Occupation | Male | Female |
| Management | 91 (65.5%) | 48 (34.5%) |
| Business & Financial | 3 (30.0%) | 7 (70.0%) |
| Computers, Engineering & Science | 16 (100.0%) | 0 (0.0%) |
| Computers & Mathematics | 1 (100.0%) | 0 (0.0%) |
| Architecture & Engineering | 5 (100.0%) | 0 (0.0%) |
| Life, Physical & Social Science | 10 (100.0%) | 0 (0.0%) |
| Community & Social Service | 15 (26.3%) | 42 (73.7%) |
| Education, Arts & Media | 0 (0.0%) | 4 (100.0%) |
| Legal Services & Support | 3 (50.0%) | 3 (50.0%) |
| Education Instruction & Library | 12 (27.3%) | 32 (72.7%) |
| Arts, Media & Entertainment | 0 (0.0%) | 3 (100.0%) |
| Health Diagnosing & Treating | 0 (0.0%) | 34 (100.0%) |
| Health Technologists | 0 (0.0%) | 25 (100.0%) |
| Total (Category) | 125 (48.8%) | 131 (51.2%) |
| Total (Overall) | 373 (50.4%) | 367 (49.6%) |
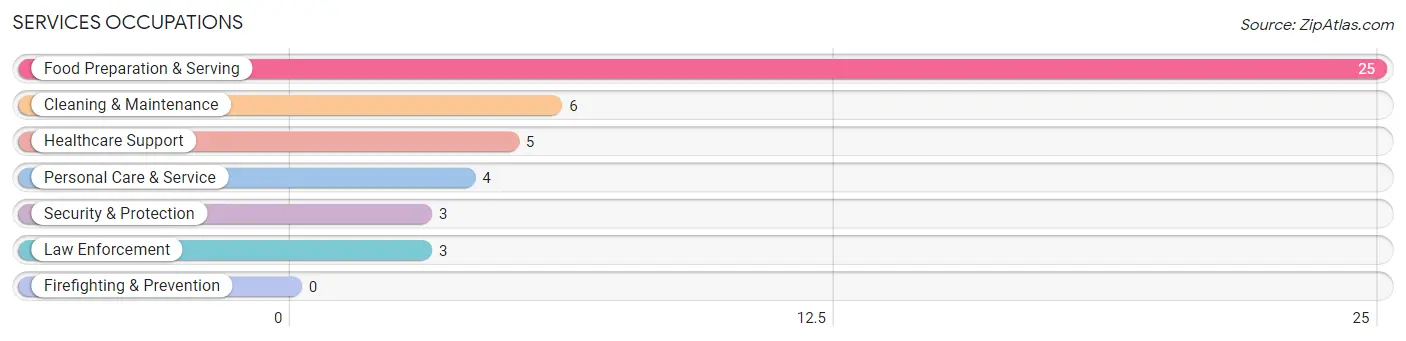
Services Occupations
The most common Services occupations in Gettysburg are Food Preparation & Serving (25 | 3.4%), Cleaning & Maintenance (6 | 0.8%), Healthcare Support (5 | 0.7%), Personal Care & Service (4 | 0.5%), and Security & Protection (3 | 0.4%).
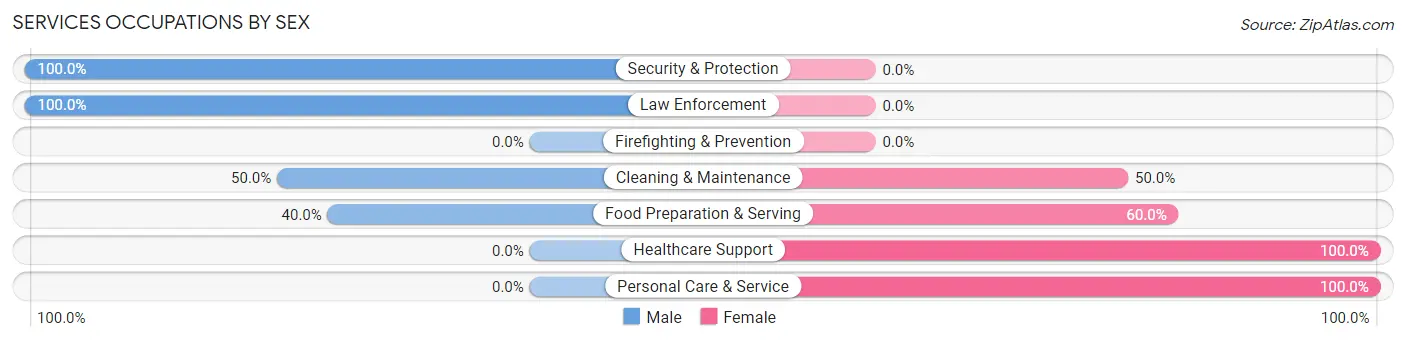
Services Occupations by Sex
Within the Services occupations in Gettysburg, the most male-oriented occupations are Security & Protection (100.0%), Law Enforcement (100.0%), and Cleaning & Maintenance (50.0%), while the most female-oriented occupations are Healthcare Support (100.0%), Personal Care & Service (100.0%), and Food Preparation & Serving (60.0%).
| Occupation | Male | Female |
| Healthcare Support | 0 (0.0%) | 5 (100.0%) |
| Security & Protection | 3 (100.0%) | 0 (0.0%) |
| Firefighting & Prevention | 0 (0.0%) | 0 (0.0%) |
| Law Enforcement | 3 (100.0%) | 0 (0.0%) |
| Food Preparation & Serving | 10 (40.0%) | 15 (60.0%) |
| Cleaning & Maintenance | 3 (50.0%) | 3 (50.0%) |
| Personal Care & Service | 0 (0.0%) | 4 (100.0%) |
| Total (Category) | 16 (37.2%) | 27 (62.8%) |
| Total (Overall) | 373 (50.4%) | 367 (49.6%) |
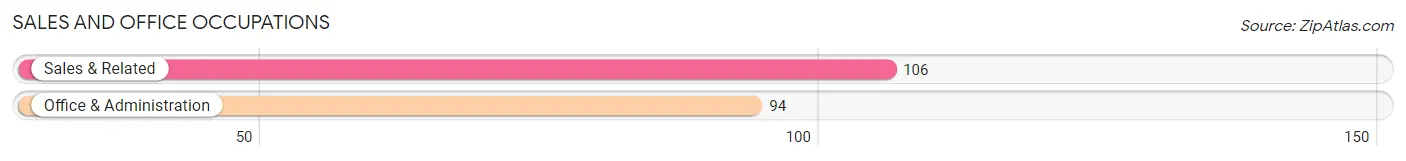
Sales and Office Occupations
The most common Sales and Office occupations in Gettysburg are Sales & Related (106 | 14.3%), and Office & Administration (94 | 12.7%).
Sales and Office Occupations by Sex
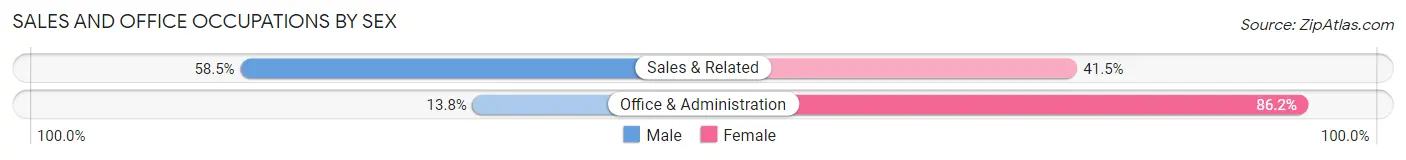
| Occupation | Male | Female |
| Sales & Related | 62 (58.5%) | 44 (41.5%) |
| Office & Administration | 13 (13.8%) | 81 (86.2%) |
| Total (Category) | 75 (37.5%) | 125 (62.5%) |
| Total (Overall) | 373 (50.4%) | 367 (49.6%) |
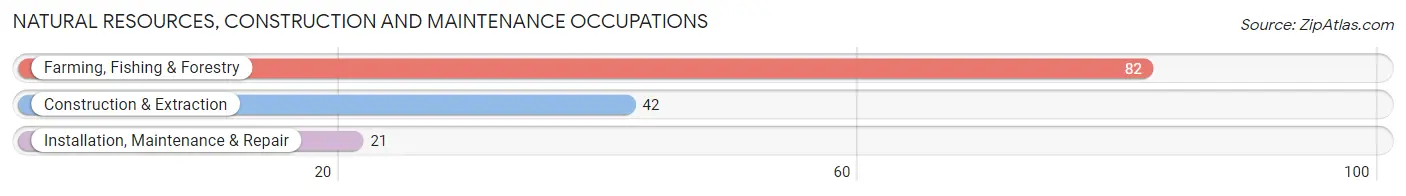
Natural Resources, Construction and Maintenance Occupations
The most common Natural Resources, Construction and Maintenance occupations in Gettysburg are Farming, Fishing & Forestry (82 | 11.1%), Construction & Extraction (42 | 5.7%), and Installation, Maintenance & Repair (21 | 2.8%).
Natural Resources, Construction and Maintenance Occupations by Sex
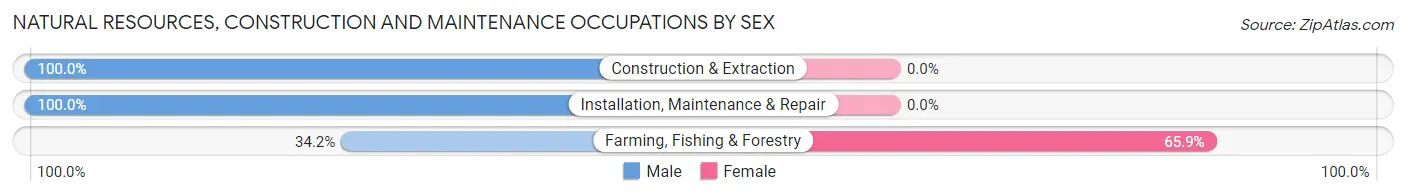
| Occupation | Male | Female |
| Farming, Fishing & Forestry | 28 (34.2%) | 54 (65.8%) |
| Construction & Extraction | 42 (100.0%) | 0 (0.0%) |
| Installation, Maintenance & Repair | 21 (100.0%) | 0 (0.0%) |
| Total (Category) | 91 (62.8%) | 54 (37.2%) |
| Total (Overall) | 373 (50.4%) | 367 (49.6%) |
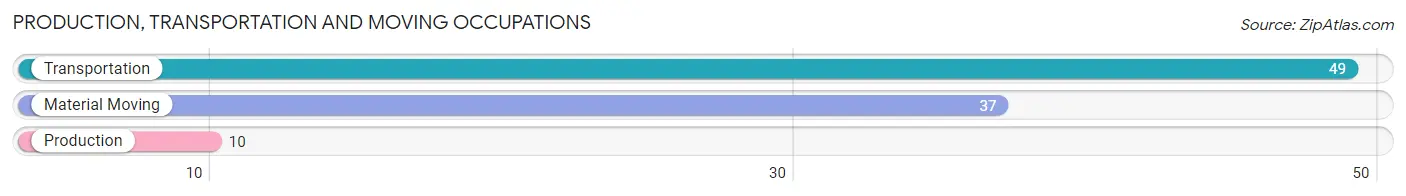
Production, Transportation and Moving Occupations
The most common Production, Transportation and Moving occupations in Gettysburg are Transportation (49 | 6.6%), Material Moving (37 | 5.0%), and Production (10 | 1.3%).
Production, Transportation and Moving Occupations by Sex
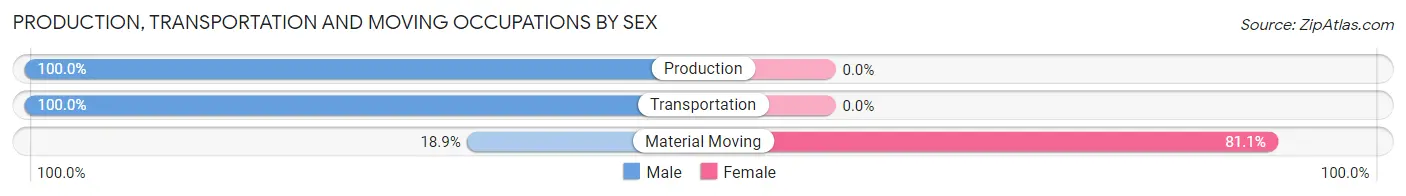
| Occupation | Male | Female |
| Production | 10 (100.0%) | 0 (0.0%) |
| Transportation | 49 (100.0%) | 0 (0.0%) |
| Material Moving | 7 (18.9%) | 30 (81.1%) |
| Total (Category) | 66 (68.8%) | 30 (31.2%) |
| Total (Overall) | 373 (50.4%) | 367 (49.6%) |
Employment Industries by Sex in Gettysburg
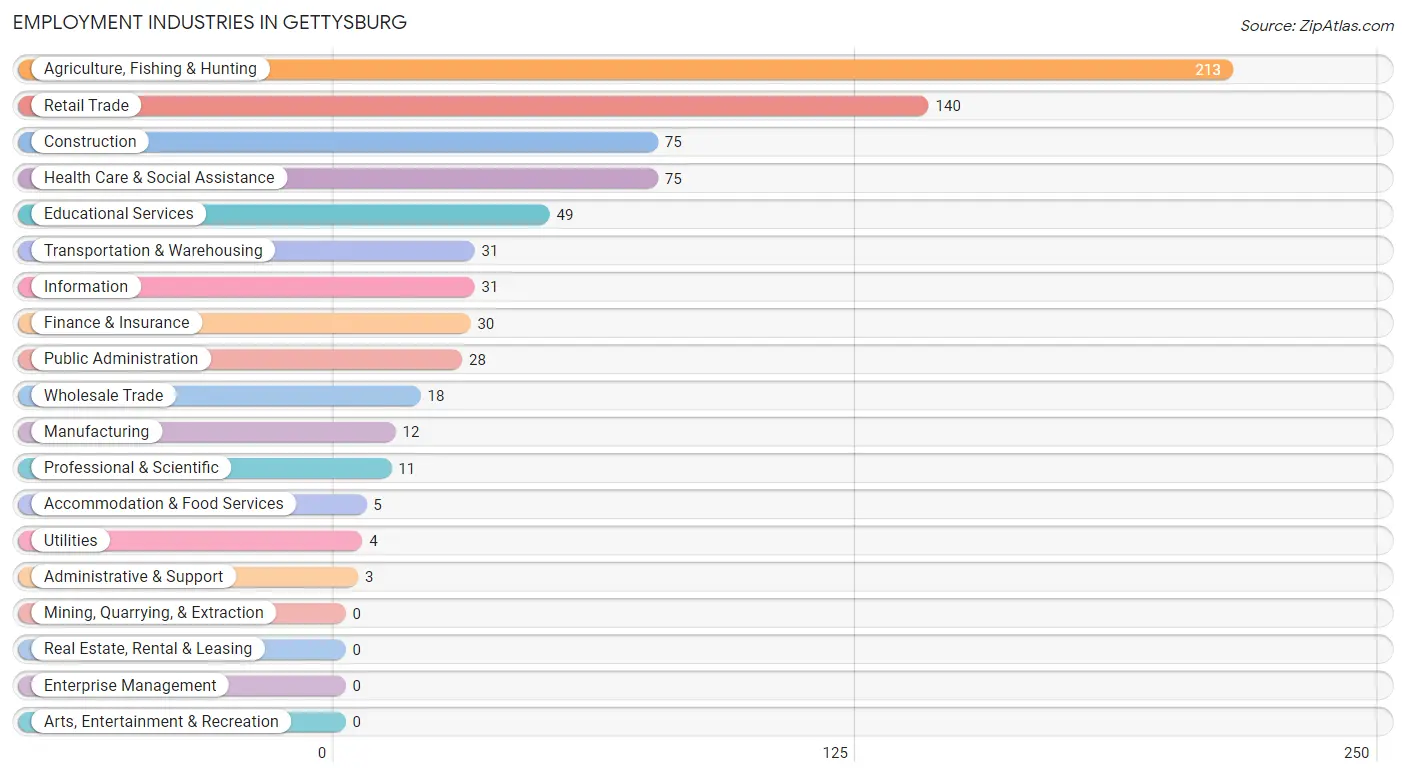
Employment Industries in Gettysburg
The major employment industries in Gettysburg include Agriculture, Fishing & Hunting (213 | 28.8%), Retail Trade (140 | 18.9%), Construction (75 | 10.1%), Health Care & Social Assistance (75 | 10.1%), and Educational Services (49 | 6.6%).
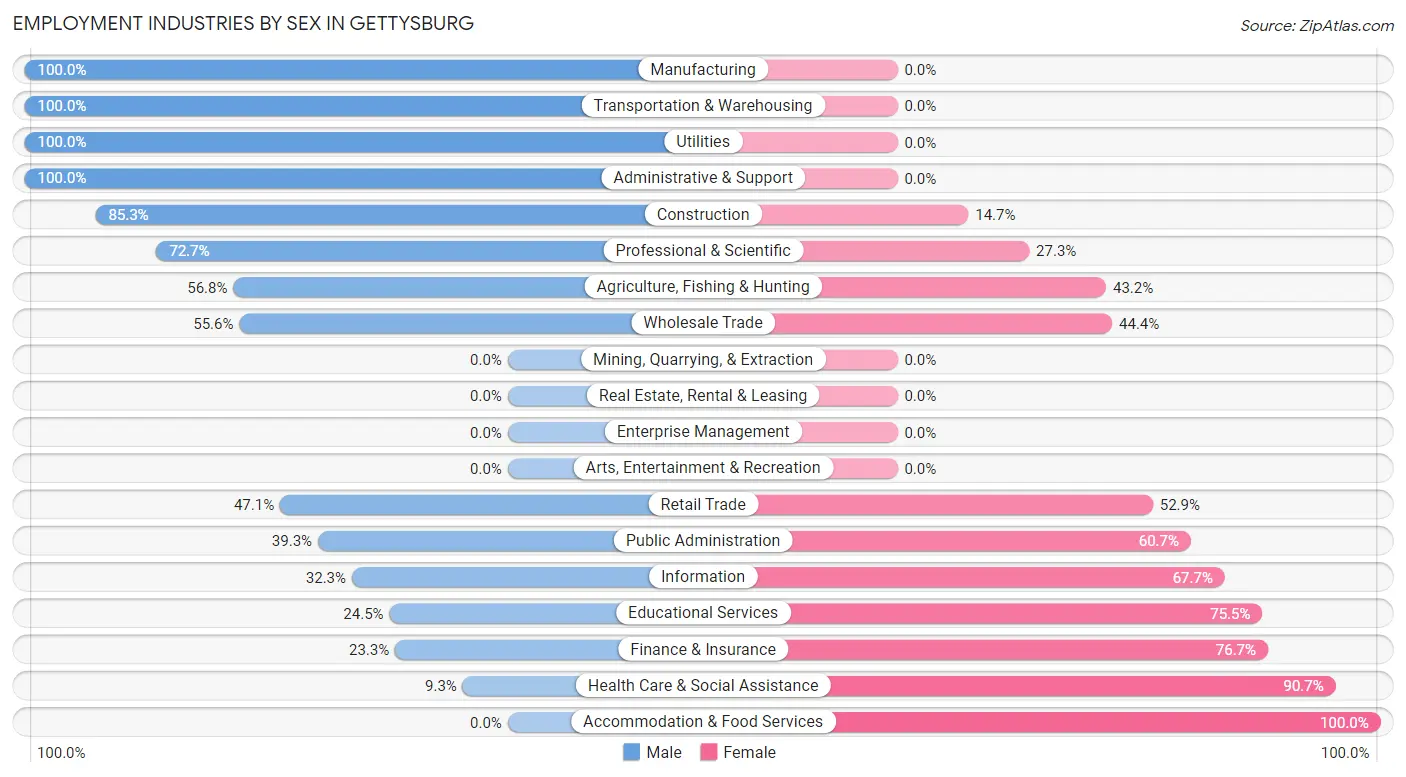
Employment Industries by Sex in Gettysburg
The Gettysburg industries that see more men than women are Manufacturing (100.0%), Transportation & Warehousing (100.0%), and Utilities (100.0%), whereas the industries that tend to have a higher number of women are Accommodation & Food Services (100.0%), Health Care & Social Assistance (90.7%), and Finance & Insurance (76.7%).
| Industry | Male | Female |
| Agriculture, Fishing & Hunting | 121 (56.8%) | 92 (43.2%) |
| Mining, Quarrying, & Extraction | 0 (0.0%) | 0 (0.0%) |
| Construction | 64 (85.3%) | 11 (14.7%) |
| Manufacturing | 12 (100.0%) | 0 (0.0%) |
| Wholesale Trade | 10 (55.6%) | 8 (44.4%) |
| Retail Trade | 66 (47.1%) | 74 (52.9%) |
| Transportation & Warehousing | 31 (100.0%) | 0 (0.0%) |
| Utilities | 4 (100.0%) | 0 (0.0%) |
| Information | 10 (32.3%) | 21 (67.7%) |
| Finance & Insurance | 7 (23.3%) | 23 (76.7%) |
| Real Estate, Rental & Leasing | 0 (0.0%) | 0 (0.0%) |
| Professional & Scientific | 8 (72.7%) | 3 (27.3%) |
| Enterprise Management | 0 (0.0%) | 0 (0.0%) |
| Administrative & Support | 3 (100.0%) | 0 (0.0%) |
| Educational Services | 12 (24.5%) | 37 (75.5%) |
| Health Care & Social Assistance | 7 (9.3%) | 68 (90.7%) |
| Arts, Entertainment & Recreation | 0 (0.0%) | 0 (0.0%) |
| Accommodation & Food Services | 0 (0.0%) | 5 (100.0%) |
| Public Administration | 11 (39.3%) | 17 (60.7%) |
| Total | 373 (50.4%) | 367 (49.6%) |
Education in Gettysburg
School Enrollment in Gettysburg
The most common levels of schooling among the 360 students in Gettysburg are high school (126 | 35.0%), elementary school (68 | 18.9%), and college / undergraduate (56 | 15.6%).
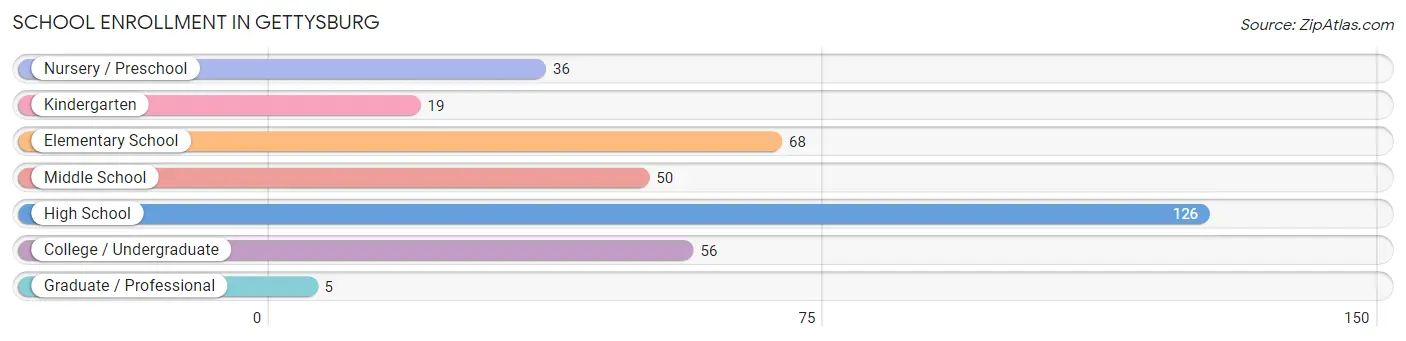
| School Level | # Students | % Students |
| Nursery / Preschool | 36 | 10.0% |
| Kindergarten | 19 | 5.3% |
| Elementary School | 68 | 18.9% |
| Middle School | 50 | 13.9% |
| High School | 126 | 35.0% |
| College / Undergraduate | 56 | 15.6% |
| Graduate / Professional | 5 | 1.4% |
| Total | 360 | 100.0% |
School Enrollment by Age by Funding Source in Gettysburg
Out of a total of 360 students who are enrolled in schools in Gettysburg, 81 (22.5%) attend a private institution, while the remaining 279 (77.5%) are enrolled in public schools. The age group of 18 to 19 year olds has the highest likelihood of being enrolled in private schools, with 22 (75.9% in the age bracket) enrolled. Conversely, the age group of 25 to 34 year olds has the lowest likelihood of being enrolled in a private school, with 11 (100.0% in the age bracket) attending a public institution.
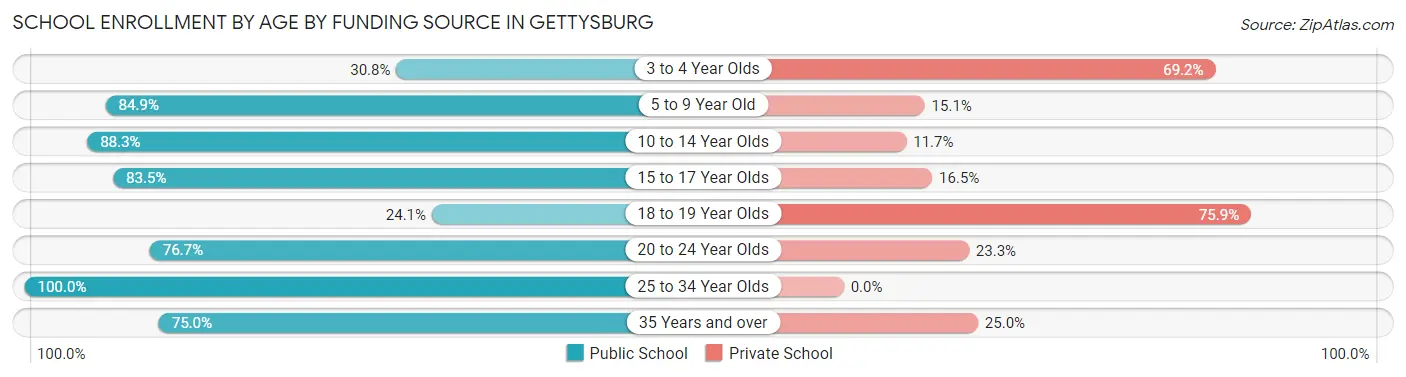
| Age Bracket | Public School | Private School |
| 3 to 4 Year Olds | 4 (30.8%) | 9 (69.2%) |
| 5 to 9 Year Old | 90 (84.9%) | 16 (15.1%) |
| 10 to 14 Year Olds | 53 (88.3%) | 7 (11.7%) |
| 15 to 17 Year Olds | 76 (83.5%) | 15 (16.5%) |
| 18 to 19 Year Olds | 7 (24.1%) | 22 (75.9%) |
| 20 to 24 Year Olds | 23 (76.7%) | 7 (23.3%) |
| 25 to 34 Year Olds | 11 (100.0%) | 0 (0.0%) |
| 35 Years and over | 15 (75.0%) | 5 (25.0%) |
| Total | 279 (77.5%) | 81 (22.5%) |
Educational Attainment by Field of Study in Gettysburg
Education (91 | 34.6%), science & technology (46 | 17.5%), bio, nature & agricultural (41 | 15.6%), business (34 | 12.9%), and social sciences (24 | 9.1%) are the most common fields of study among 263 individuals in Gettysburg who have obtained a bachelor's degree or higher.
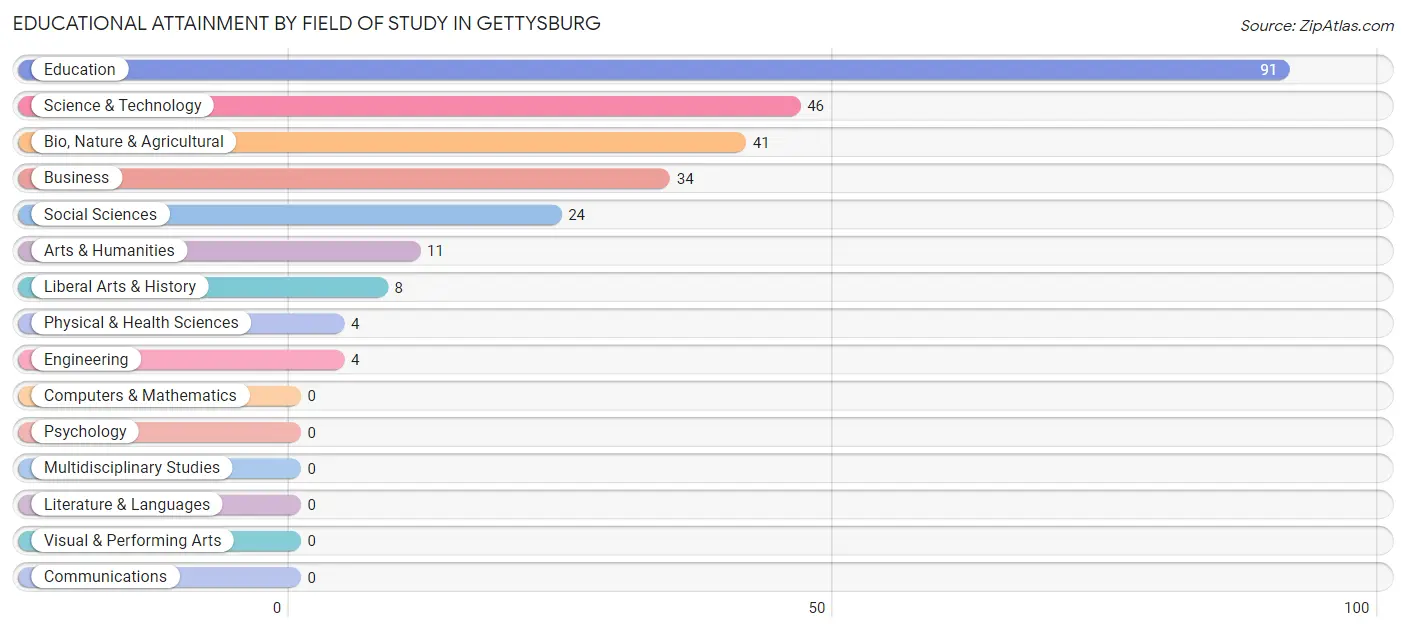
| Field of Study | # Graduates | % Graduates |
| Computers & Mathematics | 0 | 0.0% |
| Bio, Nature & Agricultural | 41 | 15.6% |
| Physical & Health Sciences | 4 | 1.5% |
| Psychology | 0 | 0.0% |
| Social Sciences | 24 | 9.1% |
| Engineering | 4 | 1.5% |
| Multidisciplinary Studies | 0 | 0.0% |
| Science & Technology | 46 | 17.5% |
| Business | 34 | 12.9% |
| Education | 91 | 34.6% |
| Literature & Languages | 0 | 0.0% |
| Liberal Arts & History | 8 | 3.0% |
| Visual & Performing Arts | 0 | 0.0% |
| Communications | 0 | 0.0% |
| Arts & Humanities | 11 | 4.2% |
| Total | 263 | 100.0% |
Transportation & Commute in Gettysburg
Vehicle Availability by Sex in Gettysburg
The most prevalent vehicle ownership categories in Gettysburg are males with 2 vehicles (143, accounting for 40.2%) and females with 2 vehicles (120, making up 39.0%).
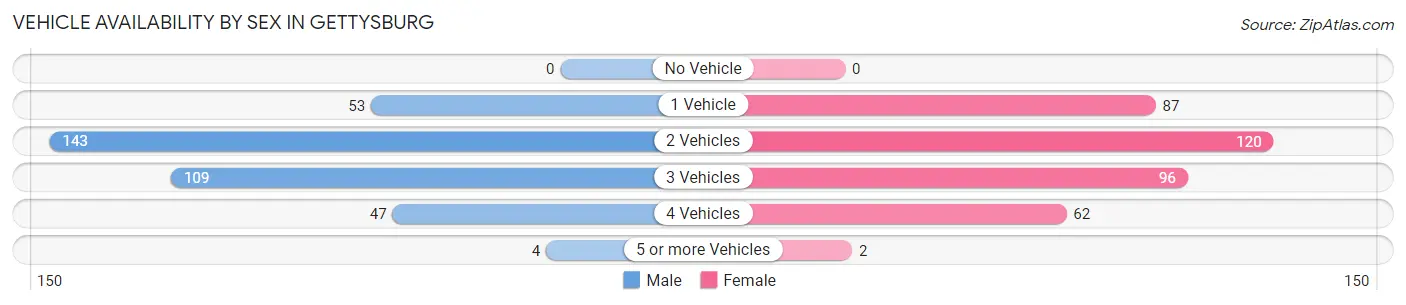
| Vehicles Available | Male | Female |
| No Vehicle | 0 (0.0%) | 0 (0.0%) |
| 1 Vehicle | 53 (14.9%) | 87 (23.7%) |
| 2 Vehicles | 143 (40.2%) | 120 (32.7%) |
| 3 Vehicles | 109 (30.6%) | 96 (26.2%) |
| 4 Vehicles | 47 (13.2%) | 62 (16.9%) |
| 5 or more Vehicles | 4 (1.1%) | 2 (0.5%) |
| Total | 356 (100.0%) | 367 (100.0%) |
Commute Time in Gettysburg
The most frequently occuring commute durations in Gettysburg are less than 5 minutes (247 commuters, 35.7%), 5 to 9 minutes (157 commuters, 22.7%), and 10 to 14 minutes (78 commuters, 11.3%).
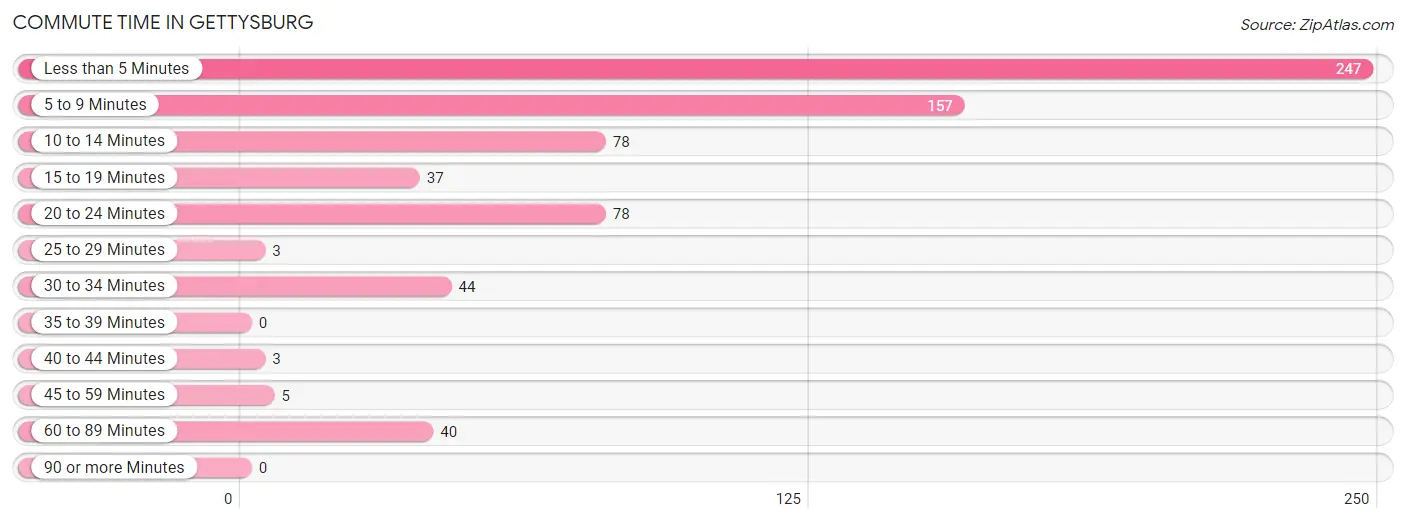
| Commute Time | # Commuters | % Commuters |
| Less than 5 Minutes | 247 | 35.7% |
| 5 to 9 Minutes | 157 | 22.7% |
| 10 to 14 Minutes | 78 | 11.3% |
| 15 to 19 Minutes | 37 | 5.3% |
| 20 to 24 Minutes | 78 | 11.3% |
| 25 to 29 Minutes | 3 | 0.4% |
| 30 to 34 Minutes | 44 | 6.4% |
| 35 to 39 Minutes | 0 | 0.0% |
| 40 to 44 Minutes | 3 | 0.4% |
| 45 to 59 Minutes | 5 | 0.7% |
| 60 to 89 Minutes | 40 | 5.8% |
| 90 or more Minutes | 0 | 0.0% |
Commute Time by Sex in Gettysburg
The most common commute times in Gettysburg are less than 5 minutes (107 commuters, 31.8%) for males and less than 5 minutes (140 commuters, 39.4%) for females.
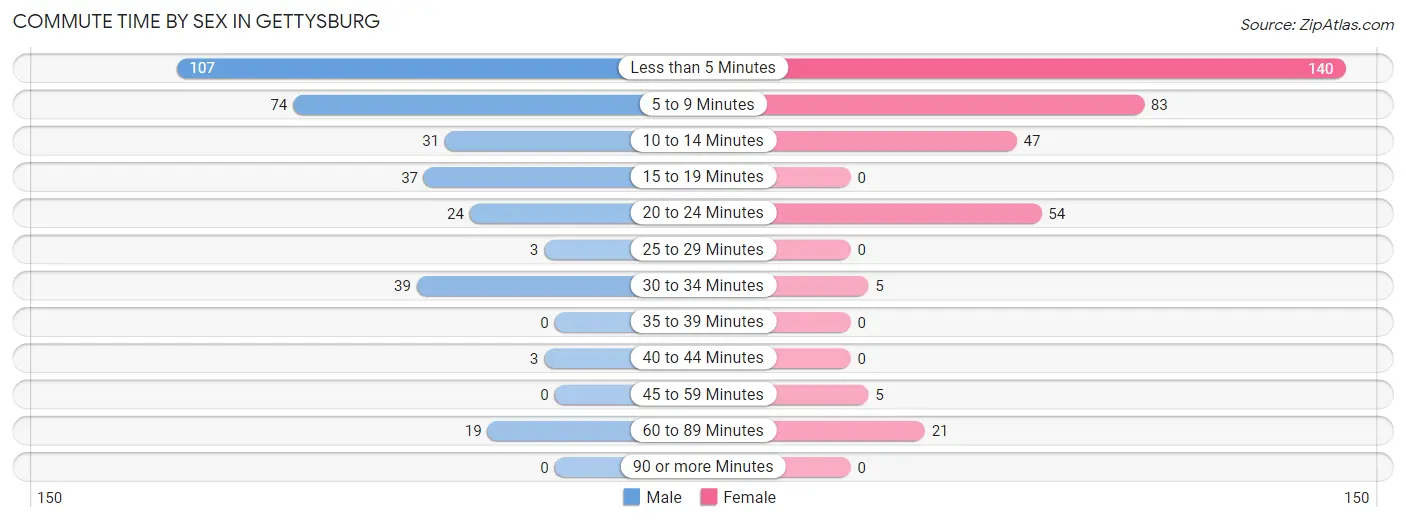
| Commute Time | Male | Female |
| Less than 5 Minutes | 107 (31.8%) | 140 (39.4%) |
| 5 to 9 Minutes | 74 (22.0%) | 83 (23.4%) |
| 10 to 14 Minutes | 31 (9.2%) | 47 (13.2%) |
| 15 to 19 Minutes | 37 (11.0%) | 0 (0.0%) |
| 20 to 24 Minutes | 24 (7.1%) | 54 (15.2%) |
| 25 to 29 Minutes | 3 (0.9%) | 0 (0.0%) |
| 30 to 34 Minutes | 39 (11.6%) | 5 (1.4%) |
| 35 to 39 Minutes | 0 (0.0%) | 0 (0.0%) |
| 40 to 44 Minutes | 3 (0.9%) | 0 (0.0%) |
| 45 to 59 Minutes | 0 (0.0%) | 5 (1.4%) |
| 60 to 89 Minutes | 19 (5.6%) | 21 (5.9%) |
| 90 or more Minutes | 0 (0.0%) | 0 (0.0%) |
Time of Departure to Work by Sex in Gettysburg
The most frequent times of departure to work in Gettysburg are 7:30 AM to 7:59 AM (97, 28.8%) for males and 7:00 AM to 7:29 AM (94, 26.5%) for females.
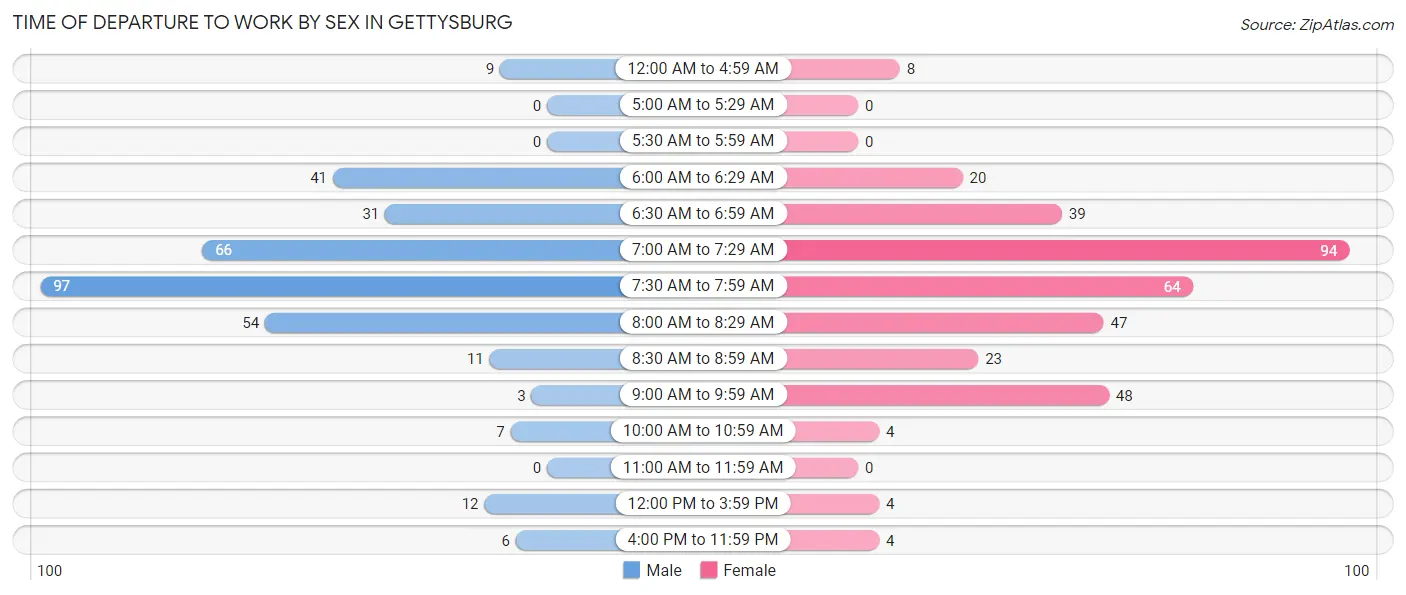
| Time of Departure | Male | Female |
| 12:00 AM to 4:59 AM | 9 (2.7%) | 8 (2.2%) |
| 5:00 AM to 5:29 AM | 0 (0.0%) | 0 (0.0%) |
| 5:30 AM to 5:59 AM | 0 (0.0%) | 0 (0.0%) |
| 6:00 AM to 6:29 AM | 41 (12.2%) | 20 (5.6%) |
| 6:30 AM to 6:59 AM | 31 (9.2%) | 39 (11.0%) |
| 7:00 AM to 7:29 AM | 66 (19.6%) | 94 (26.5%) |
| 7:30 AM to 7:59 AM | 97 (28.8%) | 64 (18.0%) |
| 8:00 AM to 8:29 AM | 54 (16.0%) | 47 (13.2%) |
| 8:30 AM to 8:59 AM | 11 (3.3%) | 23 (6.5%) |
| 9:00 AM to 9:59 AM | 3 (0.9%) | 48 (13.5%) |
| 10:00 AM to 10:59 AM | 7 (2.1%) | 4 (1.1%) |
| 11:00 AM to 11:59 AM | 0 (0.0%) | 0 (0.0%) |
| 12:00 PM to 3:59 PM | 12 (3.6%) | 4 (1.1%) |
| 4:00 PM to 11:59 PM | 6 (1.8%) | 4 (1.1%) |
| Total | 337 (100.0%) | 355 (100.0%) |
Housing Occupancy in Gettysburg
Occupancy by Ownership in Gettysburg
Of the total 568 dwellings in Gettysburg, owner-occupied units account for 449 (79.0%), while renter-occupied units make up 119 (20.9%).
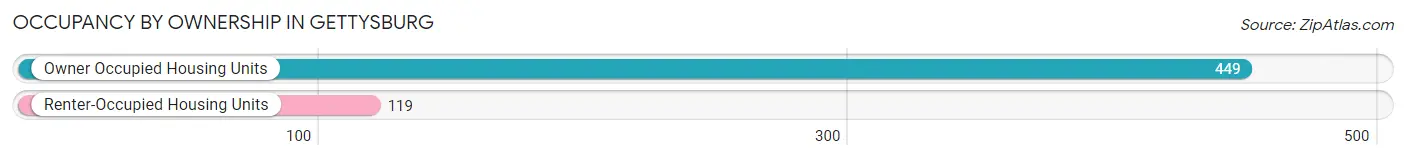
| Occupancy | # Housing Units | % Housing Units |
| Owner Occupied Housing Units | 449 | 79.0% |
| Renter-Occupied Housing Units | 119 | 20.9% |
| Total Occupied Housing Units | 568 | 100.0% |
Occupancy by Household Size in Gettysburg
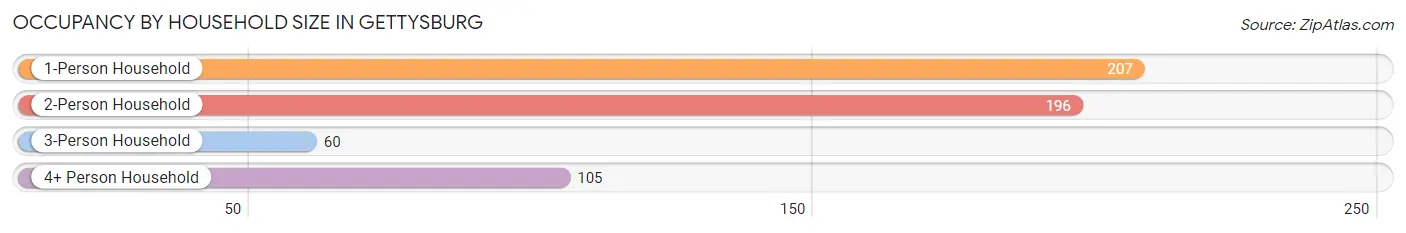
| Household Size | # Housing Units | % Housing Units |
| 1-Person Household | 207 | 36.4% |
| 2-Person Household | 196 | 34.5% |
| 3-Person Household | 60 | 10.6% |
| 4+ Person Household | 105 | 18.5% |
| Total Housing Units | 568 | 100.0% |
Occupancy by Ownership by Household Size in Gettysburg
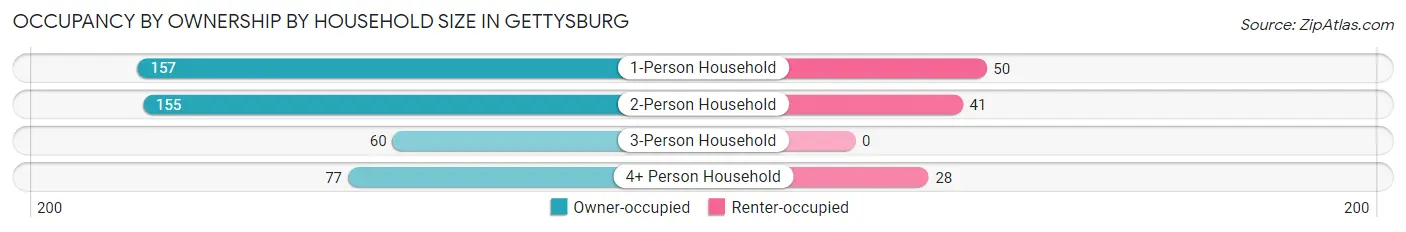
| Household Size | Owner-occupied | Renter-occupied |
| 1-Person Household | 157 (75.8%) | 50 (24.1%) |
| 2-Person Household | 155 (79.1%) | 41 (20.9%) |
| 3-Person Household | 60 (100.0%) | 0 (0.0%) |
| 4+ Person Household | 77 (73.3%) | 28 (26.7%) |
| Total Housing Units | 449 (79.0%) | 119 (20.9%) |
Occupancy by Educational Attainment in Gettysburg
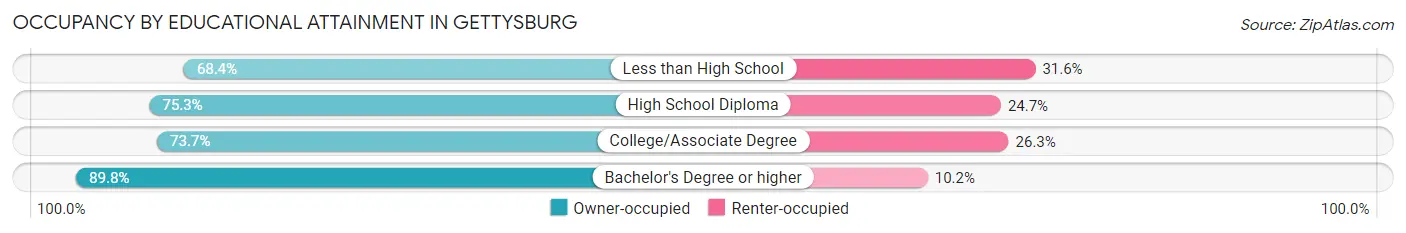
| Household Size | Owner-occupied | Renter-occupied |
| Less than High School | 13 (68.4%) | 6 (31.6%) |
| High School Diploma | 146 (75.3%) | 48 (24.7%) |
| College/Associate Degree | 132 (73.7%) | 47 (26.3%) |
| Bachelor's Degree or higher | 158 (89.8%) | 18 (10.2%) |
Occupancy by Age of Householder in Gettysburg
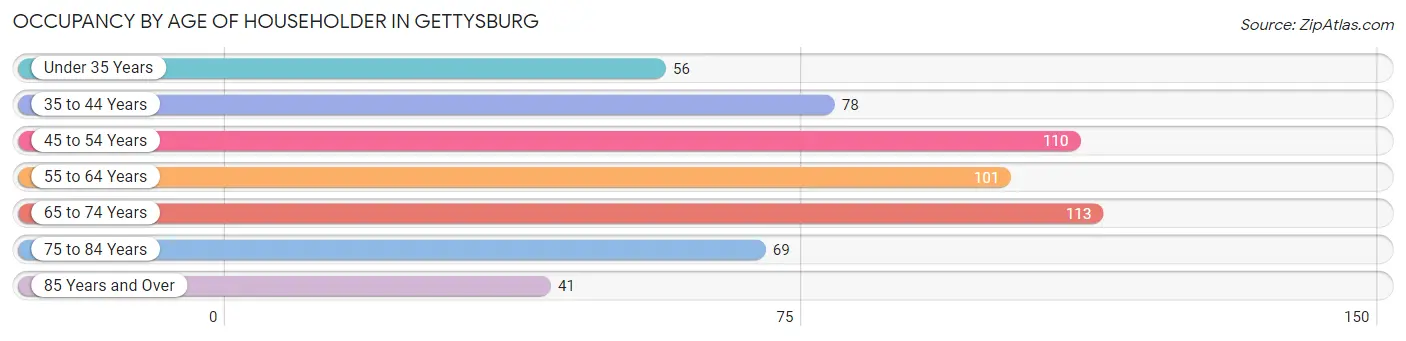
| Age Bracket | # Households | % Households |
| Under 35 Years | 56 | 9.9% |
| 35 to 44 Years | 78 | 13.7% |
| 45 to 54 Years | 110 | 19.4% |
| 55 to 64 Years | 101 | 17.8% |
| 65 to 74 Years | 113 | 19.9% |
| 75 to 84 Years | 69 | 12.1% |
| 85 Years and Over | 41 | 7.2% |
| Total | 568 | 100.0% |
Housing Finances in Gettysburg
Median Income by Occupancy in Gettysburg
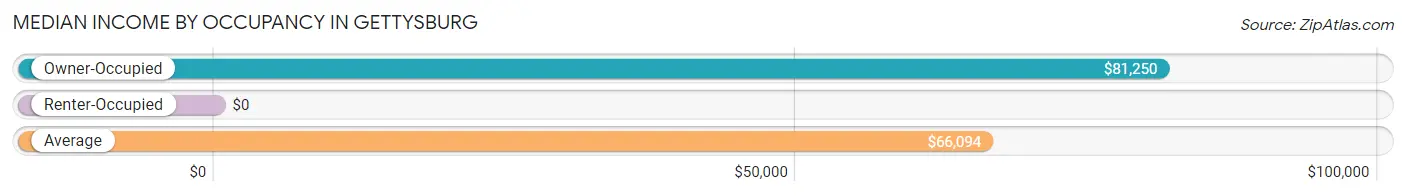
| Occupancy Type | # Households | Median Income |
| Owner-Occupied | 449 (79.0%) | $81,250 |
| Renter-Occupied | 119 (20.9%) | $0 |
| Average | 568 (100.0%) | $66,094 |
Occupancy by Householder Income Bracket in Gettysburg
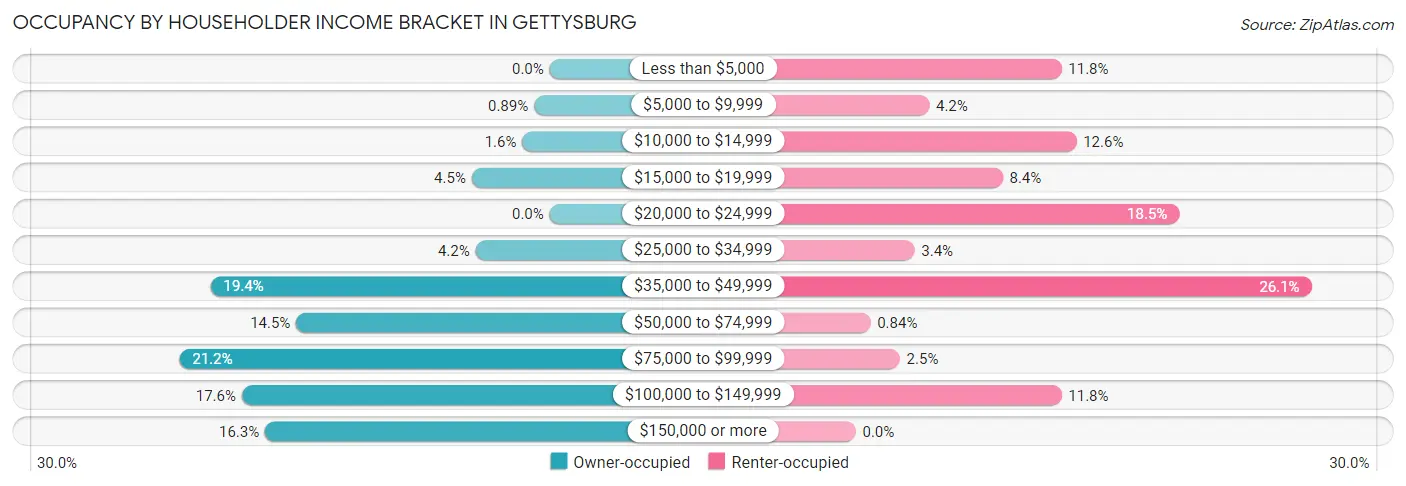
| Income Bracket | Owner-occupied | Renter-occupied |
| Less than $5,000 | 0 (0.0%) | 14 (11.8%) |
| $5,000 to $9,999 | 4 (0.9%) | 5 (4.2%) |
| $10,000 to $14,999 | 7 (1.6%) | 15 (12.6%) |
| $15,000 to $19,999 | 20 (4.4%) | 10 (8.4%) |
| $20,000 to $24,999 | 0 (0.0%) | 22 (18.5%) |
| $25,000 to $34,999 | 19 (4.2%) | 4 (3.4%) |
| $35,000 to $49,999 | 87 (19.4%) | 31 (26.1%) |
| $50,000 to $74,999 | 65 (14.5%) | 1 (0.8%) |
| $75,000 to $99,999 | 95 (21.2%) | 3 (2.5%) |
| $100,000 to $149,999 | 79 (17.6%) | 14 (11.8%) |
| $150,000 or more | 73 (16.3%) | 0 (0.0%) |
| Total | 449 (100.0%) | 119 (100.0%) |
Monthly Housing Cost Tiers in Gettysburg
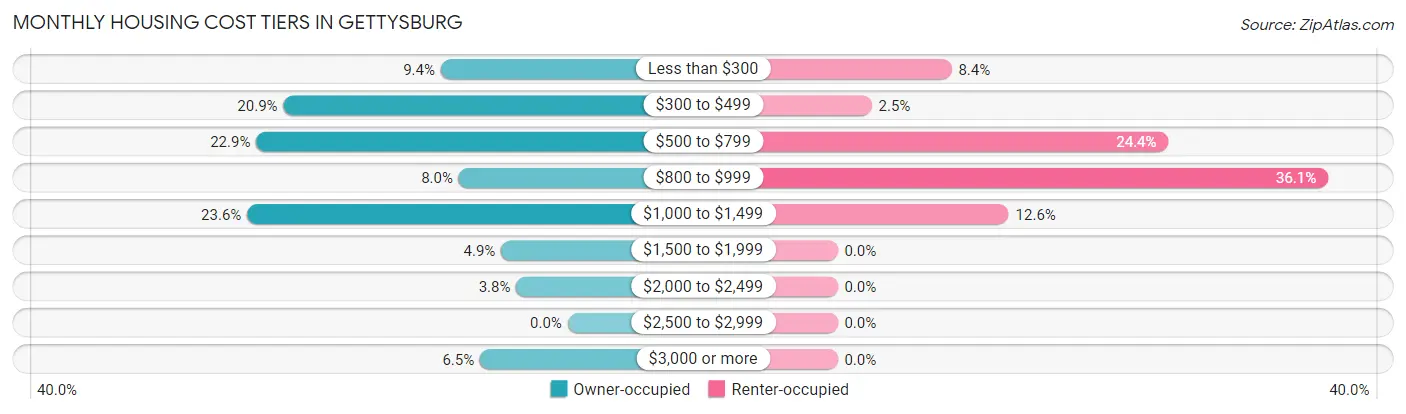
| Monthly Cost | Owner-occupied | Renter-occupied |
| Less than $300 | 42 (9.3%) | 10 (8.4%) |
| $300 to $499 | 94 (20.9%) | 3 (2.5%) |
| $500 to $799 | 103 (22.9%) | 29 (24.4%) |
| $800 to $999 | 36 (8.0%) | 43 (36.1%) |
| $1,000 to $1,499 | 106 (23.6%) | 15 (12.6%) |
| $1,500 to $1,999 | 22 (4.9%) | 0 (0.0%) |
| $2,000 to $2,499 | 17 (3.8%) | 0 (0.0%) |
| $2,500 to $2,999 | 0 (0.0%) | 0 (0.0%) |
| $3,000 or more | 29 (6.5%) | 0 (0.0%) |
| Total | 449 (100.0%) | 119 (100.0%) |
Physical Housing Characteristics in Gettysburg
Housing Structures in Gettysburg
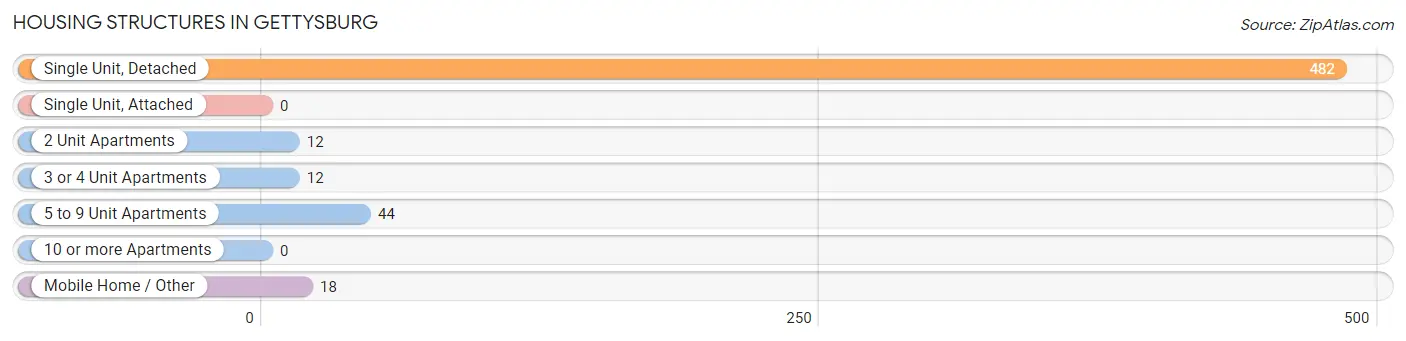
| Structure Type | # Housing Units | % Housing Units |
| Single Unit, Detached | 482 | 84.9% |
| Single Unit, Attached | 0 | 0.0% |
| 2 Unit Apartments | 12 | 2.1% |
| 3 or 4 Unit Apartments | 12 | 2.1% |
| 5 to 9 Unit Apartments | 44 | 7.7% |
| 10 or more Apartments | 0 | 0.0% |
| Mobile Home / Other | 18 | 3.2% |
| Total | 568 | 100.0% |
Housing Structures by Occupancy in Gettysburg
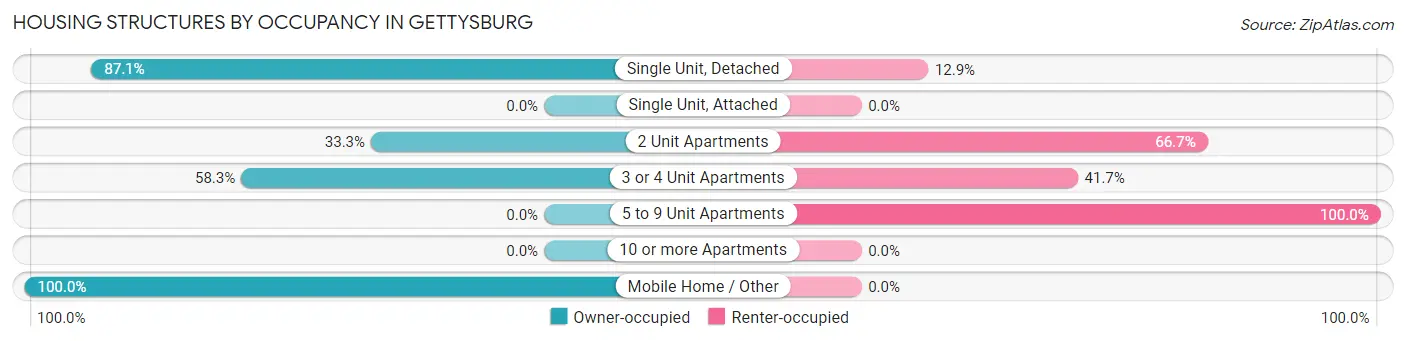
| Structure Type | Owner-occupied | Renter-occupied |
| Single Unit, Detached | 420 (87.1%) | 62 (12.9%) |
| Single Unit, Attached | 0 (0.0%) | 0 (0.0%) |
| 2 Unit Apartments | 4 (33.3%) | 8 (66.7%) |
| 3 or 4 Unit Apartments | 7 (58.3%) | 5 (41.7%) |
| 5 to 9 Unit Apartments | 0 (0.0%) | 44 (100.0%) |
| 10 or more Apartments | 0 (0.0%) | 0 (0.0%) |
| Mobile Home / Other | 18 (100.0%) | 0 (0.0%) |
| Total | 449 (79.0%) | 119 (20.9%) |
Housing Structures by Number of Rooms in Gettysburg
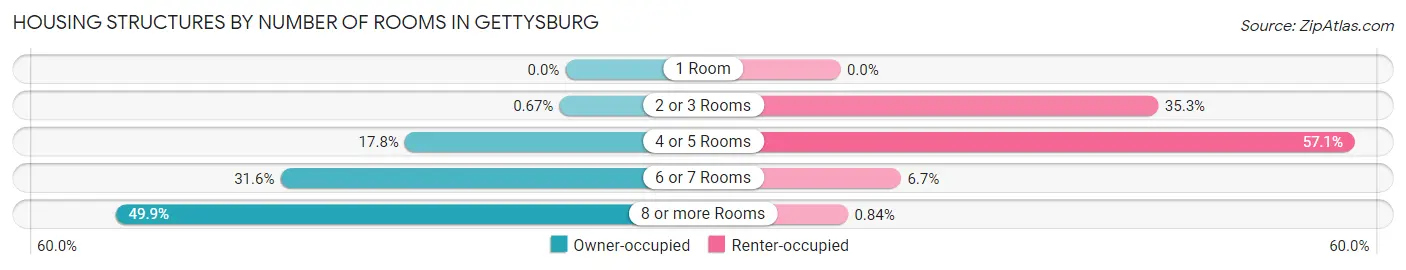
| Number of Rooms | Owner-occupied | Renter-occupied |
| 1 Room | 0 (0.0%) | 0 (0.0%) |
| 2 or 3 Rooms | 3 (0.7%) | 42 (35.3%) |
| 4 or 5 Rooms | 80 (17.8%) | 68 (57.1%) |
| 6 or 7 Rooms | 142 (31.6%) | 8 (6.7%) |
| 8 or more Rooms | 224 (49.9%) | 1 (0.8%) |
| Total | 449 (100.0%) | 119 (100.0%) |
Housing Structure by Heating Type in Gettysburg
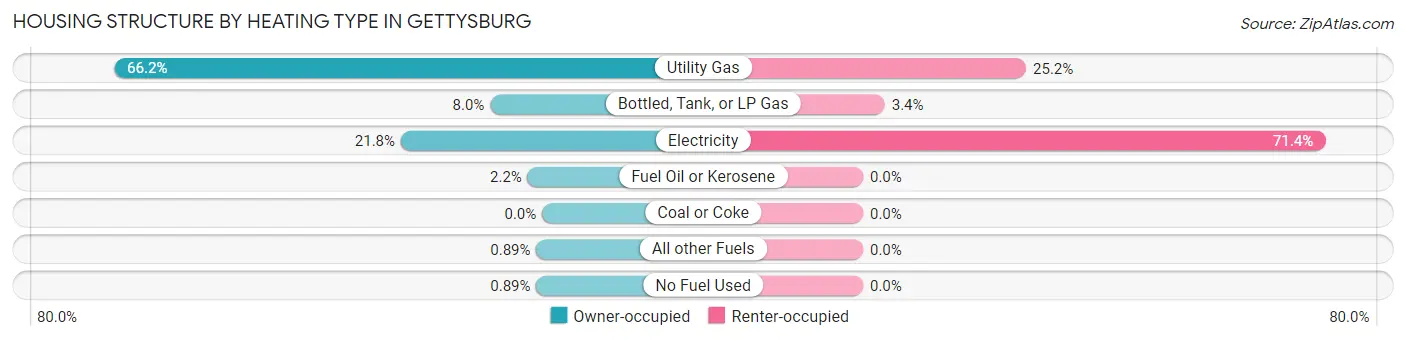
| Heating Type | Owner-occupied | Renter-occupied |
| Utility Gas | 297 (66.1%) | 30 (25.2%) |
| Bottled, Tank, or LP Gas | 36 (8.0%) | 4 (3.4%) |
| Electricity | 98 (21.8%) | 85 (71.4%) |
| Fuel Oil or Kerosene | 10 (2.2%) | 0 (0.0%) |
| Coal or Coke | 0 (0.0%) | 0 (0.0%) |
| All other Fuels | 4 (0.9%) | 0 (0.0%) |
| No Fuel Used | 4 (0.9%) | 0 (0.0%) |
| Total | 449 (100.0%) | 119 (100.0%) |
Household Vehicle Usage in Gettysburg
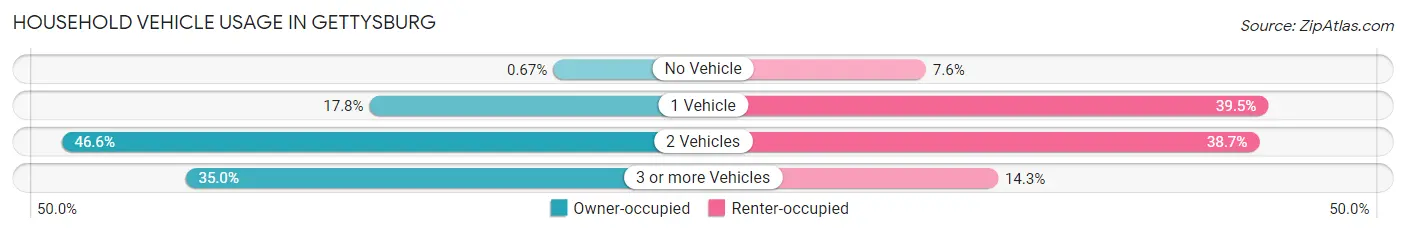
| Vehicles per Household | Owner-occupied | Renter-occupied |
| No Vehicle | 3 (0.7%) | 9 (7.6%) |
| 1 Vehicle | 80 (17.8%) | 47 (39.5%) |
| 2 Vehicles | 209 (46.6%) | 46 (38.7%) |
| 3 or more Vehicles | 157 (35.0%) | 17 (14.3%) |
| Total | 449 (100.0%) | 119 (100.0%) |
Real Estate & Mortgages in Gettysburg
Real Estate and Mortgage Overview in Gettysburg
| Characteristic | Without Mortgage | With Mortgage |
| Housing Units | 245 | 204 |
| Median Property Value | $117,800 | $189,200 |
| Median Household Income | $51,917 | $46 |
| Monthly Housing Costs | $497 | $24 |
| Real Estate Taxes | $2,061 | $0 |
Property Value by Mortgage Status in Gettysburg
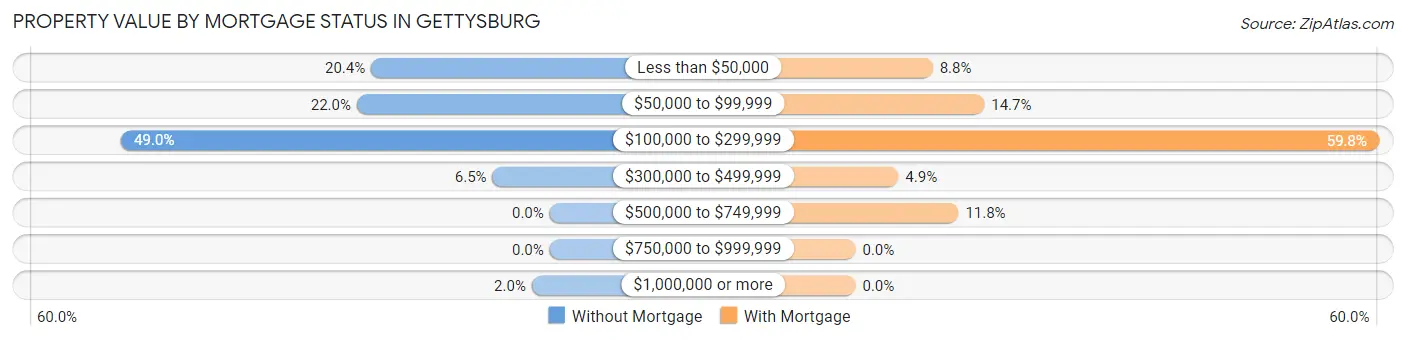
| Property Value | Without Mortgage | With Mortgage |
| Less than $50,000 | 50 (20.4%) | 18 (8.8%) |
| $50,000 to $99,999 | 54 (22.0%) | 30 (14.7%) |
| $100,000 to $299,999 | 120 (49.0%) | 122 (59.8%) |
| $300,000 to $499,999 | 16 (6.5%) | 10 (4.9%) |
| $500,000 to $749,999 | 0 (0.0%) | 24 (11.8%) |
| $750,000 to $999,999 | 0 (0.0%) | 0 (0.0%) |
| $1,000,000 or more | 5 (2.0%) | 0 (0.0%) |
| Total | 245 (100.0%) | 204 (100.0%) |
Household Income by Mortgage Status in Gettysburg
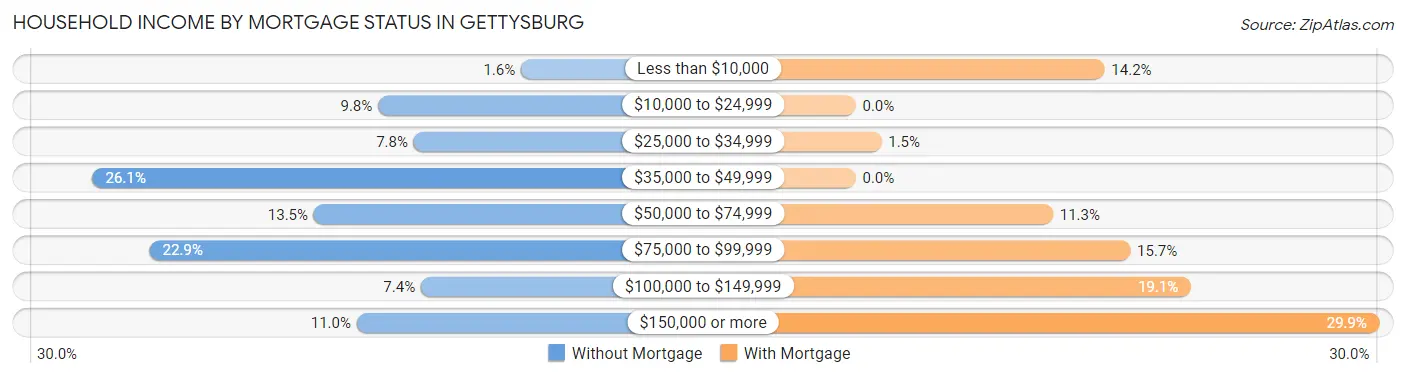
| Household Income | Without Mortgage | With Mortgage |
| Less than $10,000 | 4 (1.6%) | 29 (14.2%) |
| $10,000 to $24,999 | 24 (9.8%) | 0 (0.0%) |
| $25,000 to $34,999 | 19 (7.8%) | 3 (1.5%) |
| $35,000 to $49,999 | 64 (26.1%) | 0 (0.0%) |
| $50,000 to $74,999 | 33 (13.5%) | 23 (11.3%) |
| $75,000 to $99,999 | 56 (22.9%) | 32 (15.7%) |
| $100,000 to $149,999 | 18 (7.3%) | 39 (19.1%) |
| $150,000 or more | 27 (11.0%) | 61 (29.9%) |
| Total | 245 (100.0%) | 204 (100.0%) |
Property Value to Household Income Ratio in Gettysburg
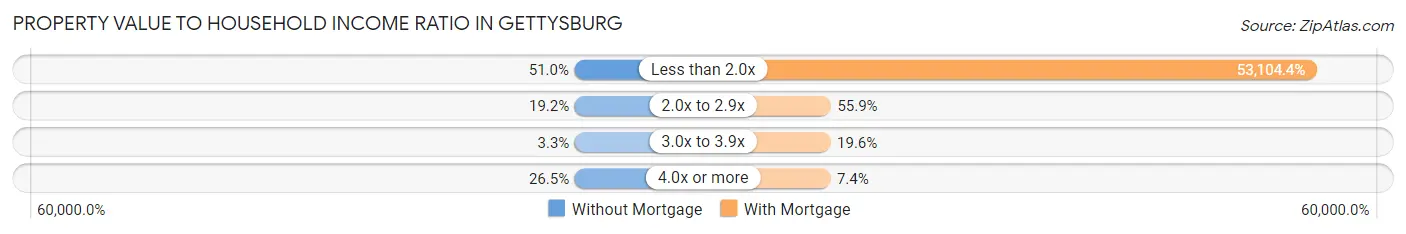
| Value-to-Income Ratio | Without Mortgage | With Mortgage |
| Less than 2.0x | 125 (51.0%) | 108,333 (53,104.4%) |
| 2.0x to 2.9x | 47 (19.2%) | 114 (55.9%) |
| 3.0x to 3.9x | 8 (3.3%) | 40 (19.6%) |
| 4.0x or more | 65 (26.5%) | 15 (7.3%) |
| Total | 245 (100.0%) | 204 (100.0%) |
Real Estate Taxes by Mortgage Status in Gettysburg
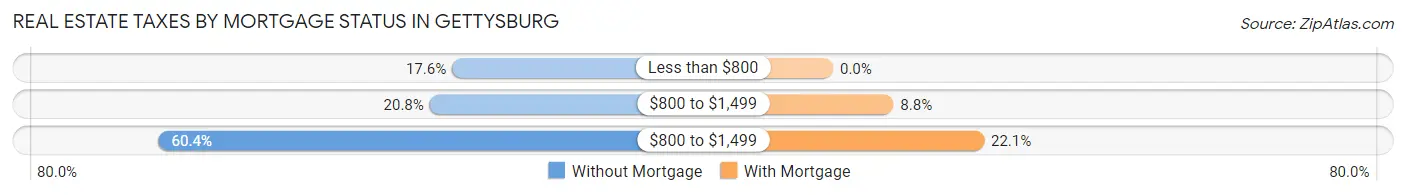
| Property Taxes | Without Mortgage | With Mortgage |
| Less than $800 | 43 (17.5%) | 0 (0.0%) |
| $800 to $1,499 | 51 (20.8%) | 18 (8.8%) |
| $800 to $1,499 | 148 (60.4%) | 45 (22.1%) |
| Total | 245 (100.0%) | 204 (100.0%) |
Health & Disability in Gettysburg
Health Insurance Coverage by Age in Gettysburg
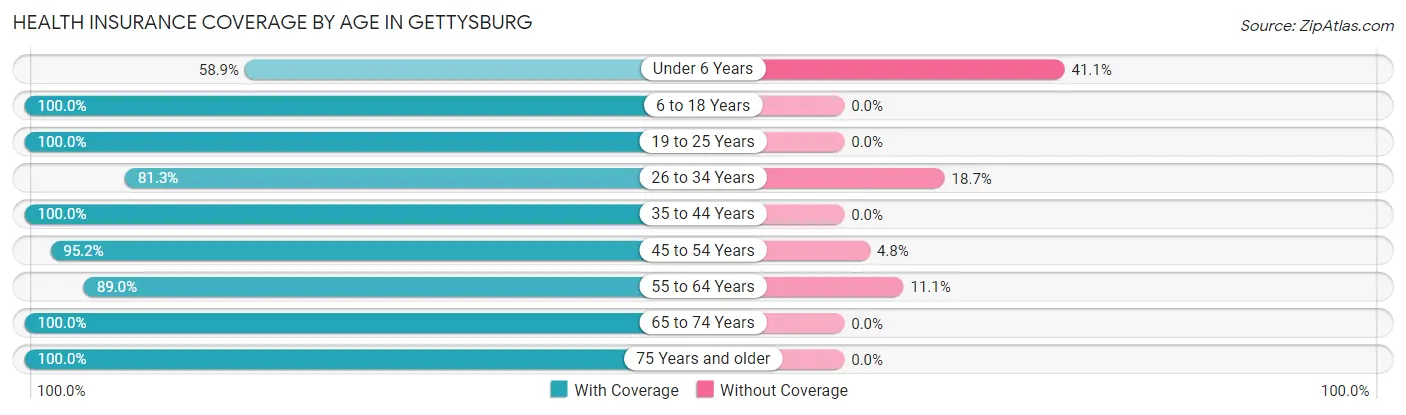
| Age Bracket | With Coverage | Without Coverage |
| Under 6 Years | 66 (58.9%) | 46 (41.1%) |
| 6 to 18 Years | 259 (100.0%) | 0 (0.0%) |
| 19 to 25 Years | 72 (100.0%) | 0 (0.0%) |
| 26 to 34 Years | 126 (81.3%) | 29 (18.7%) |
| 35 to 44 Years | 147 (100.0%) | 0 (0.0%) |
| 45 to 54 Years | 159 (95.2%) | 8 (4.8%) |
| 55 to 64 Years | 161 (88.9%) | 20 (11.1%) |
| 65 to 74 Years | 159 (100.0%) | 0 (0.0%) |
| 75 Years and older | 143 (100.0%) | 0 (0.0%) |
| Total | 1,292 (92.6%) | 103 (7.4%) |
Health Insurance Coverage by Citizenship Status in Gettysburg
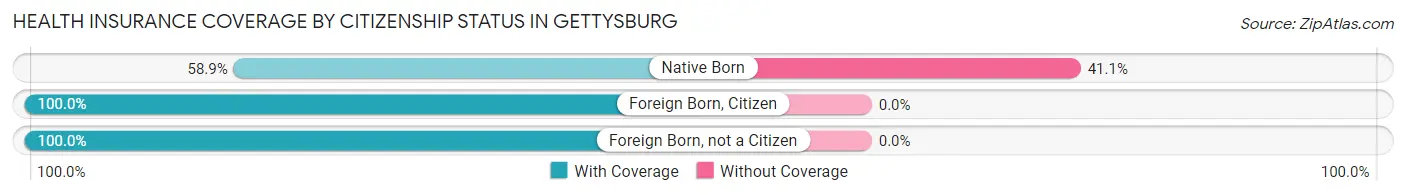
| Citizenship Status | With Coverage | Without Coverage |
| Native Born | 66 (58.9%) | 46 (41.1%) |
| Foreign Born, Citizen | 259 (100.0%) | 0 (0.0%) |
| Foreign Born, not a Citizen | 72 (100.0%) | 0 (0.0%) |
Health Insurance Coverage by Household Income in Gettysburg
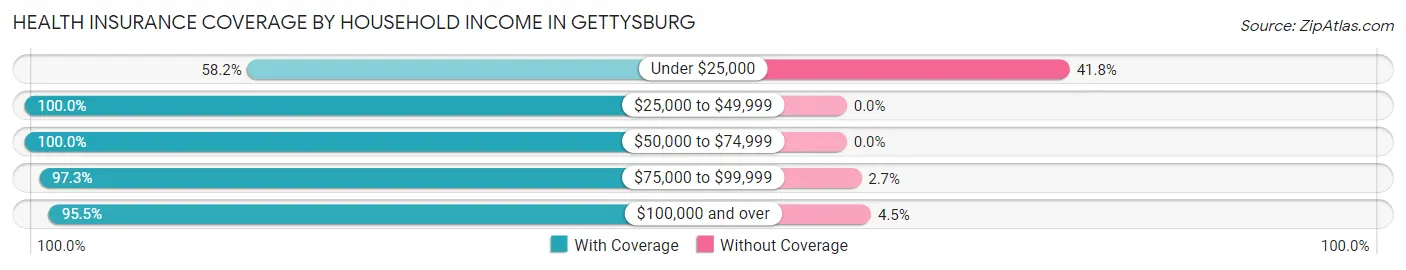
| Household Income | With Coverage | Without Coverage |
| Under $25,000 | 99 (58.2%) | 71 (41.8%) |
| $25,000 to $49,999 | 229 (100.0%) | 0 (0.0%) |
| $50,000 to $74,999 | 172 (100.0%) | 0 (0.0%) |
| $75,000 to $99,999 | 287 (97.3%) | 8 (2.7%) |
| $100,000 and over | 505 (95.5%) | 24 (4.5%) |
Public vs Private Health Insurance Coverage by Age in Gettysburg
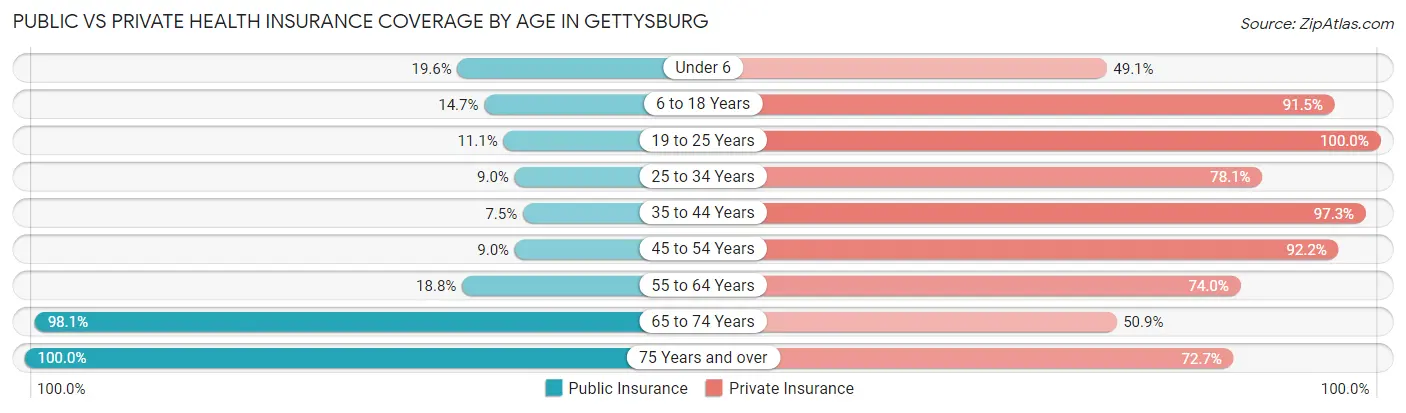
| Age Bracket | Public Insurance | Private Insurance |
| Under 6 | 22 (19.6%) | 55 (49.1%) |
| 6 to 18 Years | 38 (14.7%) | 237 (91.5%) |
| 19 to 25 Years | 8 (11.1%) | 72 (100.0%) |
| 25 to 34 Years | 14 (9.0%) | 121 (78.1%) |
| 35 to 44 Years | 11 (7.5%) | 143 (97.3%) |
| 45 to 54 Years | 15 (9.0%) | 154 (92.2%) |
| 55 to 64 Years | 34 (18.8%) | 134 (74.0%) |
| 65 to 74 Years | 156 (98.1%) | 81 (50.9%) |
| 75 Years and over | 143 (100.0%) | 104 (72.7%) |
| Total | 441 (31.6%) | 1,101 (78.9%) |
Disability Status by Sex by Age in Gettysburg
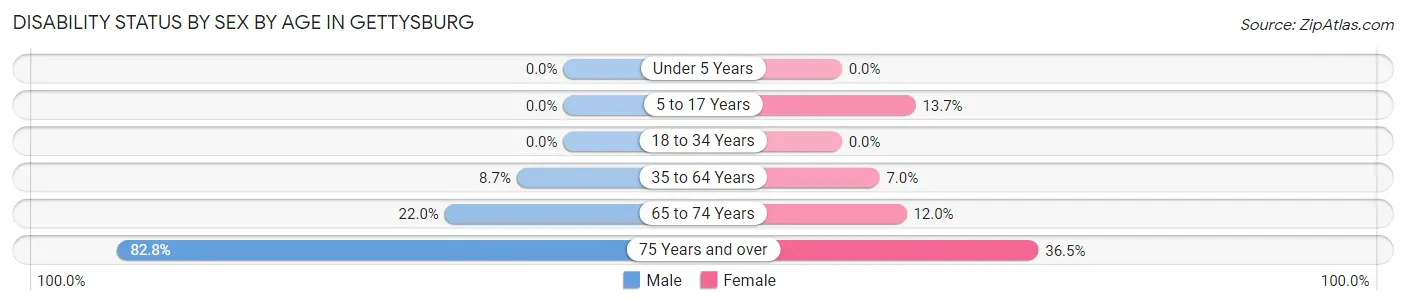
| Age Bracket | Male | Female |
| Under 5 Years | 0 (0.0%) | 0 (0.0%) |
| 5 to 17 Years | 0 (0.0%) | 19 (13.7%) |
| 18 to 34 Years | 0 (0.0%) | 0 (0.0%) |
| 35 to 64 Years | 23 (8.6%) | 16 (7.0%) |
| 65 to 74 Years | 13 (22.0%) | 12 (12.0%) |
| 75 Years and over | 48 (82.8%) | 31 (36.5%) |
Disability Class by Sex by Age in Gettysburg
Disability Class: Hearing Difficulty
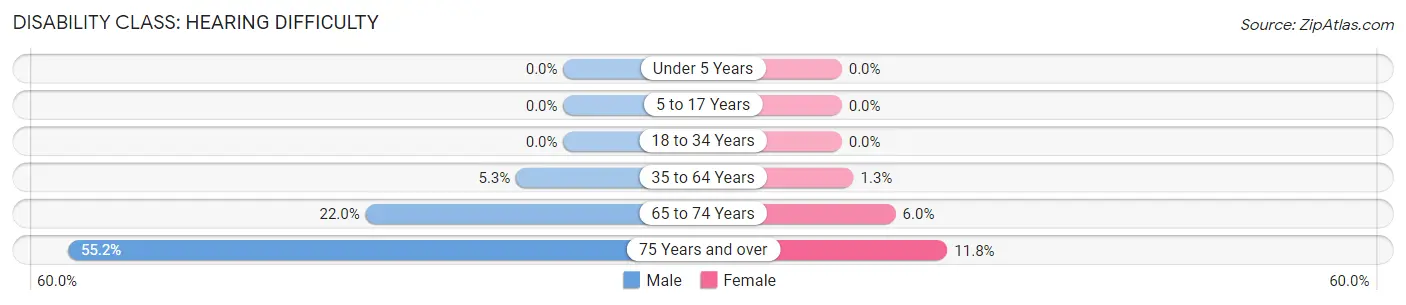
| Age Bracket | Male | Female |
| Under 5 Years | 0 (0.0%) | 0 (0.0%) |
| 5 to 17 Years | 0 (0.0%) | 0 (0.0%) |
| 18 to 34 Years | 0 (0.0%) | 0 (0.0%) |
| 35 to 64 Years | 14 (5.3%) | 3 (1.3%) |
| 65 to 74 Years | 13 (22.0%) | 6 (6.0%) |
| 75 Years and over | 32 (55.2%) | 10 (11.8%) |
Disability Class: Vision Difficulty
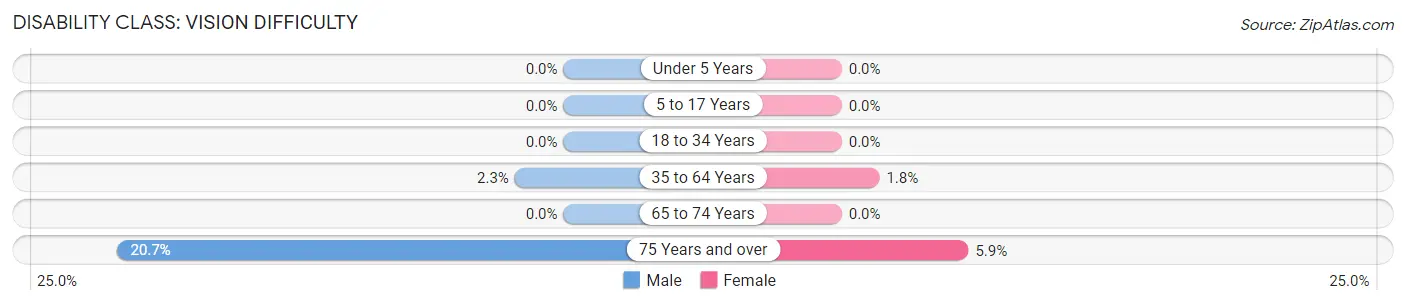
| Age Bracket | Male | Female |
| Under 5 Years | 0 (0.0%) | 0 (0.0%) |
| 5 to 17 Years | 0 (0.0%) | 0 (0.0%) |
| 18 to 34 Years | 0 (0.0%) | 0 (0.0%) |
| 35 to 64 Years | 6 (2.3%) | 4 (1.8%) |
| 65 to 74 Years | 0 (0.0%) | 0 (0.0%) |
| 75 Years and over | 12 (20.7%) | 5 (5.9%) |
Disability Class: Cognitive Difficulty
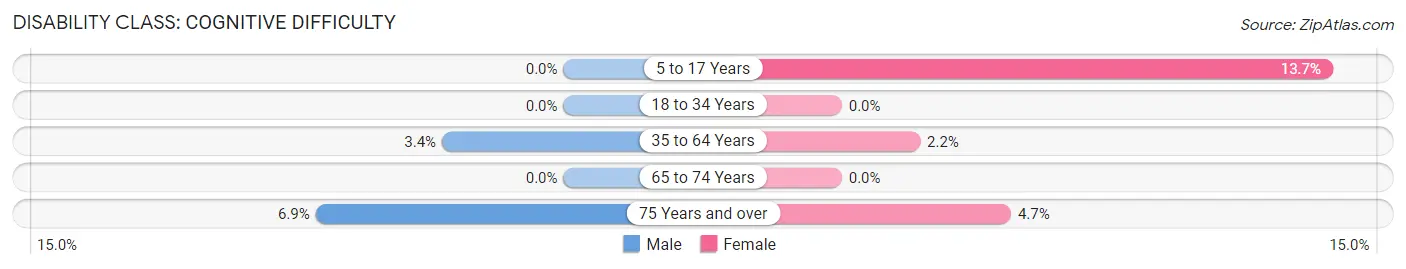
| Age Bracket | Male | Female |
| 5 to 17 Years | 0 (0.0%) | 19 (13.7%) |
| 18 to 34 Years | 0 (0.0%) | 0 (0.0%) |
| 35 to 64 Years | 9 (3.4%) | 5 (2.2%) |
| 65 to 74 Years | 0 (0.0%) | 0 (0.0%) |
| 75 Years and over | 4 (6.9%) | 4 (4.7%) |
Disability Class: Ambulatory Difficulty
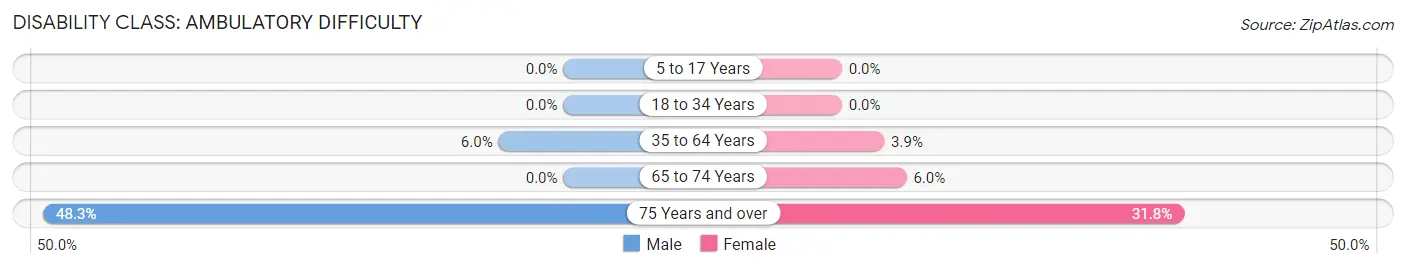
| Age Bracket | Male | Female |
| 5 to 17 Years | 0 (0.0%) | 0 (0.0%) |
| 18 to 34 Years | 0 (0.0%) | 0 (0.0%) |
| 35 to 64 Years | 16 (6.0%) | 9 (3.9%) |
| 65 to 74 Years | 0 (0.0%) | 6 (6.0%) |
| 75 Years and over | 28 (48.3%) | 27 (31.8%) |
Disability Class: Self-Care Difficulty
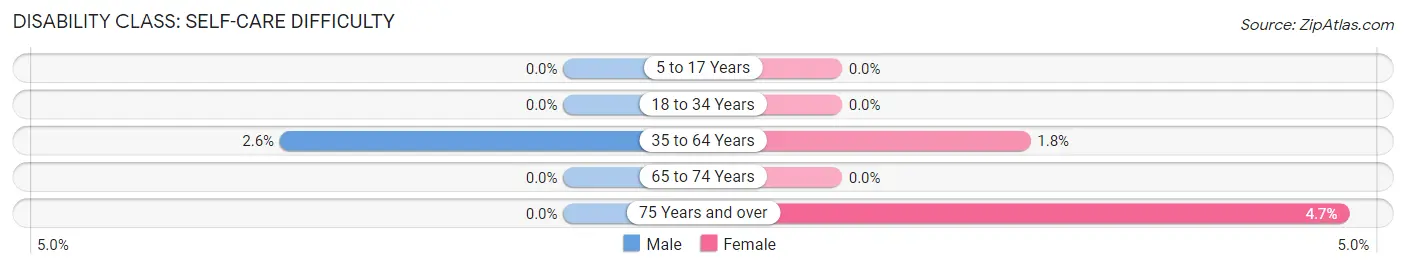
| Age Bracket | Male | Female |
| 5 to 17 Years | 0 (0.0%) | 0 (0.0%) |
| 18 to 34 Years | 0 (0.0%) | 0 (0.0%) |
| 35 to 64 Years | 7 (2.6%) | 4 (1.8%) |
| 65 to 74 Years | 0 (0.0%) | 0 (0.0%) |
| 75 Years and over | 0 (0.0%) | 4 (4.7%) |
Technology Access in Gettysburg
Computing Device Access in Gettysburg
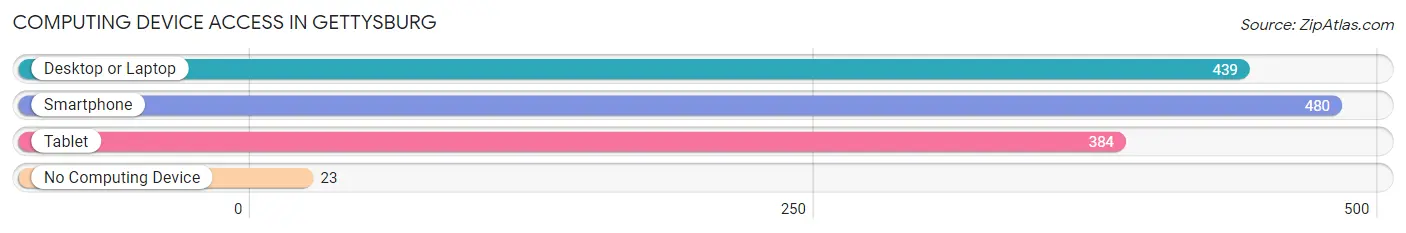
| Device Type | # Households | % Households |
| Desktop or Laptop | 439 | 77.3% |
| Smartphone | 480 | 84.5% |
| Tablet | 384 | 67.6% |
| No Computing Device | 23 | 4.1% |
| Total | 568 | 100.0% |
Internet Access in Gettysburg
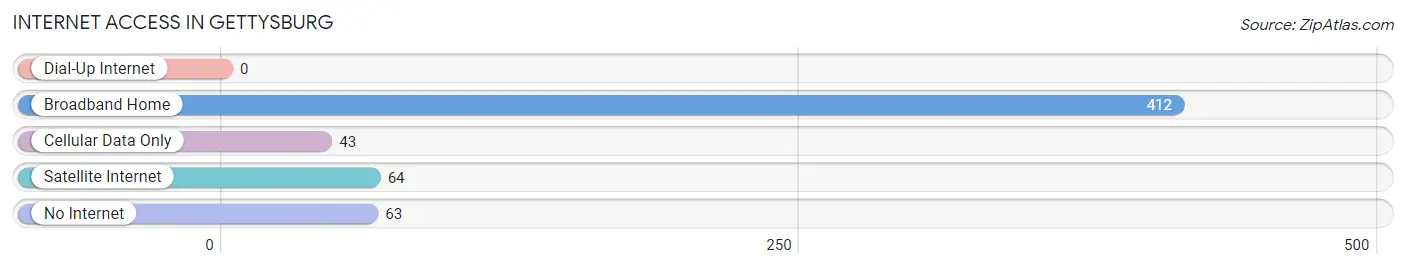
| Internet Type | # Households | % Households |
| Dial-Up Internet | 0 | 0.0% |
| Broadband Home | 412 | 72.5% |
| Cellular Data Only | 43 | 7.6% |
| Satellite Internet | 64 | 11.3% |
| No Internet | 63 | 11.1% |
| Total | 568 | 100.0% |
Gettysburg Summary
History
The town of Gettysburg, South Dakota is located in Potter County, in the north-central part of the state. It was founded in 1883 by a group of settlers from Gettysburg, Pennsylvania, who were looking for a new home in the West. The town was named after the famous Civil War battle that had taken place in Pennsylvania in 1863.
The first settlers in Gettysburg were mostly farmers, and the town quickly grew to become an important agricultural center. The town was incorporated in 1887, and by the turn of the century, it had become a thriving community with a population of over 1,000.
The town was a major stop on the Chicago, Milwaukee, St. Paul and Pacific Railroad, which ran through the town from 1887 to 1971. This railroad was a major factor in the growth of the town, as it allowed for the transportation of goods and people to and from the area.
The town was also home to a number of businesses, including a flour mill, a creamery, a lumber yard, a bank, a hotel, and a number of stores. The town also had a newspaper, the Gettysburg Times, which was published from 1887 to 1971.
The town was also home to a number of churches, including the Methodist Episcopal Church, the Congregational Church, the Presbyterian Church, and the Catholic Church.
Geography
Gettysburg is located in Potter County, in the north-central part of South Dakota. It is situated on the banks of the White River, which flows through the town. The town is located about 40 miles north of Pierre, the state capital.
The town is located in a semi-arid region, with an average annual precipitation of about 16 inches. The average temperature in the summer is around 80 degrees Fahrenheit, and in the winter it is around 20 degrees Fahrenheit.
The town is located in a flat, open area, with rolling hills to the north and east. The town is surrounded by farmland, and there are several small lakes in the area.
Economy
The economy of Gettysburg is largely based on agriculture. The town is home to a number of farms, which produce a variety of crops, including wheat, corn, soybeans, and alfalfa. The town is also home to a number of livestock operations, which produce beef, pork, and dairy products.
The town is also home to a number of businesses, including a lumber yard, a bank, a hotel, and a number of stores. The town also has a number of restaurants, bars, and other businesses.
Demographics
As of the 2010 census, the population of Gettysburg was 1,072. The town has a population density of about 1,000 people per square mile. The median age of the population is 44.7 years, and the median household income is $41,250.
The town is predominantly white, with about 95% of the population being white. The town also has a small Hispanic population, with about 4% of the population being Hispanic. The town also has a small Native American population, with about 1% of the population being Native American.
Conclusion
Gettysburg, South Dakota is a small town located in Potter County, in the north-central part of the state. It was founded in 1883 by a group of settlers from Gettysburg, Pennsylvania, and it has since become an important agricultural center. The town is home to a number of businesses, including a lumber yard, a bank, a hotel, and a number of stores. The town also has a number of churches, and it is home to a population of about 1,072 people. The town has a predominantly white population, with a small Hispanic and Native American population. The town is largely based on agriculture, and it is a major stop on the Chicago, Milwaukee, St. Paul and Pacific Railroad.
Common Questions
What is Per Capita Income in Gettysburg?
Per Capita income in Gettysburg is $31,629.
What is the Median Family Income in Gettysburg?
Median Family Income in Gettysburg is $87,969.
What is the Median Household income in Gettysburg?
Median Household Income in Gettysburg is $66,094.
What is Income or Wage Gap in Gettysburg?
Income or Wage Gap in Gettysburg is 46.8%.
Women in Gettysburg earn 53.2 cents for every dollar earned by a man.
What is Inequality or Gini Index in Gettysburg?
Inequality or Gini Index in Gettysburg is 0.38.
What is the Total Population of Gettysburg?
Total Population of Gettysburg is 1,440.
What is the Total Male Population of Gettysburg?
Total Male Population of Gettysburg is 676.
What is the Total Female Population of Gettysburg?
Total Female Population of Gettysburg is 764.
What is the Ratio of Males per 100 Females in Gettysburg?
There are 88.48 Males per 100 Females in Gettysburg.
What is the Ratio of Females per 100 Males in Gettysburg?
There are 113.02 Females per 100 Males in Gettysburg.
What is the Median Population Age in Gettysburg?
Median Population Age in Gettysburg is 43.3 Years.
What is the Average Family Size in Gettysburg
Average Family Size in Gettysburg is 3.3 People.
What is the Average Household Size in Gettysburg
Average Household Size in Gettysburg is 2.5 People.
How Large is the Labor Force in Gettysburg?
There are 760 People in the Labor Forcein in Gettysburg.
What is the Percentage of People in the Labor Force in Gettysburg?
66.7% of People are in the Labor Force in Gettysburg.
What is the Unemployment Rate in Gettysburg?
Unemployment Rate in Gettysburg is 2.6%.