Bonesteel, SD Map & Demographics
Bonesteel Map
Bonesteel Overview
$20,206
PER CAPITA INCOME
$69,583
AVG FAMILY INCOME
$40,938
AVG HOUSEHOLD INCOME
32.4%
WAGE / INCOME GAP [ % ]
67.6¢/ $1
WAGE / INCOME GAP [ $ ]
0.40
INEQUALITY / GINI INDEX
336
TOTAL POPULATION
196
MALE POPULATION
140
FEMALE POPULATION
140.00
MALES / 100 FEMALES
71.43
FEMALES / 100 MALES
42.2
MEDIAN AGE
4.1
AVG FAMILY SIZE
2.9
AVG HOUSEHOLD SIZE
92
LABOR FORCE [ PEOPLE ]
36.2%
PERCENT IN LABOR FORCE
3.3%
UNEMPLOYMENT RATE
Bonesteel Zip Codes
Bonesteel Area Codes
Income in Bonesteel
Income Overview in Bonesteel
Per Capita Income in Bonesteel is $20,206, while median incomes of families and households are $69,583 and $40,938 respectively.
| Characteristic | Number | Measure |
| Per Capita Income | 336 | $20,206 |
| Median Family Income | 62 | $69,583 |
| Mean Family Income | 62 | $76,700 |
| Median Household Income | 113 | $40,938 |
| Mean Household Income | 113 | $55,701 |
| Income Deficit | 62 | $0 |
| Wage / Income Gap (%) | 336 | 32.35% |
| Wage / Income Gap ($) | 336 | 67.65¢ per $1 |
| Gini / Inequality Index | 336 | 0.40 |
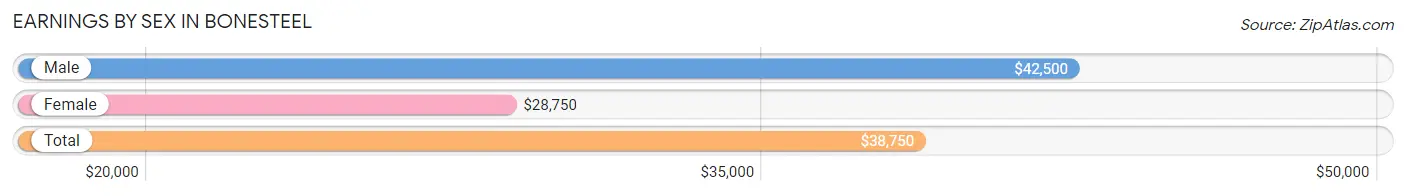
Earnings by Sex in Bonesteel
Average Earnings in Bonesteel are $38,750, $42,500 for men and $28,750 for women, a difference of 32.4%.
| Sex | Number | Average Earnings |
| Male | 64 (68.8%) | $42,500 |
| Female | 29 (31.2%) | $28,750 |
| Total | 93 (100.0%) | $38,750 |
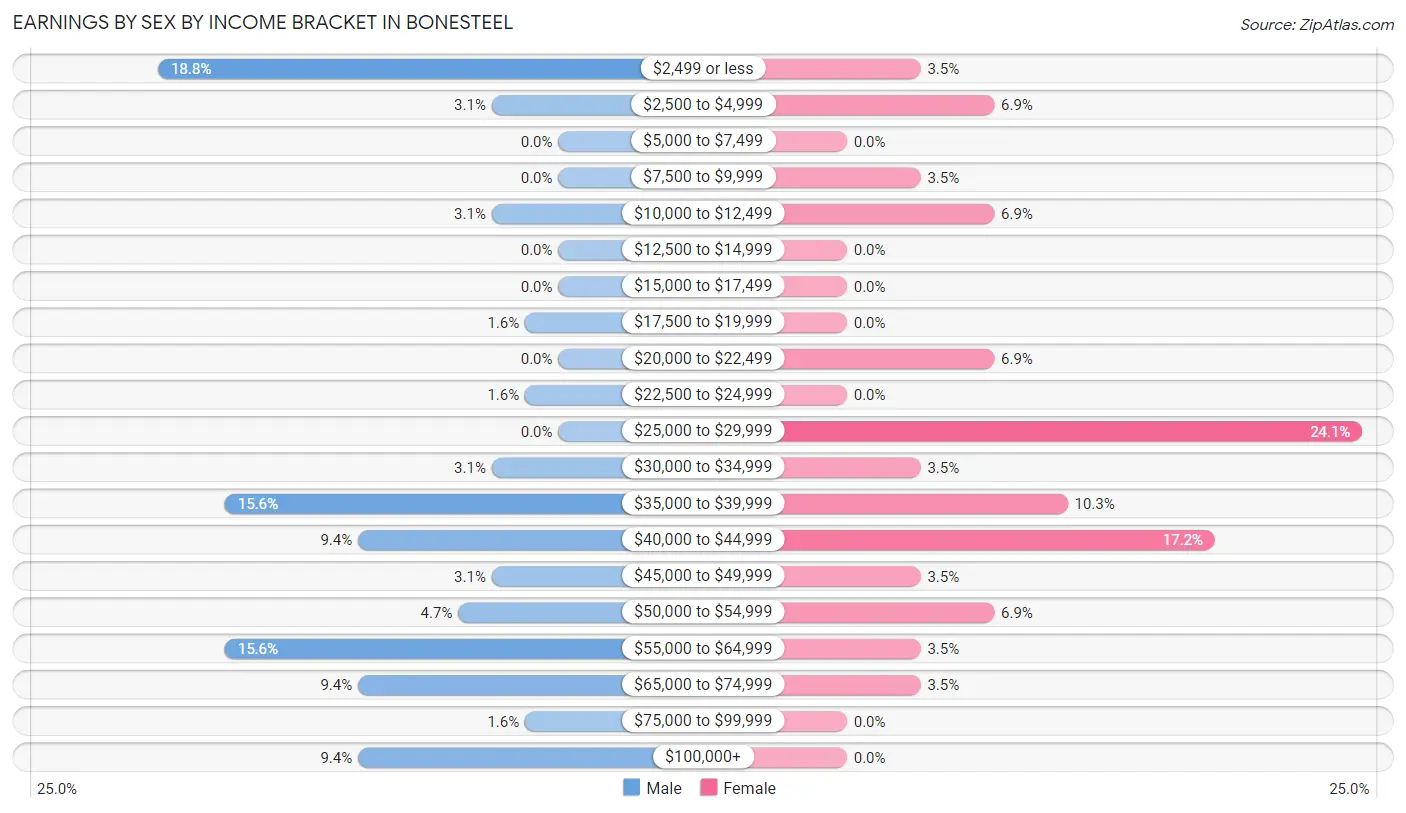
Earnings by Sex by Income Bracket in Bonesteel
The most common earnings brackets in Bonesteel are $2,499 or less for men (12 | 18.8%) and $25,000 to $29,999 for women (7 | 24.1%).
| Income | Male | Female |
| $2,499 or less | 12 (18.8%) | 1 (3.5%) |
| $2,500 to $4,999 | 2 (3.1%) | 2 (6.9%) |
| $5,000 to $7,499 | 0 (0.0%) | 0 (0.0%) |
| $7,500 to $9,999 | 0 (0.0%) | 1 (3.5%) |
| $10,000 to $12,499 | 2 (3.1%) | 2 (6.9%) |
| $12,500 to $14,999 | 0 (0.0%) | 0 (0.0%) |
| $15,000 to $17,499 | 0 (0.0%) | 0 (0.0%) |
| $17,500 to $19,999 | 1 (1.6%) | 0 (0.0%) |
| $20,000 to $22,499 | 0 (0.0%) | 2 (6.9%) |
| $22,500 to $24,999 | 1 (1.6%) | 0 (0.0%) |
| $25,000 to $29,999 | 0 (0.0%) | 7 (24.1%) |
| $30,000 to $34,999 | 2 (3.1%) | 1 (3.5%) |
| $35,000 to $39,999 | 10 (15.6%) | 3 (10.3%) |
| $40,000 to $44,999 | 6 (9.4%) | 5 (17.2%) |
| $45,000 to $49,999 | 2 (3.1%) | 1 (3.5%) |
| $50,000 to $54,999 | 3 (4.7%) | 2 (6.9%) |
| $55,000 to $64,999 | 10 (15.6%) | 1 (3.5%) |
| $65,000 to $74,999 | 6 (9.4%) | 1 (3.5%) |
| $75,000 to $99,999 | 1 (1.6%) | 0 (0.0%) |
| $100,000+ | 6 (9.4%) | 0 (0.0%) |
| Total | 64 (100.0%) | 29 (100.0%) |
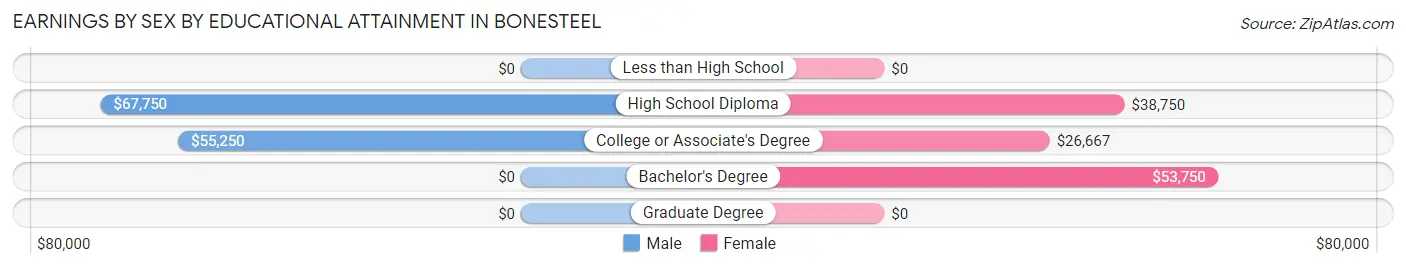
Earnings by Sex by Educational Attainment in Bonesteel
Average earnings in Bonesteel are $55,000 for men and $33,750 for women, a difference of 38.6%. Men with an educational attainment of high school diploma enjoy the highest average annual earnings of $67,750, while those with college or associate's degree education earn the least with $55,250. Women with an educational attainment of bachelor's degree earn the most with the average annual earnings of $53,750, while those with college or associate's degree education have the smallest earnings of $26,667.
| Educational Attainment | Male Income | Female Income |
| Less than High School | - | - |
| High School Diploma | $67,750 | $38,750 |
| College or Associate's Degree | $55,250 | $26,667 |
| Bachelor's Degree | - | - |
| Graduate Degree | - | - |
| Total | $55,000 | $33,750 |
Family Income in Bonesteel
Family Income Brackets in Bonesteel
According to the Bonesteel family income data, there are 14 families falling into the $35,000 to $49,999 income range, which is the most common income bracket and makes up 22.6% of all families.
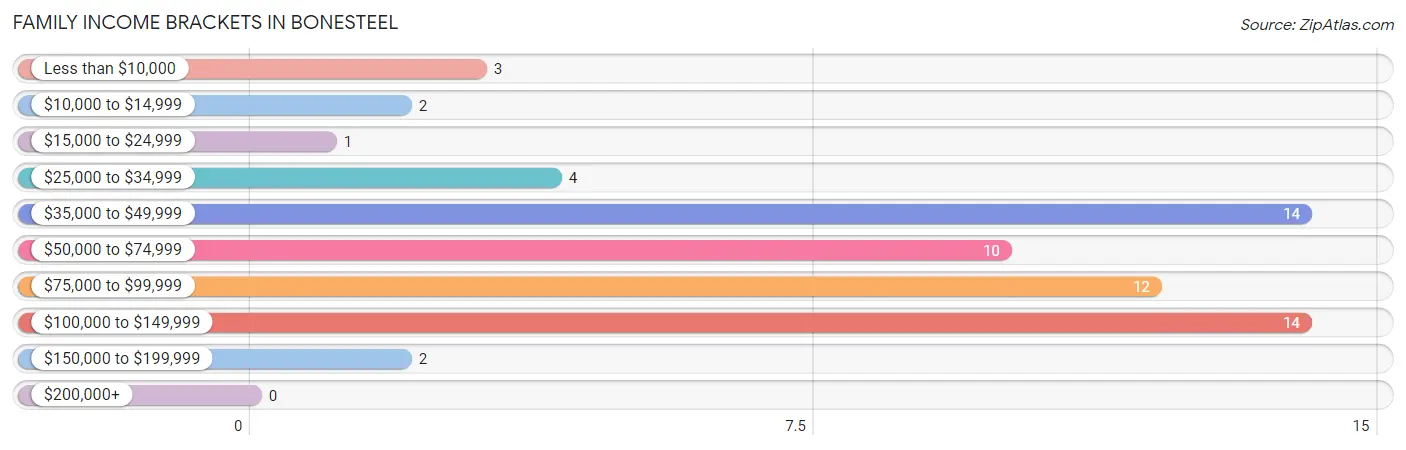
| Income Bracket | # Families | % Families |
| Less than $10,000 | 3 | 4.8% |
| $10,000 to $14,999 | 2 | 3.2% |
| $15,000 to $24,999 | 1 | 1.6% |
| $25,000 to $34,999 | 4 | 6.5% |
| $35,000 to $49,999 | 14 | 22.6% |
| $50,000 to $74,999 | 10 | 16.1% |
| $75,000 to $99,999 | 12 | 19.4% |
| $100,000 to $149,999 | 14 | 22.6% |
| $150,000 to $199,999 | 2 | 3.2% |
| $200,000+ | 0 | 0.0% |
Family Income by Famaliy Size in Bonesteel
6-person families (6 | 9.7%) account for the highest median family income in Bonesteel with $130,625 per family, while 3-person families (10 | 16.1%) have the highest median income of $40,167 per family member.
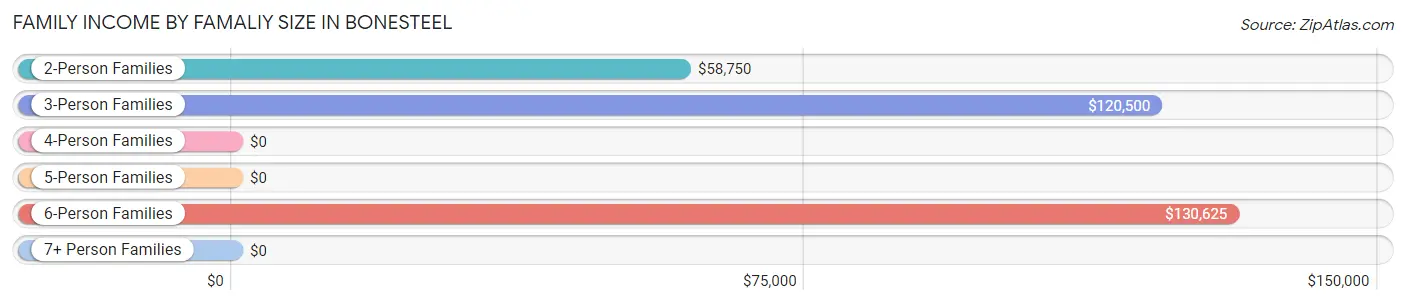
| Income Bracket | # Families | Median Income |
| 2-Person Families | 41 (66.1%) | $58,750 |
| 3-Person Families | 10 (16.1%) | $120,500 |
| 4-Person Families | 5 (8.1%) | $0 |
| 5-Person Families | 0 (0.0%) | $0 |
| 6-Person Families | 6 (9.7%) | $130,625 |
| 7+ Person Families | 0 (0.0%) | $0 |
| Total | 62 (100.0%) | $69,583 |
Family Income by Number of Earners in Bonesteel
The median family income in Bonesteel is $69,583, with families comprising 2 earners (18) having the highest median family income of $120,500, while families with 1 earner (19) have the lowest median family income of $39,375, accounting for 29.0% and 30.6% of families, respectively.
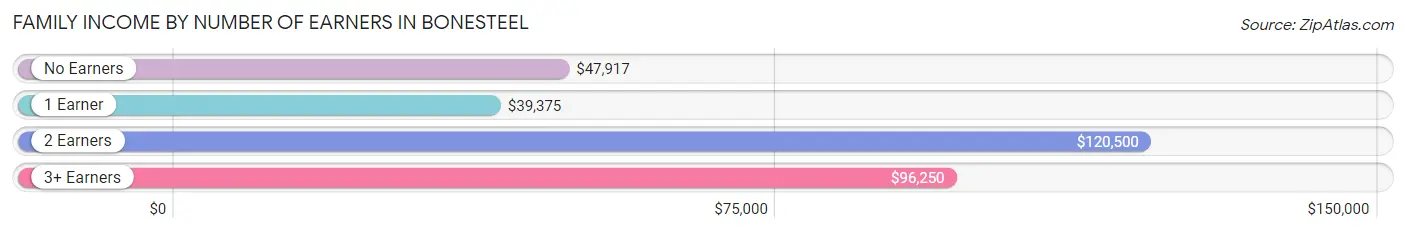
| Number of Earners | # Families | Median Income |
| No Earners | 21 (33.9%) | $47,917 |
| 1 Earner | 19 (30.6%) | $39,375 |
| 2 Earners | 18 (29.0%) | $120,500 |
| 3+ Earners | 4 (6.5%) | $96,250 |
| Total | 62 (100.0%) | $69,583 |
Household Income in Bonesteel
Household Income Brackets in Bonesteel
With 29 households falling in the category, the $35,000 to $49,999 income range is the most frequent in Bonesteel, accounting for 25.7% of all households.
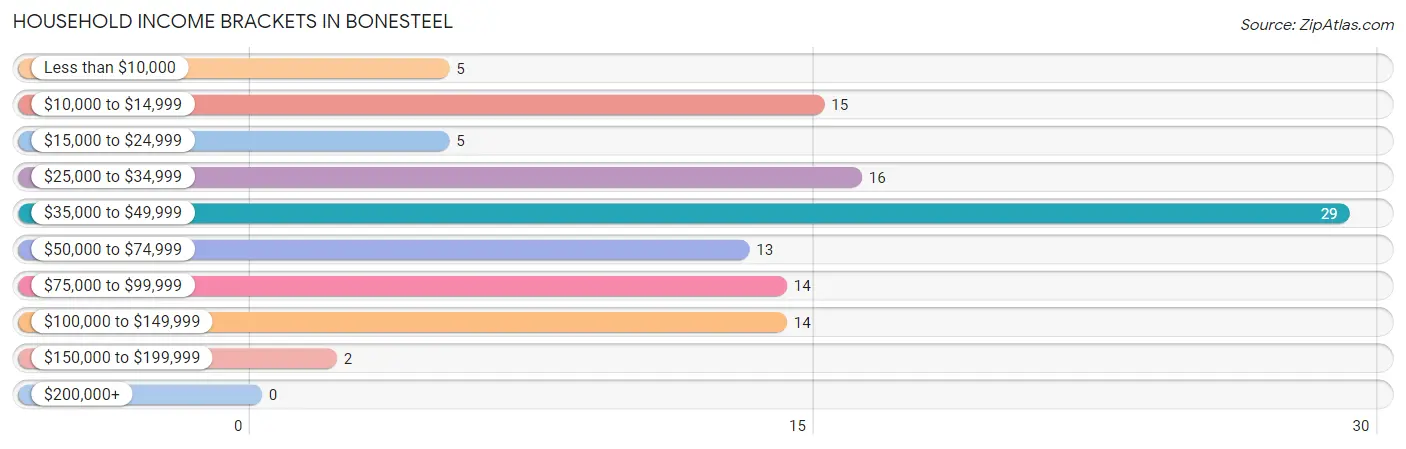
| Income Bracket | # Households | % Households |
| Less than $10,000 | 5 | 4.4% |
| $10,000 to $14,999 | 15 | 13.3% |
| $15,000 to $24,999 | 5 | 4.4% |
| $25,000 to $34,999 | 16 | 14.2% |
| $35,000 to $49,999 | 29 | 25.7% |
| $50,000 to $74,999 | 13 | 11.5% |
| $75,000 to $99,999 | 14 | 12.4% |
| $100,000 to $149,999 | 14 | 12.4% |
| $150,000 to $199,999 | 2 | 1.8% |
| $200,000+ | 0 | 0.0% |
Household Income by Householder Age in Bonesteel
The median household income in Bonesteel is $40,938, with the highest median household income of $95,000 found in the 25 to 44 years age bracket for the primary householder. A total of 24 households (21.2%) fall into this category. Meanwhile, the 15 to 24 years age bracket for the primary householder has the lowest median household income of $0, with 4 households (3.5%) in this group.
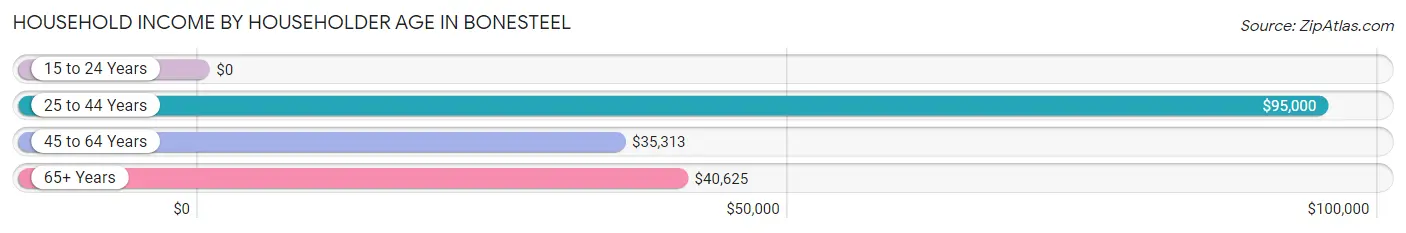
| Income Bracket | # Households | Median Income |
| 15 to 24 Years | 4 (3.5%) | $0 |
| 25 to 44 Years | 24 (21.2%) | $95,000 |
| 45 to 64 Years | 39 (34.5%) | $35,313 |
| 65+ Years | 46 (40.7%) | $40,625 |
| Total | 113 (100.0%) | $40,938 |
Poverty in Bonesteel
Income Below Poverty by Sex and Age in Bonesteel
With 32.3% poverty level for males and 19.0% for females among the residents of Bonesteel, 5 year old males and 45 to 54 year old females are the most vulnerable to poverty, with 14 males (100.0%) and 19 females (76.0%) in their respective age groups living below the poverty level.
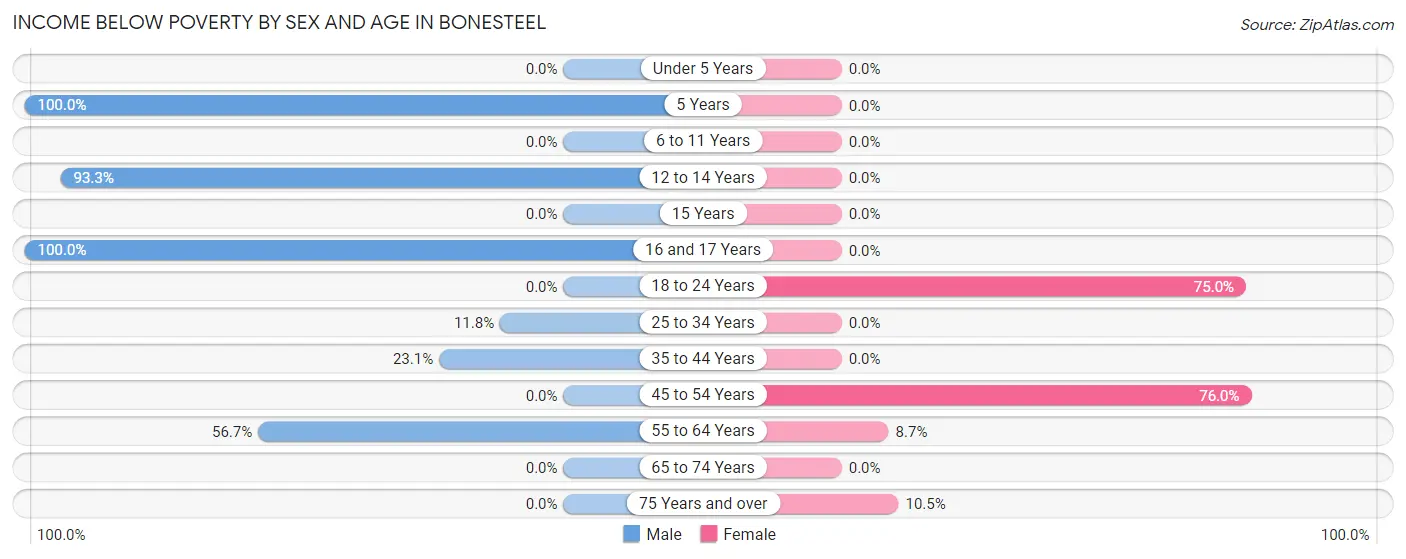
| Age Bracket | Male | Female |
| Under 5 Years | 0 (0.0%) | 0 (0.0%) |
| 5 Years | 14 (100.0%) | 0 (0.0%) |
| 6 to 11 Years | 0 (0.0%) | 0 (0.0%) |
| 12 to 14 Years | 14 (93.3%) | 0 (0.0%) |
| 15 Years | 0 (0.0%) | 0 (0.0%) |
| 16 and 17 Years | 12 (100.0%) | 0 (0.0%) |
| 18 to 24 Years | 0 (0.0%) | 3 (75.0%) |
| 25 to 34 Years | 2 (11.8%) | 0 (0.0%) |
| 35 to 44 Years | 3 (23.1%) | 0 (0.0%) |
| 45 to 54 Years | 0 (0.0%) | 19 (76.0%) |
| 55 to 64 Years | 17 (56.7%) | 2 (8.7%) |
| 65 to 74 Years | 0 (0.0%) | 0 (0.0%) |
| 75 Years and over | 0 (0.0%) | 2 (10.5%) |
| Total | 62 (32.3%) | 26 (19.0%) |
Income Above Poverty by Sex and Age in Bonesteel
According to the poverty statistics in Bonesteel, males aged under 5 years and females aged under 5 years are the age groups that are most secure financially, with 100.0% of males and 100.0% of females in these age groups living above the poverty line.
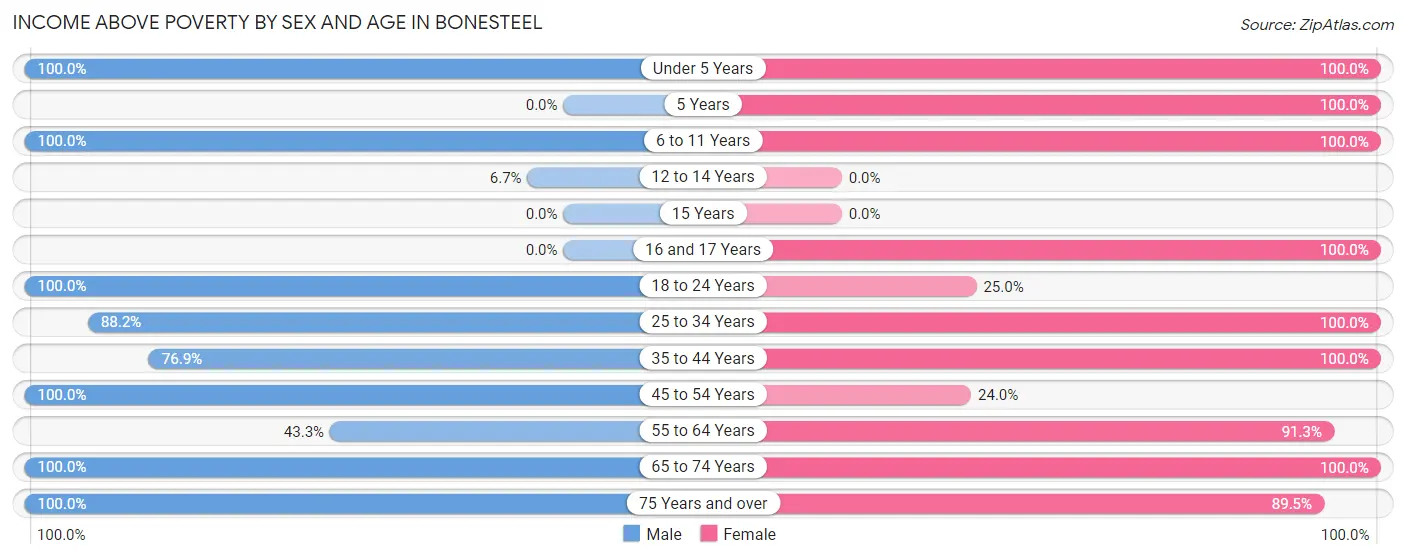
| Age Bracket | Male | Female |
| Under 5 Years | 12 (100.0%) | 11 (100.0%) |
| 5 Years | 0 (0.0%) | 6 (100.0%) |
| 6 to 11 Years | 6 (100.0%) | 16 (100.0%) |
| 12 to 14 Years | 1 (6.7%) | 0 (0.0%) |
| 15 Years | 0 (0.0%) | 0 (0.0%) |
| 16 and 17 Years | 0 (0.0%) | 3 (100.0%) |
| 18 to 24 Years | 27 (100.0%) | 1 (25.0%) |
| 25 to 34 Years | 15 (88.2%) | 10 (100.0%) |
| 35 to 44 Years | 10 (76.9%) | 6 (100.0%) |
| 45 to 54 Years | 11 (100.0%) | 6 (24.0%) |
| 55 to 64 Years | 13 (43.3%) | 21 (91.3%) |
| 65 to 74 Years | 10 (100.0%) | 14 (100.0%) |
| 75 Years and over | 25 (100.0%) | 17 (89.5%) |
| Total | 130 (67.7%) | 111 (81.0%) |
Income Below Poverty Among Married-Couple Families in Bonesteel
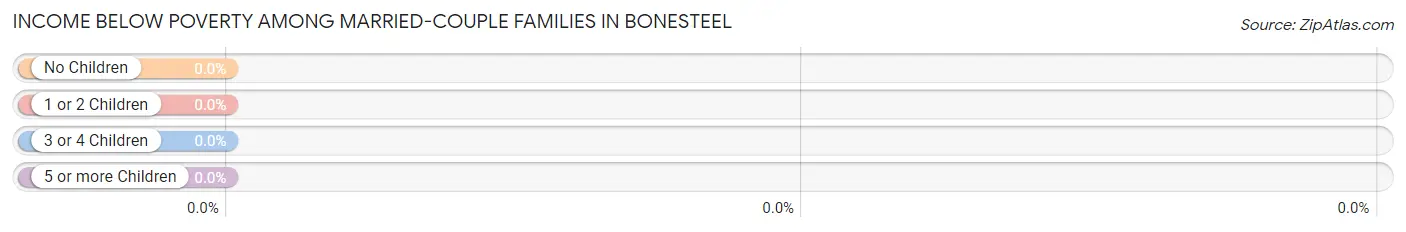
| Children | Above Poverty | Below Poverty |
| No Children | 37 (100.0%) | 0 (0.0%) |
| 1 or 2 Children | 4 (100.0%) | 0 (0.0%) |
| 3 or 4 Children | 6 (100.0%) | 0 (0.0%) |
| 5 or more Children | 0 (0.0%) | 0 (0.0%) |
| Total | 47 (100.0%) | 0 (0.0%) |
Income Below Poverty Among Single-Parent Households in Bonesteel
According to the poverty data in Bonesteel, 30.0% or 3 single-father households and 40.0% or 2 single-mother households are living below the poverty line. Among single-father households, those with 3 or 4 children have the highest poverty rate, with 3 households (100.0%) experiencing poverty. Likewise, among single-mother households, those with no children have the highest poverty rate, with 2 households (50.0%) falling below the poverty line.
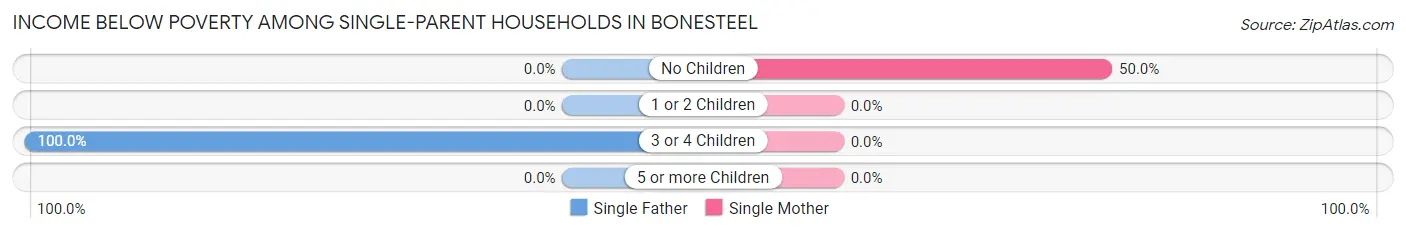
| Children | Single Father | Single Mother |
| No Children | 0 (0.0%) | 2 (50.0%) |
| 1 or 2 Children | 0 (0.0%) | 0 (0.0%) |
| 3 or 4 Children | 3 (100.0%) | 0 (0.0%) |
| 5 or more Children | 0 (0.0%) | 0 (0.0%) |
| Total | 3 (30.0%) | 2 (40.0%) |
Income Below Poverty Among Married-Couple vs Single-Parent Households in Bonesteel
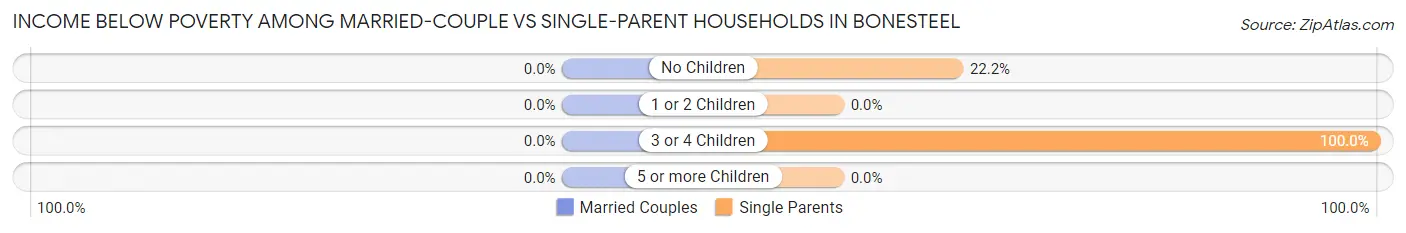
| Children | Married-Couple Families | Single-Parent Households |
| No Children | 0 (0.0%) | 2 (22.2%) |
| 1 or 2 Children | 0 (0.0%) | 0 (0.0%) |
| 3 or 4 Children | 0 (0.0%) | 3 (100.0%) |
| 5 or more Children | 0 (0.0%) | 0 (0.0%) |
| Total | 0 (0.0%) | 5 (33.3%) |
Race in Bonesteel
The most populous races in Bonesteel are White / Caucasian (246 | 73.2%), Native / Alaskan (70 | 20.8%), and Two or more Races (20 | 5.9%).
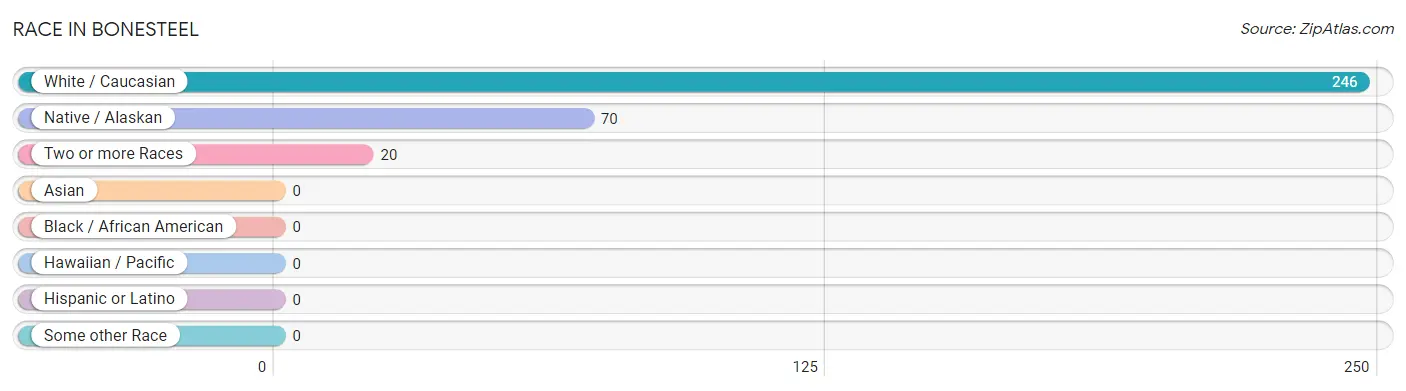
| Race | # Population | % Population |
| Asian | 0 | 0.0% |
| Black / African American | 0 | 0.0% |
| Hawaiian / Pacific | 0 | 0.0% |
| Hispanic or Latino | 0 | 0.0% |
| Native / Alaskan | 70 | 20.8% |
| White / Caucasian | 246 | 73.2% |
| Two or more Races | 20 | 5.9% |
| Some other Race | 0 | 0.0% |
| Total | 336 | 100.0% |
Ancestry in Bonesteel
The most populous ancestries reported in Bonesteel are German (107 | 31.9%), Sioux (90 | 26.8%), Norwegian (54 | 16.1%), English (50 | 14.9%), and American (31 | 9.2%), together accounting for 98.8% of all Bonesteel residents.
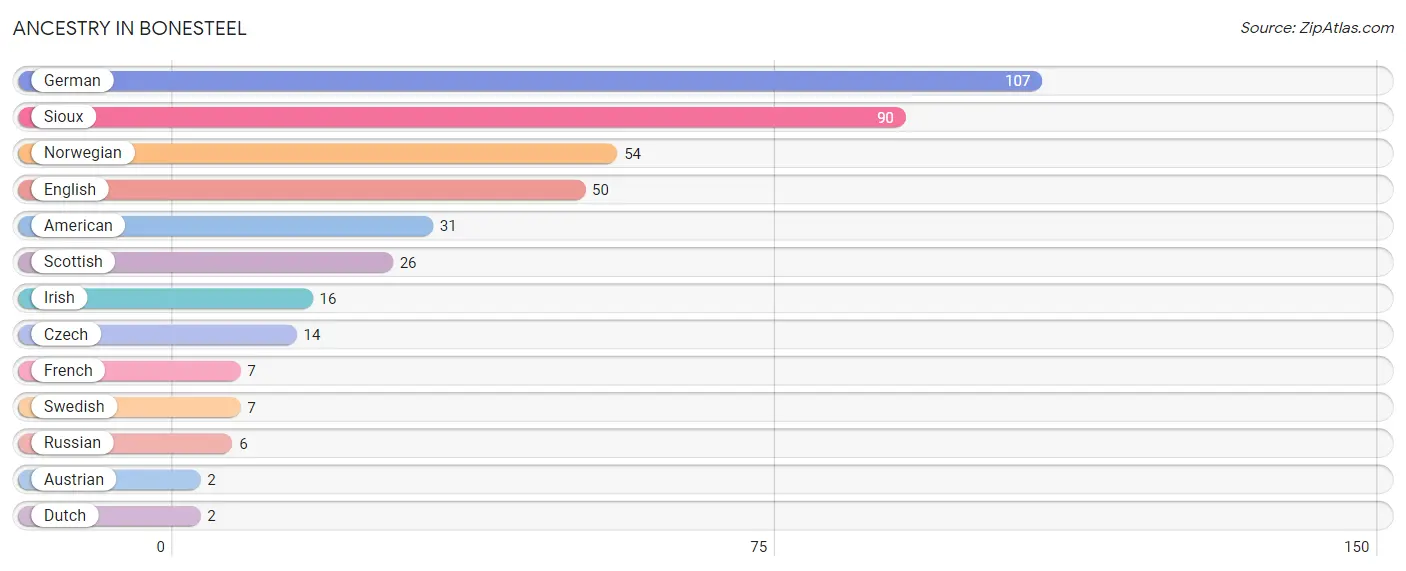
| Ancestry | # Population | % Population |
| American | 31 | 9.2% |
| Austrian | 2 | 0.6% |
| Czech | 14 | 4.2% |
| Dutch | 2 | 0.6% |
| English | 50 | 14.9% |
| French | 7 | 2.1% |
| German | 107 | 31.9% |
| Irish | 16 | 4.8% |
| Norwegian | 54 | 16.1% |
| Russian | 6 | 1.8% |
| Scottish | 26 | 7.7% |
| Sioux | 90 | 26.8% |
| Swedish | 7 | 2.1% | View All 13 Rows |
Immigrants in Bonesteel

| Immigration Origin | # Population | % Population | View All 0 Rows |
Sex and Age in Bonesteel
Sex and Age in Bonesteel
The most populous age groups in Bonesteel are 15 to 19 Years (35 | 17.9%) for men and 60 to 64 Years (20 | 14.3%) for women.
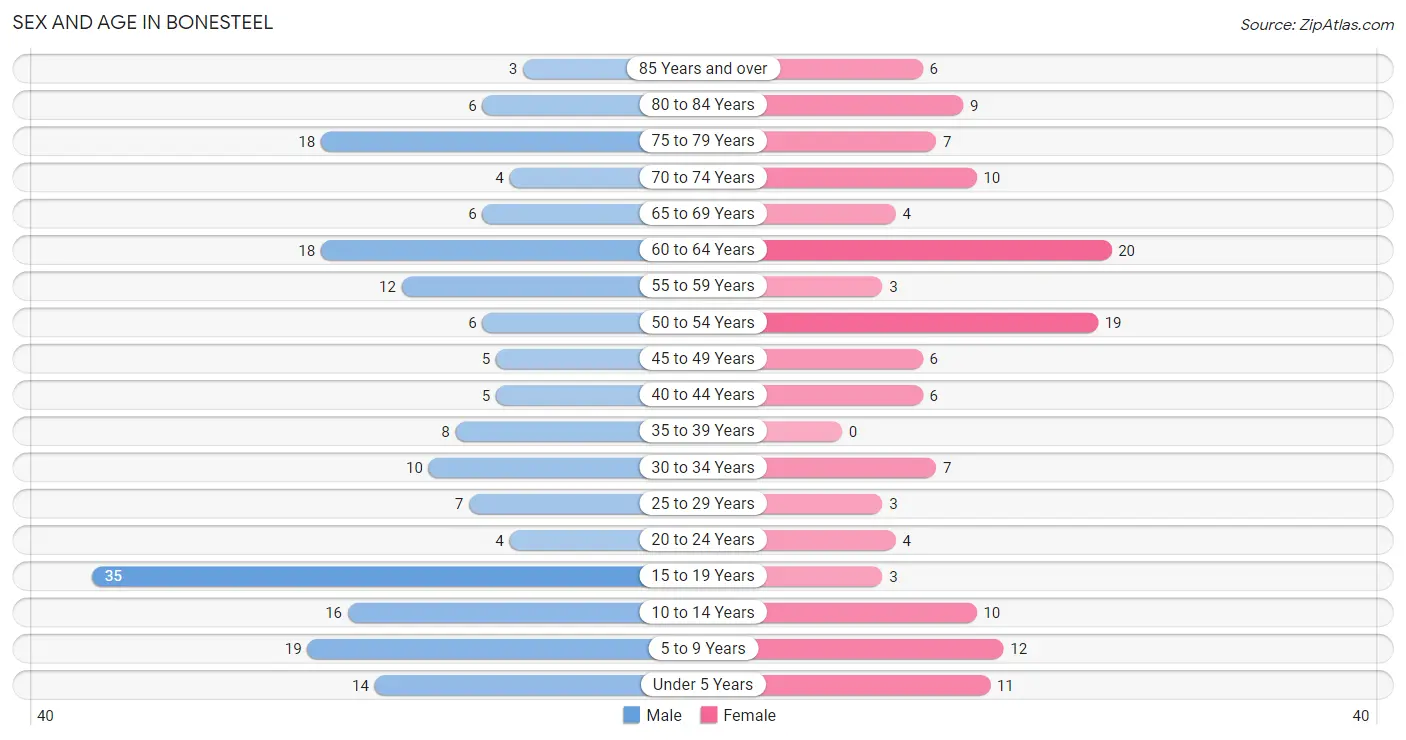
| Age Bracket | Male | Female |
| Under 5 Years | 14 (7.1%) | 11 (7.9%) |
| 5 to 9 Years | 19 (9.7%) | 12 (8.6%) |
| 10 to 14 Years | 16 (8.2%) | 10 (7.1%) |
| 15 to 19 Years | 35 (17.9%) | 3 (2.1%) |
| 20 to 24 Years | 4 (2.0%) | 4 (2.9%) |
| 25 to 29 Years | 7 (3.6%) | 3 (2.1%) |
| 30 to 34 Years | 10 (5.1%) | 7 (5.0%) |
| 35 to 39 Years | 8 (4.1%) | 0 (0.0%) |
| 40 to 44 Years | 5 (2.5%) | 6 (4.3%) |
| 45 to 49 Years | 5 (2.5%) | 6 (4.3%) |
| 50 to 54 Years | 6 (3.1%) | 19 (13.6%) |
| 55 to 59 Years | 12 (6.1%) | 3 (2.1%) |
| 60 to 64 Years | 18 (9.2%) | 20 (14.3%) |
| 65 to 69 Years | 6 (3.1%) | 4 (2.9%) |
| 70 to 74 Years | 4 (2.0%) | 10 (7.1%) |
| 75 to 79 Years | 18 (9.2%) | 7 (5.0%) |
| 80 to 84 Years | 6 (3.1%) | 9 (6.4%) |
| 85 Years and over | 3 (1.5%) | 6 (4.3%) |
| Total | 196 (100.0%) | 140 (100.0%) |
Families and Households in Bonesteel
Median Family Size in Bonesteel
The median family size in Bonesteel is 4.06 persons per family, with single male/father families (10 | 16.1%) accounting for the largest median family size of 5.6 persons per family. On the other hand, married-couple families (47 | 75.8%) represent the smallest median family size with 3.57 persons per family.
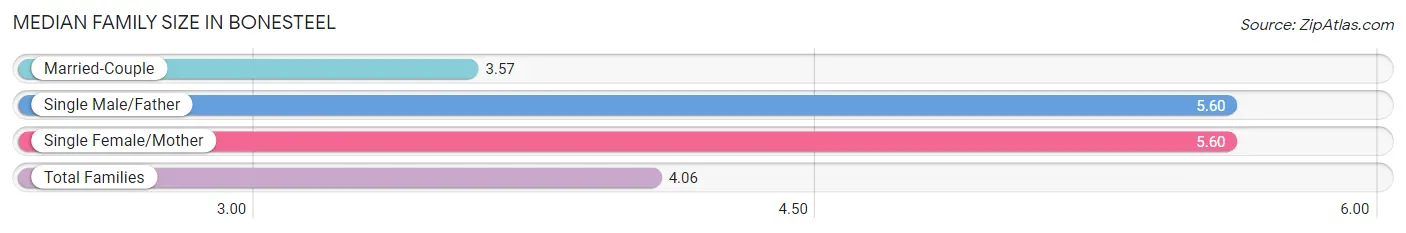
| Family Type | # Families | Family Size |
| Married-Couple | 47 (75.8%) | 3.57 |
| Single Male/Father | 10 (16.1%) | 5.60 |
| Single Female/Mother | 5 (8.1%) | 5.60 |
| Total Families | 62 (100.0%) | 4.06 |
Median Household Size in Bonesteel
The median household size in Bonesteel is 2.93 persons per household, with single male/father households (10 | 8.8%) accounting for the largest median household size of 7.2 persons per household. non-family households (51 | 45.1%) represent the smallest median household size with 1.24 persons per household.
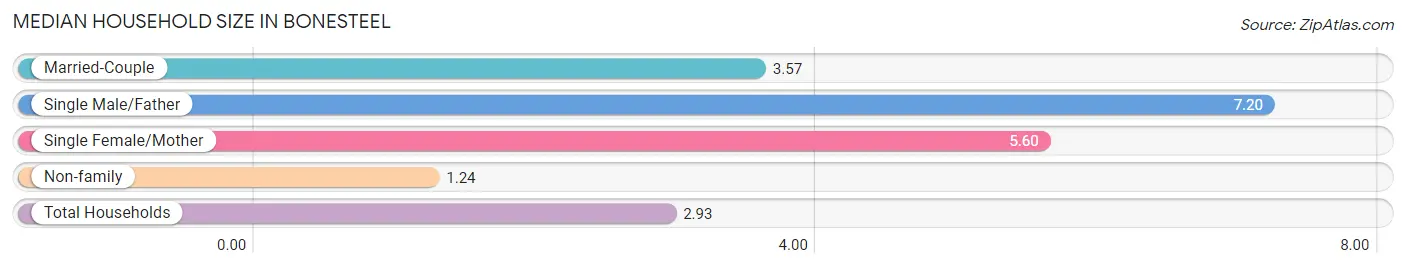
| Household Type | # Households | Household Size |
| Married-Couple | 47 (41.6%) | 3.57 |
| Single Male/Father | 10 (8.8%) | 7.20 |
| Single Female/Mother | 5 (4.4%) | 5.60 |
| Non-family | 51 (45.1%) | 1.24 |
| Total Households | 113 (100.0%) | 2.93 |
Household Size by Marriage Status in Bonesteel
Out of a total of 113 households in Bonesteel, 62 (54.9%) are family households, while 51 (45.1%) are nonfamily households. The most numerous type of family households are 2-person households, comprising 34, and the most common type of nonfamily households are 1-person households, comprising 47.
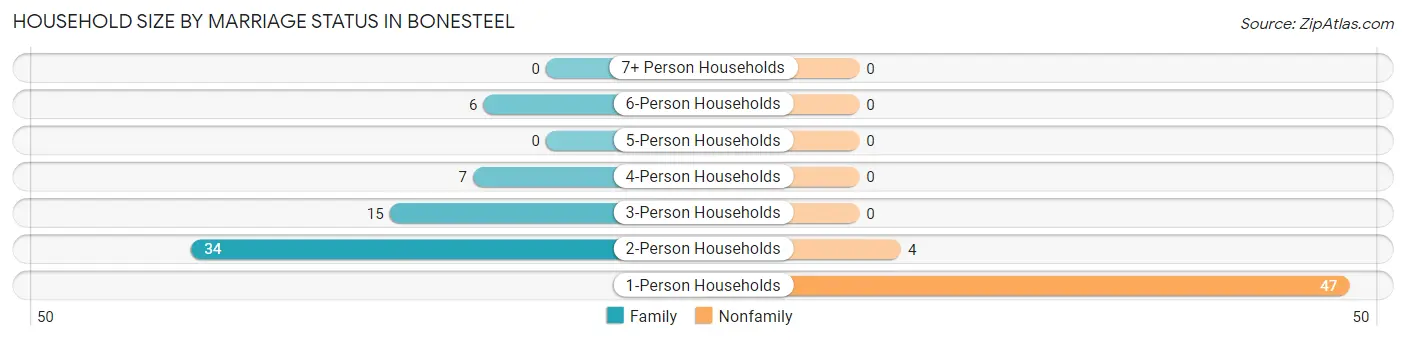
| Household Size | Family Households | Nonfamily Households |
| 1-Person Households | - | 47 (41.6%) |
| 2-Person Households | 34 (30.1%) | 4 (3.5%) |
| 3-Person Households | 15 (13.3%) | 0 (0.0%) |
| 4-Person Households | 7 (6.2%) | 0 (0.0%) |
| 5-Person Households | 0 (0.0%) | 0 (0.0%) |
| 6-Person Households | 6 (5.3%) | 0 (0.0%) |
| 7+ Person Households | 0 (0.0%) | 0 (0.0%) |
| Total | 62 (54.9%) | 51 (45.1%) |
Female Fertility in Bonesteel
Fertility by Age in Bonesteel
Average fertility rate in Bonesteel is 310.0 births per 1,000 women. Women in the age bracket of 20 to 34 years have the highest fertility rate with 643.0 births per 1,000 women. Women in the age bracket of 20 to 34 years acount for 100.0% of all women with births.
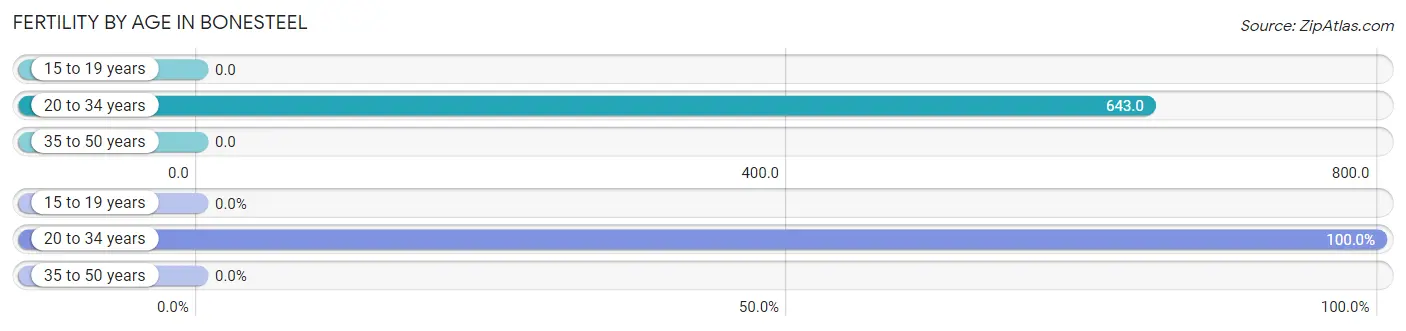
| Age Bracket | Women with Births | Births / 1,000 Women |
| 15 to 19 years | 0 (0.0%) | 0.0 |
| 20 to 34 years | 9 (100.0%) | 643.0 |
| 35 to 50 years | 0 (0.0%) | 0.0 |
| Total | 9 (100.0%) | 310.0 |
Fertility by Age by Marriage Status in Bonesteel
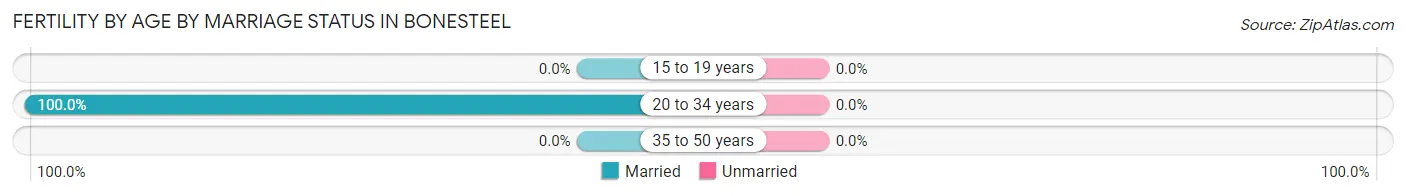
| Age Bracket | Married | Unmarried |
| 15 to 19 years | 0 (0.0%) | 0 (0.0%) |
| 20 to 34 years | 9 (100.0%) | 0 (0.0%) |
| 35 to 50 years | 0 (0.0%) | 0 (0.0%) |
| Total | 9 (100.0%) | 0 (0.0%) |
Fertility by Education in Bonesteel
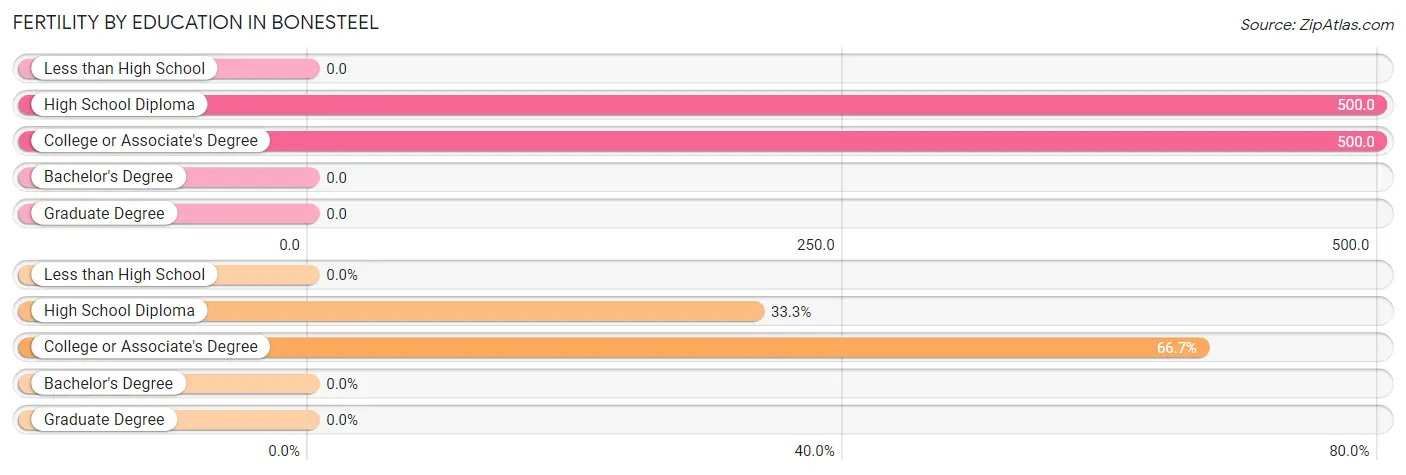
| Educational Attainment | Women with Births | Births / 1,000 Women |
| Less than High School | 0 (0.0%) | 0.0 |
| High School Diploma | 3 (33.3%) | 500.0 |
| College or Associate's Degree | 6 (66.7%) | 500.0 |
| Bachelor's Degree | 0 (0.0%) | 0.0 |
| Graduate Degree | 0 (0.0%) | 0.0 |
| Total | 9 (100.0%) | 310.0 |
Fertility by Education by Marriage Status in Bonesteel
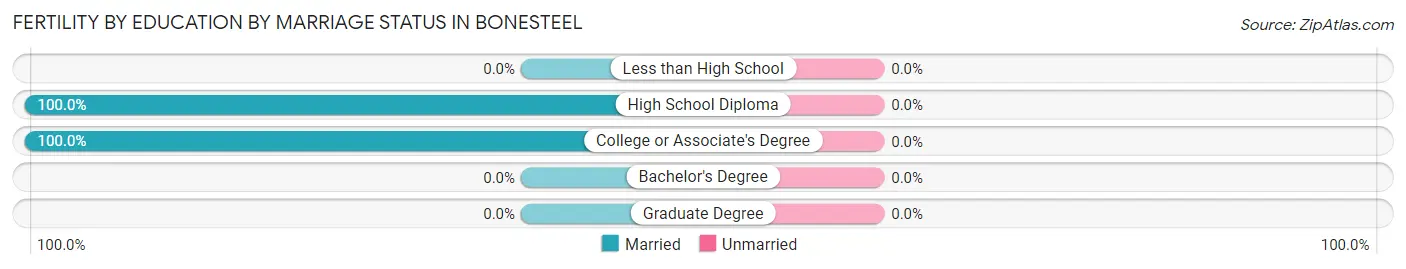
| Educational Attainment | Married | Unmarried |
| Less than High School | 0 (0.0%) | 0 (0.0%) |
| High School Diploma | 3 (100.0%) | 0 (0.0%) |
| College or Associate's Degree | 6 (100.0%) | 0 (0.0%) |
| Bachelor's Degree | 0 (0.0%) | 0 (0.0%) |
| Graduate Degree | 0 (0.0%) | 0 (0.0%) |
| Total | 9 (100.0%) | 0 (0.0%) |
Employment Characteristics in Bonesteel
Employment by Class of Employer in Bonesteel
Among the 88 employed individuals in Bonesteel, private company employees (48 | 54.5%), local government employees (14 | 15.9%), and self-employed (not incorporated) (8 | 9.1%) make up the most common classes of employment.
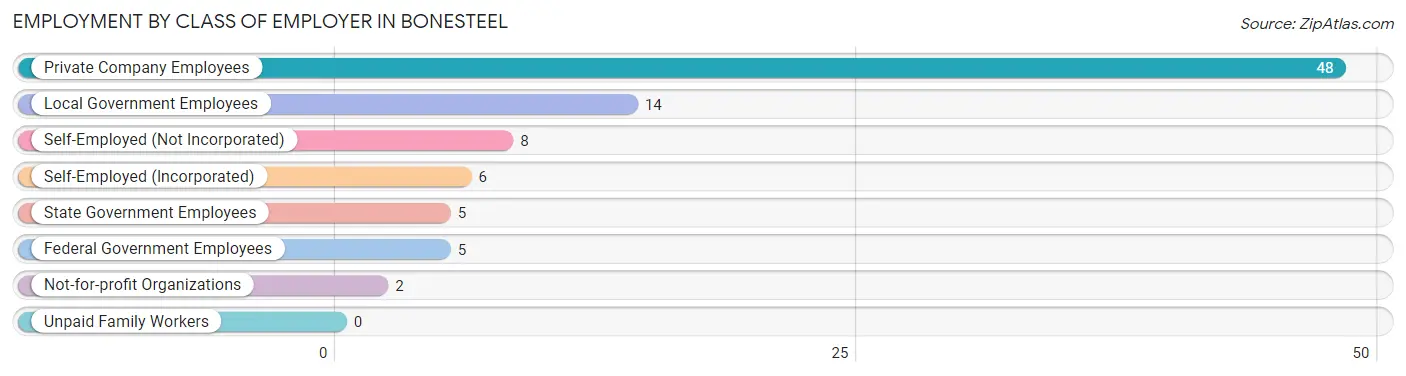
| Employer Class | # Employees | % Employees |
| Private Company Employees | 48 | 54.5% |
| Self-Employed (Incorporated) | 6 | 6.8% |
| Self-Employed (Not Incorporated) | 8 | 9.1% |
| Not-for-profit Organizations | 2 | 2.3% |
| Local Government Employees | 14 | 15.9% |
| State Government Employees | 5 | 5.7% |
| Federal Government Employees | 5 | 5.7% |
| Unpaid Family Workers | 0 | 0.0% |
| Total | 88 | 100.0% |
Employment Status by Age in Bonesteel
According to the labor force statistics for Bonesteel, out of the total population over 16 years of age (254), 36.2% or 92 individuals are in the labor force, with 3.3% or 3 of them unemployed. The age group with the highest labor force participation rate is 35 to 44 years, with 100.0% or 19 individuals in the labor force. Within the labor force, the 35 to 44 years age range has the highest percentage of unemployed individuals, with 15.8% or 3 of them being unemployed.
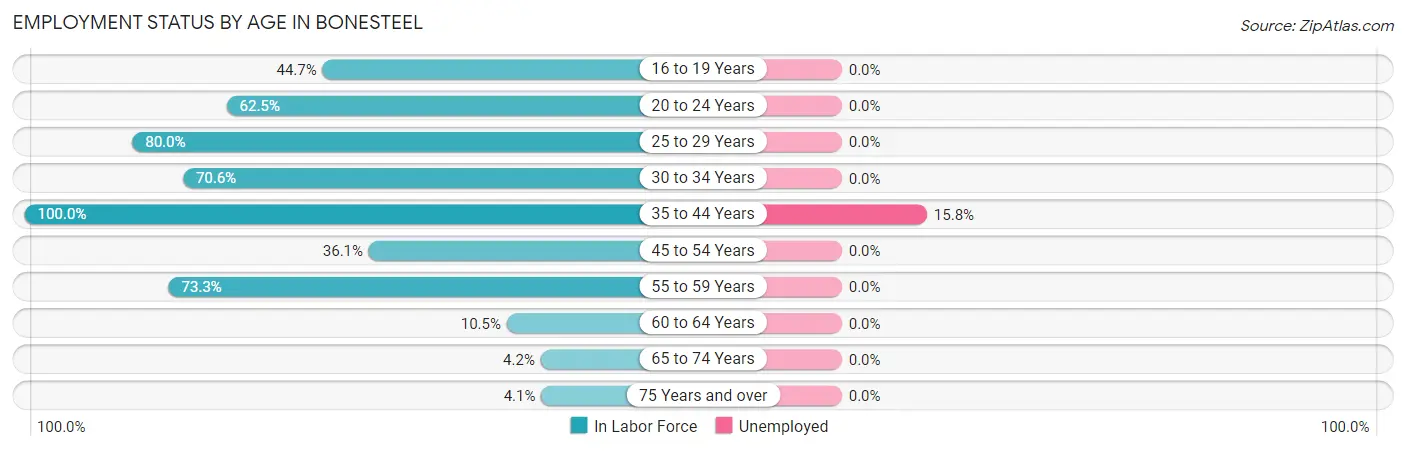
| Age Bracket | In Labor Force | Unemployed |
| 16 to 19 Years | 17 (44.7%) | 0 (0.0%) |
| 20 to 24 Years | 5 (62.5%) | 0 (0.0%) |
| 25 to 29 Years | 8 (80.0%) | 0 (0.0%) |
| 30 to 34 Years | 12 (70.6%) | 0 (0.0%) |
| 35 to 44 Years | 19 (100.0%) | 3 (15.8%) |
| 45 to 54 Years | 13 (36.1%) | 0 (0.0%) |
| 55 to 59 Years | 11 (73.3%) | 0 (0.0%) |
| 60 to 64 Years | 4 (10.5%) | 0 (0.0%) |
| 65 to 74 Years | 1 (4.2%) | 0 (0.0%) |
| 75 Years and over | 2 (4.1%) | 0 (0.0%) |
| Total | 92 (36.2%) | 3 (3.3%) |
Employment Status by Educational Attainment in Bonesteel
According to labor force statistics for Bonesteel, 49.6% of individuals (67) out of the total population between 25 and 64 years of age (135) are in the labor force, with 4.5% or 3 of them being unemployed. The group with the highest labor force participation rate are those with the educational attainment of college / associate degree, with 92.3% or 36 individuals in the labor force. Within the labor force, individuals with high school diploma education have the highest percentage of unemployment, with 15.0% or 3 of them being unemployed.
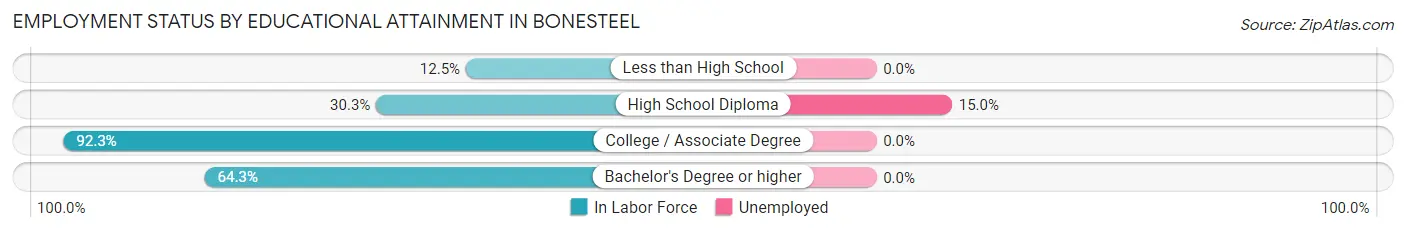
| Educational Attainment | In Labor Force | Unemployed |
| Less than High School | 2 (12.5%) | 0 (0.0%) |
| High School Diploma | 20 (30.3%) | 10 (15.0%) |
| College / Associate Degree | 36 (92.3%) | 0 (0.0%) |
| Bachelor's Degree or higher | 9 (64.3%) | 0 (0.0%) |
| Total | 67 (49.6%) | 6 (4.5%) |
Employment Occupations by Sex in Bonesteel
Management, Business, Science and Arts Occupations
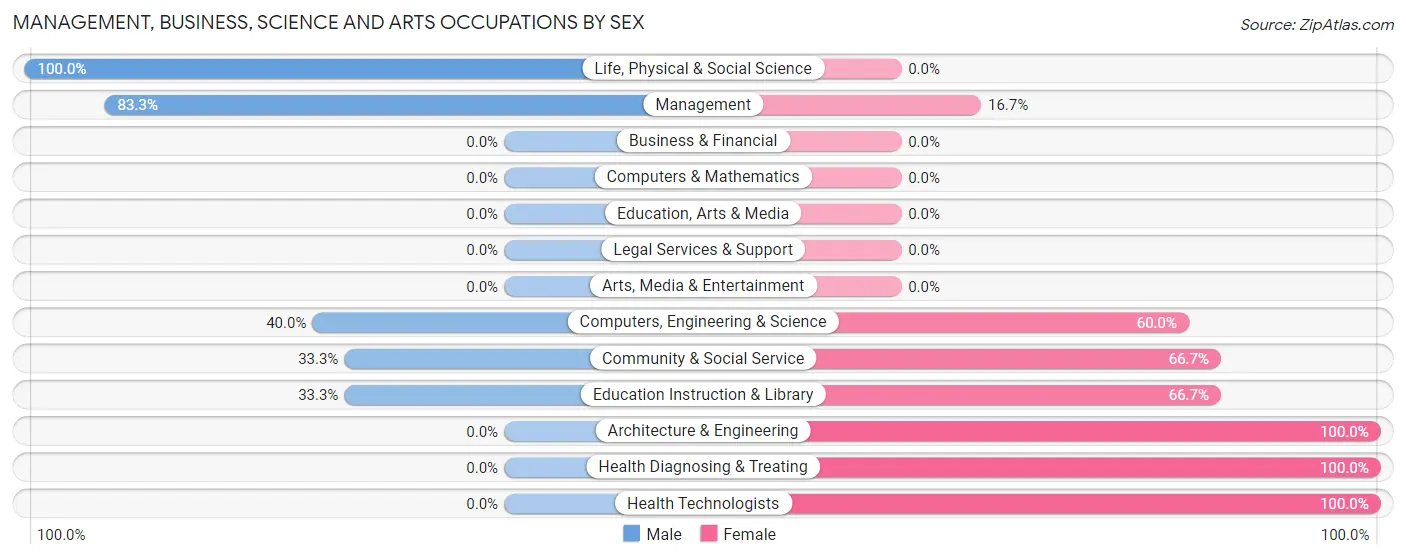
The most common Management, Business, Science and Arts occupations in Bonesteel are Management (6 | 6.7%), Community & Social Service (6 | 6.7%), Education Instruction & Library (6 | 6.7%), Computers, Engineering & Science (5 | 5.6%), and Architecture & Engineering (3 | 3.4%).
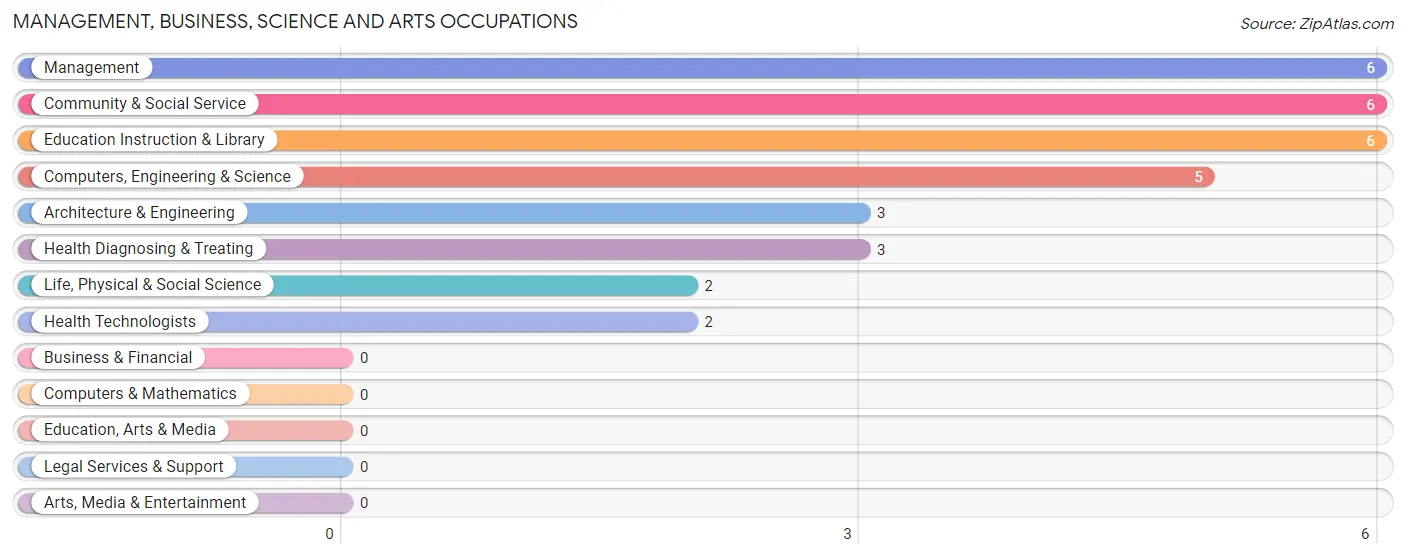
Management, Business, Science and Arts Occupations by Sex
Within the Management, Business, Science and Arts occupations in Bonesteel, the most male-oriented occupations are Life, Physical & Social Science (100.0%), Management (83.3%), and Computers, Engineering & Science (40.0%), while the most female-oriented occupations are Architecture & Engineering (100.0%), Health Diagnosing & Treating (100.0%), and Health Technologists (100.0%).
| Occupation | Male | Female |
| Management | 5 (83.3%) | 1 (16.7%) |
| Business & Financial | 0 (0.0%) | 0 (0.0%) |
| Computers, Engineering & Science | 2 (40.0%) | 3 (60.0%) |
| Computers & Mathematics | 0 (0.0%) | 0 (0.0%) |
| Architecture & Engineering | 0 (0.0%) | 3 (100.0%) |
| Life, Physical & Social Science | 2 (100.0%) | 0 (0.0%) |
| Community & Social Service | 2 (33.3%) | 4 (66.7%) |
| Education, Arts & Media | 0 (0.0%) | 0 (0.0%) |
| Legal Services & Support | 0 (0.0%) | 0 (0.0%) |
| Education Instruction & Library | 2 (33.3%) | 4 (66.7%) |
| Arts, Media & Entertainment | 0 (0.0%) | 0 (0.0%) |
| Health Diagnosing & Treating | 0 (0.0%) | 3 (100.0%) |
| Health Technologists | 0 (0.0%) | 2 (100.0%) |
| Total (Category) | 9 (45.0%) | 11 (55.0%) |
| Total (Overall) | 62 (69.7%) | 27 (30.3%) |
Services Occupations
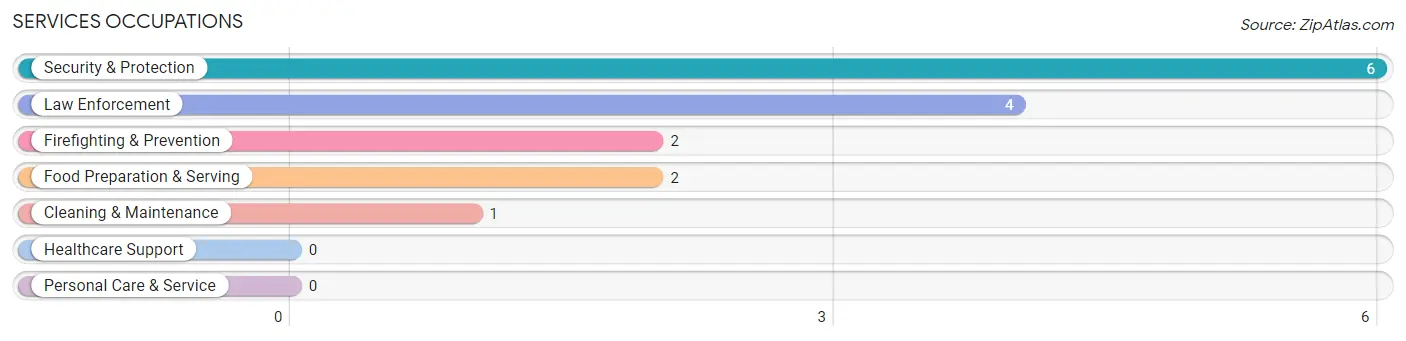
The most common Services occupations in Bonesteel are Security & Protection (6 | 6.7%), Law Enforcement (4 | 4.5%), Firefighting & Prevention (2 | 2.2%), Food Preparation & Serving (2 | 2.2%), and Cleaning & Maintenance (1 | 1.1%).
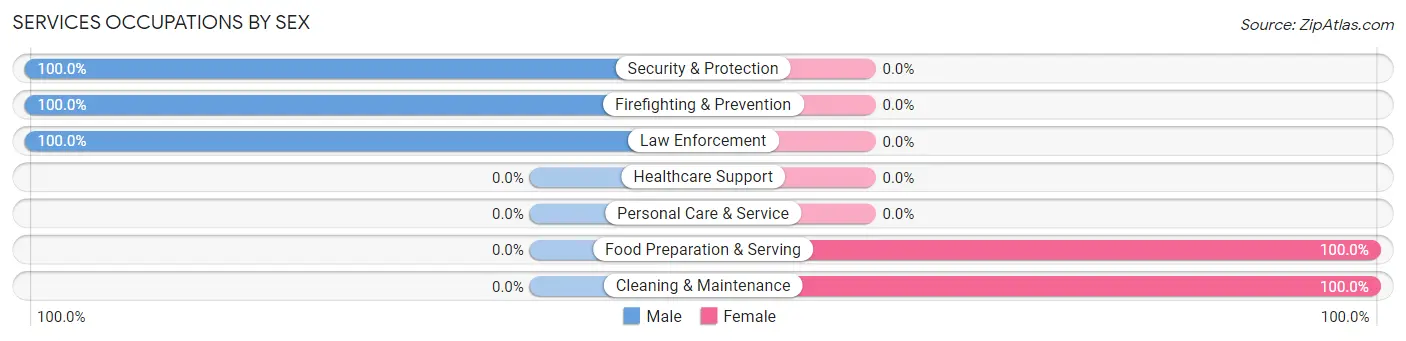
Services Occupations by Sex
Within the Services occupations in Bonesteel, the most male-oriented occupations are Security & Protection (100.0%), Firefighting & Prevention (100.0%), and Law Enforcement (100.0%), while the most female-oriented occupations are Food Preparation & Serving (100.0%), and Cleaning & Maintenance (100.0%).
| Occupation | Male | Female |
| Healthcare Support | 0 (0.0%) | 0 (0.0%) |
| Security & Protection | 6 (100.0%) | 0 (0.0%) |
| Firefighting & Prevention | 2 (100.0%) | 0 (0.0%) |
| Law Enforcement | 4 (100.0%) | 0 (0.0%) |
| Food Preparation & Serving | 0 (0.0%) | 2 (100.0%) |
| Cleaning & Maintenance | 0 (0.0%) | 1 (100.0%) |
| Personal Care & Service | 0 (0.0%) | 0 (0.0%) |
| Total (Category) | 6 (66.7%) | 3 (33.3%) |
| Total (Overall) | 62 (69.7%) | 27 (30.3%) |
Sales and Office Occupations
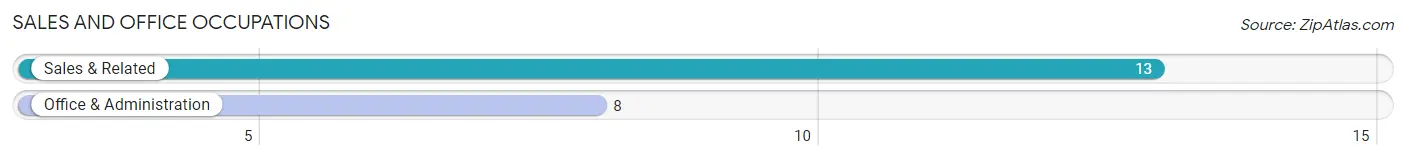
The most common Sales and Office occupations in Bonesteel are Sales & Related (13 | 14.6%), and Office & Administration (8 | 9.0%).
Sales and Office Occupations by Sex
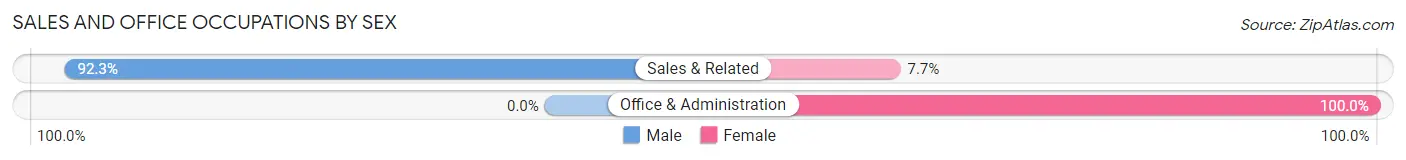
| Occupation | Male | Female |
| Sales & Related | 12 (92.3%) | 1 (7.7%) |
| Office & Administration | 0 (0.0%) | 8 (100.0%) |
| Total (Category) | 12 (57.1%) | 9 (42.9%) |
| Total (Overall) | 62 (69.7%) | 27 (30.3%) |
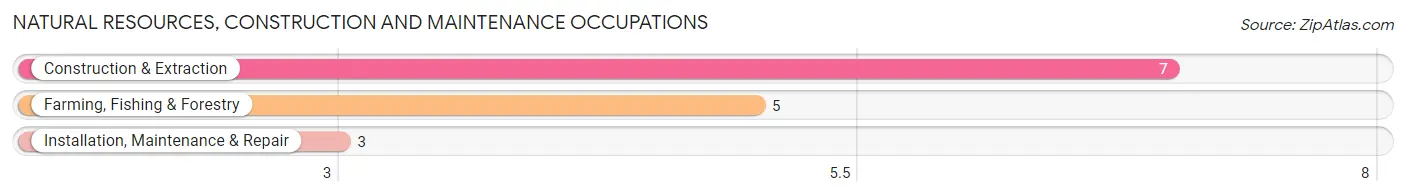
Natural Resources, Construction and Maintenance Occupations
The most common Natural Resources, Construction and Maintenance occupations in Bonesteel are Construction & Extraction (7 | 7.9%), Farming, Fishing & Forestry (5 | 5.6%), and Installation, Maintenance & Repair (3 | 3.4%).
Natural Resources, Construction and Maintenance Occupations by Sex
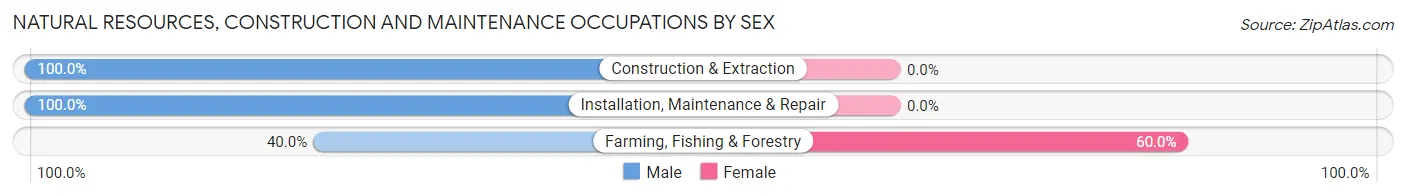
| Occupation | Male | Female |
| Farming, Fishing & Forestry | 2 (40.0%) | 3 (60.0%) |
| Construction & Extraction | 7 (100.0%) | 0 (0.0%) |
| Installation, Maintenance & Repair | 3 (100.0%) | 0 (0.0%) |
| Total (Category) | 12 (80.0%) | 3 (20.0%) |
| Total (Overall) | 62 (69.7%) | 27 (30.3%) |
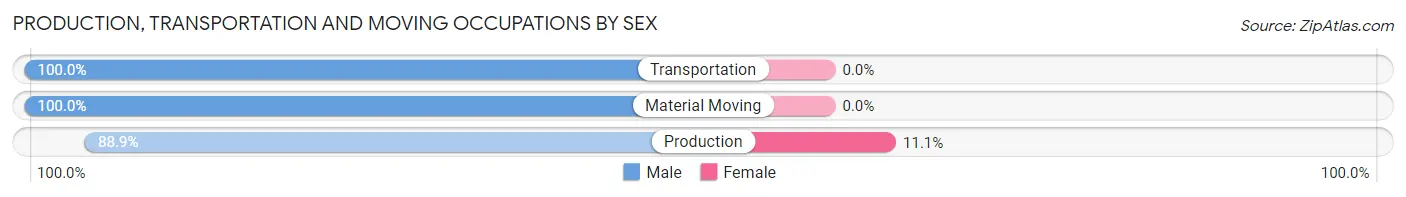
Production, Transportation and Moving Occupations
The most common Production, Transportation and Moving occupations in Bonesteel are Transportation (11 | 12.4%), Production (9 | 10.1%), and Material Moving (4 | 4.5%).
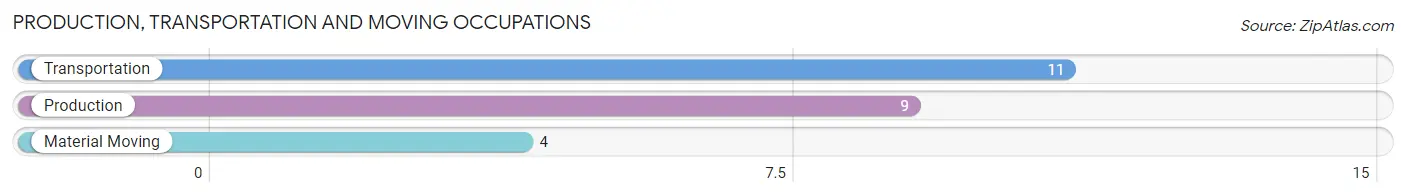
Production, Transportation and Moving Occupations by Sex
| Occupation | Male | Female |
| Production | 8 (88.9%) | 1 (11.1%) |
| Transportation | 11 (100.0%) | 0 (0.0%) |
| Material Moving | 4 (100.0%) | 0 (0.0%) |
| Total (Category) | 23 (95.8%) | 1 (4.2%) |
| Total (Overall) | 62 (69.7%) | 27 (30.3%) |
Employment Industries by Sex in Bonesteel
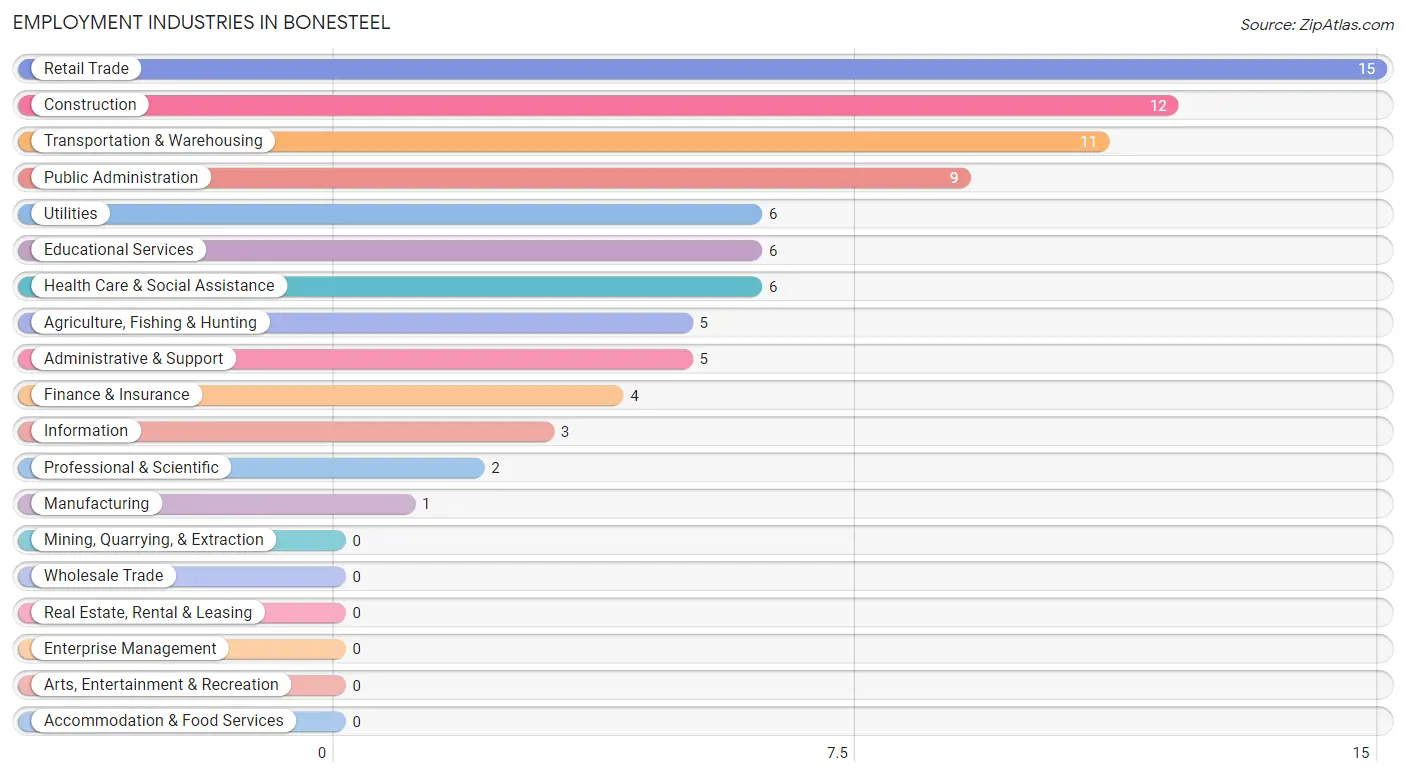
Employment Industries in Bonesteel
The major employment industries in Bonesteel include Retail Trade (15 | 16.9%), Construction (12 | 13.5%), Transportation & Warehousing (11 | 12.4%), Public Administration (9 | 10.1%), and Utilities (6 | 6.7%).
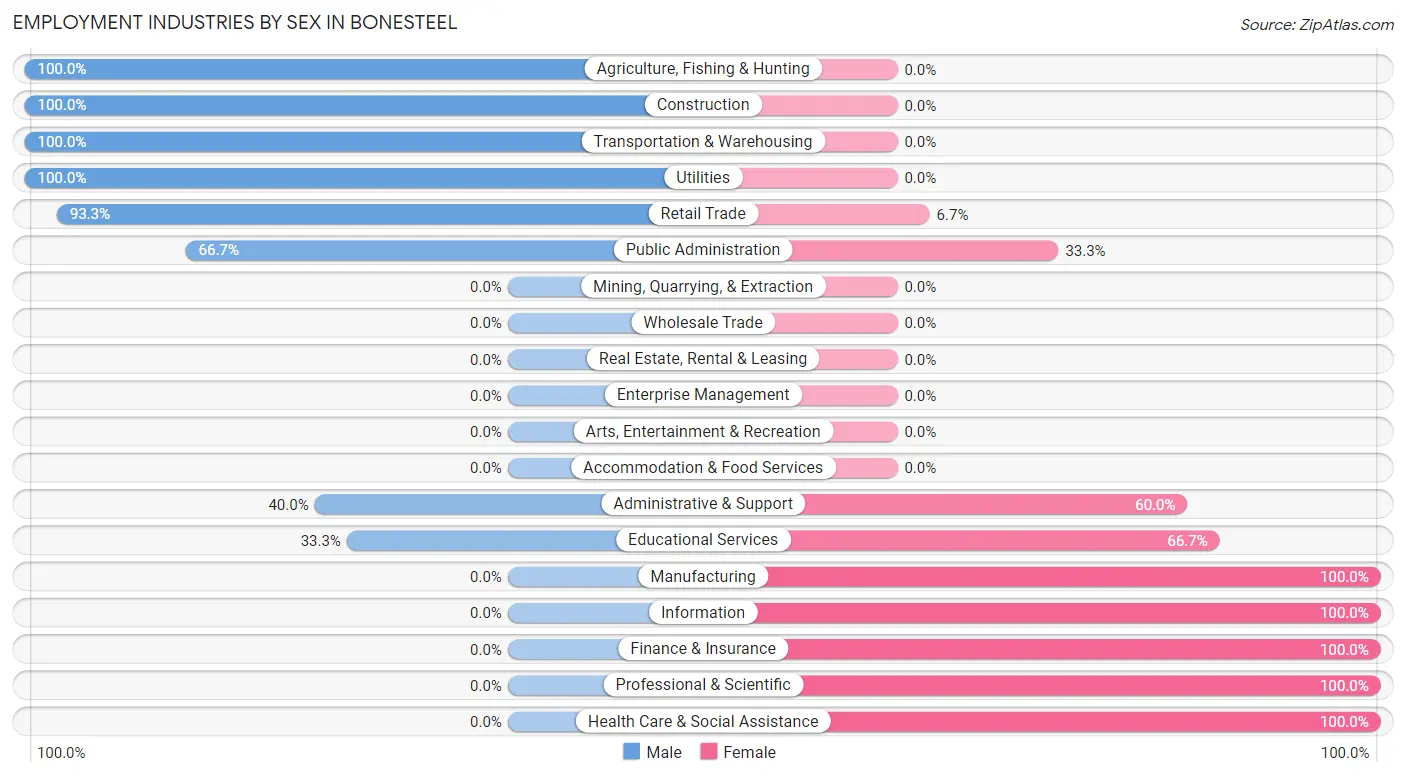
Employment Industries by Sex in Bonesteel
The Bonesteel industries that see more men than women are Agriculture, Fishing & Hunting (100.0%), Construction (100.0%), and Transportation & Warehousing (100.0%), whereas the industries that tend to have a higher number of women are Manufacturing (100.0%), Information (100.0%), and Finance & Insurance (100.0%).
| Industry | Male | Female |
| Agriculture, Fishing & Hunting | 5 (100.0%) | 0 (0.0%) |
| Mining, Quarrying, & Extraction | 0 (0.0%) | 0 (0.0%) |
| Construction | 12 (100.0%) | 0 (0.0%) |
| Manufacturing | 0 (0.0%) | 1 (100.0%) |
| Wholesale Trade | 0 (0.0%) | 0 (0.0%) |
| Retail Trade | 14 (93.3%) | 1 (6.7%) |
| Transportation & Warehousing | 11 (100.0%) | 0 (0.0%) |
| Utilities | 6 (100.0%) | 0 (0.0%) |
| Information | 0 (0.0%) | 3 (100.0%) |
| Finance & Insurance | 0 (0.0%) | 4 (100.0%) |
| Real Estate, Rental & Leasing | 0 (0.0%) | 0 (0.0%) |
| Professional & Scientific | 0 (0.0%) | 2 (100.0%) |
| Enterprise Management | 0 (0.0%) | 0 (0.0%) |
| Administrative & Support | 2 (40.0%) | 3 (60.0%) |
| Educational Services | 2 (33.3%) | 4 (66.7%) |
| Health Care & Social Assistance | 0 (0.0%) | 6 (100.0%) |
| Arts, Entertainment & Recreation | 0 (0.0%) | 0 (0.0%) |
| Accommodation & Food Services | 0 (0.0%) | 0 (0.0%) |
| Public Administration | 6 (66.7%) | 3 (33.3%) |
| Total | 62 (69.7%) | 27 (30.3%) |
Education in Bonesteel
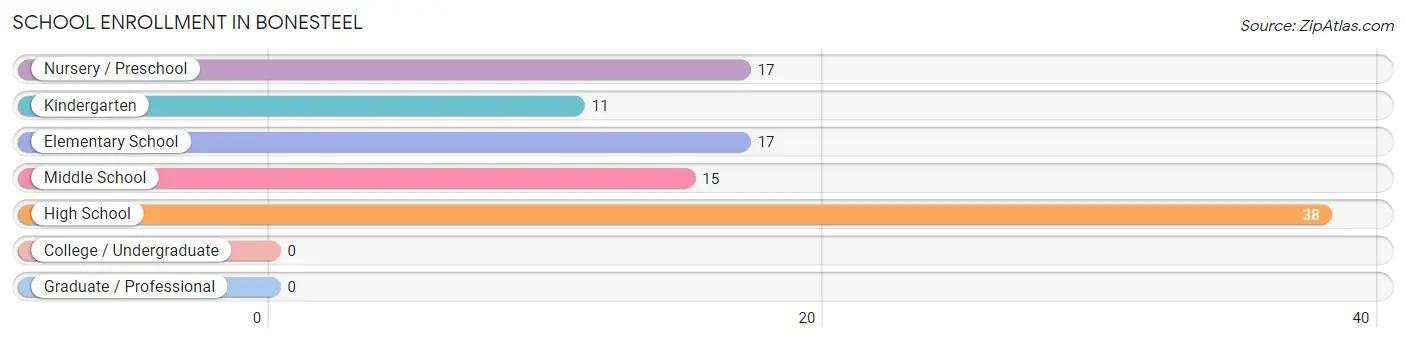
School Enrollment in Bonesteel
The most common levels of schooling among the 98 students in Bonesteel are high school (38 | 38.8%), nursery / preschool (17 | 17.3%), and elementary school (17 | 17.3%).
| School Level | # Students | % Students |
| Nursery / Preschool | 17 | 17.3% |
| Kindergarten | 11 | 11.2% |
| Elementary School | 17 | 17.3% |
| Middle School | 15 | 15.3% |
| High School | 38 | 38.8% |
| College / Undergraduate | 0 | 0.0% |
| Graduate / Professional | 0 | 0.0% |
| Total | 98 | 100.0% |
School Enrollment by Age by Funding Source in Bonesteel
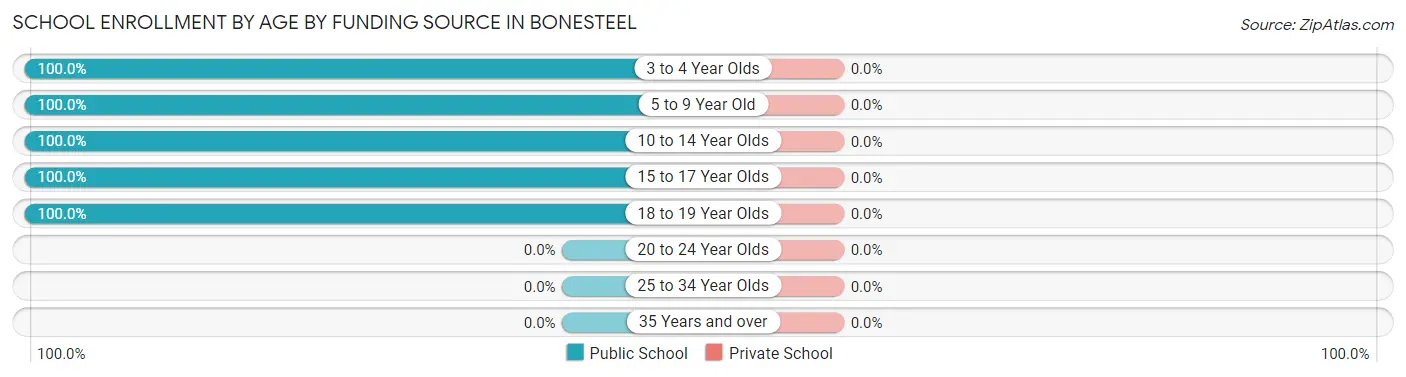
| Age Bracket | Public School | Private School |
| 3 to 4 Year Olds | 3 (100.0%) | 0 (0.0%) |
| 5 to 9 Year Old | 31 (100.0%) | 0 (0.0%) |
| 10 to 14 Year Olds | 26 (100.0%) | 0 (0.0%) |
| 15 to 17 Year Olds | 15 (100.0%) | 0 (0.0%) |
| 18 to 19 Year Olds | 23 (100.0%) | 0 (0.0%) |
| 20 to 24 Year Olds | 0 (0.0%) | 0 (0.0%) |
| 25 to 34 Year Olds | 0 (0.0%) | 0 (0.0%) |
| 35 Years and over | 0 (0.0%) | 0 (0.0%) |
| Total | 98 (100.0%) | 0 (0.0%) |
Educational Attainment by Field of Study in Bonesteel
Education (18 | 48.6%), business (7 | 18.9%), psychology (4 | 10.8%), arts & humanities (3 | 8.1%), and engineering (2 | 5.4%) are the most common fields of study among 37 individuals in Bonesteel who have obtained a bachelor's degree or higher.
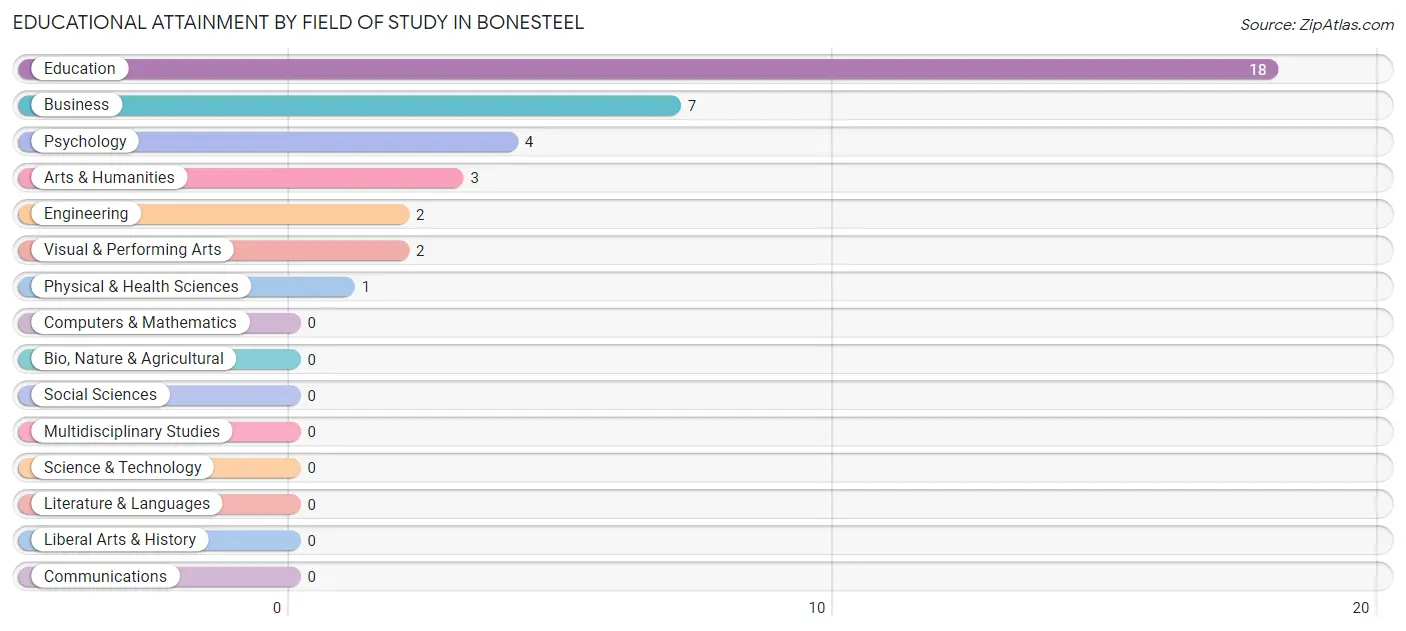
| Field of Study | # Graduates | % Graduates |
| Computers & Mathematics | 0 | 0.0% |
| Bio, Nature & Agricultural | 0 | 0.0% |
| Physical & Health Sciences | 1 | 2.7% |
| Psychology | 4 | 10.8% |
| Social Sciences | 0 | 0.0% |
| Engineering | 2 | 5.4% |
| Multidisciplinary Studies | 0 | 0.0% |
| Science & Technology | 0 | 0.0% |
| Business | 7 | 18.9% |
| Education | 18 | 48.6% |
| Literature & Languages | 0 | 0.0% |
| Liberal Arts & History | 0 | 0.0% |
| Visual & Performing Arts | 2 | 5.4% |
| Communications | 0 | 0.0% |
| Arts & Humanities | 3 | 8.1% |
| Total | 37 | 100.0% |
Transportation & Commute in Bonesteel
Vehicle Availability by Sex in Bonesteel
The most prevalent vehicle ownership categories in Bonesteel are males with no vehicle (21, accounting for 33.9%) and females with no vehicle (0, making up 80.8%).
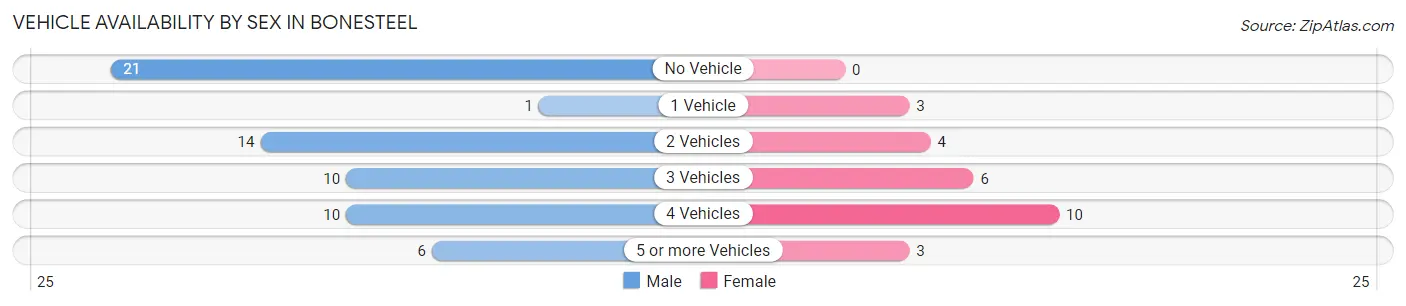
| Vehicles Available | Male | Female |
| No Vehicle | 21 (33.9%) | 0 (0.0%) |
| 1 Vehicle | 1 (1.6%) | 3 (11.5%) |
| 2 Vehicles | 14 (22.6%) | 4 (15.4%) |
| 3 Vehicles | 10 (16.1%) | 6 (23.1%) |
| 4 Vehicles | 10 (16.1%) | 10 (38.5%) |
| 5 or more Vehicles | 6 (9.7%) | 3 (11.5%) |
| Total | 62 (100.0%) | 26 (100.0%) |
Commute Time in Bonesteel
The most frequently occuring commute durations in Bonesteel are less than 5 minutes (35 commuters, 42.7%), 60 to 89 minutes (13 commuters, 15.9%), and 20 to 24 minutes (10 commuters, 12.2%).
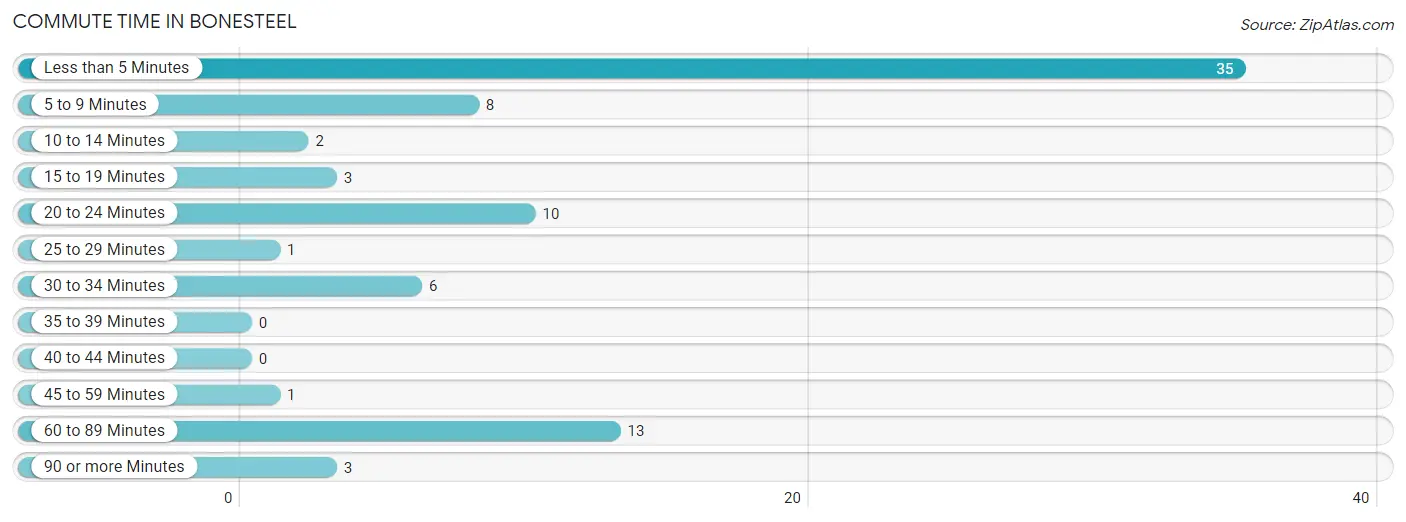
| Commute Time | # Commuters | % Commuters |
| Less than 5 Minutes | 35 | 42.7% |
| 5 to 9 Minutes | 8 | 9.8% |
| 10 to 14 Minutes | 2 | 2.4% |
| 15 to 19 Minutes | 3 | 3.7% |
| 20 to 24 Minutes | 10 | 12.2% |
| 25 to 29 Minutes | 1 | 1.2% |
| 30 to 34 Minutes | 6 | 7.3% |
| 35 to 39 Minutes | 0 | 0.0% |
| 40 to 44 Minutes | 0 | 0.0% |
| 45 to 59 Minutes | 1 | 1.2% |
| 60 to 89 Minutes | 13 | 15.9% |
| 90 or more Minutes | 3 | 3.7% |
Commute Time by Sex in Bonesteel
The most common commute times in Bonesteel are less than 5 minutes (32 commuters, 52.5%) for males and 20 to 24 minutes (5 commuters, 23.8%) for females.
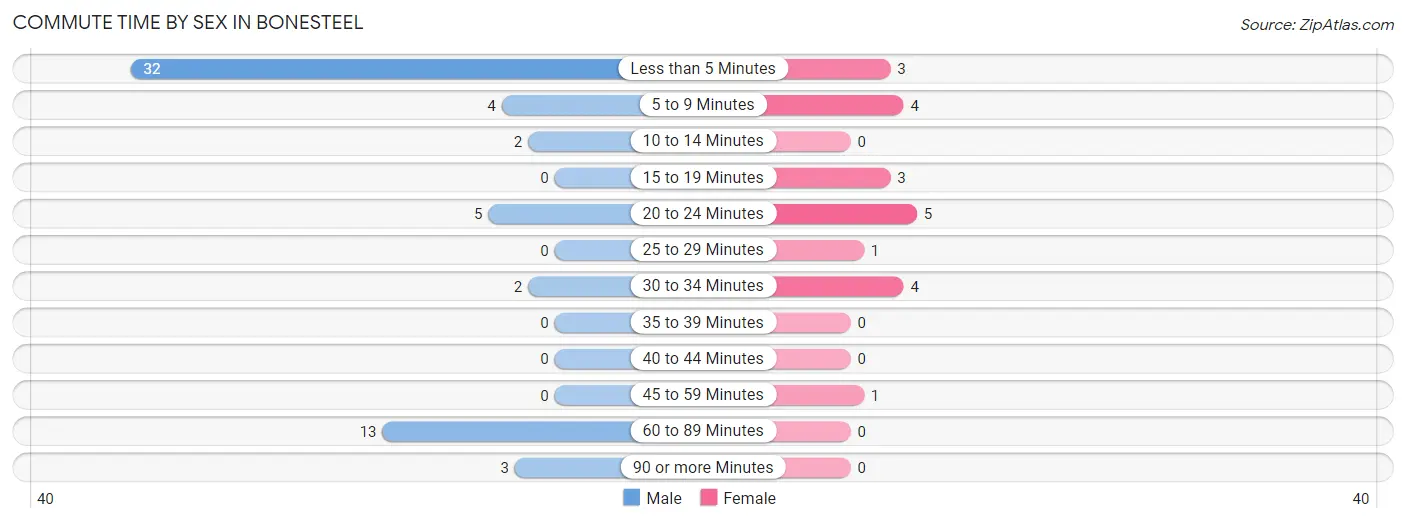
| Commute Time | Male | Female |
| Less than 5 Minutes | 32 (52.5%) | 3 (14.3%) |
| 5 to 9 Minutes | 4 (6.6%) | 4 (19.1%) |
| 10 to 14 Minutes | 2 (3.3%) | 0 (0.0%) |
| 15 to 19 Minutes | 0 (0.0%) | 3 (14.3%) |
| 20 to 24 Minutes | 5 (8.2%) | 5 (23.8%) |
| 25 to 29 Minutes | 0 (0.0%) | 1 (4.8%) |
| 30 to 34 Minutes | 2 (3.3%) | 4 (19.1%) |
| 35 to 39 Minutes | 0 (0.0%) | 0 (0.0%) |
| 40 to 44 Minutes | 0 (0.0%) | 0 (0.0%) |
| 45 to 59 Minutes | 0 (0.0%) | 1 (4.8%) |
| 60 to 89 Minutes | 13 (21.3%) | 0 (0.0%) |
| 90 or more Minutes | 3 (4.9%) | 0 (0.0%) |
Time of Departure to Work by Sex in Bonesteel
The most frequent times of departure to work in Bonesteel are 7:30 AM to 7:59 AM (30, 49.2%) for males and 7:30 AM to 7:59 AM (6, 28.6%) for females.
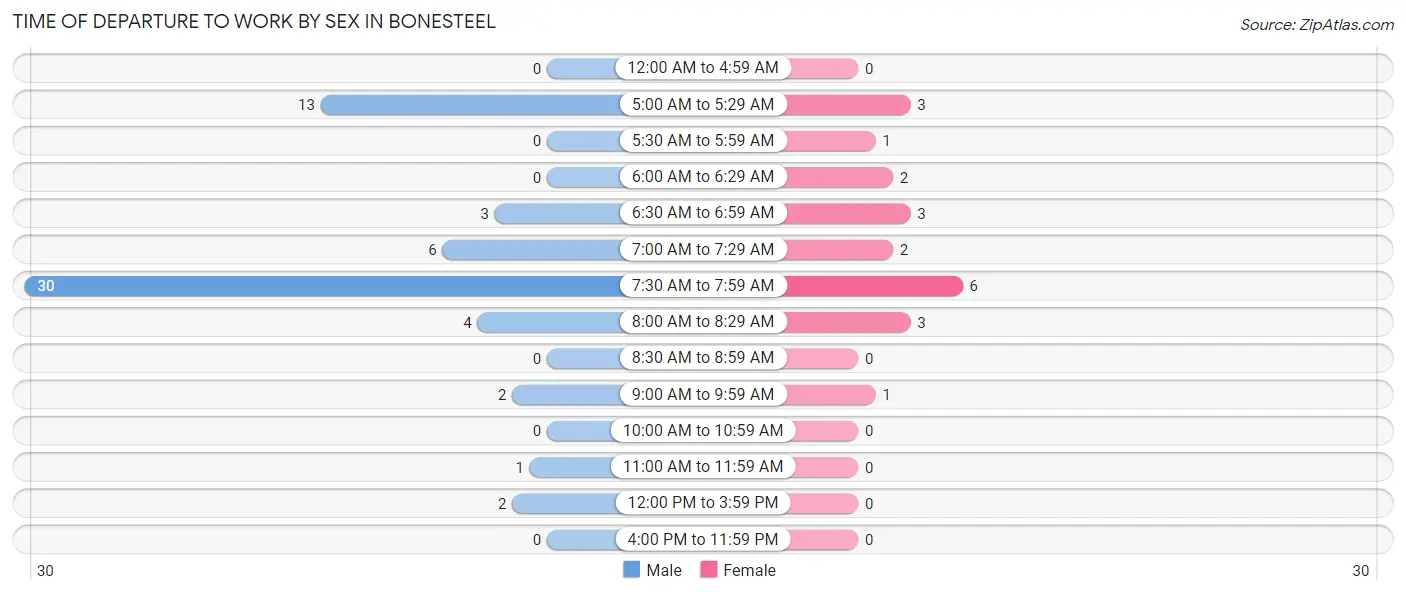
| Time of Departure | Male | Female |
| 12:00 AM to 4:59 AM | 0 (0.0%) | 0 (0.0%) |
| 5:00 AM to 5:29 AM | 13 (21.3%) | 3 (14.3%) |
| 5:30 AM to 5:59 AM | 0 (0.0%) | 1 (4.8%) |
| 6:00 AM to 6:29 AM | 0 (0.0%) | 2 (9.5%) |
| 6:30 AM to 6:59 AM | 3 (4.9%) | 3 (14.3%) |
| 7:00 AM to 7:29 AM | 6 (9.8%) | 2 (9.5%) |
| 7:30 AM to 7:59 AM | 30 (49.2%) | 6 (28.6%) |
| 8:00 AM to 8:29 AM | 4 (6.6%) | 3 (14.3%) |
| 8:30 AM to 8:59 AM | 0 (0.0%) | 0 (0.0%) |
| 9:00 AM to 9:59 AM | 2 (3.3%) | 1 (4.8%) |
| 10:00 AM to 10:59 AM | 0 (0.0%) | 0 (0.0%) |
| 11:00 AM to 11:59 AM | 1 (1.6%) | 0 (0.0%) |
| 12:00 PM to 3:59 PM | 2 (3.3%) | 0 (0.0%) |
| 4:00 PM to 11:59 PM | 0 (0.0%) | 0 (0.0%) |
| Total | 61 (100.0%) | 21 (100.0%) |
Housing Occupancy in Bonesteel
Occupancy by Ownership in Bonesteel
Of the total 113 dwellings in Bonesteel, owner-occupied units account for 79 (69.9%), while renter-occupied units make up 34 (30.1%).
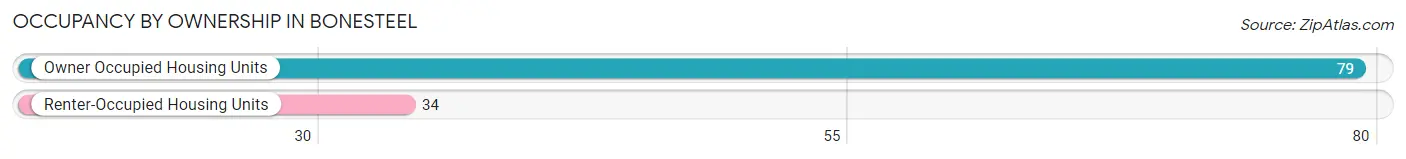
| Occupancy | # Housing Units | % Housing Units |
| Owner Occupied Housing Units | 79 | 69.9% |
| Renter-Occupied Housing Units | 34 | 30.1% |
| Total Occupied Housing Units | 113 | 100.0% |
Occupancy by Household Size in Bonesteel
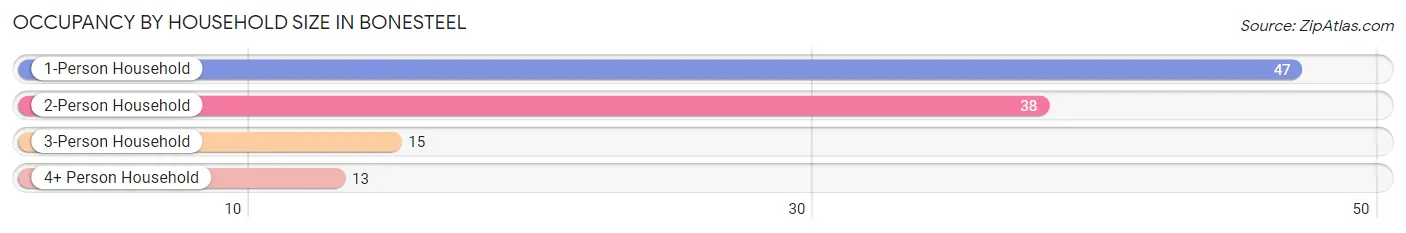
| Household Size | # Housing Units | % Housing Units |
| 1-Person Household | 47 | 41.6% |
| 2-Person Household | 38 | 33.6% |
| 3-Person Household | 15 | 13.3% |
| 4+ Person Household | 13 | 11.5% |
| Total Housing Units | 113 | 100.0% |
Occupancy by Ownership by Household Size in Bonesteel
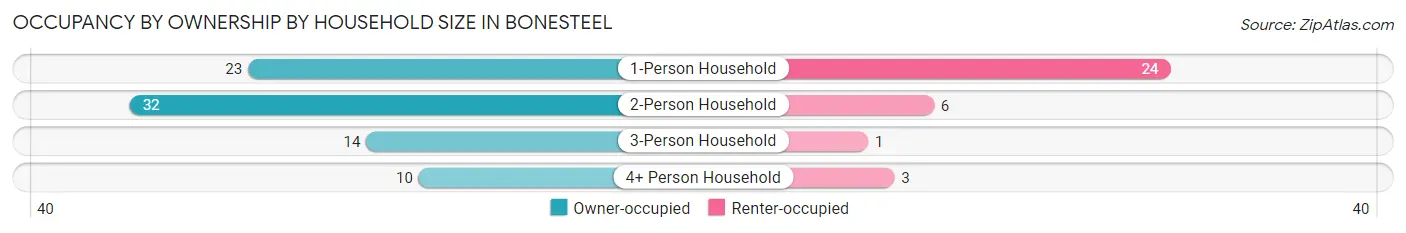
| Household Size | Owner-occupied | Renter-occupied |
| 1-Person Household | 23 (48.9%) | 24 (51.1%) |
| 2-Person Household | 32 (84.2%) | 6 (15.8%) |
| 3-Person Household | 14 (93.3%) | 1 (6.7%) |
| 4+ Person Household | 10 (76.9%) | 3 (23.1%) |
| Total Housing Units | 79 (69.9%) | 34 (30.1%) |
Occupancy by Educational Attainment in Bonesteel
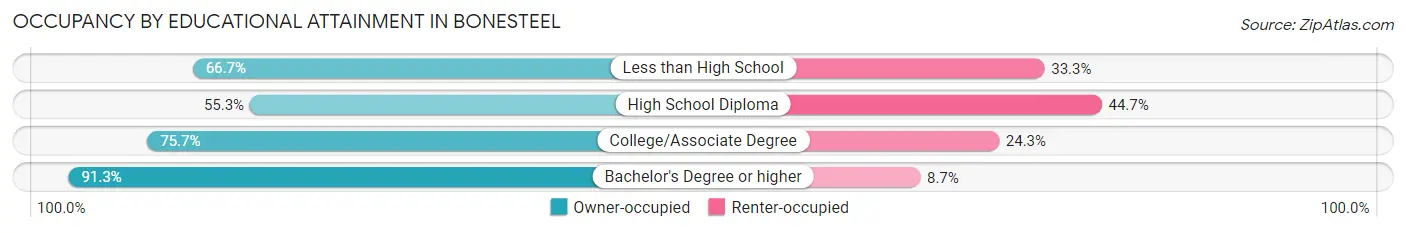
| Household Size | Owner-occupied | Renter-occupied |
| Less than High School | 4 (66.7%) | 2 (33.3%) |
| High School Diploma | 26 (55.3%) | 21 (44.7%) |
| College/Associate Degree | 28 (75.7%) | 9 (24.3%) |
| Bachelor's Degree or higher | 21 (91.3%) | 2 (8.7%) |
Occupancy by Age of Householder in Bonesteel
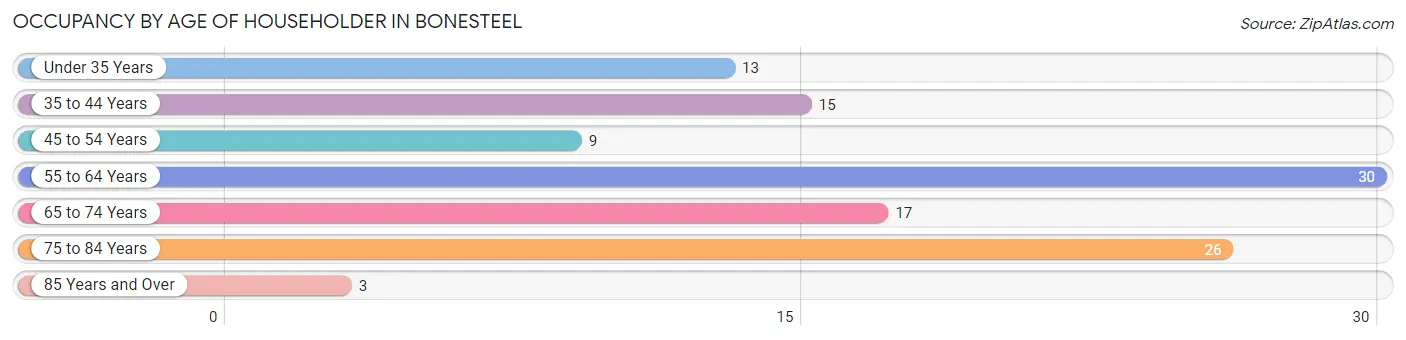
| Age Bracket | # Households | % Households |
| Under 35 Years | 13 | 11.5% |
| 35 to 44 Years | 15 | 13.3% |
| 45 to 54 Years | 9 | 8.0% |
| 55 to 64 Years | 30 | 26.6% |
| 65 to 74 Years | 17 | 15.0% |
| 75 to 84 Years | 26 | 23.0% |
| 85 Years and Over | 3 | 2.6% |
| Total | 113 | 100.0% |
Housing Finances in Bonesteel
Median Income by Occupancy in Bonesteel
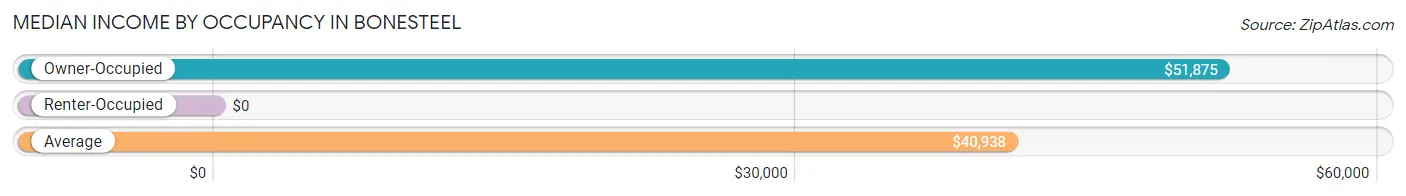
| Occupancy Type | # Households | Median Income |
| Owner-Occupied | 79 (69.9%) | $51,875 |
| Renter-Occupied | 34 (30.1%) | $0 |
| Average | 113 (100.0%) | $40,938 |
Occupancy by Householder Income Bracket in Bonesteel
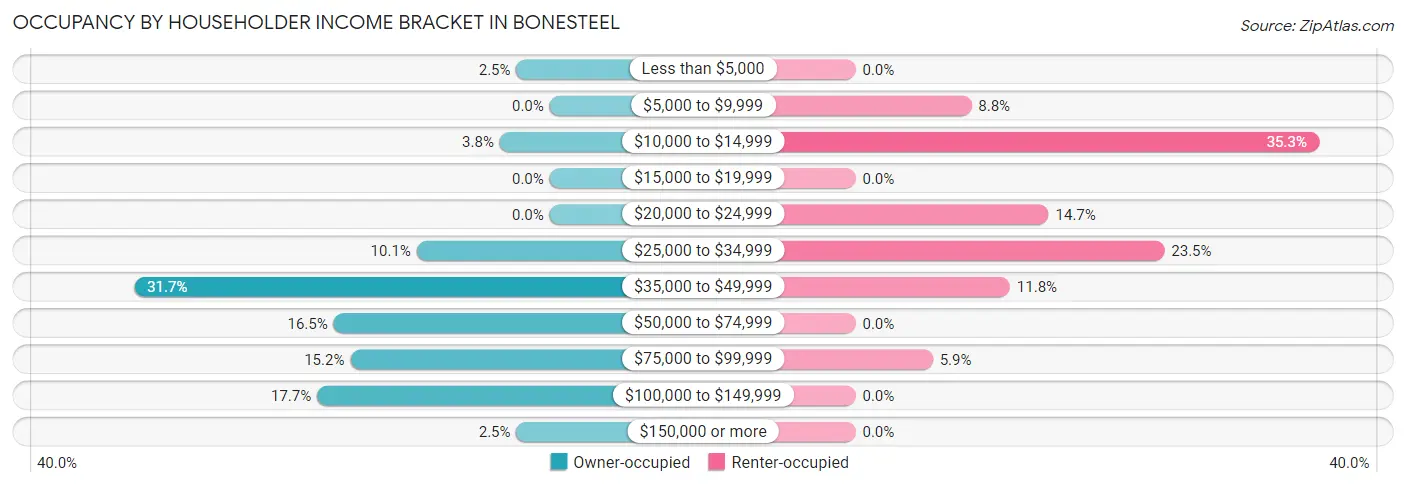
| Income Bracket | Owner-occupied | Renter-occupied |
| Less than $5,000 | 2 (2.5%) | 0 (0.0%) |
| $5,000 to $9,999 | 0 (0.0%) | 3 (8.8%) |
| $10,000 to $14,999 | 3 (3.8%) | 12 (35.3%) |
| $15,000 to $19,999 | 0 (0.0%) | 0 (0.0%) |
| $20,000 to $24,999 | 0 (0.0%) | 5 (14.7%) |
| $25,000 to $34,999 | 8 (10.1%) | 8 (23.5%) |
| $35,000 to $49,999 | 25 (31.7%) | 4 (11.8%) |
| $50,000 to $74,999 | 13 (16.5%) | 0 (0.0%) |
| $75,000 to $99,999 | 12 (15.2%) | 2 (5.9%) |
| $100,000 to $149,999 | 14 (17.7%) | 0 (0.0%) |
| $150,000 or more | 2 (2.5%) | 0 (0.0%) |
| Total | 79 (100.0%) | 34 (100.0%) |
Monthly Housing Cost Tiers in Bonesteel
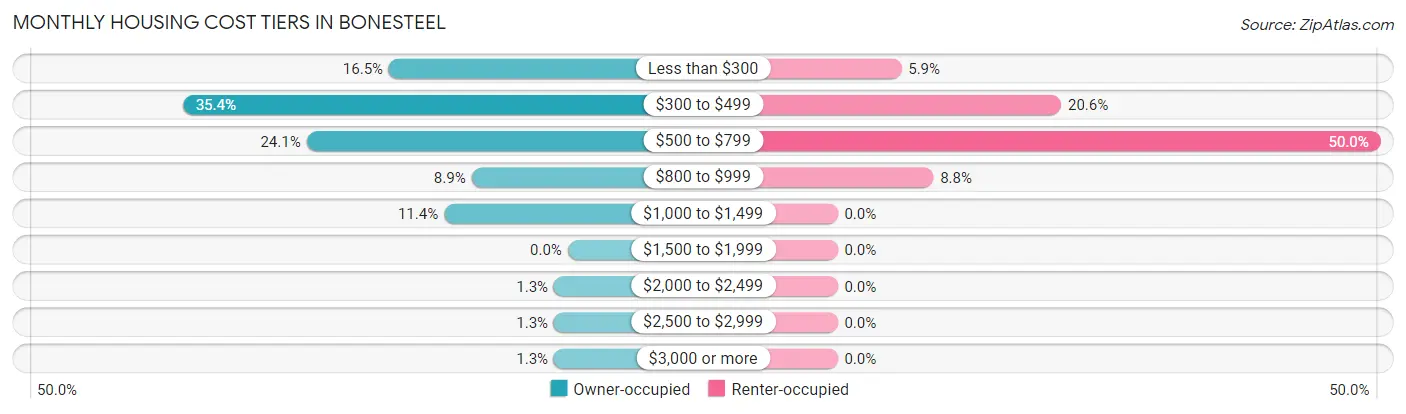
| Monthly Cost | Owner-occupied | Renter-occupied |
| Less than $300 | 13 (16.5%) | 2 (5.9%) |
| $300 to $499 | 28 (35.4%) | 7 (20.6%) |
| $500 to $799 | 19 (24.0%) | 17 (50.0%) |
| $800 to $999 | 7 (8.9%) | 3 (8.8%) |
| $1,000 to $1,499 | 9 (11.4%) | 0 (0.0%) |
| $1,500 to $1,999 | 0 (0.0%) | 0 (0.0%) |
| $2,000 to $2,499 | 1 (1.3%) | 0 (0.0%) |
| $2,500 to $2,999 | 1 (1.3%) | 0 (0.0%) |
| $3,000 or more | 1 (1.3%) | 0 (0.0%) |
| Total | 79 (100.0%) | 34 (100.0%) |
Physical Housing Characteristics in Bonesteel
Housing Structures in Bonesteel
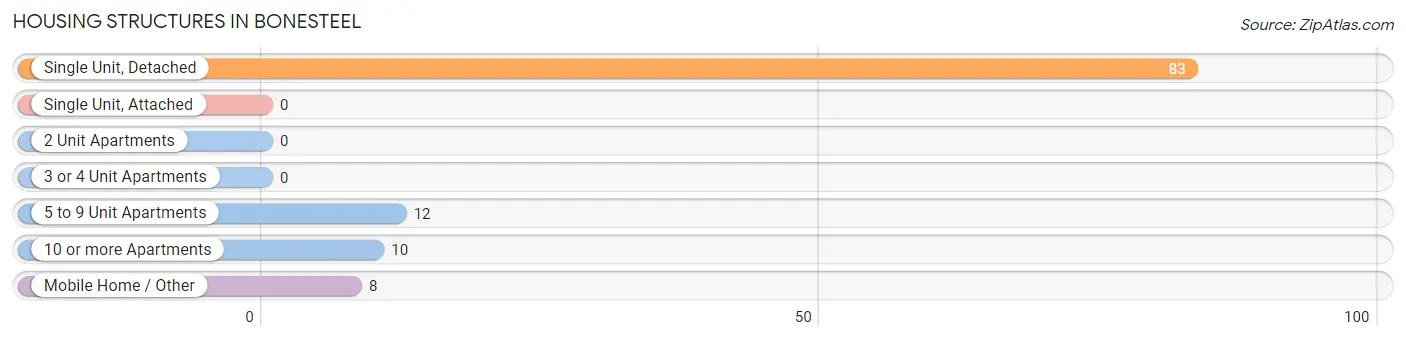
| Structure Type | # Housing Units | % Housing Units |
| Single Unit, Detached | 83 | 73.5% |
| Single Unit, Attached | 0 | 0.0% |
| 2 Unit Apartments | 0 | 0.0% |
| 3 or 4 Unit Apartments | 0 | 0.0% |
| 5 to 9 Unit Apartments | 12 | 10.6% |
| 10 or more Apartments | 10 | 8.8% |
| Mobile Home / Other | 8 | 7.1% |
| Total | 113 | 100.0% |
Housing Structures by Occupancy in Bonesteel
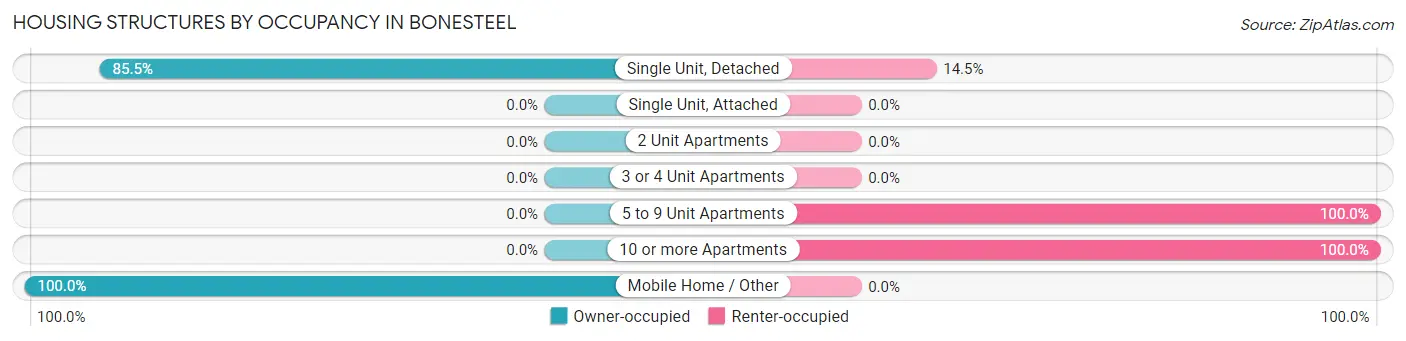
| Structure Type | Owner-occupied | Renter-occupied |
| Single Unit, Detached | 71 (85.5%) | 12 (14.5%) |
| Single Unit, Attached | 0 (0.0%) | 0 (0.0%) |
| 2 Unit Apartments | 0 (0.0%) | 0 (0.0%) |
| 3 or 4 Unit Apartments | 0 (0.0%) | 0 (0.0%) |
| 5 to 9 Unit Apartments | 0 (0.0%) | 12 (100.0%) |
| 10 or more Apartments | 0 (0.0%) | 10 (100.0%) |
| Mobile Home / Other | 8 (100.0%) | 0 (0.0%) |
| Total | 79 (69.9%) | 34 (30.1%) |
Housing Structures by Number of Rooms in Bonesteel
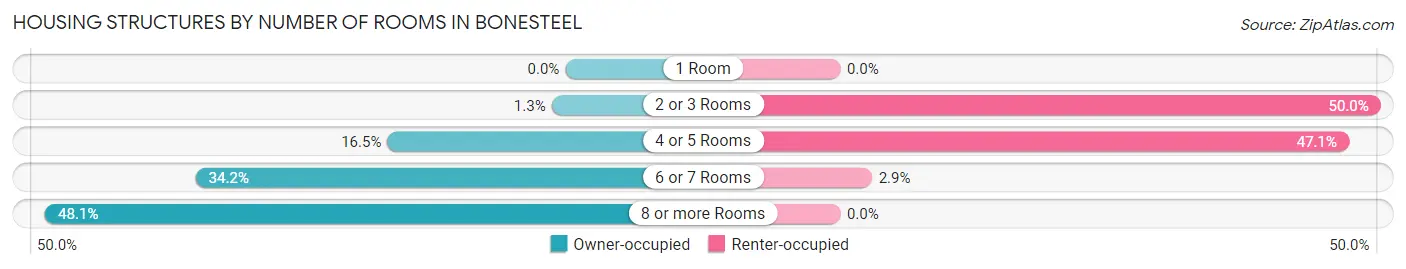
| Number of Rooms | Owner-occupied | Renter-occupied |
| 1 Room | 0 (0.0%) | 0 (0.0%) |
| 2 or 3 Rooms | 1 (1.3%) | 17 (50.0%) |
| 4 or 5 Rooms | 13 (16.5%) | 16 (47.1%) |
| 6 or 7 Rooms | 27 (34.2%) | 1 (2.9%) |
| 8 or more Rooms | 38 (48.1%) | 0 (0.0%) |
| Total | 79 (100.0%) | 34 (100.0%) |
Housing Structure by Heating Type in Bonesteel
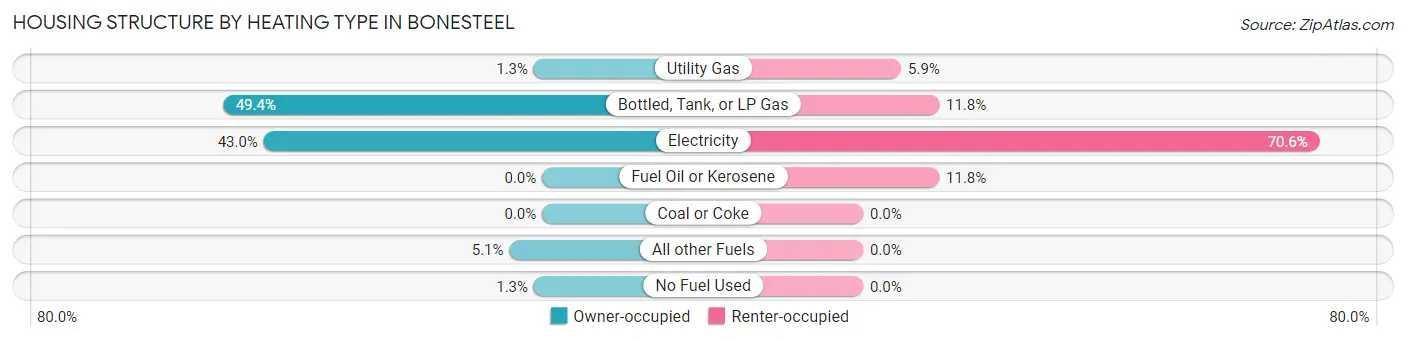
| Heating Type | Owner-occupied | Renter-occupied |
| Utility Gas | 1 (1.3%) | 2 (5.9%) |
| Bottled, Tank, or LP Gas | 39 (49.4%) | 4 (11.8%) |
| Electricity | 34 (43.0%) | 24 (70.6%) |
| Fuel Oil or Kerosene | 0 (0.0%) | 4 (11.8%) |
| Coal or Coke | 0 (0.0%) | 0 (0.0%) |
| All other Fuels | 4 (5.1%) | 0 (0.0%) |
| No Fuel Used | 1 (1.3%) | 0 (0.0%) |
| Total | 79 (100.0%) | 34 (100.0%) |
Household Vehicle Usage in Bonesteel
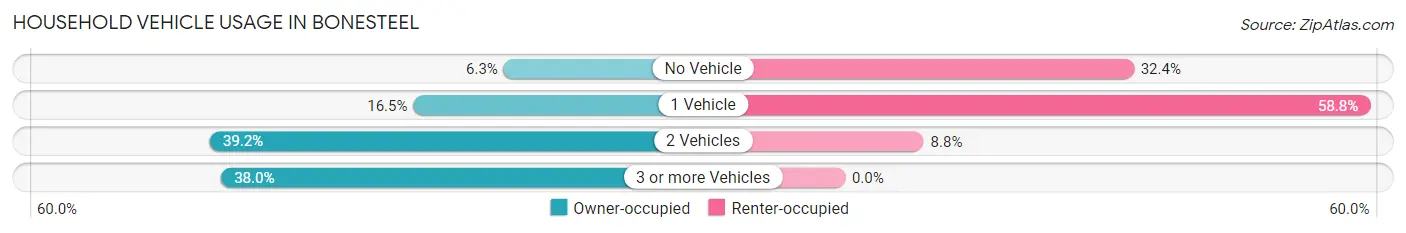
| Vehicles per Household | Owner-occupied | Renter-occupied |
| No Vehicle | 5 (6.3%) | 11 (32.4%) |
| 1 Vehicle | 13 (16.5%) | 20 (58.8%) |
| 2 Vehicles | 31 (39.2%) | 3 (8.8%) |
| 3 or more Vehicles | 30 (38.0%) | 0 (0.0%) |
| Total | 79 (100.0%) | 34 (100.0%) |
Real Estate & Mortgages in Bonesteel
Real Estate and Mortgage Overview in Bonesteel
| Characteristic | Without Mortgage | With Mortgage |
| Housing Units | 60 | 19 |
| Median Property Value | $55,600 | $97,500 |
| Median Household Income | $48,333 | $0 |
| Monthly Housing Costs | $408 | $0 |
| Real Estate Taxes | $900 | $0 |
Property Value by Mortgage Status in Bonesteel
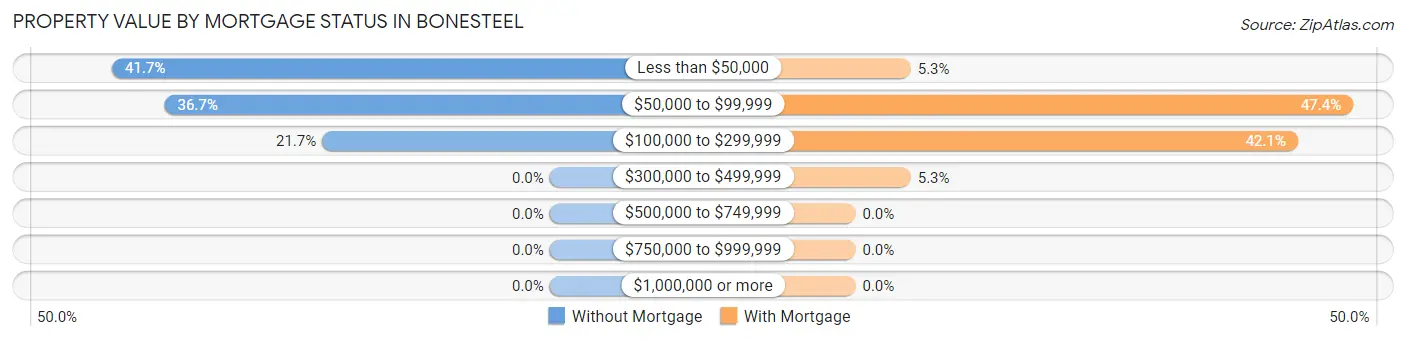
| Property Value | Without Mortgage | With Mortgage |
| Less than $50,000 | 25 (41.7%) | 1 (5.3%) |
| $50,000 to $99,999 | 22 (36.7%) | 9 (47.4%) |
| $100,000 to $299,999 | 13 (21.7%) | 8 (42.1%) |
| $300,000 to $499,999 | 0 (0.0%) | 1 (5.3%) |
| $500,000 to $749,999 | 0 (0.0%) | 0 (0.0%) |
| $750,000 to $999,999 | 0 (0.0%) | 0 (0.0%) |
| $1,000,000 or more | 0 (0.0%) | 0 (0.0%) |
| Total | 60 (100.0%) | 19 (100.0%) |
Household Income by Mortgage Status in Bonesteel
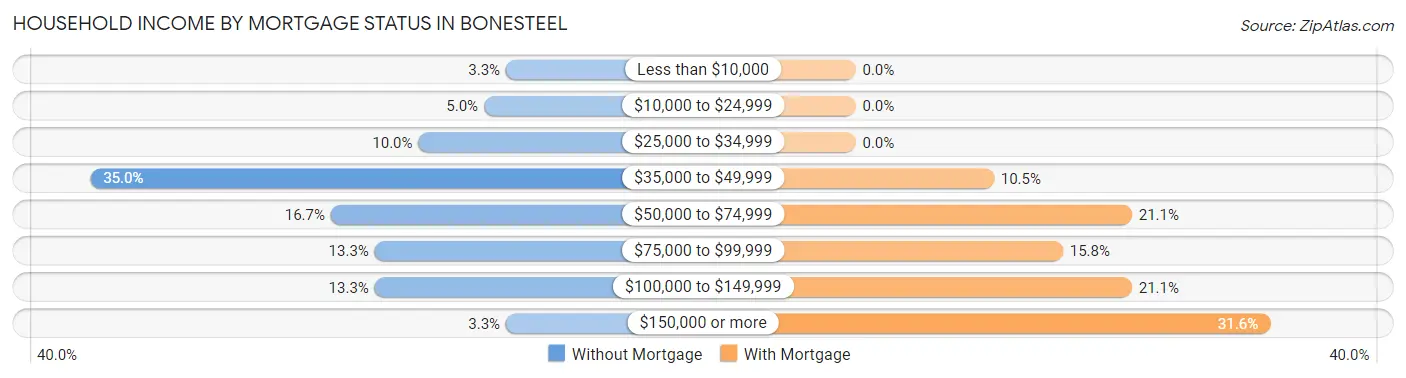
| Household Income | Without Mortgage | With Mortgage |
| Less than $10,000 | 2 (3.3%) | 0 (0.0%) |
| $10,000 to $24,999 | 3 (5.0%) | 0 (0.0%) |
| $25,000 to $34,999 | 6 (10.0%) | 0 (0.0%) |
| $35,000 to $49,999 | 21 (35.0%) | 2 (10.5%) |
| $50,000 to $74,999 | 10 (16.7%) | 4 (21.0%) |
| $75,000 to $99,999 | 8 (13.3%) | 3 (15.8%) |
| $100,000 to $149,999 | 8 (13.3%) | 4 (21.0%) |
| $150,000 or more | 2 (3.3%) | 6 (31.6%) |
| Total | 60 (100.0%) | 19 (100.0%) |
Property Value to Household Income Ratio in Bonesteel
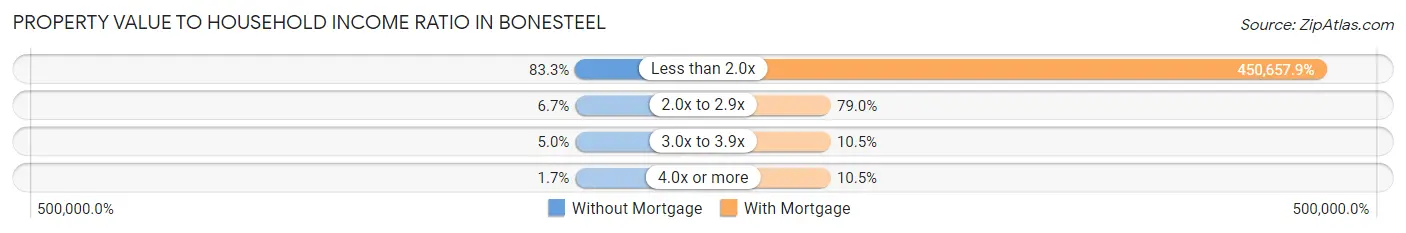
| Value-to-Income Ratio | Without Mortgage | With Mortgage |
| Less than 2.0x | 50 (83.3%) | 85,625 (450,657.9%) |
| 2.0x to 2.9x | 4 (6.7%) | 15 (78.9%) |
| 3.0x to 3.9x | 3 (5.0%) | 2 (10.5%) |
| 4.0x or more | 1 (1.7%) | 2 (10.5%) |
| Total | 60 (100.0%) | 19 (100.0%) |
Real Estate Taxes by Mortgage Status in Bonesteel
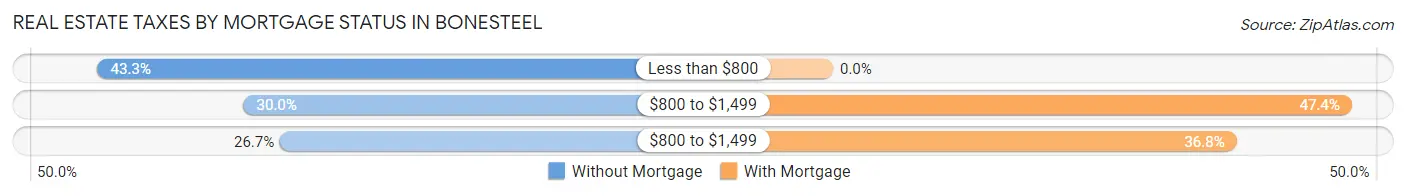
| Property Taxes | Without Mortgage | With Mortgage |
| Less than $800 | 26 (43.3%) | 0 (0.0%) |
| $800 to $1,499 | 18 (30.0%) | 9 (47.4%) |
| $800 to $1,499 | 16 (26.7%) | 7 (36.8%) |
| Total | 60 (100.0%) | 19 (100.0%) |
Health & Disability in Bonesteel
Health Insurance Coverage by Age in Bonesteel
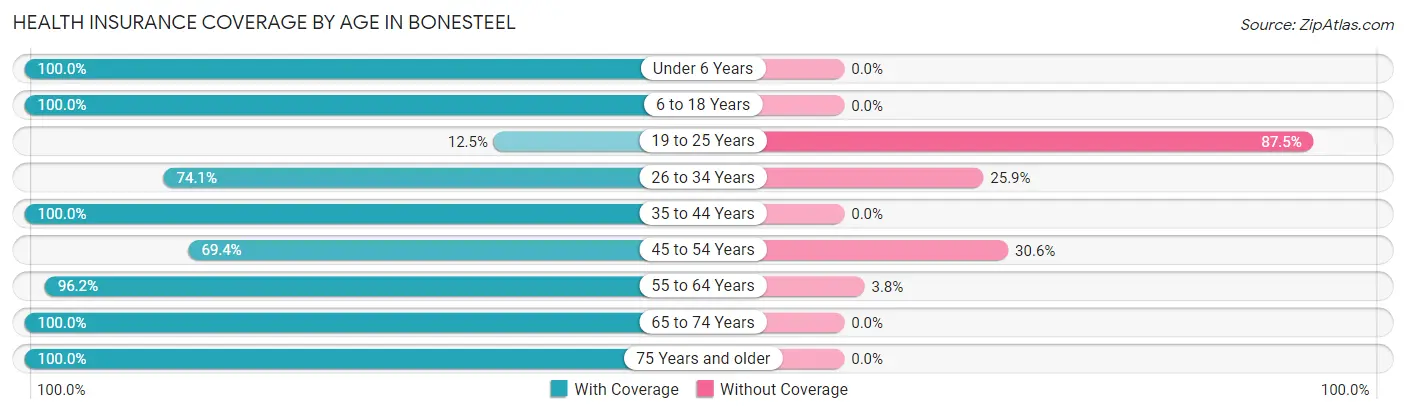
| Age Bracket | With Coverage | Without Coverage |
| Under 6 Years | 45 (100.0%) | 0 (0.0%) |
| 6 to 18 Years | 75 (100.0%) | 0 (0.0%) |
| 19 to 25 Years | 1 (12.5%) | 7 (87.5%) |
| 26 to 34 Years | 20 (74.1%) | 7 (25.9%) |
| 35 to 44 Years | 19 (100.0%) | 0 (0.0%) |
| 45 to 54 Years | 25 (69.4%) | 11 (30.6%) |
| 55 to 64 Years | 51 (96.2%) | 2 (3.8%) |
| 65 to 74 Years | 24 (100.0%) | 0 (0.0%) |
| 75 Years and older | 44 (100.0%) | 0 (0.0%) |
| Total | 304 (91.8%) | 27 (8.2%) |
Health Insurance Coverage by Citizenship Status in Bonesteel
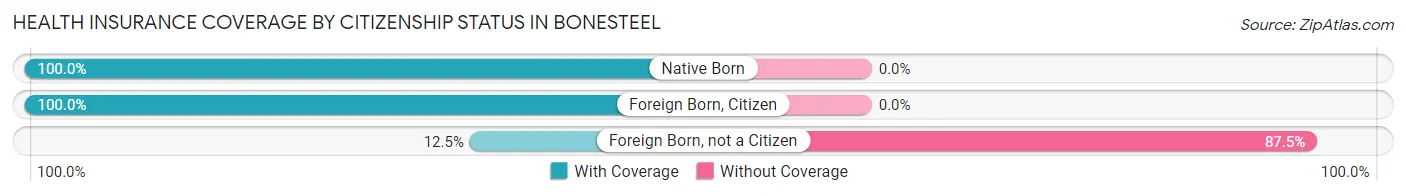
| Citizenship Status | With Coverage | Without Coverage |
| Native Born | 45 (100.0%) | 0 (0.0%) |
| Foreign Born, Citizen | 75 (100.0%) | 0 (0.0%) |
| Foreign Born, not a Citizen | 1 (12.5%) | 7 (87.5%) |
Health Insurance Coverage by Household Income in Bonesteel
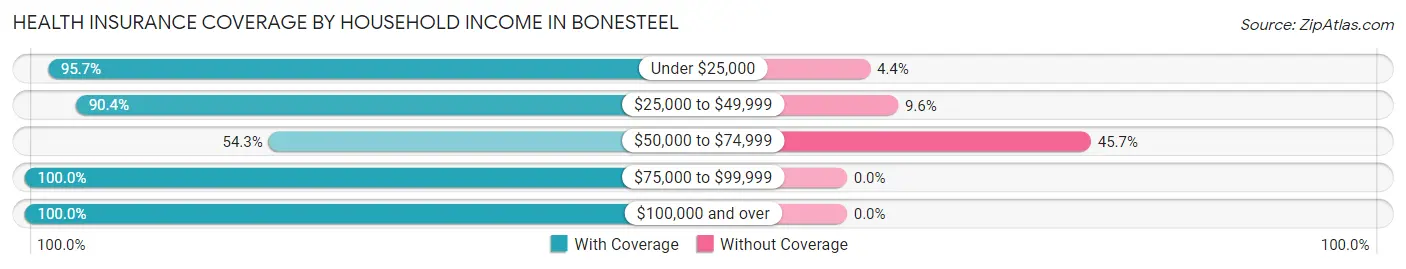
| Household Income | With Coverage | Without Coverage |
| Under $25,000 | 88 (95.7%) | 4 (4.3%) |
| $25,000 to $49,999 | 66 (90.4%) | 7 (9.6%) |
| $50,000 to $74,999 | 19 (54.3%) | 16 (45.7%) |
| $75,000 to $99,999 | 46 (100.0%) | 0 (0.0%) |
| $100,000 and over | 85 (100.0%) | 0 (0.0%) |
Public vs Private Health Insurance Coverage by Age in Bonesteel
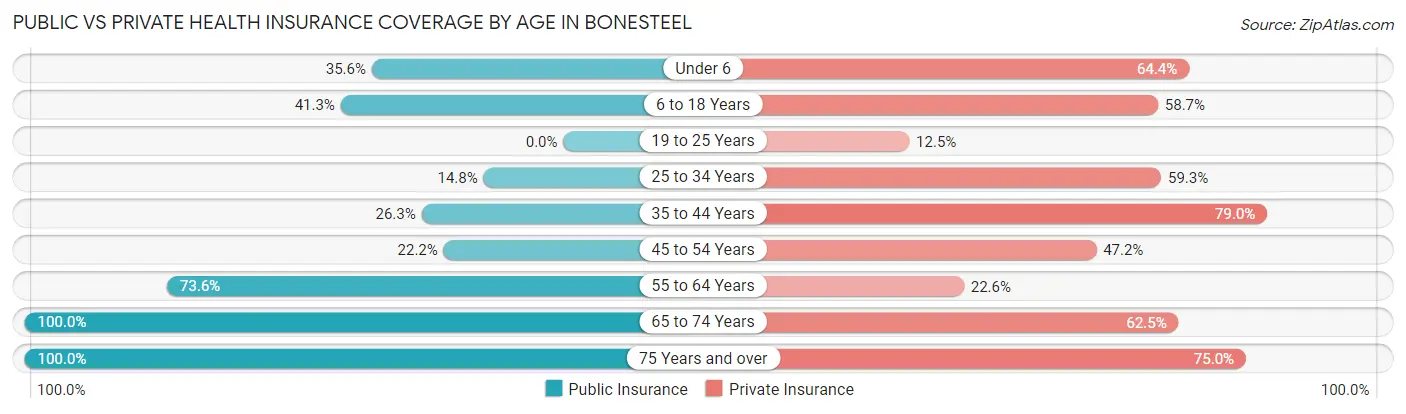
| Age Bracket | Public Insurance | Private Insurance |
| Under 6 | 16 (35.6%) | 29 (64.4%) |
| 6 to 18 Years | 31 (41.3%) | 44 (58.7%) |
| 19 to 25 Years | 0 (0.0%) | 1 (12.5%) |
| 25 to 34 Years | 4 (14.8%) | 16 (59.3%) |
| 35 to 44 Years | 5 (26.3%) | 15 (78.9%) |
| 45 to 54 Years | 8 (22.2%) | 17 (47.2%) |
| 55 to 64 Years | 39 (73.6%) | 12 (22.6%) |
| 65 to 74 Years | 24 (100.0%) | 15 (62.5%) |
| 75 Years and over | 44 (100.0%) | 33 (75.0%) |
| Total | 171 (51.7%) | 182 (55.0%) |
Disability Status by Sex by Age in Bonesteel
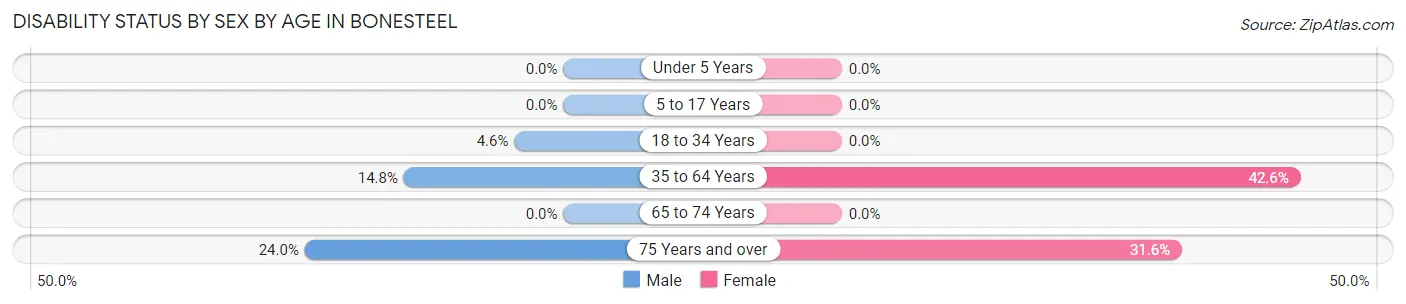
| Age Bracket | Male | Female |
| Under 5 Years | 0 (0.0%) | 0 (0.0%) |
| 5 to 17 Years | 0 (0.0%) | 0 (0.0%) |
| 18 to 34 Years | 2 (4.5%) | 0 (0.0%) |
| 35 to 64 Years | 8 (14.8%) | 23 (42.6%) |
| 65 to 74 Years | 0 (0.0%) | 0 (0.0%) |
| 75 Years and over | 6 (24.0%) | 6 (31.6%) |
Disability Class by Sex by Age in Bonesteel
Disability Class: Hearing Difficulty
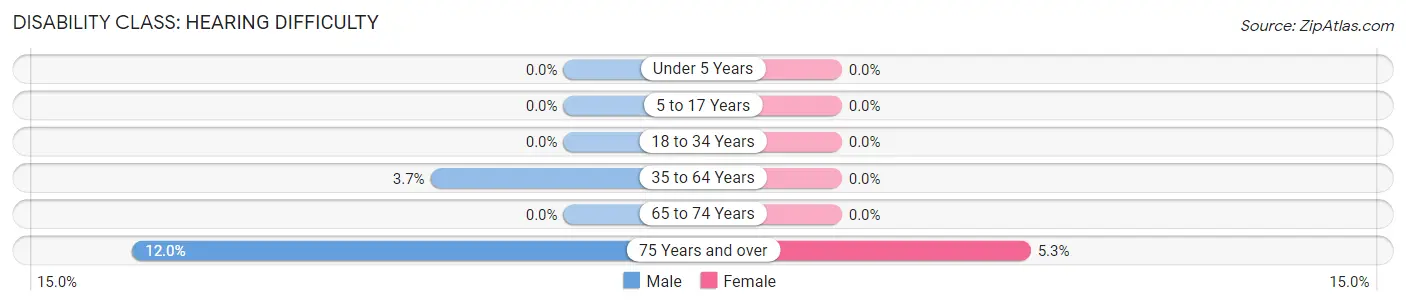
| Age Bracket | Male | Female |
| Under 5 Years | 0 (0.0%) | 0 (0.0%) |
| 5 to 17 Years | 0 (0.0%) | 0 (0.0%) |
| 18 to 34 Years | 0 (0.0%) | 0 (0.0%) |
| 35 to 64 Years | 2 (3.7%) | 0 (0.0%) |
| 65 to 74 Years | 0 (0.0%) | 0 (0.0%) |
| 75 Years and over | 3 (12.0%) | 1 (5.3%) |
Disability Class: Vision Difficulty
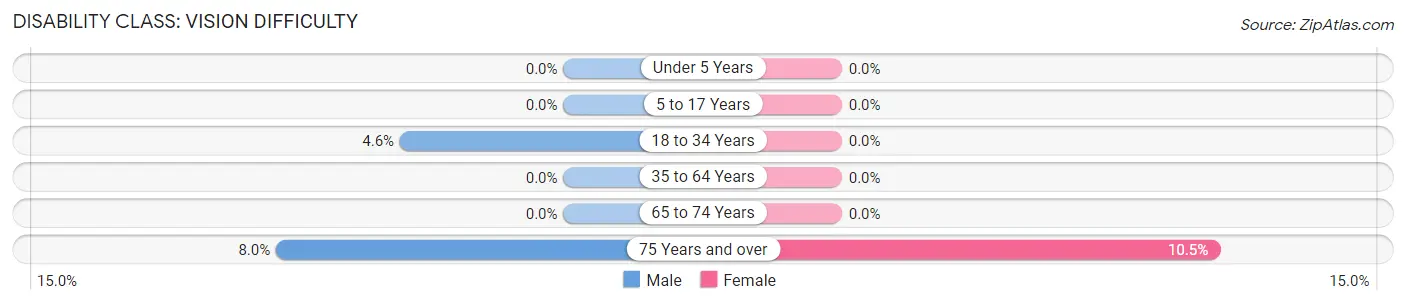
| Age Bracket | Male | Female |
| Under 5 Years | 0 (0.0%) | 0 (0.0%) |
| 5 to 17 Years | 0 (0.0%) | 0 (0.0%) |
| 18 to 34 Years | 2 (4.5%) | 0 (0.0%) |
| 35 to 64 Years | 0 (0.0%) | 0 (0.0%) |
| 65 to 74 Years | 0 (0.0%) | 0 (0.0%) |
| 75 Years and over | 2 (8.0%) | 2 (10.5%) |
Disability Class: Cognitive Difficulty
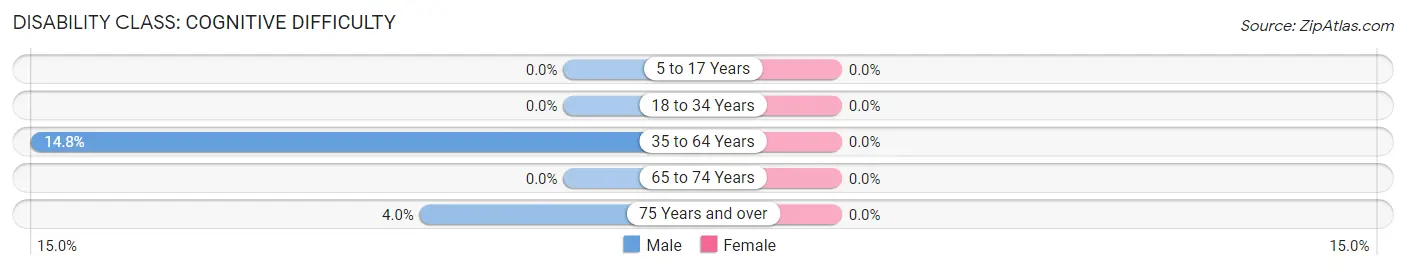
| Age Bracket | Male | Female |
| 5 to 17 Years | 0 (0.0%) | 0 (0.0%) |
| 18 to 34 Years | 0 (0.0%) | 0 (0.0%) |
| 35 to 64 Years | 8 (14.8%) | 0 (0.0%) |
| 65 to 74 Years | 0 (0.0%) | 0 (0.0%) |
| 75 Years and over | 1 (4.0%) | 0 (0.0%) |
Disability Class: Ambulatory Difficulty
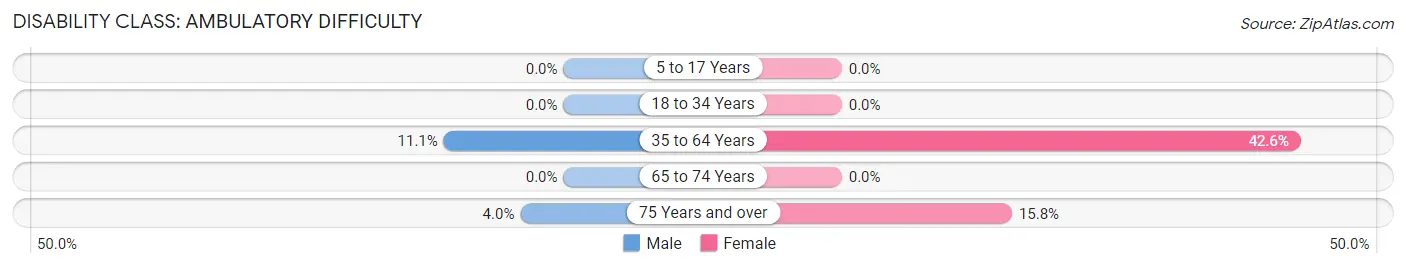
| Age Bracket | Male | Female |
| 5 to 17 Years | 0 (0.0%) | 0 (0.0%) |
| 18 to 34 Years | 0 (0.0%) | 0 (0.0%) |
| 35 to 64 Years | 6 (11.1%) | 23 (42.6%) |
| 65 to 74 Years | 0 (0.0%) | 0 (0.0%) |
| 75 Years and over | 1 (4.0%) | 3 (15.8%) |
Disability Class: Self-Care Difficulty
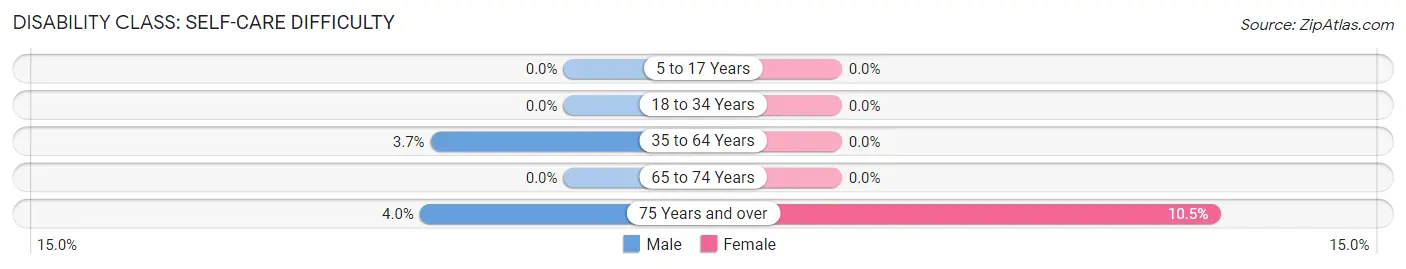
| Age Bracket | Male | Female |
| 5 to 17 Years | 0 (0.0%) | 0 (0.0%) |
| 18 to 34 Years | 0 (0.0%) | 0 (0.0%) |
| 35 to 64 Years | 2 (3.7%) | 0 (0.0%) |
| 65 to 74 Years | 0 (0.0%) | 0 (0.0%) |
| 75 Years and over | 1 (4.0%) | 2 (10.5%) |
Technology Access in Bonesteel
Computing Device Access in Bonesteel
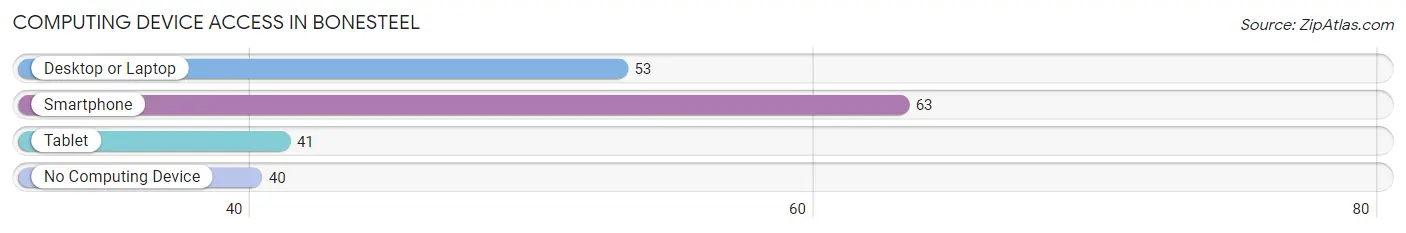
| Device Type | # Households | % Households |
| Desktop or Laptop | 53 | 46.9% |
| Smartphone | 63 | 55.7% |
| Tablet | 41 | 36.3% |
| No Computing Device | 40 | 35.4% |
| Total | 113 | 100.0% |
Internet Access in Bonesteel
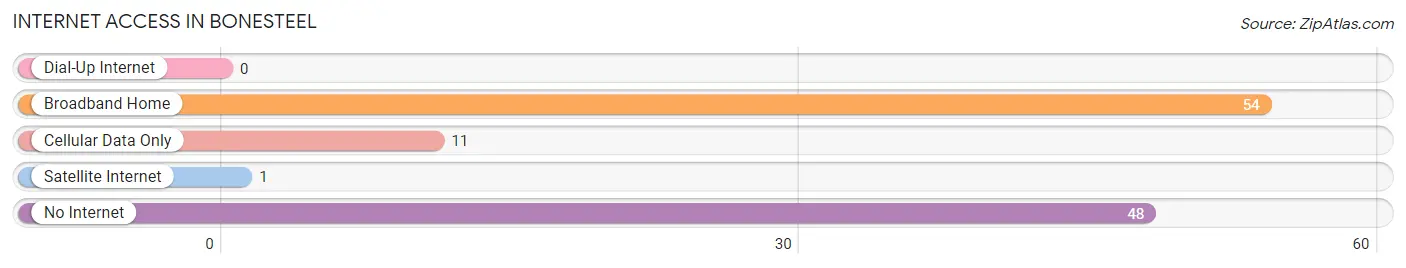
| Internet Type | # Households | % Households |
| Dial-Up Internet | 0 | 0.0% |
| Broadband Home | 54 | 47.8% |
| Cellular Data Only | 11 | 9.7% |
| Satellite Internet | 1 | 0.9% |
| No Internet | 48 | 42.5% |
| Total | 113 | 100.0% |
Bonesteel Summary
Bonesteel is a small town located in Gregory County, South Dakota. It is situated in the southeastern corner of the state, near the Nebraska border. The town was founded in 1887 and has a population of approximately 500 people.
History
Bonesteel was founded in 1887 by a group of settlers from Iowa. The town was named after the Bonesteel family, who were among the first settlers. The town was originally a farming community, but it soon became a trading center for the surrounding area. The town was incorporated in 1891 and the first post office was established in 1892.
In the early 1900s, Bonesteel was a thriving community with a variety of businesses, including a bank, a hotel, a general store, a blacksmith shop, and a livery stable. The town also had a school, a church, and a newspaper.
In the 1920s, the town began to decline as the railroad bypassed it. The Great Depression further weakened the town, and many of the businesses closed. The population decreased from a peak of over 500 in the 1920s to just over 200 in the 1950s.
In the 1960s, the town began to revive as a result of the construction of the Fort Randall Dam. The dam created a large lake, which attracted tourists and new residents to the area. The population of Bonesteel has been steadily increasing since then, and it now stands at around 500.
Geography
Bonesteel is located in the southeastern corner of South Dakota, near the Nebraska border. The town is situated on the banks of the Missouri River, and is surrounded by rolling hills and prairies. The town is located in the Central Plains region of the state, and has a semi-arid climate with hot summers and cold winters.
Economy
The economy of Bonesteel is largely based on agriculture and tourism. The town is home to several farms, which produce a variety of crops, including corn, soybeans, and wheat. The town also has a number of businesses, including a grocery store, a hardware store, and a restaurant.
Tourism is an important part of the local economy. The town is located near the Fort Randall Dam, which attracts visitors from all over the region. The town also has a number of recreational activities, including fishing, boating, and camping.
Demographics
As of the 2010 census, the population of Bonesteel was 498. The racial makeup of the town was 97.2% White, 0.2% African American, 0.4% Native American, 0.2% Asian, 0.2% from other races, and 1.9% from two or more races. The median household income was $37,500, and the median family income was $45,000. The per capita income was $18,000.
Conclusion
Bonesteel is a small town located in Gregory County, South Dakota. It was founded in 1887 and has a population of approximately 500 people. The town is largely based on agriculture and tourism, and is home to several farms and businesses. The town is also located near the Fort Randall Dam, which attracts visitors from all over the region. The population of Bonesteel is 97.2% White, and the median household income is $37,500.
Common Questions
What is Per Capita Income in Bonesteel?
Per Capita income in Bonesteel is $20,206.
What is the Median Family Income in Bonesteel?
Median Family Income in Bonesteel is $69,583.
What is the Median Household income in Bonesteel?
Median Household Income in Bonesteel is $40,938.
What is Income or Wage Gap in Bonesteel?
Income or Wage Gap in Bonesteel is 32.4%.
Women in Bonesteel earn 67.6 cents for every dollar earned by a man.
What is Inequality or Gini Index in Bonesteel?
Inequality or Gini Index in Bonesteel is 0.40.
What is the Total Population of Bonesteel?
Total Population of Bonesteel is 336.
What is the Total Male Population of Bonesteel?
Total Male Population of Bonesteel is 196.
What is the Total Female Population of Bonesteel?
Total Female Population of Bonesteel is 140.
What is the Ratio of Males per 100 Females in Bonesteel?
There are 140.00 Males per 100 Females in Bonesteel.
What is the Ratio of Females per 100 Males in Bonesteel?
There are 71.43 Females per 100 Males in Bonesteel.
What is the Median Population Age in Bonesteel?
Median Population Age in Bonesteel is 42.2 Years.
What is the Average Family Size in Bonesteel
Average Family Size in Bonesteel is 4.1 People.
What is the Average Household Size in Bonesteel
Average Household Size in Bonesteel is 2.9 People.
How Large is the Labor Force in Bonesteel?
There are 92 People in the Labor Forcein in Bonesteel.
What is the Percentage of People in the Labor Force in Bonesteel?
36.2% of People are in the Labor Force in Bonesteel.
What is the Unemployment Rate in Bonesteel?
Unemployment Rate in Bonesteel is 3.3%.