Onida, SD Map & Demographics
Onida Map
Onida Overview
$41,578
PER CAPITA INCOME
$99,583
AVG FAMILY INCOME
$67,500
AVG HOUSEHOLD INCOME
42.0%
WAGE / INCOME GAP [ % ]
58.0¢/ $1
WAGE / INCOME GAP [ $ ]
0.39
INEQUALITY / GINI INDEX
586
TOTAL POPULATION
296
MALE POPULATION
290
FEMALE POPULATION
102.07
MALES / 100 FEMALES
97.97
FEMALES / 100 MALES
52.3
MEDIAN AGE
3.0
AVG FAMILY SIZE
2.2
AVG HOUSEHOLD SIZE
327
LABOR FORCE [ PEOPLE ]
70.6%
PERCENT IN LABOR FORCE
Onida Zip Codes
Onida Area Codes
Income in Onida
Income Overview in Onida
Per Capita Income in Onida is $41,578, while median incomes of families and households are $99,583 and $67,500 respectively.
| Characteristic | Number | Measure |
| Per Capita Income | 586 | $41,578 |
| Median Family Income | 149 | $99,583 |
| Mean Family Income | 149 | $120,992 |
| Median Household Income | 260 | $67,500 |
| Mean Household Income | 260 | $91,198 |
| Income Deficit | 149 | $0 |
| Wage / Income Gap (%) | 586 | 42.03% |
| Wage / Income Gap ($) | 586 | 57.97¢ per $1 |
| Gini / Inequality Index | 586 | 0.39 |
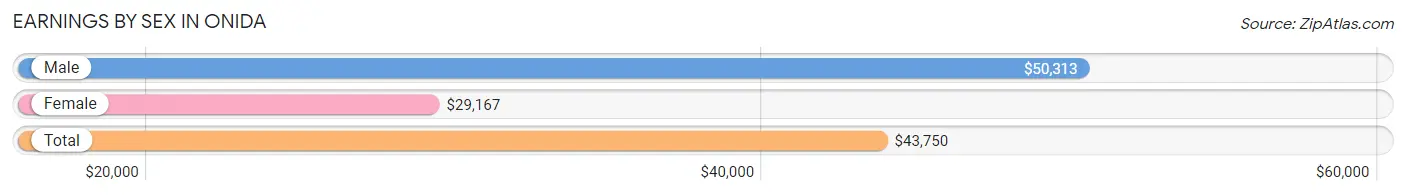
Earnings by Sex in Onida
Average Earnings in Onida are $43,750, $50,313 for men and $29,167 for women, a difference of 42.0%.
| Sex | Number | Average Earnings |
| Male | 208 (57.8%) | $50,313 |
| Female | 152 (42.2%) | $29,167 |
| Total | 360 (100.0%) | $43,750 |
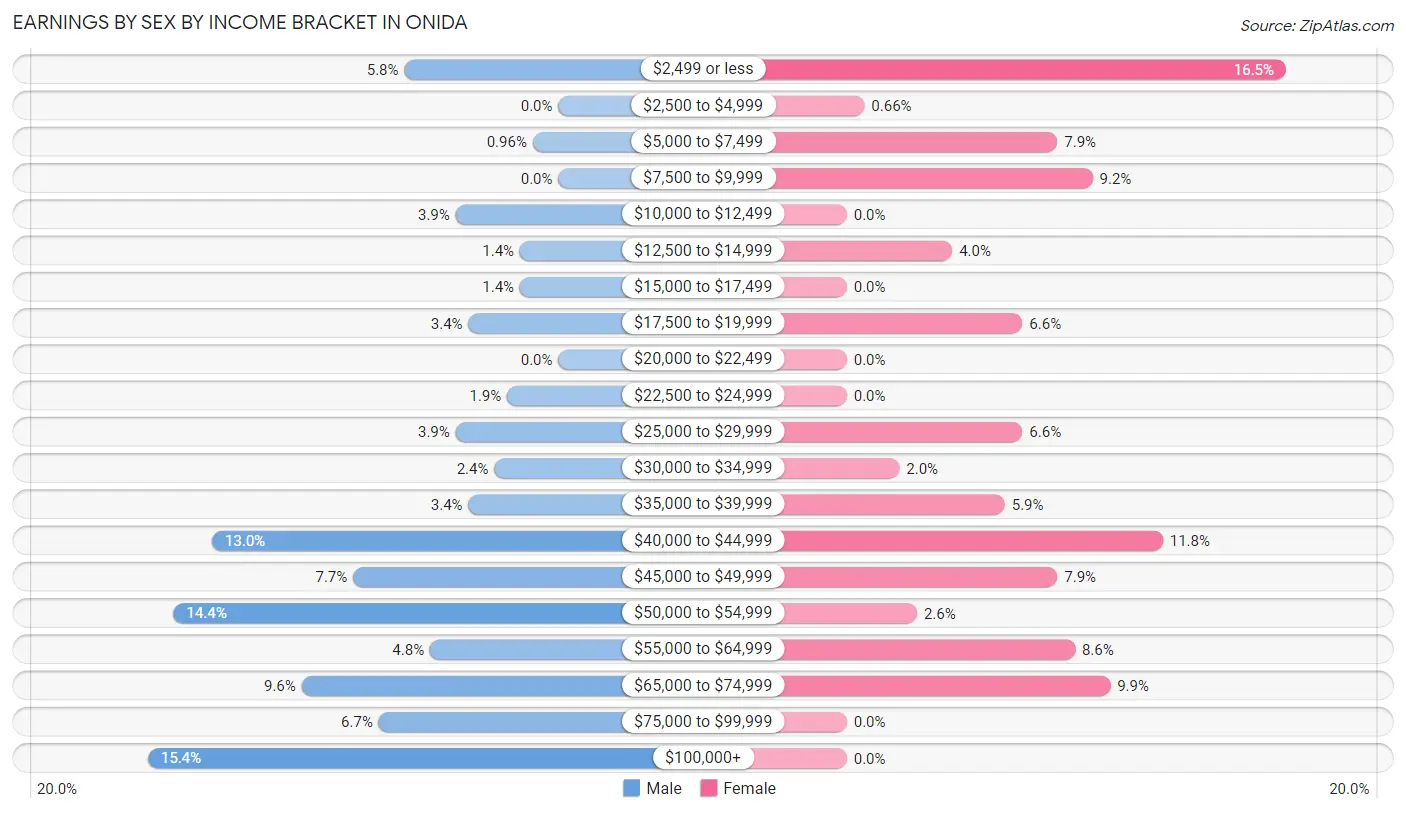
Earnings by Sex by Income Bracket in Onida
The most common earnings brackets in Onida are $100,000+ for men (32 | 15.4%) and $2,499 or less for women (25 | 16.5%).
| Income | Male | Female |
| $2,499 or less | 12 (5.8%) | 25 (16.5%) |
| $2,500 to $4,999 | 0 (0.0%) | 1 (0.7%) |
| $5,000 to $7,499 | 2 (1.0%) | 12 (7.9%) |
| $7,500 to $9,999 | 0 (0.0%) | 14 (9.2%) |
| $10,000 to $12,499 | 8 (3.8%) | 0 (0.0%) |
| $12,500 to $14,999 | 3 (1.4%) | 6 (4.0%) |
| $15,000 to $17,499 | 3 (1.4%) | 0 (0.0%) |
| $17,500 to $19,999 | 7 (3.4%) | 10 (6.6%) |
| $20,000 to $22,499 | 0 (0.0%) | 0 (0.0%) |
| $22,500 to $24,999 | 4 (1.9%) | 0 (0.0%) |
| $25,000 to $29,999 | 8 (3.8%) | 10 (6.6%) |
| $30,000 to $34,999 | 5 (2.4%) | 3 (2.0%) |
| $35,000 to $39,999 | 7 (3.4%) | 9 (5.9%) |
| $40,000 to $44,999 | 27 (13.0%) | 18 (11.8%) |
| $45,000 to $49,999 | 16 (7.7%) | 12 (7.9%) |
| $50,000 to $54,999 | 30 (14.4%) | 4 (2.6%) |
| $55,000 to $64,999 | 10 (4.8%) | 13 (8.6%) |
| $65,000 to $74,999 | 20 (9.6%) | 15 (9.9%) |
| $75,000 to $99,999 | 14 (6.7%) | 0 (0.0%) |
| $100,000+ | 32 (15.4%) | 0 (0.0%) |
| Total | 208 (100.0%) | 152 (100.0%) |
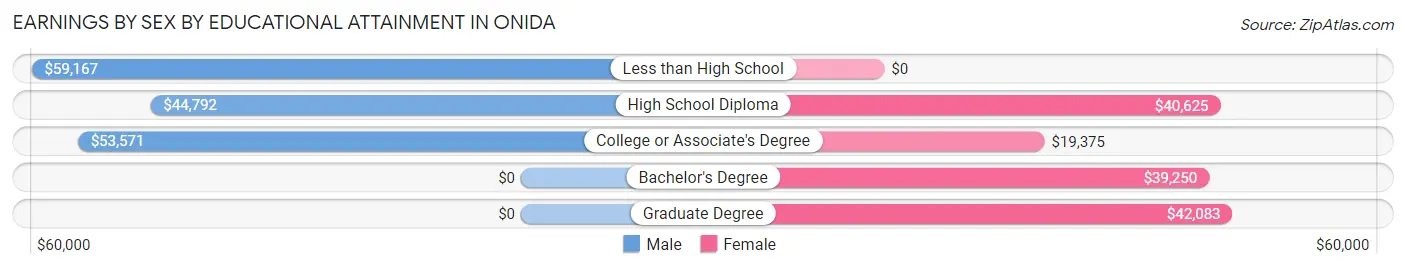
Earnings by Sex by Educational Attainment in Onida
Average earnings in Onida are $51,641 for men and $38,125 for women, a difference of 26.2%. Men with an educational attainment of less than high school enjoy the highest average annual earnings of $59,167, while those with high school diploma education earn the least with $44,792. Women with an educational attainment of graduate degree earn the most with the average annual earnings of $42,083, while those with college or associate's degree education have the smallest earnings of $19,375.
| Educational Attainment | Male Income | Female Income |
| Less than High School | $59,167 | $0 |
| High School Diploma | $44,792 | $40,625 |
| College or Associate's Degree | $53,571 | $19,375 |
| Bachelor's Degree | - | - |
| Graduate Degree | - | - |
| Total | $51,641 | $38,125 |
Family Income in Onida
Family Income Brackets in Onida
According to the Onida family income data, there are 41 families falling into the $100,000 to $149,999 income range, which is the most common income bracket and makes up 27.5% of all families.
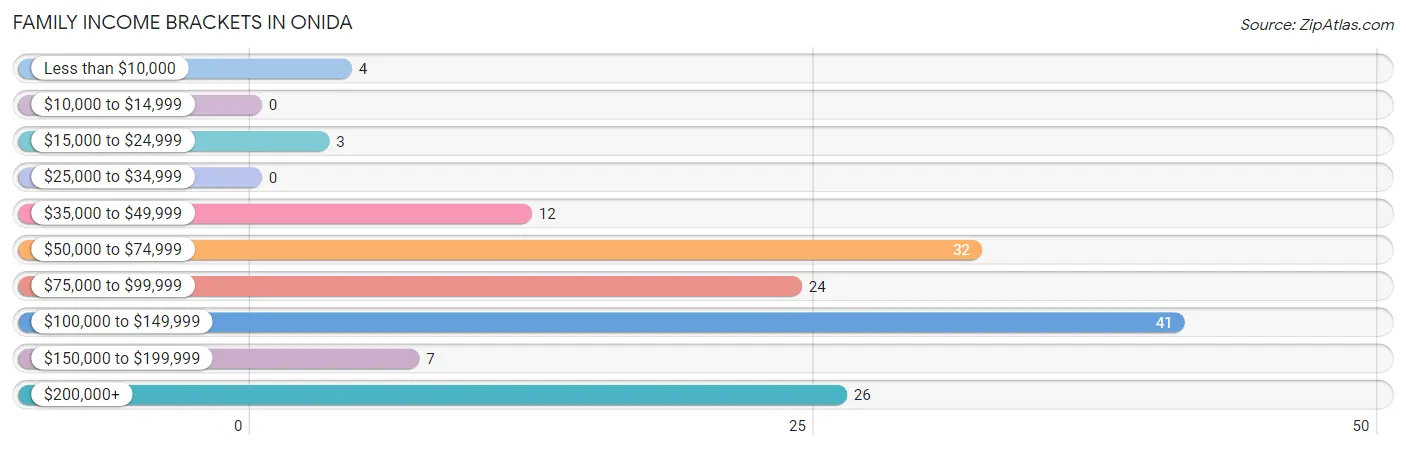
| Income Bracket | # Families | % Families |
| Less than $10,000 | 4 | 2.7% |
| $10,000 to $14,999 | 0 | 0.0% |
| $15,000 to $24,999 | 3 | 2.0% |
| $25,000 to $34,999 | 0 | 0.0% |
| $35,000 to $49,999 | 12 | 8.1% |
| $50,000 to $74,999 | 32 | 21.5% |
| $75,000 to $99,999 | 24 | 16.1% |
| $100,000 to $149,999 | 41 | 27.5% |
| $150,000 to $199,999 | 7 | 4.7% |
| $200,000+ | 26 | 17.4% |
Family Income by Famaliy Size in Onida
3-person families (22 | 14.8%) account for the highest median family income in Onida with $161,250 per family, while 3-person families (22 | 14.8%) have the highest median income of $53,750 per family member.
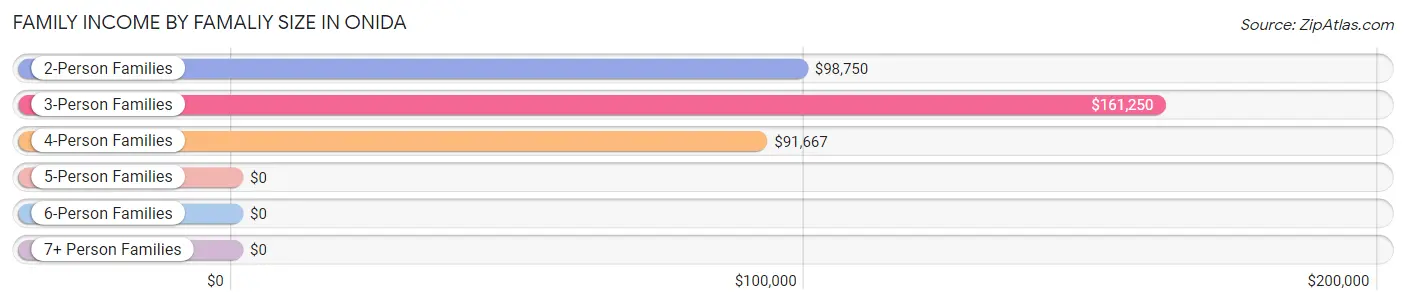
| Income Bracket | # Families | Median Income |
| 2-Person Families | 101 (67.8%) | $98,750 |
| 3-Person Families | 22 (14.8%) | $161,250 |
| 4-Person Families | 18 (12.1%) | $91,667 |
| 5-Person Families | 4 (2.7%) | $0 |
| 6-Person Families | 4 (2.7%) | $0 |
| 7+ Person Families | 0 (0.0%) | $0 |
| Total | 149 (100.0%) | $99,583 |
Family Income by Number of Earners in Onida
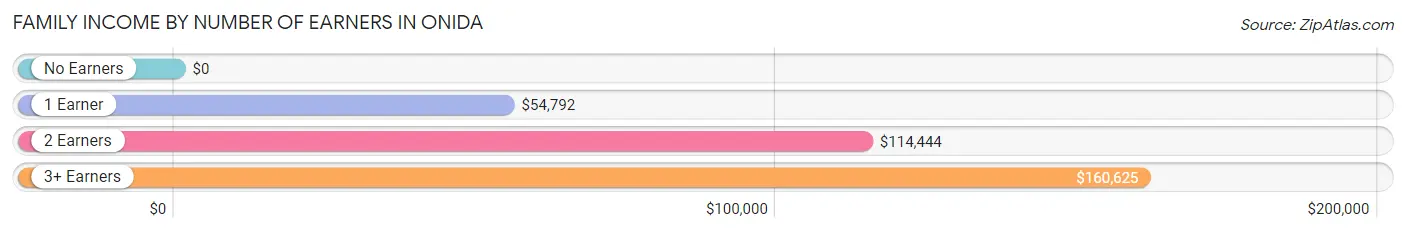
| Number of Earners | # Families | Median Income |
| No Earners | 21 (14.1%) | $0 |
| 1 Earner | 27 (18.1%) | $54,792 |
| 2 Earners | 88 (59.1%) | $114,444 |
| 3+ Earners | 13 (8.7%) | $160,625 |
| Total | 149 (100.0%) | $99,583 |
Household Income in Onida
Household Income Brackets in Onida
With 76 households falling in the category, the $50,000 to $74,999 income range is the most frequent in Onida, accounting for 29.2% of all households.
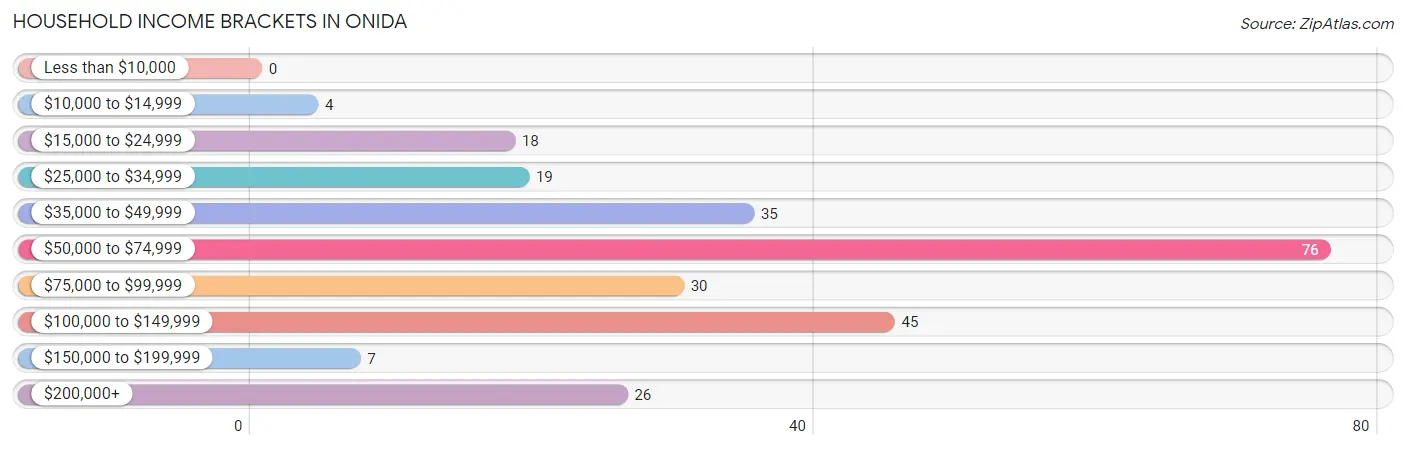
| Income Bracket | # Households | % Households |
| Less than $10,000 | 0 | 0.0% |
| $10,000 to $14,999 | 4 | 1.5% |
| $15,000 to $24,999 | 18 | 6.9% |
| $25,000 to $34,999 | 19 | 7.3% |
| $35,000 to $49,999 | 35 | 13.5% |
| $50,000 to $74,999 | 76 | 29.2% |
| $75,000 to $99,999 | 30 | 11.5% |
| $100,000 to $149,999 | 45 | 17.3% |
| $150,000 to $199,999 | 7 | 2.7% |
| $200,000+ | 26 | 10.0% |
Household Income by Householder Age in Onida
The median household income in Onida is $67,500, with the highest median household income of $69,583 found in the 45 to 64 years age bracket for the primary householder. A total of 109 households (41.9%) fall into this category. Meanwhile, the 15 to 24 years age bracket for the primary householder has the lowest median household income of $0, with 13 households (5.0%) in this group.
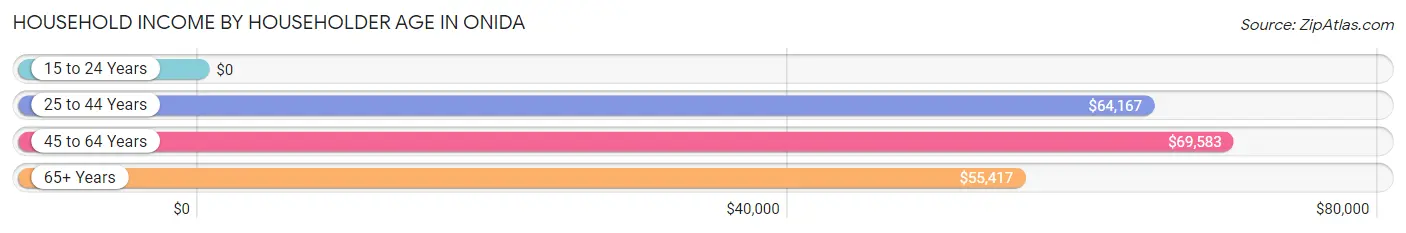
| Income Bracket | # Households | Median Income |
| 15 to 24 Years | 13 (5.0%) | $0 |
| 25 to 44 Years | 56 (21.5%) | $64,167 |
| 45 to 64 Years | 109 (41.9%) | $69,583 |
| 65+ Years | 82 (31.5%) | $55,417 |
| Total | 260 (100.0%) | $67,500 |
Poverty in Onida
Income Below Poverty by Sex and Age in Onida
With 5.7% poverty level for males and 7.4% for females among the residents of Onida, under 5 year old males and 6 to 11 year old females are the most vulnerable to poverty, with 4 males (19.1%) and 3 females (33.3%) in their respective age groups living below the poverty level.
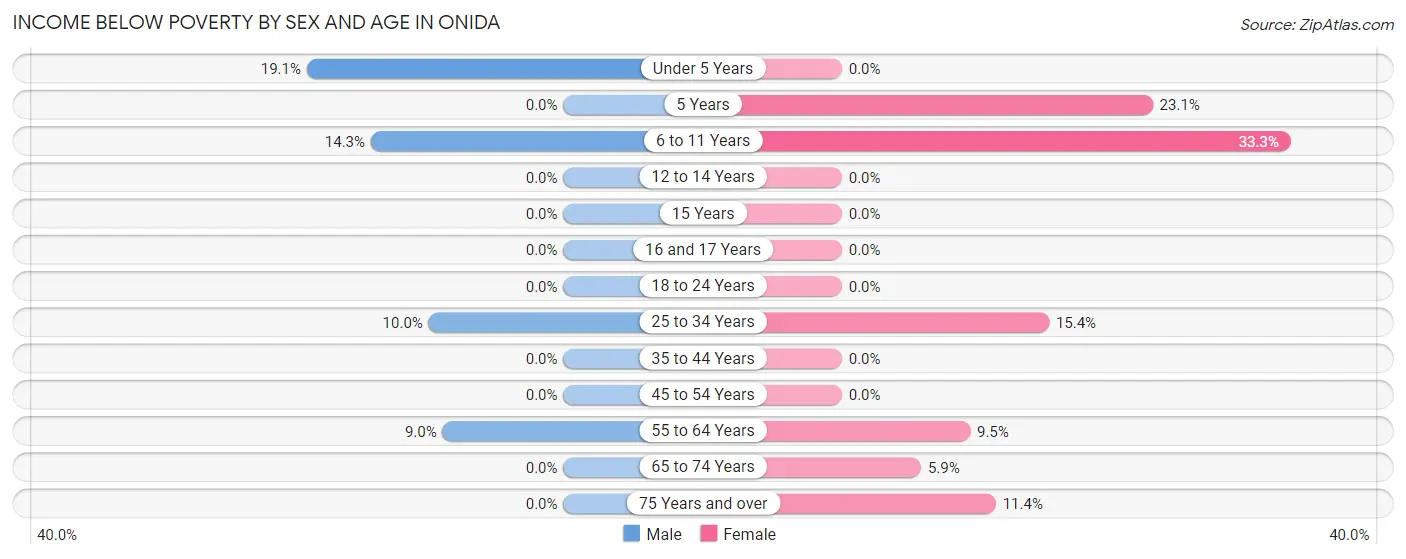
| Age Bracket | Male | Female |
| Under 5 Years | 4 (19.1%) | 0 (0.0%) |
| 5 Years | 0 (0.0%) | 3 (23.1%) |
| 6 to 11 Years | 3 (14.3%) | 3 (33.3%) |
| 12 to 14 Years | 0 (0.0%) | 0 (0.0%) |
| 15 Years | 0 (0.0%) | 0 (0.0%) |
| 16 and 17 Years | 0 (0.0%) | 0 (0.0%) |
| 18 to 24 Years | 0 (0.0%) | 0 (0.0%) |
| 25 to 34 Years | 3 (10.0%) | 4 (15.4%) |
| 35 to 44 Years | 0 (0.0%) | 0 (0.0%) |
| 45 to 54 Years | 0 (0.0%) | 0 (0.0%) |
| 55 to 64 Years | 7 (9.0%) | 6 (9.5%) |
| 65 to 74 Years | 0 (0.0%) | 1 (5.9%) |
| 75 Years and over | 0 (0.0%) | 4 (11.4%) |
| Total | 17 (5.7%) | 21 (7.4%) |
Income Above Poverty by Sex and Age in Onida
According to the poverty statistics in Onida, males aged 12 to 14 years and females aged under 5 years are the age groups that are most secure financially, with 100.0% of males and 100.0% of females in these age groups living above the poverty line.
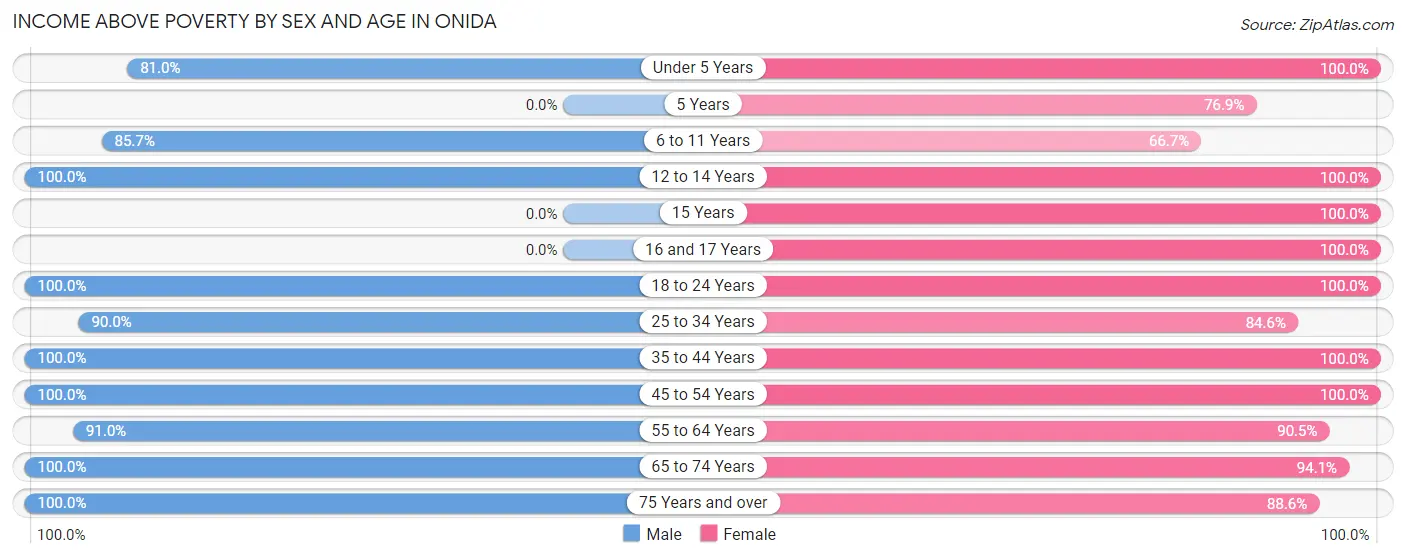
| Age Bracket | Male | Female |
| Under 5 Years | 17 (80.9%) | 26 (100.0%) |
| 5 Years | 0 (0.0%) | 10 (76.9%) |
| 6 to 11 Years | 18 (85.7%) | 6 (66.7%) |
| 12 to 14 Years | 12 (100.0%) | 2 (100.0%) |
| 15 Years | 0 (0.0%) | 13 (100.0%) |
| 16 and 17 Years | 0 (0.0%) | 20 (100.0%) |
| 18 to 24 Years | 21 (100.0%) | 4 (100.0%) |
| 25 to 34 Years | 27 (90.0%) | 22 (84.6%) |
| 35 to 44 Years | 27 (100.0%) | 21 (100.0%) |
| 45 to 54 Years | 23 (100.0%) | 35 (100.0%) |
| 55 to 64 Years | 71 (91.0%) | 57 (90.5%) |
| 65 to 74 Years | 25 (100.0%) | 16 (94.1%) |
| 75 Years and over | 38 (100.0%) | 31 (88.6%) |
| Total | 279 (94.3%) | 263 (92.6%) |
Income Below Poverty Among Married-Couple Families in Onida
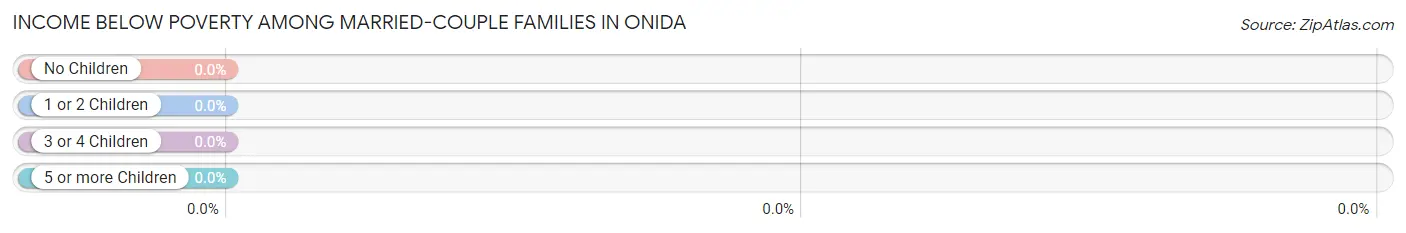
| Children | Above Poverty | Below Poverty |
| No Children | 111 (100.0%) | 0 (0.0%) |
| 1 or 2 Children | 23 (100.0%) | 0 (0.0%) |
| 3 or 4 Children | 4 (100.0%) | 0 (0.0%) |
| 5 or more Children | 0 (0.0%) | 0 (0.0%) |
| Total | 138 (100.0%) | 0 (0.0%) |
Income Below Poverty Among Single-Parent Households in Onida
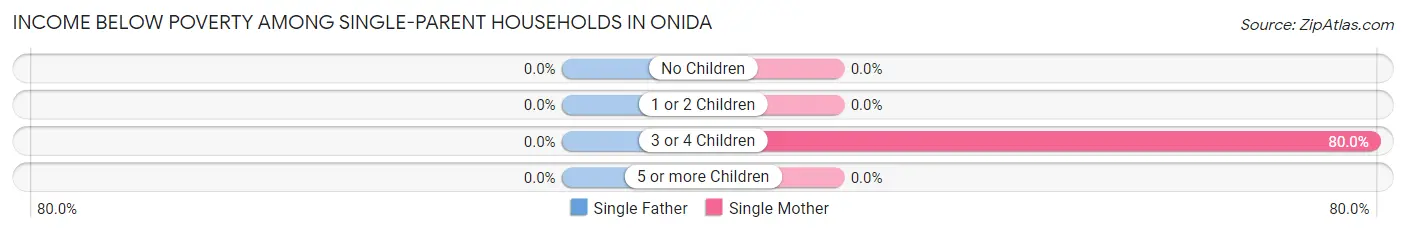
| Children | Single Father | Single Mother |
| No Children | 0 (0.0%) | 0 (0.0%) |
| 1 or 2 Children | 0 (0.0%) | 0 (0.0%) |
| 3 or 4 Children | 0 (0.0%) | 4 (80.0%) |
| 5 or more Children | 0 (0.0%) | 0 (0.0%) |
| Total | 0 (0.0%) | 4 (50.0%) |
Income Below Poverty Among Married-Couple vs Single-Parent Households in Onida
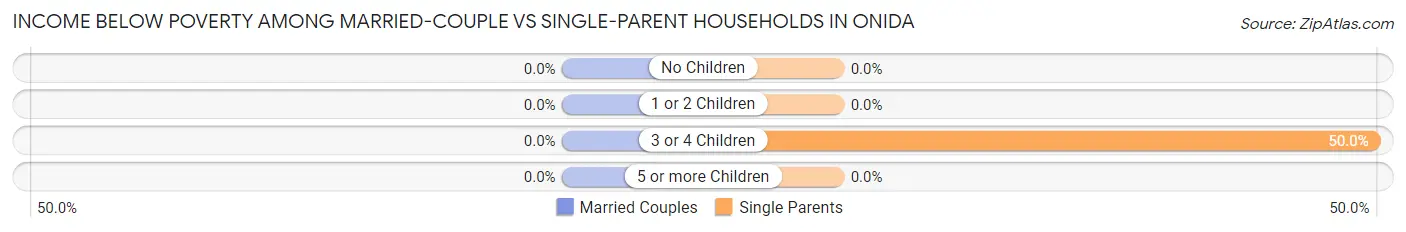
| Children | Married-Couple Families | Single-Parent Households |
| No Children | 0 (0.0%) | 0 (0.0%) |
| 1 or 2 Children | 0 (0.0%) | 0 (0.0%) |
| 3 or 4 Children | 0 (0.0%) | 4 (50.0%) |
| 5 or more Children | 0 (0.0%) | 0 (0.0%) |
| Total | 0 (0.0%) | 4 (36.4%) |
Race in Onida
The most populous races in Onida are White / Caucasian (565 | 96.4%), and Two or more Races (21 | 3.6%).
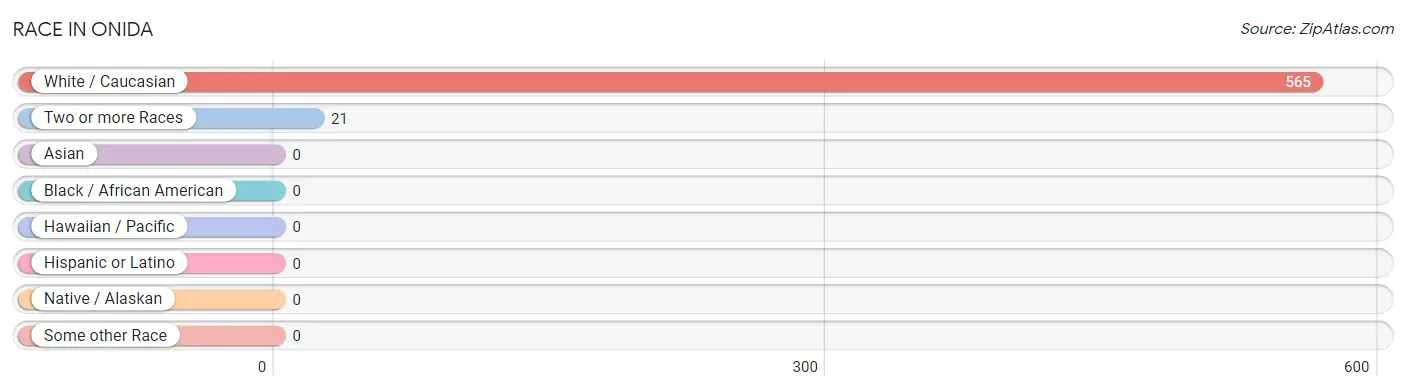
| Race | # Population | % Population |
| Asian | 0 | 0.0% |
| Black / African American | 0 | 0.0% |
| Hawaiian / Pacific | 0 | 0.0% |
| Hispanic or Latino | 0 | 0.0% |
| Native / Alaskan | 0 | 0.0% |
| White / Caucasian | 565 | 96.4% |
| Two or more Races | 21 | 3.6% |
| Some other Race | 0 | 0.0% |
| Total | 586 | 100.0% |
Ancestry in Onida
The most populous ancestries reported in Onida are German (226 | 38.6%), English (76 | 13.0%), Norwegian (63 | 10.7%), American (62 | 10.6%), and Irish (43 | 7.3%), together accounting for 80.2% of all Onida residents.
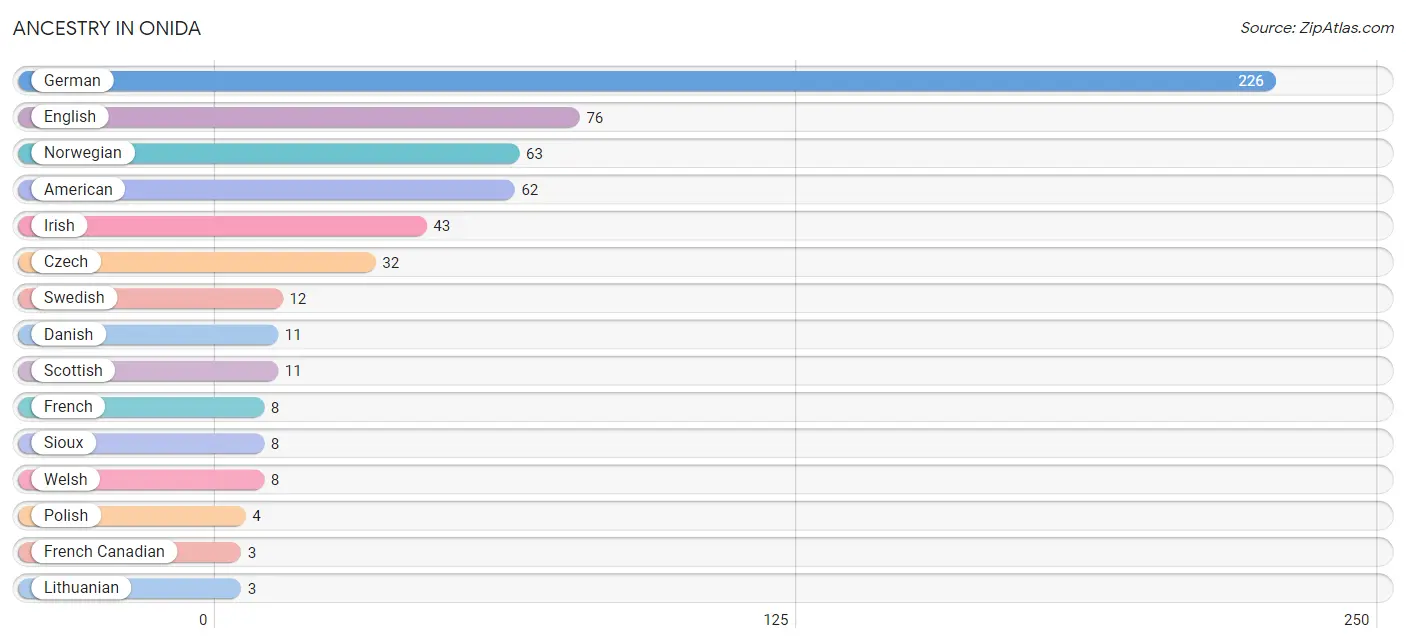
| Ancestry | # Population | % Population |
| American | 62 | 10.6% |
| Austrian | 2 | 0.3% |
| Czech | 32 | 5.5% |
| Danish | 11 | 1.9% |
| Dutch | 2 | 0.3% |
| English | 76 | 13.0% |
| French | 8 | 1.4% |
| French Canadian | 3 | 0.5% |
| German | 226 | 38.6% |
| Irish | 43 | 7.3% |
| Lithuanian | 3 | 0.5% |
| Norwegian | 63 | 10.7% |
| Polish | 4 | 0.7% |
| Scandinavian | 2 | 0.3% |
| Scottish | 11 | 1.9% |
| Sioux | 8 | 1.4% |
| Swedish | 12 | 2.1% |
| Welsh | 8 | 1.4% | View All 18 Rows |
Immigrants in Onida
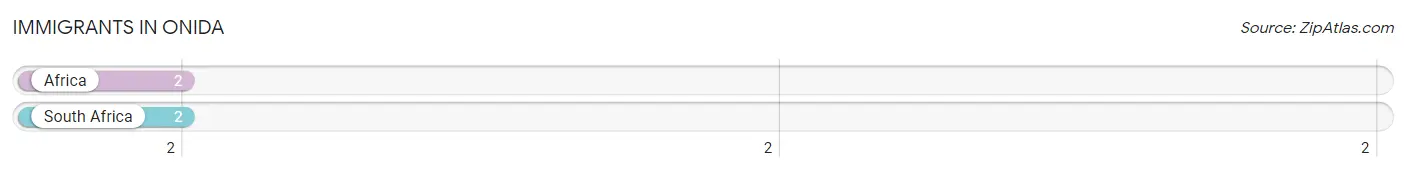
The most numerous immigrant groups reported in Onida came from Africa (2 | 0.3%), and South Africa (2 | 0.3%), together accounting for 0.7% of all Onida residents.
| Immigration Origin | # Population | % Population |
| Africa | 2 | 0.3% |
| South Africa | 2 | 0.3% | View All 2 Rows |
Sex and Age in Onida
Sex and Age in Onida
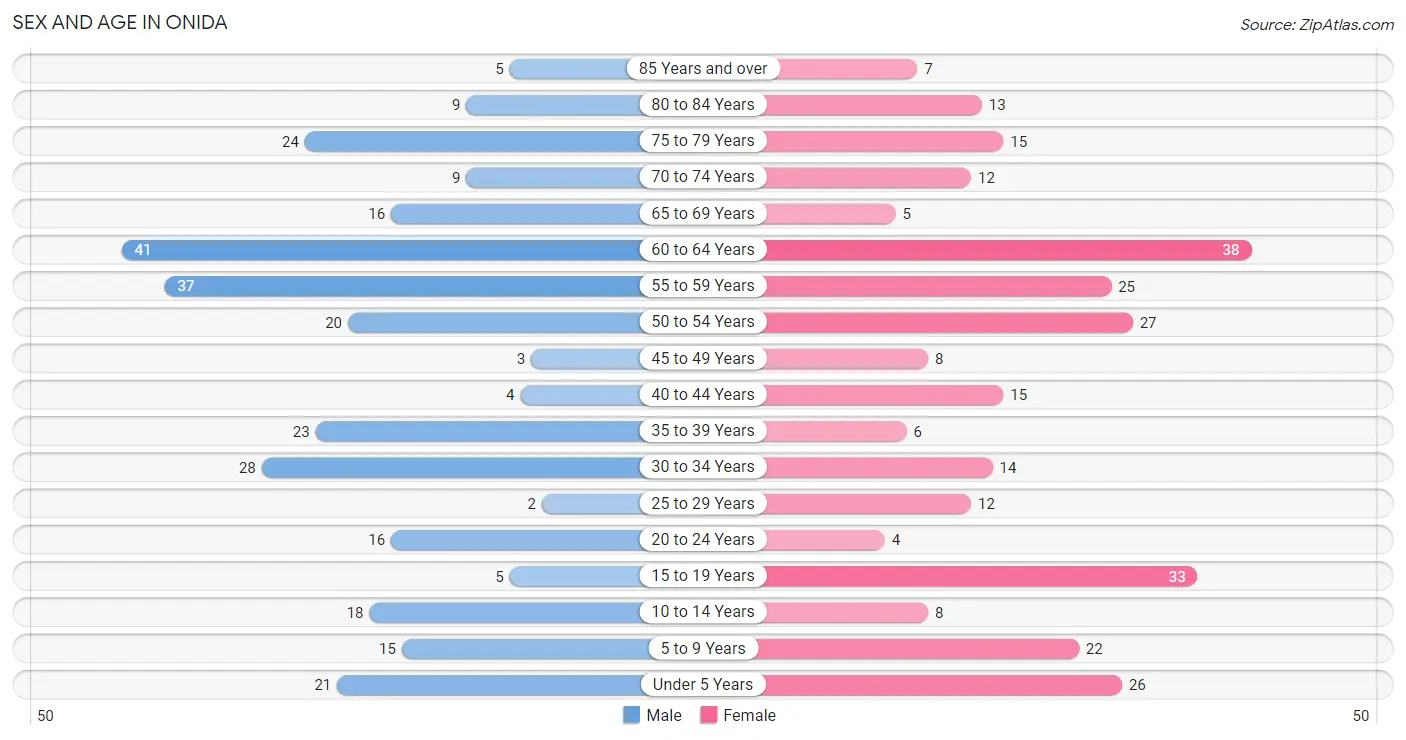
The most populous age groups in Onida are 60 to 64 Years (41 | 13.9%) for men and 60 to 64 Years (38 | 13.1%) for women.
| Age Bracket | Male | Female |
| Under 5 Years | 21 (7.1%) | 26 (9.0%) |
| 5 to 9 Years | 15 (5.1%) | 22 (7.6%) |
| 10 to 14 Years | 18 (6.1%) | 8 (2.8%) |
| 15 to 19 Years | 5 (1.7%) | 33 (11.4%) |
| 20 to 24 Years | 16 (5.4%) | 4 (1.4%) |
| 25 to 29 Years | 2 (0.7%) | 12 (4.1%) |
| 30 to 34 Years | 28 (9.5%) | 14 (4.8%) |
| 35 to 39 Years | 23 (7.8%) | 6 (2.1%) |
| 40 to 44 Years | 4 (1.3%) | 15 (5.2%) |
| 45 to 49 Years | 3 (1.0%) | 8 (2.8%) |
| 50 to 54 Years | 20 (6.8%) | 27 (9.3%) |
| 55 to 59 Years | 37 (12.5%) | 25 (8.6%) |
| 60 to 64 Years | 41 (13.9%) | 38 (13.1%) |
| 65 to 69 Years | 16 (5.4%) | 5 (1.7%) |
| 70 to 74 Years | 9 (3.0%) | 12 (4.1%) |
| 75 to 79 Years | 24 (8.1%) | 15 (5.2%) |
| 80 to 84 Years | 9 (3.0%) | 13 (4.5%) |
| 85 Years and over | 5 (1.7%) | 7 (2.4%) |
| Total | 296 (100.0%) | 290 (100.0%) |
Families and Households in Onida
Median Family Size in Onida
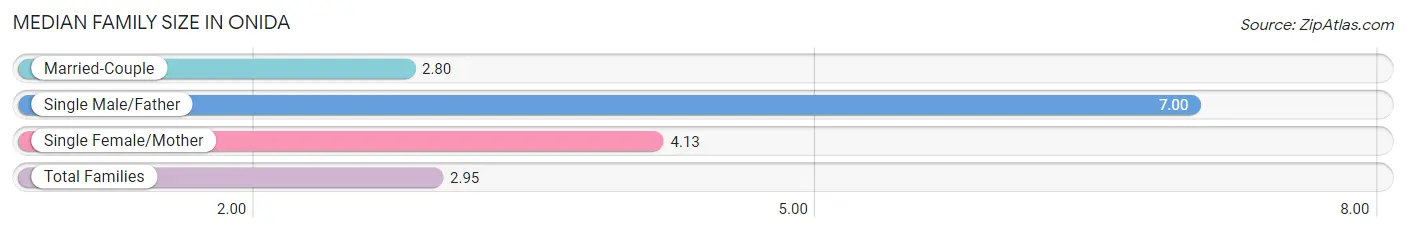
The median family size in Onida is 2.95 persons per family, with single male/father families (3 | 2.0%) accounting for the largest median family size of 7 persons per family. On the other hand, married-couple families (138 | 92.6%) represent the smallest median family size with 2.80 persons per family.
| Family Type | # Families | Family Size |
| Married-Couple | 138 (92.6%) | 2.80 |
| Single Male/Father | 3 (2.0%) | 7.00 |
| Single Female/Mother | 8 (5.4%) | 4.13 |
| Total Families | 149 (100.0%) | 2.95 |
Median Household Size in Onida
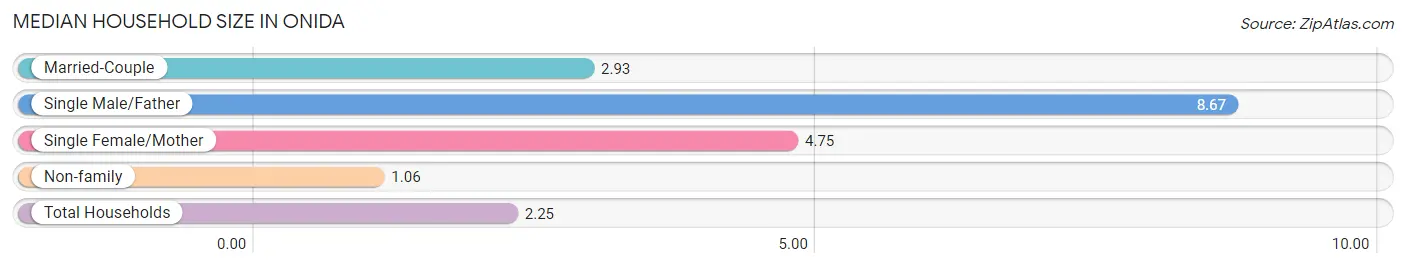
The median household size in Onida is 2.25 persons per household, with single male/father households (3 | 1.1%) accounting for the largest median household size of 8.67 persons per household. non-family households (111 | 42.7%) represent the smallest median household size with 1.06 persons per household.
| Household Type | # Households | Household Size |
| Married-Couple | 138 (53.1%) | 2.93 |
| Single Male/Father | 3 (1.1%) | 8.67 |
| Single Female/Mother | 8 (3.1%) | 4.75 |
| Non-family | 111 (42.7%) | 1.06 |
| Total Households | 260 (100.0%) | 2.25 |
Household Size by Marriage Status in Onida
Out of a total of 260 households in Onida, 149 (57.3%) are family households, while 111 (42.7%) are nonfamily households. The most numerous type of family households are 2-person households, comprising 95, and the most common type of nonfamily households are 1-person households, comprising 102.
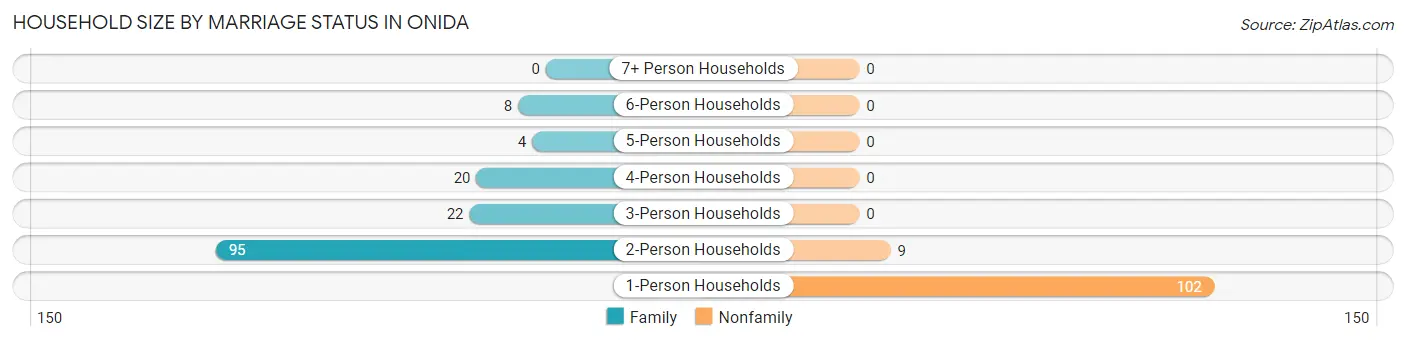
| Household Size | Family Households | Nonfamily Households |
| 1-Person Households | - | 102 (39.2%) |
| 2-Person Households | 95 (36.5%) | 9 (3.5%) |
| 3-Person Households | 22 (8.5%) | 0 (0.0%) |
| 4-Person Households | 20 (7.7%) | 0 (0.0%) |
| 5-Person Households | 4 (1.5%) | 0 (0.0%) |
| 6-Person Households | 8 (3.1%) | 0 (0.0%) |
| 7+ Person Households | 0 (0.0%) | 0 (0.0%) |
| Total | 149 (57.3%) | 111 (42.7%) |
Female Fertility in Onida
Fertility by Age in Onida
| Age Bracket | Women with Births | Births / 1,000 Women |
| 15 to 19 years | 0 (0.0%) | 0.0 |
| 20 to 34 years | 0 (0.0%) | 0.0 |
| 35 to 50 years | 0 (0.0%) | 0.0 |
| Total | 0 (0.0%) | 0.0 |
Fertility by Age by Marriage Status in Onida
| Age Bracket | Married | Unmarried |
| 15 to 19 years | 0 (0.0%) | 0 (0.0%) |
| 20 to 34 years | 0 (0.0%) | 0 (0.0%) |
| 35 to 50 years | 0 (0.0%) | 0 (0.0%) |
| Total | 0 (0.0%) | 0 (0.0%) |
Fertility by Education in Onida
| Educational Attainment | Women with Births | Births / 1,000 Women |
| Less than High School | 0 (0.0%) | 0.0 |
| High School Diploma | 0 (0.0%) | 0.0 |
| College or Associate's Degree | 0 (0.0%) | 0.0 |
| Bachelor's Degree | 0 (0.0%) | 0.0 |
| Graduate Degree | 0 (0.0%) | 0.0 |
| Total | 0 (0.0%) | 0.0 |
Fertility by Education by Marriage Status in Onida
| Educational Attainment | Married | Unmarried |
| Less than High School | 0 (0.0%) | 0 (0.0%) |
| High School Diploma | 0 (0.0%) | 0 (0.0%) |
| College or Associate's Degree | 0 (0.0%) | 0 (0.0%) |
| Bachelor's Degree | 0 (0.0%) | 0 (0.0%) |
| Graduate Degree | 0 (0.0%) | 0 (0.0%) |
| Total | 0 (0.0%) | 0 (0.0%) |
Employment Characteristics in Onida
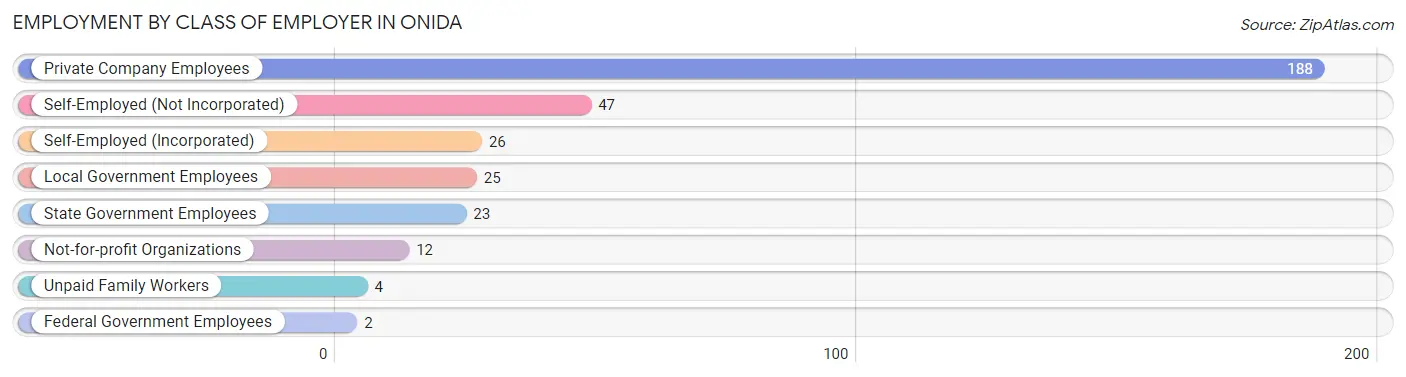
Employment by Class of Employer in Onida
Among the 327 employed individuals in Onida, private company employees (188 | 57.5%), self-employed (not incorporated) (47 | 14.4%), and self-employed (incorporated) (26 | 8.0%) make up the most common classes of employment.
| Employer Class | # Employees | % Employees |
| Private Company Employees | 188 | 57.5% |
| Self-Employed (Incorporated) | 26 | 8.0% |
| Self-Employed (Not Incorporated) | 47 | 14.4% |
| Not-for-profit Organizations | 12 | 3.7% |
| Local Government Employees | 25 | 7.6% |
| State Government Employees | 23 | 7.0% |
| Federal Government Employees | 2 | 0.6% |
| Unpaid Family Workers | 4 | 1.2% |
| Total | 327 | 100.0% |
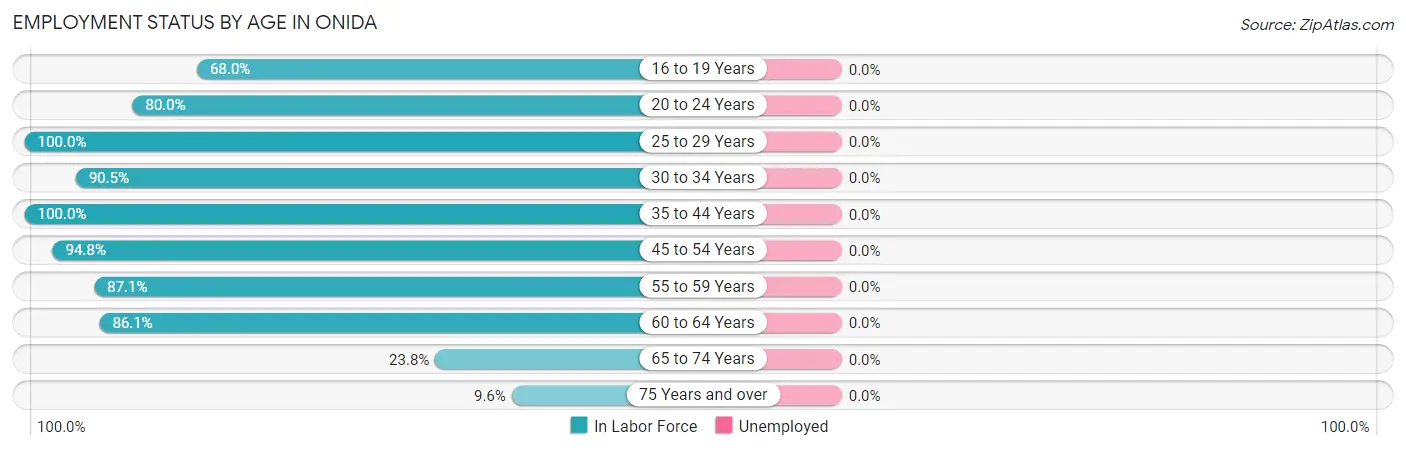
Employment Status by Age in Onida
| Age Bracket | In Labor Force | Unemployed |
| 16 to 19 Years | 17 (68.0%) | 0 (0.0%) |
| 20 to 24 Years | 16 (80.0%) | 0 (0.0%) |
| 25 to 29 Years | 14 (100.0%) | 0 (0.0%) |
| 30 to 34 Years | 38 (90.5%) | 0 (0.0%) |
| 35 to 44 Years | 48 (100.0%) | 0 (0.0%) |
| 45 to 54 Years | 55 (94.8%) | 0 (0.0%) |
| 55 to 59 Years | 54 (87.1%) | 0 (0.0%) |
| 60 to 64 Years | 68 (86.1%) | 0 (0.0%) |
| 65 to 74 Years | 10 (23.8%) | 0 (0.0%) |
| 75 Years and over | 7 (9.6%) | 0 (0.0%) |
| Total | 327 (70.6%) | 0 (0.0%) |
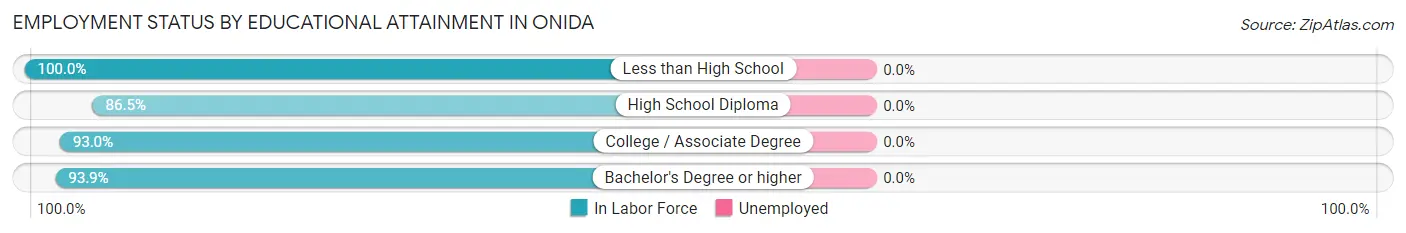
Employment Status by Educational Attainment in Onida
| Educational Attainment | In Labor Force | Unemployed |
| Less than High School | 6 (100.0%) | 0 (0.0%) |
| High School Diploma | 77 (86.5%) | 0 (0.0%) |
| College / Associate Degree | 132 (93.0%) | 0 (0.0%) |
| Bachelor's Degree or higher | 62 (93.9%) | 0 (0.0%) |
| Total | 277 (91.4%) | 0 (0.0%) |
Employment Occupations by Sex in Onida
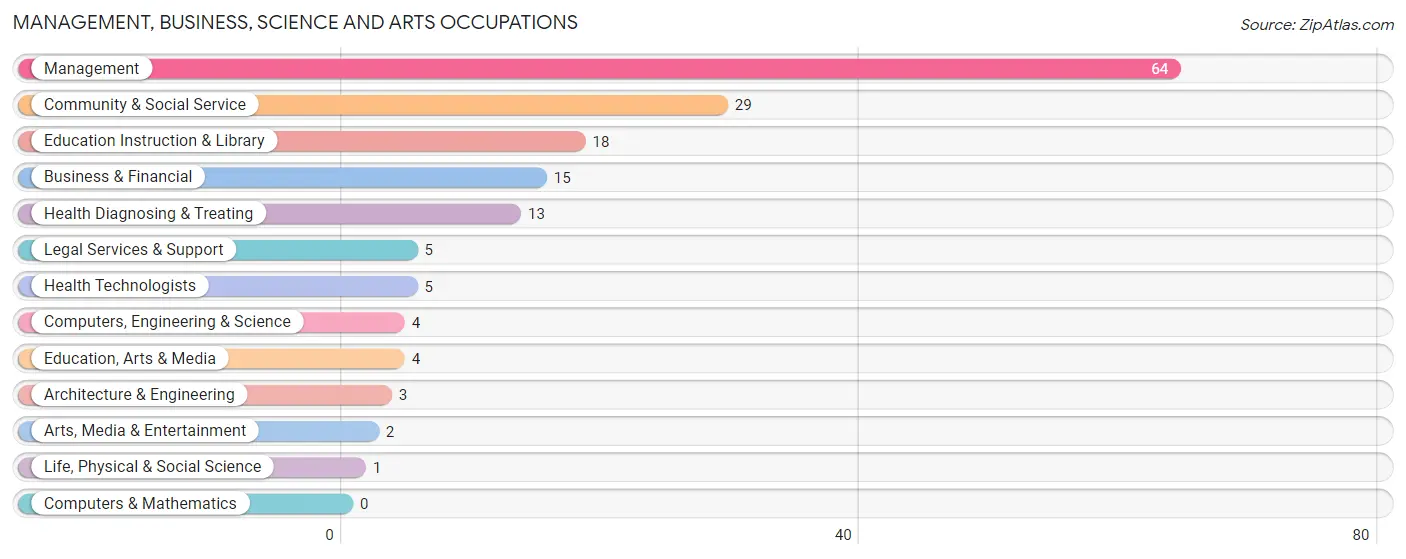
Management, Business, Science and Arts Occupations
The most common Management, Business, Science and Arts occupations in Onida are Management (64 | 19.6%), Community & Social Service (29 | 8.9%), Education Instruction & Library (18 | 5.5%), Business & Financial (15 | 4.6%), and Health Diagnosing & Treating (13 | 4.0%).
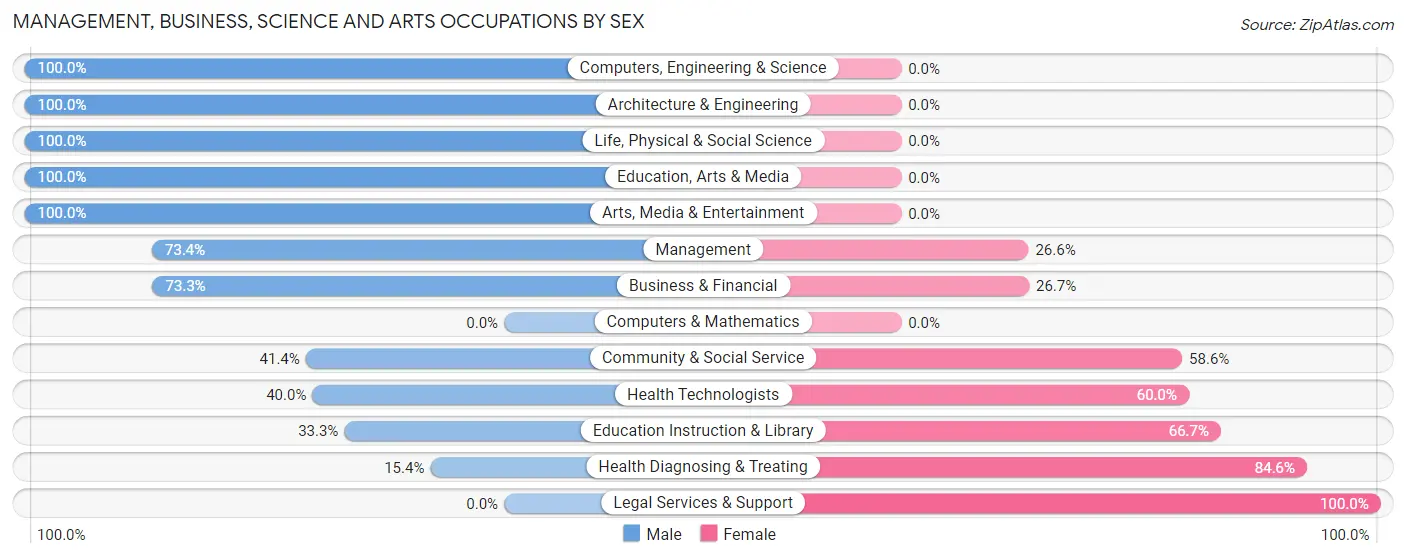
Management, Business, Science and Arts Occupations by Sex
Within the Management, Business, Science and Arts occupations in Onida, the most male-oriented occupations are Computers, Engineering & Science (100.0%), Architecture & Engineering (100.0%), and Life, Physical & Social Science (100.0%), while the most female-oriented occupations are Legal Services & Support (100.0%), Health Diagnosing & Treating (84.6%), and Education Instruction & Library (66.7%).
| Occupation | Male | Female |
| Management | 47 (73.4%) | 17 (26.6%) |
| Business & Financial | 11 (73.3%) | 4 (26.7%) |
| Computers, Engineering & Science | 4 (100.0%) | 0 (0.0%) |
| Computers & Mathematics | 0 (0.0%) | 0 (0.0%) |
| Architecture & Engineering | 3 (100.0%) | 0 (0.0%) |
| Life, Physical & Social Science | 1 (100.0%) | 0 (0.0%) |
| Community & Social Service | 12 (41.4%) | 17 (58.6%) |
| Education, Arts & Media | 4 (100.0%) | 0 (0.0%) |
| Legal Services & Support | 0 (0.0%) | 5 (100.0%) |
| Education Instruction & Library | 6 (33.3%) | 12 (66.7%) |
| Arts, Media & Entertainment | 2 (100.0%) | 0 (0.0%) |
| Health Diagnosing & Treating | 2 (15.4%) | 11 (84.6%) |
| Health Technologists | 2 (40.0%) | 3 (60.0%) |
| Total (Category) | 76 (60.8%) | 49 (39.2%) |
| Total (Overall) | 193 (59.0%) | 134 (41.0%) |
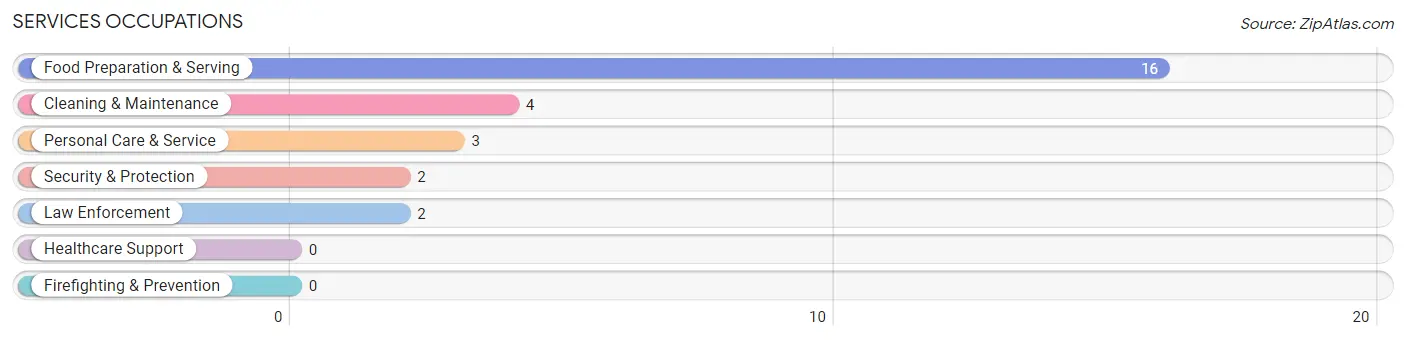
Services Occupations
The most common Services occupations in Onida are Food Preparation & Serving (16 | 4.9%), Cleaning & Maintenance (4 | 1.2%), Personal Care & Service (3 | 0.9%), Security & Protection (2 | 0.6%), and Law Enforcement (2 | 0.6%).
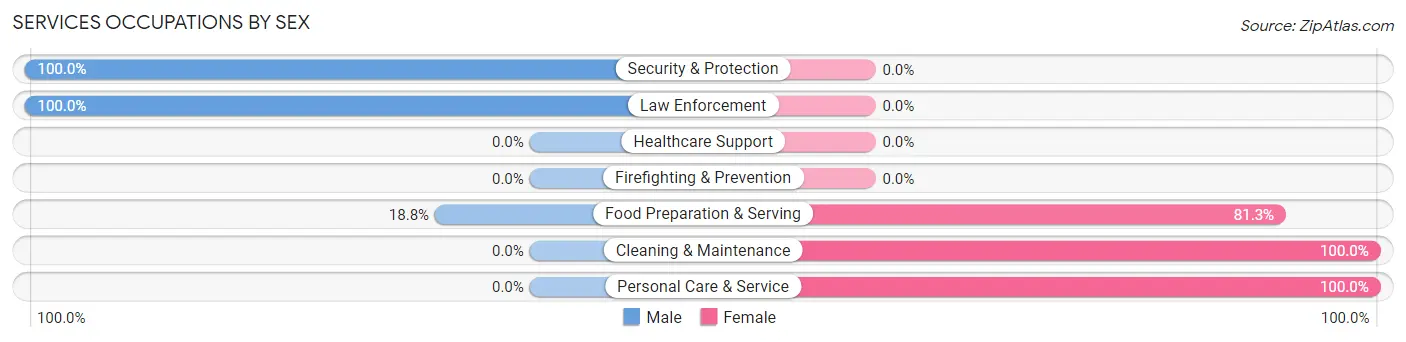
Services Occupations by Sex
Within the Services occupations in Onida, the most male-oriented occupations are Security & Protection (100.0%), Law Enforcement (100.0%), and Food Preparation & Serving (18.8%), while the most female-oriented occupations are Cleaning & Maintenance (100.0%), Personal Care & Service (100.0%), and Food Preparation & Serving (81.2%).
| Occupation | Male | Female |
| Healthcare Support | 0 (0.0%) | 0 (0.0%) |
| Security & Protection | 2 (100.0%) | 0 (0.0%) |
| Firefighting & Prevention | 0 (0.0%) | 0 (0.0%) |
| Law Enforcement | 2 (100.0%) | 0 (0.0%) |
| Food Preparation & Serving | 3 (18.8%) | 13 (81.2%) |
| Cleaning & Maintenance | 0 (0.0%) | 4 (100.0%) |
| Personal Care & Service | 0 (0.0%) | 3 (100.0%) |
| Total (Category) | 5 (20.0%) | 20 (80.0%) |
| Total (Overall) | 193 (59.0%) | 134 (41.0%) |
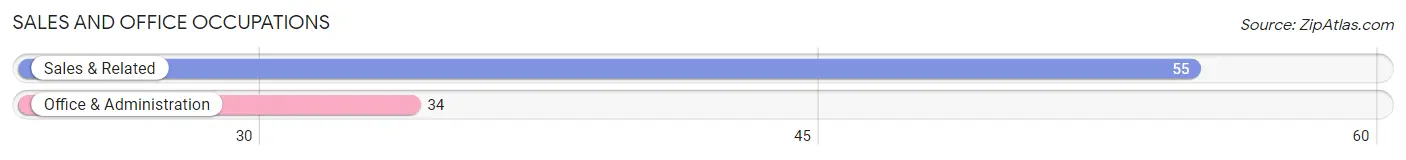
Sales and Office Occupations
The most common Sales and Office occupations in Onida are Sales & Related (55 | 16.8%), and Office & Administration (34 | 10.4%).
Sales and Office Occupations by Sex
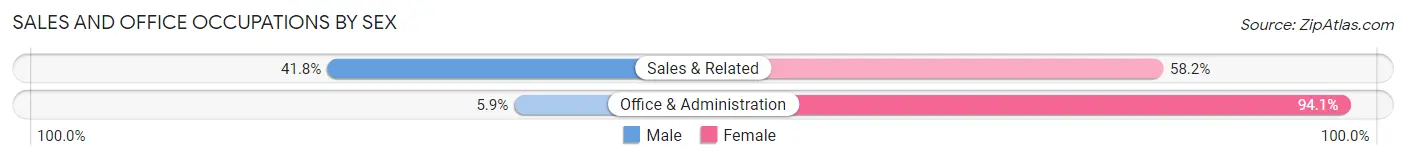
| Occupation | Male | Female |
| Sales & Related | 23 (41.8%) | 32 (58.2%) |
| Office & Administration | 2 (5.9%) | 32 (94.1%) |
| Total (Category) | 25 (28.1%) | 64 (71.9%) |
| Total (Overall) | 193 (59.0%) | 134 (41.0%) |
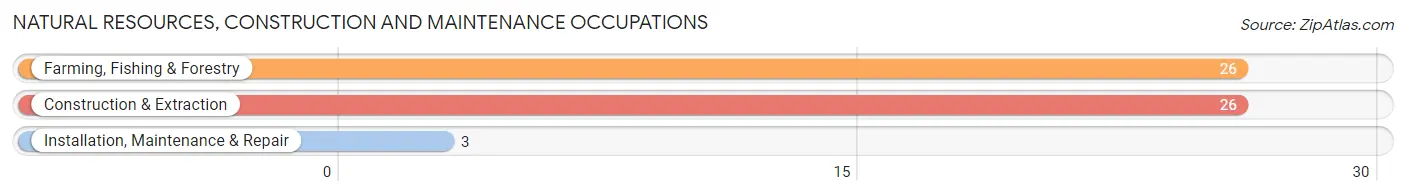
Natural Resources, Construction and Maintenance Occupations
The most common Natural Resources, Construction and Maintenance occupations in Onida are Farming, Fishing & Forestry (26 | 8.0%), Construction & Extraction (26 | 8.0%), and Installation, Maintenance & Repair (3 | 0.9%).
Natural Resources, Construction and Maintenance Occupations by Sex
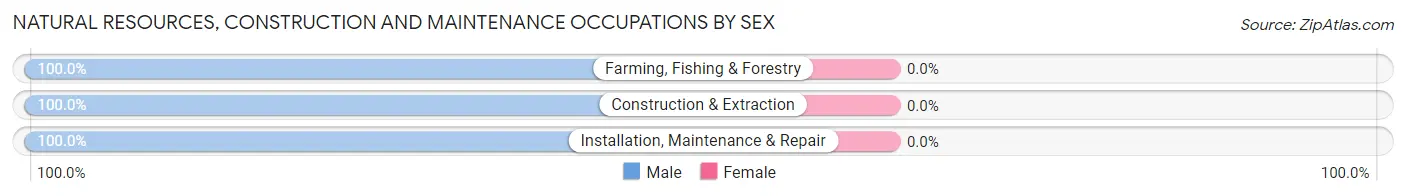
| Occupation | Male | Female |
| Farming, Fishing & Forestry | 26 (100.0%) | 0 (0.0%) |
| Construction & Extraction | 26 (100.0%) | 0 (0.0%) |
| Installation, Maintenance & Repair | 3 (100.0%) | 0 (0.0%) |
| Total (Category) | 55 (100.0%) | 0 (0.0%) |
| Total (Overall) | 193 (59.0%) | 134 (41.0%) |
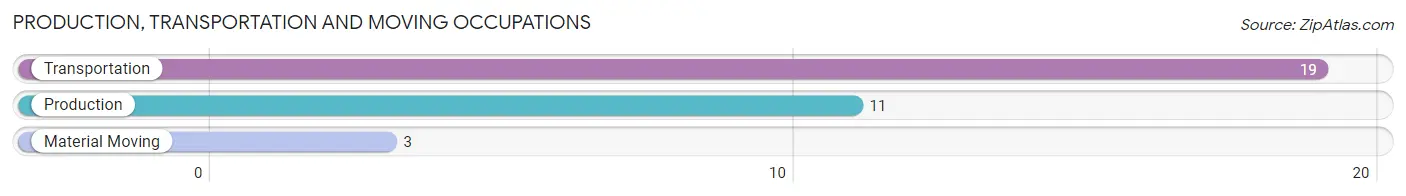
Production, Transportation and Moving Occupations
The most common Production, Transportation and Moving occupations in Onida are Transportation (19 | 5.8%), Production (11 | 3.4%), and Material Moving (3 | 0.9%).
Production, Transportation and Moving Occupations by Sex
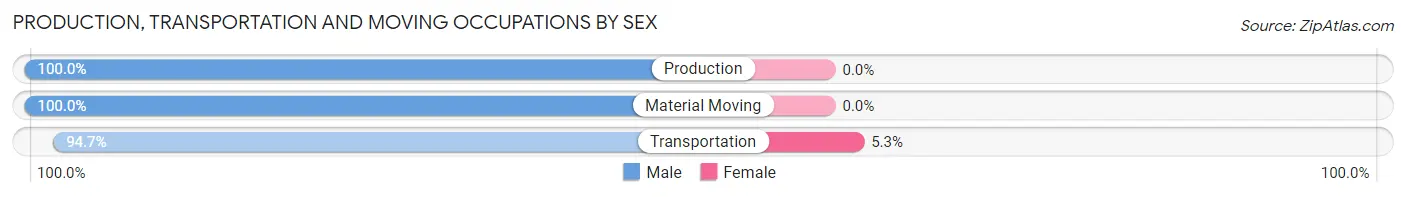
| Occupation | Male | Female |
| Production | 11 (100.0%) | 0 (0.0%) |
| Transportation | 18 (94.7%) | 1 (5.3%) |
| Material Moving | 3 (100.0%) | 0 (0.0%) |
| Total (Category) | 32 (97.0%) | 1 (3.0%) |
| Total (Overall) | 193 (59.0%) | 134 (41.0%) |
Employment Industries by Sex in Onida
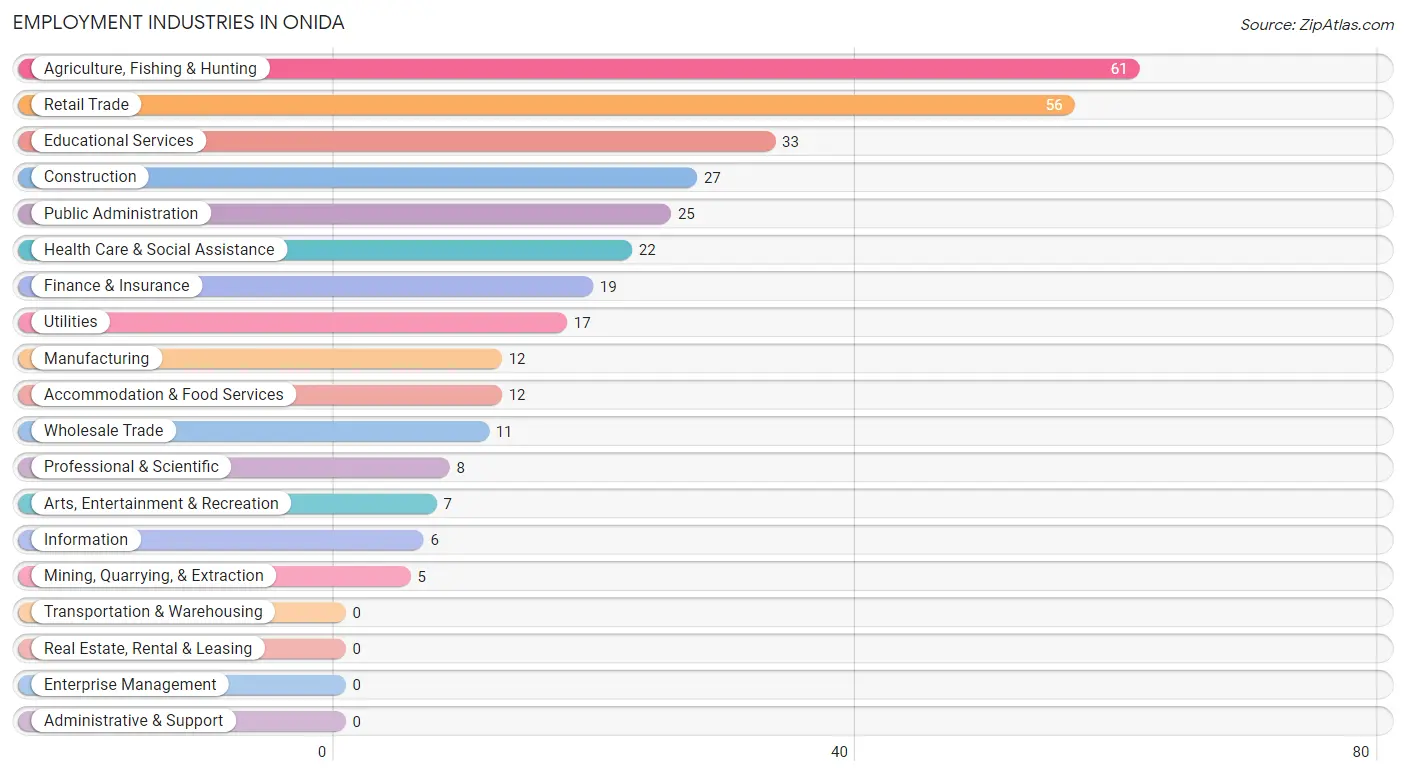
Employment Industries in Onida
The major employment industries in Onida include Agriculture, Fishing & Hunting (61 | 18.6%), Retail Trade (56 | 17.1%), Educational Services (33 | 10.1%), Construction (27 | 8.3%), and Public Administration (25 | 7.6%).
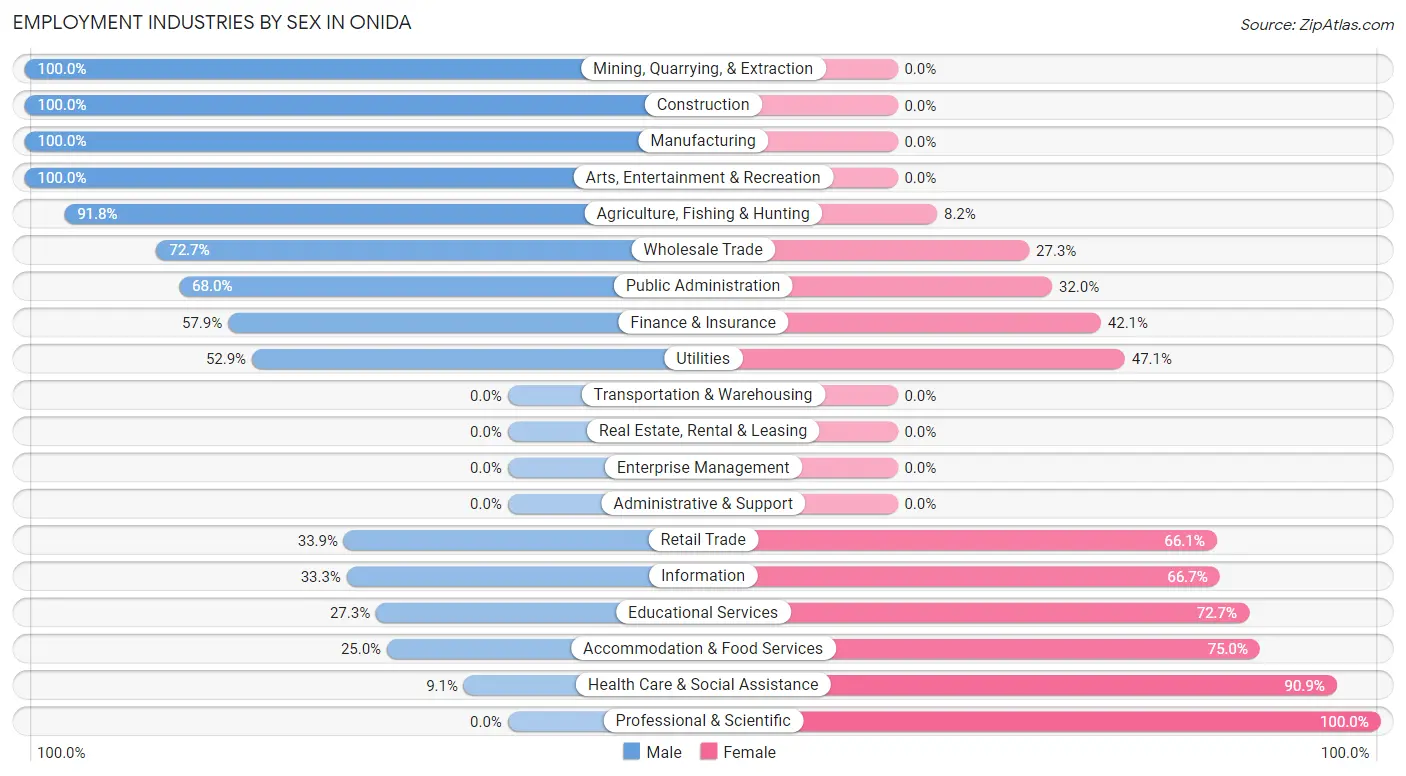
Employment Industries by Sex in Onida
The Onida industries that see more men than women are Mining, Quarrying, & Extraction (100.0%), Construction (100.0%), and Manufacturing (100.0%), whereas the industries that tend to have a higher number of women are Professional & Scientific (100.0%), Health Care & Social Assistance (90.9%), and Accommodation & Food Services (75.0%).
| Industry | Male | Female |
| Agriculture, Fishing & Hunting | 56 (91.8%) | 5 (8.2%) |
| Mining, Quarrying, & Extraction | 5 (100.0%) | 0 (0.0%) |
| Construction | 27 (100.0%) | 0 (0.0%) |
| Manufacturing | 12 (100.0%) | 0 (0.0%) |
| Wholesale Trade | 8 (72.7%) | 3 (27.3%) |
| Retail Trade | 19 (33.9%) | 37 (66.1%) |
| Transportation & Warehousing | 0 (0.0%) | 0 (0.0%) |
| Utilities | 9 (52.9%) | 8 (47.1%) |
| Information | 2 (33.3%) | 4 (66.7%) |
| Finance & Insurance | 11 (57.9%) | 8 (42.1%) |
| Real Estate, Rental & Leasing | 0 (0.0%) | 0 (0.0%) |
| Professional & Scientific | 0 (0.0%) | 8 (100.0%) |
| Enterprise Management | 0 (0.0%) | 0 (0.0%) |
| Administrative & Support | 0 (0.0%) | 0 (0.0%) |
| Educational Services | 9 (27.3%) | 24 (72.7%) |
| Health Care & Social Assistance | 2 (9.1%) | 20 (90.9%) |
| Arts, Entertainment & Recreation | 7 (100.0%) | 0 (0.0%) |
| Accommodation & Food Services | 3 (25.0%) | 9 (75.0%) |
| Public Administration | 17 (68.0%) | 8 (32.0%) |
| Total | 193 (59.0%) | 134 (41.0%) |
Education in Onida
School Enrollment in Onida
The most common levels of schooling among the 110 students in Onida are nursery / preschool (29 | 26.4%), high school (29 | 26.4%), and middle school (23 | 20.9%).
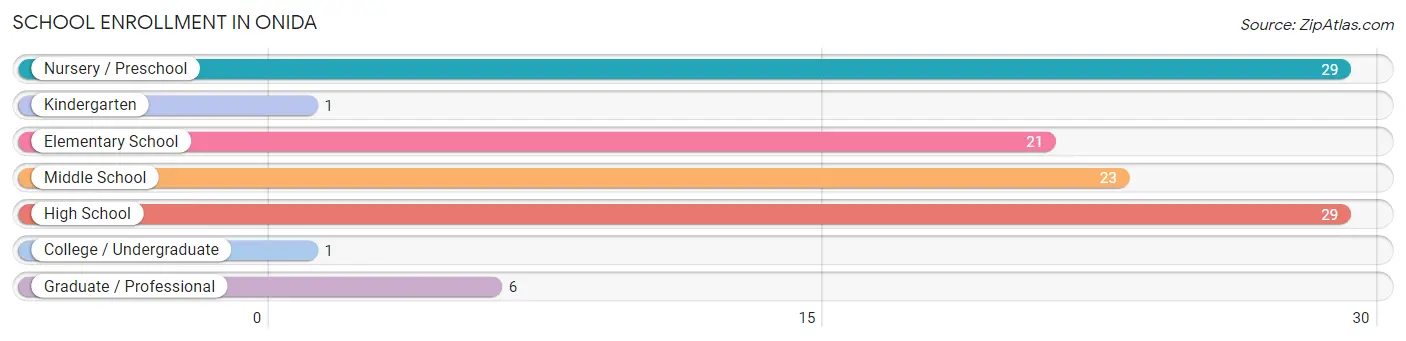
| School Level | # Students | % Students |
| Nursery / Preschool | 29 | 26.4% |
| Kindergarten | 1 | 0.9% |
| Elementary School | 21 | 19.1% |
| Middle School | 23 | 20.9% |
| High School | 29 | 26.4% |
| College / Undergraduate | 1 | 0.9% |
| Graduate / Professional | 6 | 5.4% |
| Total | 110 | 100.0% |
School Enrollment by Age by Funding Source in Onida
Out of a total of 110 students who are enrolled in schools in Onida, 3 (2.7%) attend a private institution, while the remaining 107 (97.3%) are enrolled in public schools. The age group of 5 to 9 year old has the highest likelihood of being enrolled in private schools, with 3 (8.1% in the age bracket) enrolled. Conversely, the age group of 3 to 4 year olds has the lowest likelihood of being enrolled in a private school, with 11 (100.0% in the age bracket) attending a public institution.
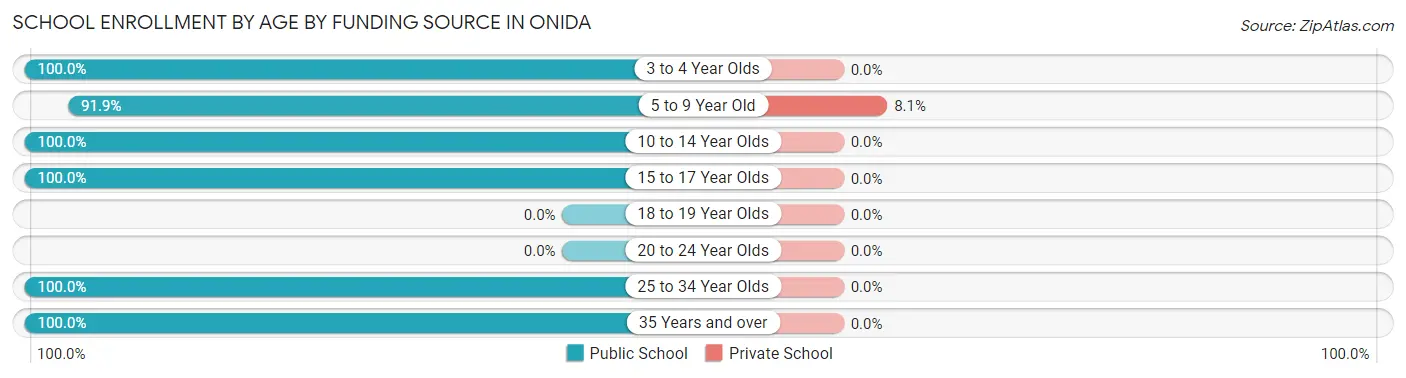
| Age Bracket | Public School | Private School |
| 3 to 4 Year Olds | 11 (100.0%) | 0 (0.0%) |
| 5 to 9 Year Old | 34 (91.9%) | 3 (8.1%) |
| 10 to 14 Year Olds | 26 (100.0%) | 0 (0.0%) |
| 15 to 17 Year Olds | 29 (100.0%) | 0 (0.0%) |
| 18 to 19 Year Olds | 0 (0.0%) | 0 (0.0%) |
| 20 to 24 Year Olds | 0 (0.0%) | 0 (0.0%) |
| 25 to 34 Year Olds | 1 (100.0%) | 0 (0.0%) |
| 35 Years and over | 6 (100.0%) | 0 (0.0%) |
| Total | 107 (97.3%) | 3 (2.7%) |
Educational Attainment by Field of Study in Onida
Education (60 | 57.1%), business (20 | 19.1%), bio, nature & agricultural (9 | 8.6%), arts & humanities (9 | 8.6%), and social sciences (5 | 4.8%) are the most common fields of study among 105 individuals in Onida who have obtained a bachelor's degree or higher.
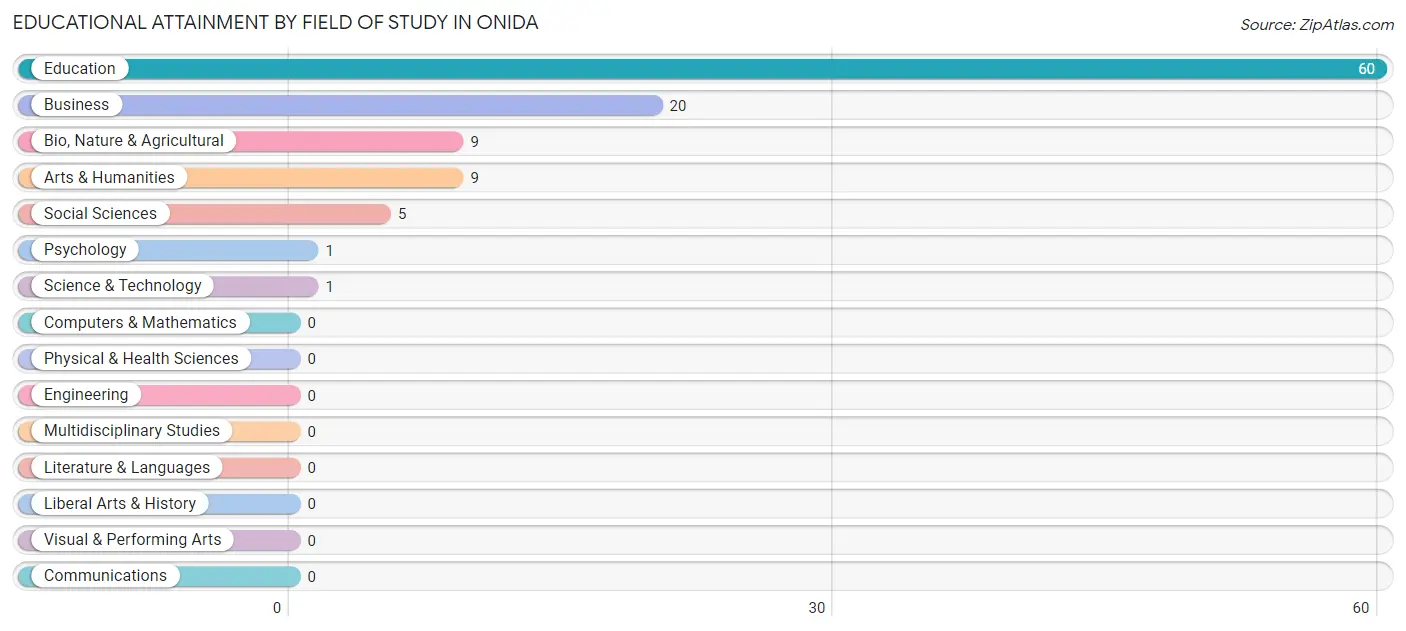
| Field of Study | # Graduates | % Graduates |
| Computers & Mathematics | 0 | 0.0% |
| Bio, Nature & Agricultural | 9 | 8.6% |
| Physical & Health Sciences | 0 | 0.0% |
| Psychology | 1 | 0.9% |
| Social Sciences | 5 | 4.8% |
| Engineering | 0 | 0.0% |
| Multidisciplinary Studies | 0 | 0.0% |
| Science & Technology | 1 | 0.9% |
| Business | 20 | 19.1% |
| Education | 60 | 57.1% |
| Literature & Languages | 0 | 0.0% |
| Liberal Arts & History | 0 | 0.0% |
| Visual & Performing Arts | 0 | 0.0% |
| Communications | 0 | 0.0% |
| Arts & Humanities | 9 | 8.6% |
| Total | 105 | 100.0% |
Transportation & Commute in Onida
Vehicle Availability by Sex in Onida
The most prevalent vehicle ownership categories in Onida are males with 2 vehicles (82, accounting for 42.5%) and females with 2 vehicles (35, making up 61.2%).
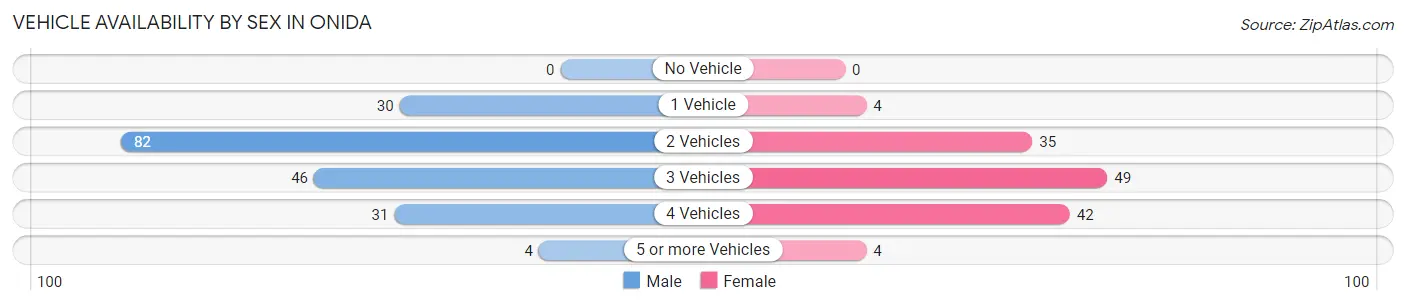
| Vehicles Available | Male | Female |
| No Vehicle | 0 (0.0%) | 0 (0.0%) |
| 1 Vehicle | 30 (15.5%) | 4 (3.0%) |
| 2 Vehicles | 82 (42.5%) | 35 (26.1%) |
| 3 Vehicles | 46 (23.8%) | 49 (36.6%) |
| 4 Vehicles | 31 (16.1%) | 42 (31.3%) |
| 5 or more Vehicles | 4 (2.1%) | 4 (3.0%) |
| Total | 193 (100.0%) | 134 (100.0%) |
Commute Time in Onida
The most frequently occuring commute durations in Onida are less than 5 minutes (102 commuters, 35.2%), 5 to 9 minutes (83 commuters, 28.6%), and 15 to 19 minutes (29 commuters, 10.0%).
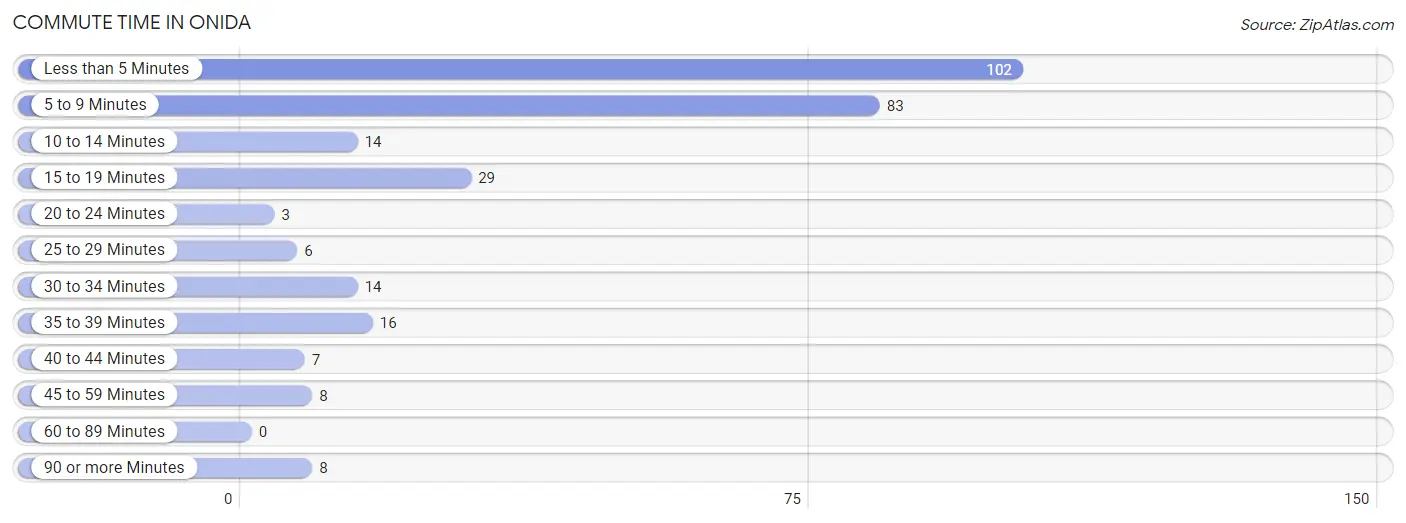
| Commute Time | # Commuters | % Commuters |
| Less than 5 Minutes | 102 | 35.2% |
| 5 to 9 Minutes | 83 | 28.6% |
| 10 to 14 Minutes | 14 | 4.8% |
| 15 to 19 Minutes | 29 | 10.0% |
| 20 to 24 Minutes | 3 | 1.0% |
| 25 to 29 Minutes | 6 | 2.1% |
| 30 to 34 Minutes | 14 | 4.8% |
| 35 to 39 Minutes | 16 | 5.5% |
| 40 to 44 Minutes | 7 | 2.4% |
| 45 to 59 Minutes | 8 | 2.8% |
| 60 to 89 Minutes | 0 | 0.0% |
| 90 or more Minutes | 8 | 2.8% |
Commute Time by Sex in Onida
The most common commute times in Onida are 5 to 9 minutes (69 commuters, 39.2%) for males and less than 5 minutes (50 commuters, 43.9%) for females.
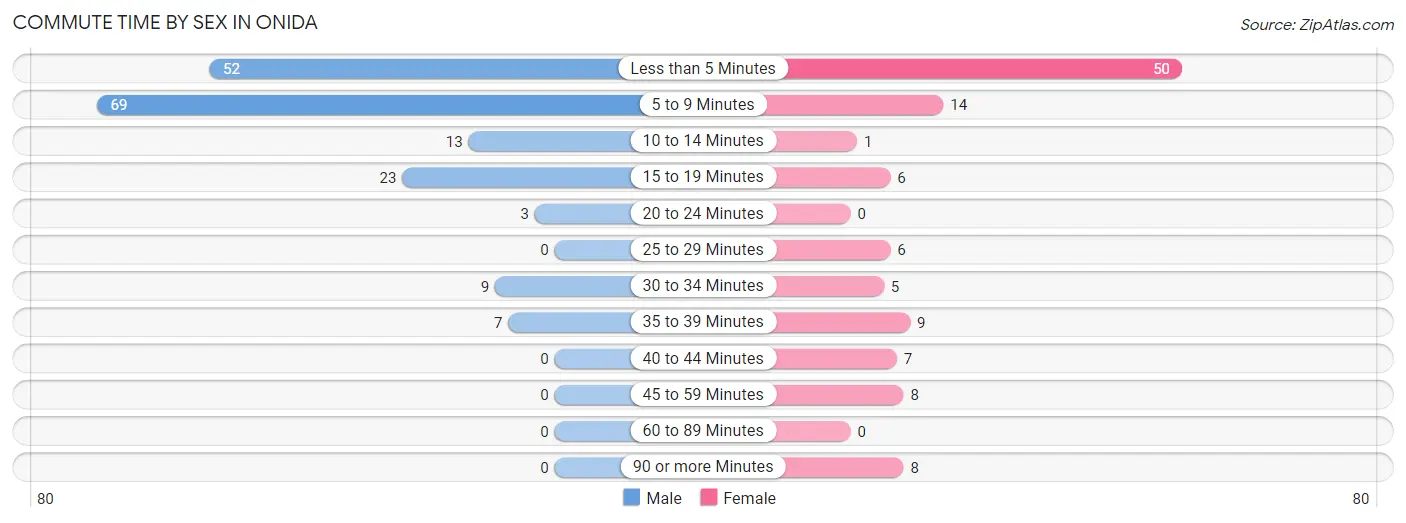
| Commute Time | Male | Female |
| Less than 5 Minutes | 52 (29.5%) | 50 (43.9%) |
| 5 to 9 Minutes | 69 (39.2%) | 14 (12.3%) |
| 10 to 14 Minutes | 13 (7.4%) | 1 (0.9%) |
| 15 to 19 Minutes | 23 (13.1%) | 6 (5.3%) |
| 20 to 24 Minutes | 3 (1.7%) | 0 (0.0%) |
| 25 to 29 Minutes | 0 (0.0%) | 6 (5.3%) |
| 30 to 34 Minutes | 9 (5.1%) | 5 (4.4%) |
| 35 to 39 Minutes | 7 (4.0%) | 9 (7.9%) |
| 40 to 44 Minutes | 0 (0.0%) | 7 (6.1%) |
| 45 to 59 Minutes | 0 (0.0%) | 8 (7.0%) |
| 60 to 89 Minutes | 0 (0.0%) | 0 (0.0%) |
| 90 or more Minutes | 0 (0.0%) | 8 (7.0%) |
Time of Departure to Work by Sex in Onida
The most frequent times of departure to work in Onida are 7:30 AM to 7:59 AM (67, 38.1%) for males and 7:30 AM to 7:59 AM (46, 40.4%) for females.
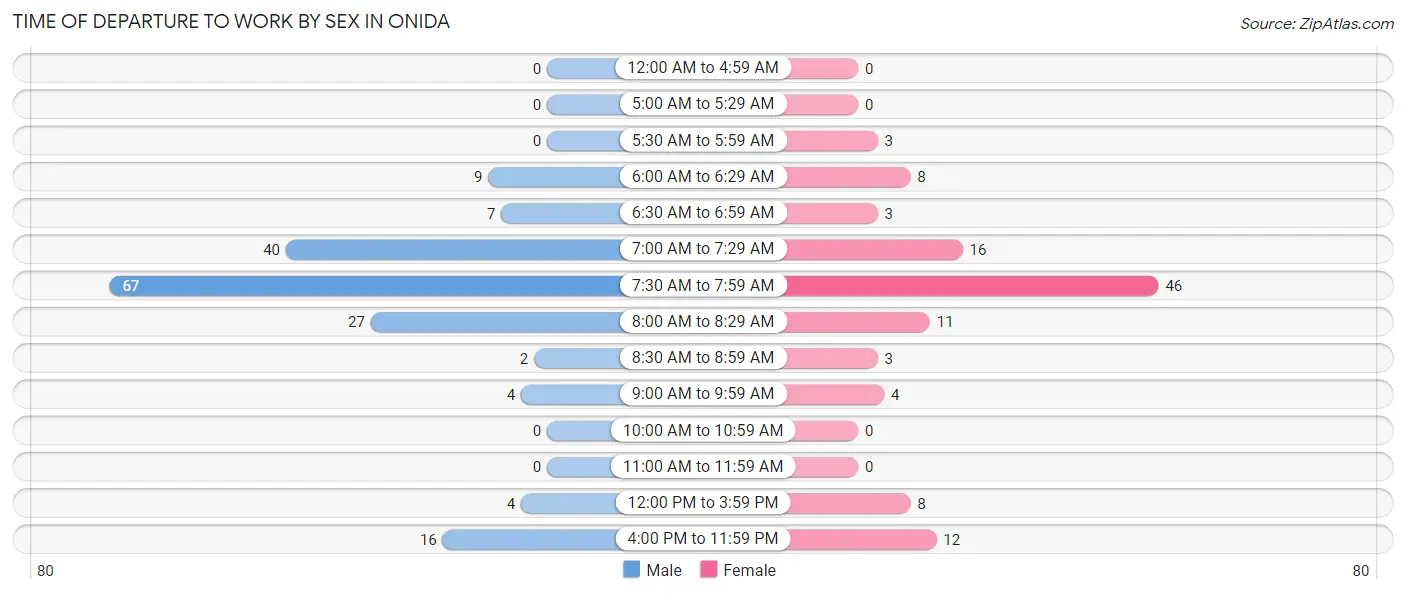
| Time of Departure | Male | Female |
| 12:00 AM to 4:59 AM | 0 (0.0%) | 0 (0.0%) |
| 5:00 AM to 5:29 AM | 0 (0.0%) | 0 (0.0%) |
| 5:30 AM to 5:59 AM | 0 (0.0%) | 3 (2.6%) |
| 6:00 AM to 6:29 AM | 9 (5.1%) | 8 (7.0%) |
| 6:30 AM to 6:59 AM | 7 (4.0%) | 3 (2.6%) |
| 7:00 AM to 7:29 AM | 40 (22.7%) | 16 (14.0%) |
| 7:30 AM to 7:59 AM | 67 (38.1%) | 46 (40.4%) |
| 8:00 AM to 8:29 AM | 27 (15.3%) | 11 (9.7%) |
| 8:30 AM to 8:59 AM | 2 (1.1%) | 3 (2.6%) |
| 9:00 AM to 9:59 AM | 4 (2.3%) | 4 (3.5%) |
| 10:00 AM to 10:59 AM | 0 (0.0%) | 0 (0.0%) |
| 11:00 AM to 11:59 AM | 0 (0.0%) | 0 (0.0%) |
| 12:00 PM to 3:59 PM | 4 (2.3%) | 8 (7.0%) |
| 4:00 PM to 11:59 PM | 16 (9.1%) | 12 (10.5%) |
| Total | 176 (100.0%) | 114 (100.0%) |
Housing Occupancy in Onida
Occupancy by Ownership in Onida
Of the total 260 dwellings in Onida, owner-occupied units account for 231 (88.8%), while renter-occupied units make up 29 (11.2%).
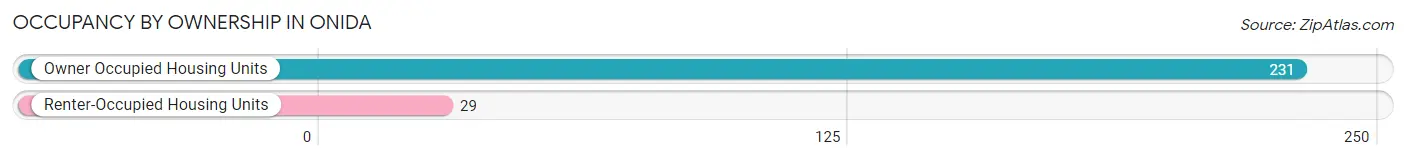
| Occupancy | # Housing Units | % Housing Units |
| Owner Occupied Housing Units | 231 | 88.8% |
| Renter-Occupied Housing Units | 29 | 11.2% |
| Total Occupied Housing Units | 260 | 100.0% |
Occupancy by Household Size in Onida
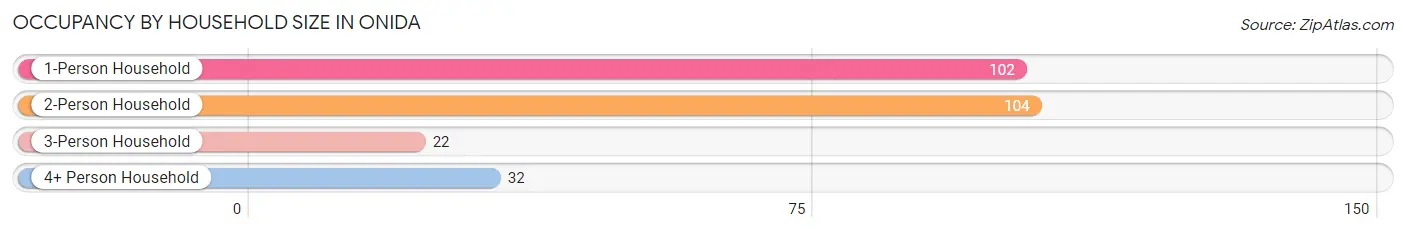
| Household Size | # Housing Units | % Housing Units |
| 1-Person Household | 102 | 39.2% |
| 2-Person Household | 104 | 40.0% |
| 3-Person Household | 22 | 8.5% |
| 4+ Person Household | 32 | 12.3% |
| Total Housing Units | 260 | 100.0% |
Occupancy by Ownership by Household Size in Onida
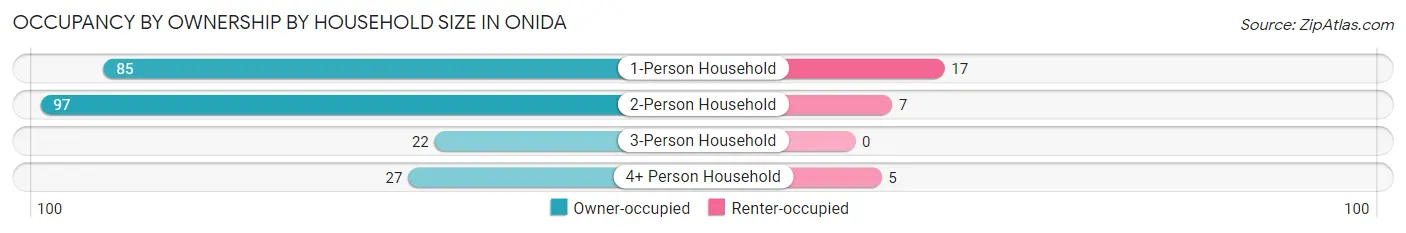
| Household Size | Owner-occupied | Renter-occupied |
| 1-Person Household | 85 (83.3%) | 17 (16.7%) |
| 2-Person Household | 97 (93.3%) | 7 (6.7%) |
| 3-Person Household | 22 (100.0%) | 0 (0.0%) |
| 4+ Person Household | 27 (84.4%) | 5 (15.6%) |
| Total Housing Units | 231 (88.8%) | 29 (11.2%) |
Occupancy by Educational Attainment in Onida
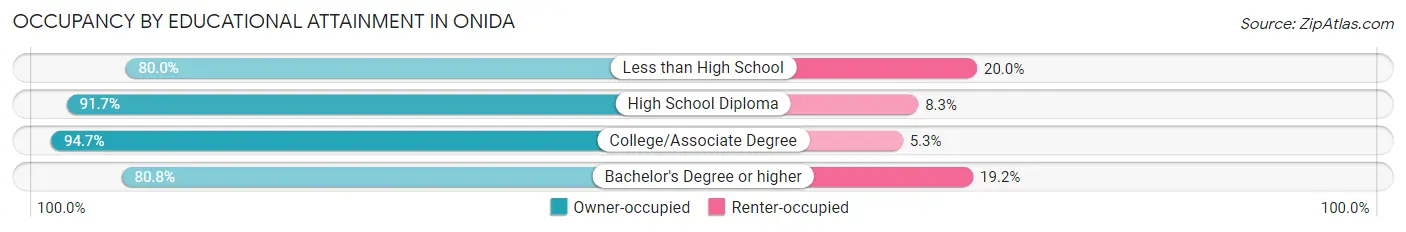
| Household Size | Owner-occupied | Renter-occupied |
| Less than High School | 12 (80.0%) | 3 (20.0%) |
| High School Diploma | 66 (91.7%) | 6 (8.3%) |
| College/Associate Degree | 90 (94.7%) | 5 (5.3%) |
| Bachelor's Degree or higher | 63 (80.8%) | 15 (19.2%) |
Occupancy by Age of Householder in Onida
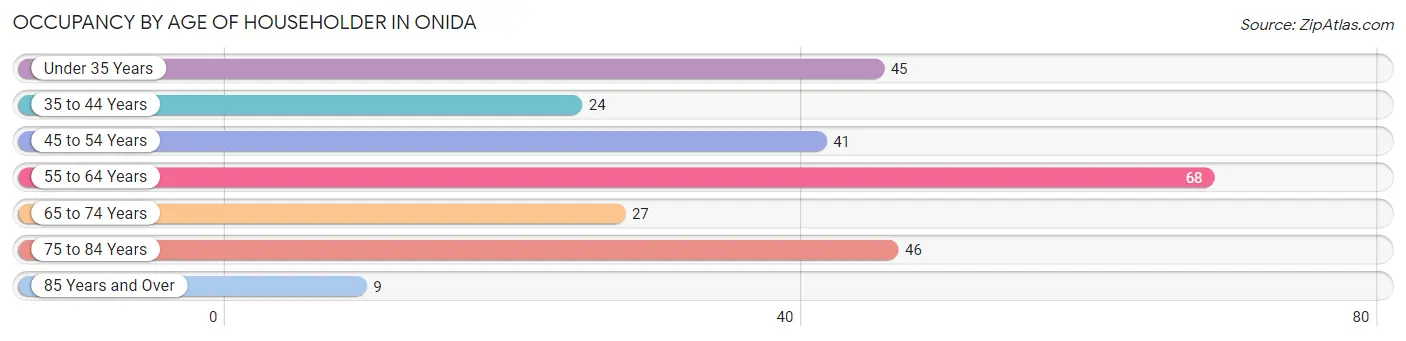
| Age Bracket | # Households | % Households |
| Under 35 Years | 45 | 17.3% |
| 35 to 44 Years | 24 | 9.2% |
| 45 to 54 Years | 41 | 15.8% |
| 55 to 64 Years | 68 | 26.2% |
| 65 to 74 Years | 27 | 10.4% |
| 75 to 84 Years | 46 | 17.7% |
| 85 Years and Over | 9 | 3.5% |
| Total | 260 | 100.0% |
Housing Finances in Onida
Median Income by Occupancy in Onida
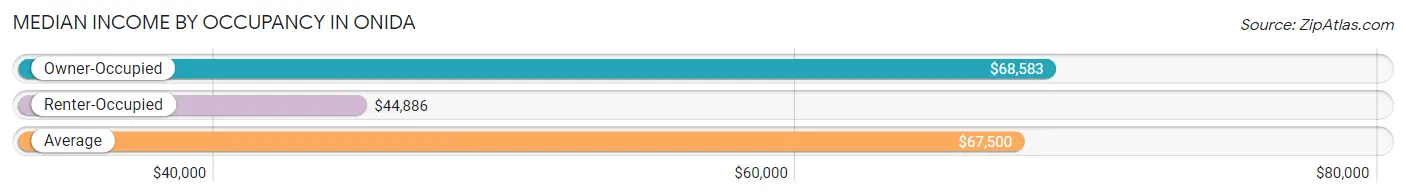
| Occupancy Type | # Households | Median Income |
| Owner-Occupied | 231 (88.8%) | $68,583 |
| Renter-Occupied | 29 (11.2%) | $44,886 |
| Average | 260 (100.0%) | $67,500 |
Occupancy by Householder Income Bracket in Onida
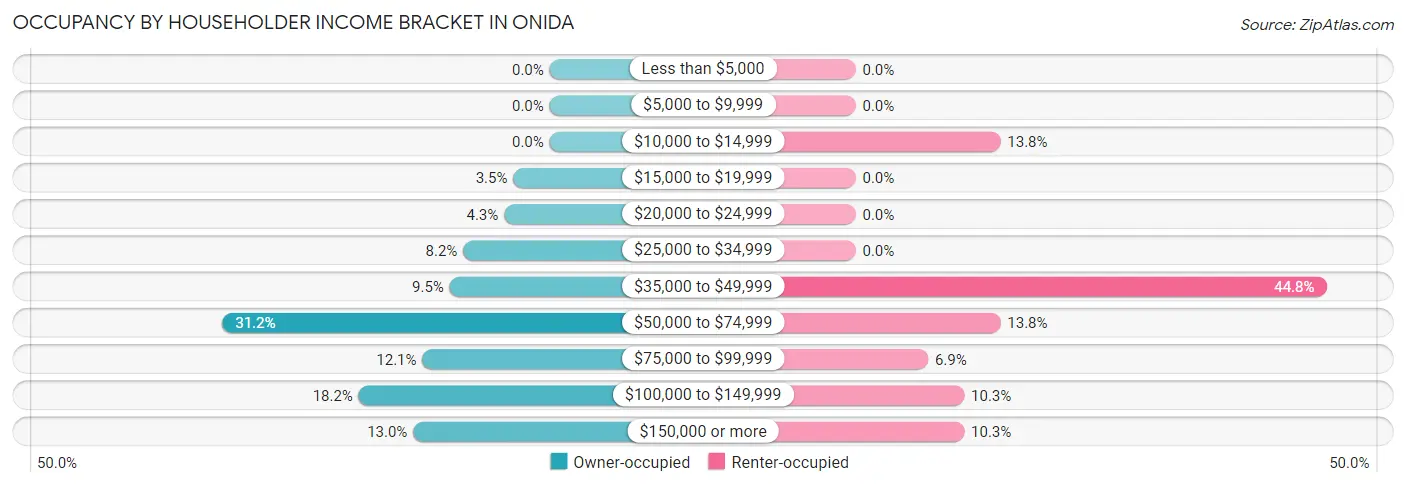
| Income Bracket | Owner-occupied | Renter-occupied |
| Less than $5,000 | 0 (0.0%) | 0 (0.0%) |
| $5,000 to $9,999 | 0 (0.0%) | 0 (0.0%) |
| $10,000 to $14,999 | 0 (0.0%) | 4 (13.8%) |
| $15,000 to $19,999 | 8 (3.5%) | 0 (0.0%) |
| $20,000 to $24,999 | 10 (4.3%) | 0 (0.0%) |
| $25,000 to $34,999 | 19 (8.2%) | 0 (0.0%) |
| $35,000 to $49,999 | 22 (9.5%) | 13 (44.8%) |
| $50,000 to $74,999 | 72 (31.2%) | 4 (13.8%) |
| $75,000 to $99,999 | 28 (12.1%) | 2 (6.9%) |
| $100,000 to $149,999 | 42 (18.2%) | 3 (10.3%) |
| $150,000 or more | 30 (13.0%) | 3 (10.3%) |
| Total | 231 (100.0%) | 29 (100.0%) |
Monthly Housing Cost Tiers in Onida
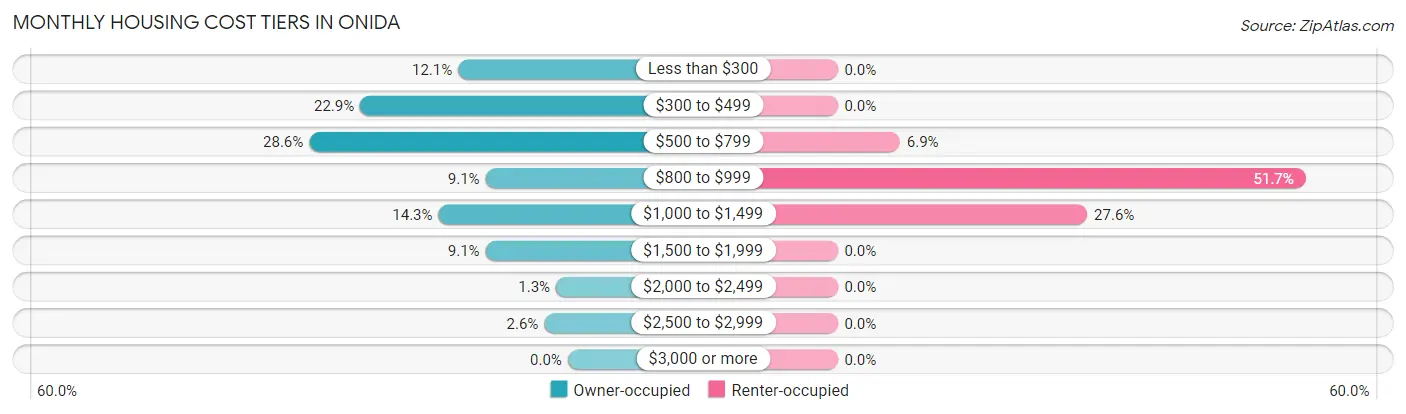
| Monthly Cost | Owner-occupied | Renter-occupied |
| Less than $300 | 28 (12.1%) | 0 (0.0%) |
| $300 to $499 | 53 (22.9%) | 0 (0.0%) |
| $500 to $799 | 66 (28.6%) | 2 (6.9%) |
| $800 to $999 | 21 (9.1%) | 15 (51.7%) |
| $1,000 to $1,499 | 33 (14.3%) | 8 (27.6%) |
| $1,500 to $1,999 | 21 (9.1%) | 0 (0.0%) |
| $2,000 to $2,499 | 3 (1.3%) | 0 (0.0%) |
| $2,500 to $2,999 | 6 (2.6%) | 0 (0.0%) |
| $3,000 or more | 0 (0.0%) | 0 (0.0%) |
| Total | 231 (100.0%) | 29 (100.0%) |
Physical Housing Characteristics in Onida
Housing Structures in Onida
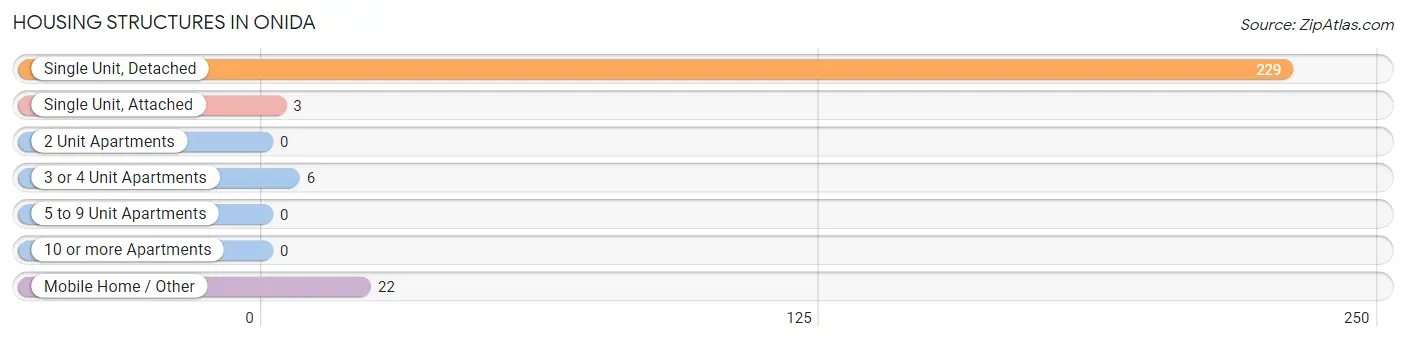
| Structure Type | # Housing Units | % Housing Units |
| Single Unit, Detached | 229 | 88.1% |
| Single Unit, Attached | 3 | 1.1% |
| 2 Unit Apartments | 0 | 0.0% |
| 3 or 4 Unit Apartments | 6 | 2.3% |
| 5 to 9 Unit Apartments | 0 | 0.0% |
| 10 or more Apartments | 0 | 0.0% |
| Mobile Home / Other | 22 | 8.5% |
| Total | 260 | 100.0% |
Housing Structures by Occupancy in Onida
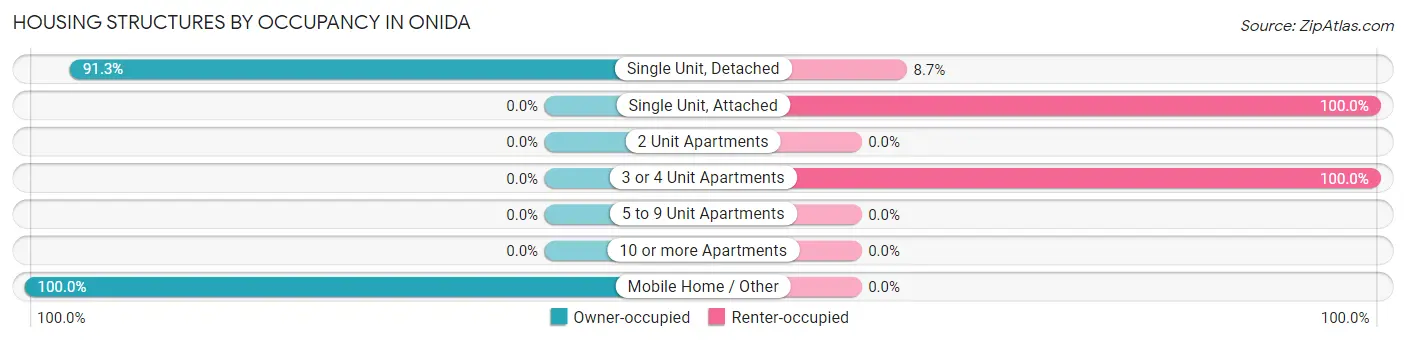
| Structure Type | Owner-occupied | Renter-occupied |
| Single Unit, Detached | 209 (91.3%) | 20 (8.7%) |
| Single Unit, Attached | 0 (0.0%) | 3 (100.0%) |
| 2 Unit Apartments | 0 (0.0%) | 0 (0.0%) |
| 3 or 4 Unit Apartments | 0 (0.0%) | 6 (100.0%) |
| 5 to 9 Unit Apartments | 0 (0.0%) | 0 (0.0%) |
| 10 or more Apartments | 0 (0.0%) | 0 (0.0%) |
| Mobile Home / Other | 22 (100.0%) | 0 (0.0%) |
| Total | 231 (88.8%) | 29 (11.2%) |
Housing Structures by Number of Rooms in Onida
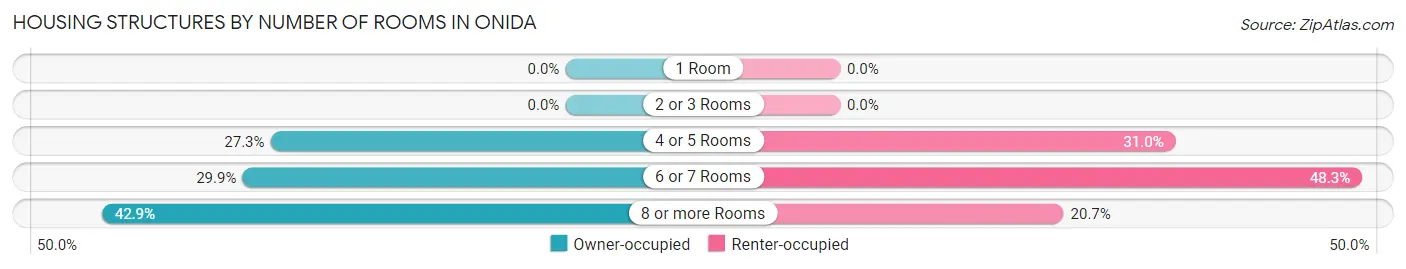
| Number of Rooms | Owner-occupied | Renter-occupied |
| 1 Room | 0 (0.0%) | 0 (0.0%) |
| 2 or 3 Rooms | 0 (0.0%) | 0 (0.0%) |
| 4 or 5 Rooms | 63 (27.3%) | 9 (31.0%) |
| 6 or 7 Rooms | 69 (29.9%) | 14 (48.3%) |
| 8 or more Rooms | 99 (42.9%) | 6 (20.7%) |
| Total | 231 (100.0%) | 29 (100.0%) |
Housing Structure by Heating Type in Onida
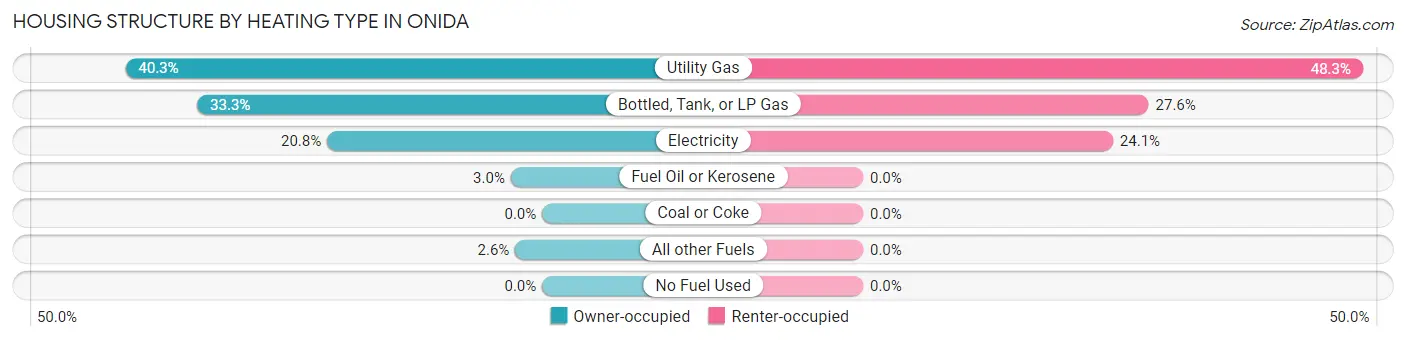
| Heating Type | Owner-occupied | Renter-occupied |
| Utility Gas | 93 (40.3%) | 14 (48.3%) |
| Bottled, Tank, or LP Gas | 77 (33.3%) | 8 (27.6%) |
| Electricity | 48 (20.8%) | 7 (24.1%) |
| Fuel Oil or Kerosene | 7 (3.0%) | 0 (0.0%) |
| Coal or Coke | 0 (0.0%) | 0 (0.0%) |
| All other Fuels | 6 (2.6%) | 0 (0.0%) |
| No Fuel Used | 0 (0.0%) | 0 (0.0%) |
| Total | 231 (100.0%) | 29 (100.0%) |
Household Vehicle Usage in Onida
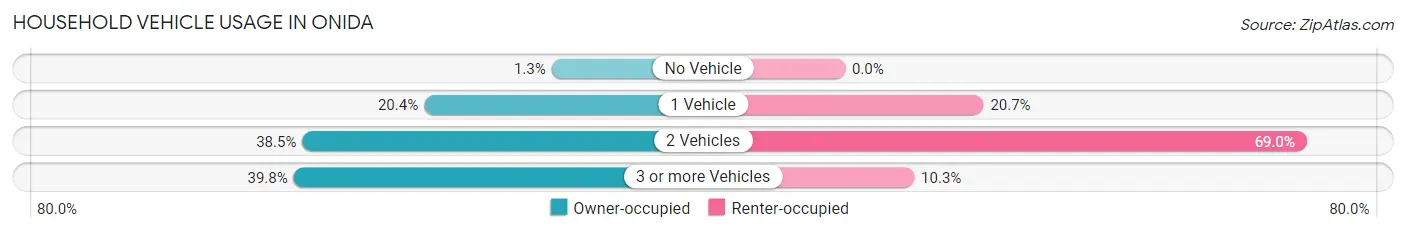
| Vehicles per Household | Owner-occupied | Renter-occupied |
| No Vehicle | 3 (1.3%) | 0 (0.0%) |
| 1 Vehicle | 47 (20.3%) | 6 (20.7%) |
| 2 Vehicles | 89 (38.5%) | 20 (69.0%) |
| 3 or more Vehicles | 92 (39.8%) | 3 (10.3%) |
| Total | 231 (100.0%) | 29 (100.0%) |
Real Estate & Mortgages in Onida
Real Estate and Mortgage Overview in Onida
| Characteristic | Without Mortgage | With Mortgage |
| Housing Units | 159 | 72 |
| Median Property Value | $154,200 | $175,000 |
| Median Household Income | $56,458 | $15 |
| Monthly Housing Costs | $494 | $0 |
| Real Estate Taxes | $1,339 | $0 |
Property Value by Mortgage Status in Onida
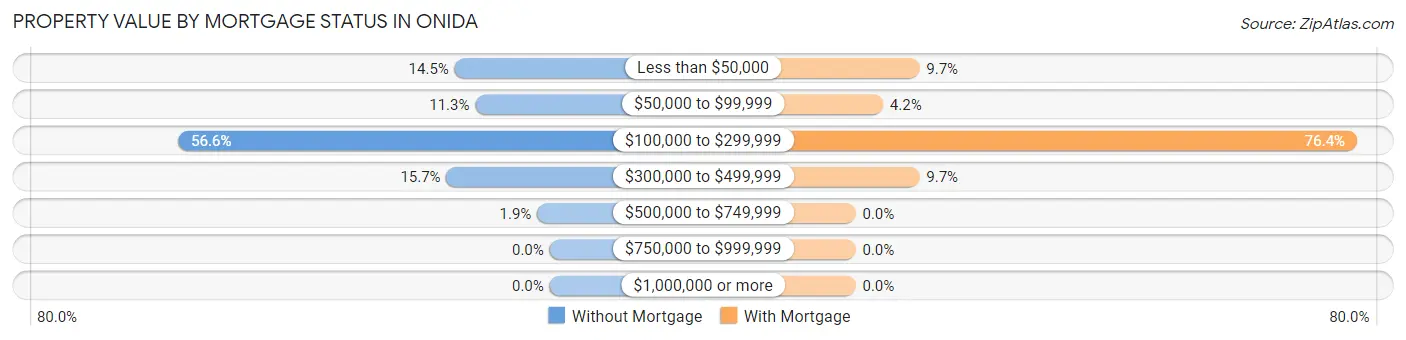
| Property Value | Without Mortgage | With Mortgage |
| Less than $50,000 | 23 (14.5%) | 7 (9.7%) |
| $50,000 to $99,999 | 18 (11.3%) | 3 (4.2%) |
| $100,000 to $299,999 | 90 (56.6%) | 55 (76.4%) |
| $300,000 to $499,999 | 25 (15.7%) | 7 (9.7%) |
| $500,000 to $749,999 | 3 (1.9%) | 0 (0.0%) |
| $750,000 to $999,999 | 0 (0.0%) | 0 (0.0%) |
| $1,000,000 or more | 0 (0.0%) | 0 (0.0%) |
| Total | 159 (100.0%) | 72 (100.0%) |
Household Income by Mortgage Status in Onida
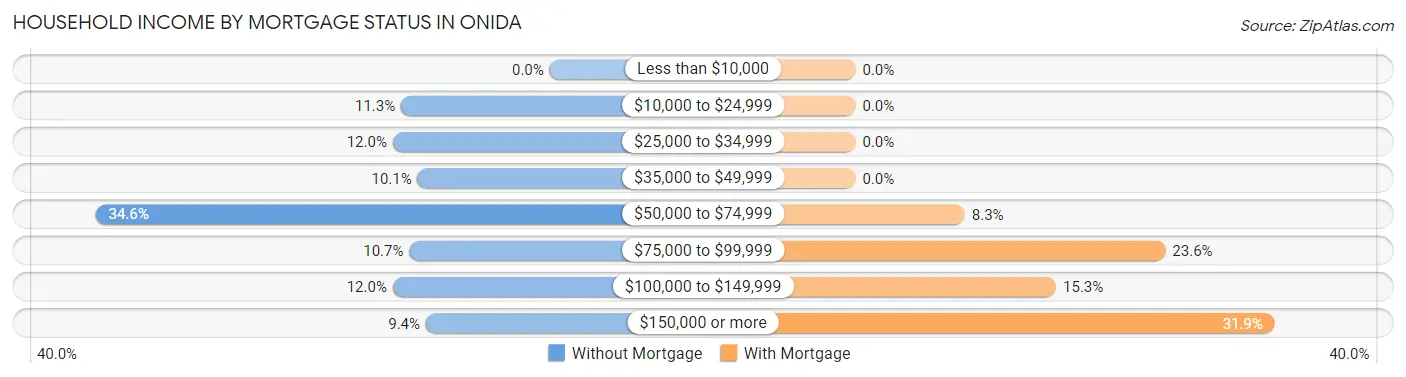
| Household Income | Without Mortgage | With Mortgage |
| Less than $10,000 | 0 (0.0%) | 0 (0.0%) |
| $10,000 to $24,999 | 18 (11.3%) | 0 (0.0%) |
| $25,000 to $34,999 | 19 (11.9%) | 0 (0.0%) |
| $35,000 to $49,999 | 16 (10.1%) | 0 (0.0%) |
| $50,000 to $74,999 | 55 (34.6%) | 6 (8.3%) |
| $75,000 to $99,999 | 17 (10.7%) | 17 (23.6%) |
| $100,000 to $149,999 | 19 (11.9%) | 11 (15.3%) |
| $150,000 or more | 15 (9.4%) | 23 (31.9%) |
| Total | 159 (100.0%) | 72 (100.0%) |
Property Value to Household Income Ratio in Onida
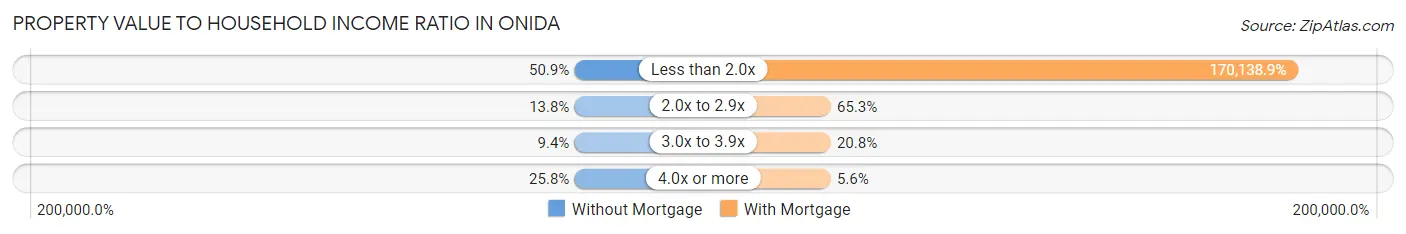
| Value-to-Income Ratio | Without Mortgage | With Mortgage |
| Less than 2.0x | 81 (50.9%) | 122,500 (170,138.9%) |
| 2.0x to 2.9x | 22 (13.8%) | 47 (65.3%) |
| 3.0x to 3.9x | 15 (9.4%) | 15 (20.8%) |
| 4.0x or more | 41 (25.8%) | 4 (5.6%) |
| Total | 159 (100.0%) | 72 (100.0%) |
Real Estate Taxes by Mortgage Status in Onida
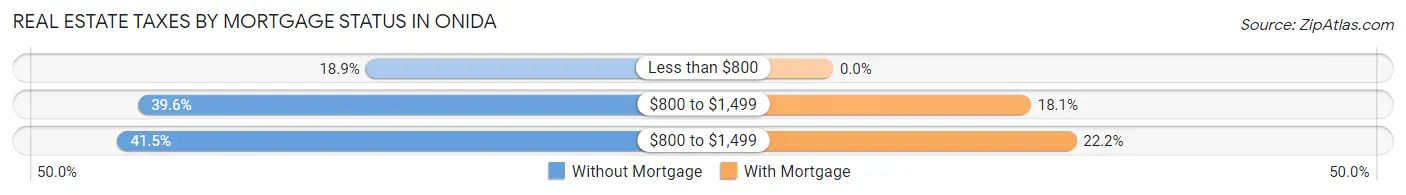
| Property Taxes | Without Mortgage | With Mortgage |
| Less than $800 | 30 (18.9%) | 0 (0.0%) |
| $800 to $1,499 | 63 (39.6%) | 13 (18.1%) |
| $800 to $1,499 | 66 (41.5%) | 16 (22.2%) |
| Total | 159 (100.0%) | 72 (100.0%) |
Health & Disability in Onida
Health Insurance Coverage by Age in Onida
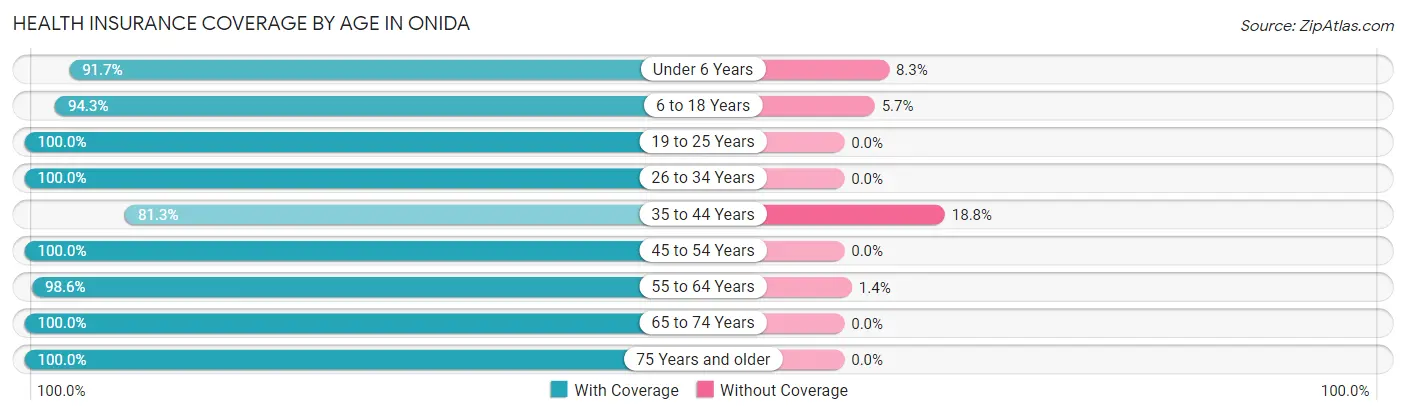
| Age Bracket | With Coverage | Without Coverage |
| Under 6 Years | 55 (91.7%) | 5 (8.3%) |
| 6 to 18 Years | 83 (94.3%) | 5 (5.7%) |
| 19 to 25 Years | 28 (100.0%) | 0 (0.0%) |
| 26 to 34 Years | 48 (100.0%) | 0 (0.0%) |
| 35 to 44 Years | 39 (81.2%) | 9 (18.8%) |
| 45 to 54 Years | 58 (100.0%) | 0 (0.0%) |
| 55 to 64 Years | 139 (98.6%) | 2 (1.4%) |
| 65 to 74 Years | 42 (100.0%) | 0 (0.0%) |
| 75 Years and older | 73 (100.0%) | 0 (0.0%) |
| Total | 565 (96.4%) | 21 (3.6%) |
Health Insurance Coverage by Citizenship Status in Onida
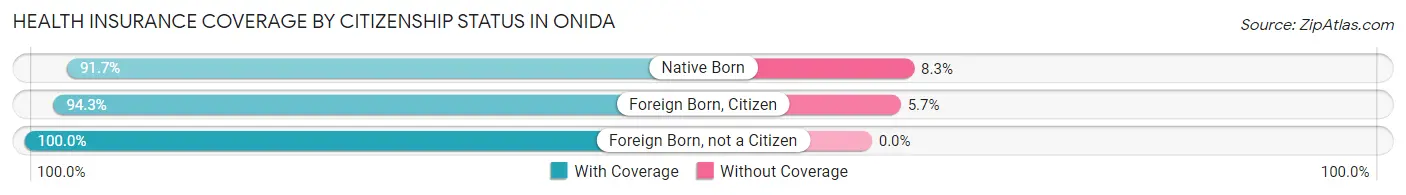
| Citizenship Status | With Coverage | Without Coverage |
| Native Born | 55 (91.7%) | 5 (8.3%) |
| Foreign Born, Citizen | 83 (94.3%) | 5 (5.7%) |
| Foreign Born, not a Citizen | 28 (100.0%) | 0 (0.0%) |
Health Insurance Coverage by Household Income in Onida
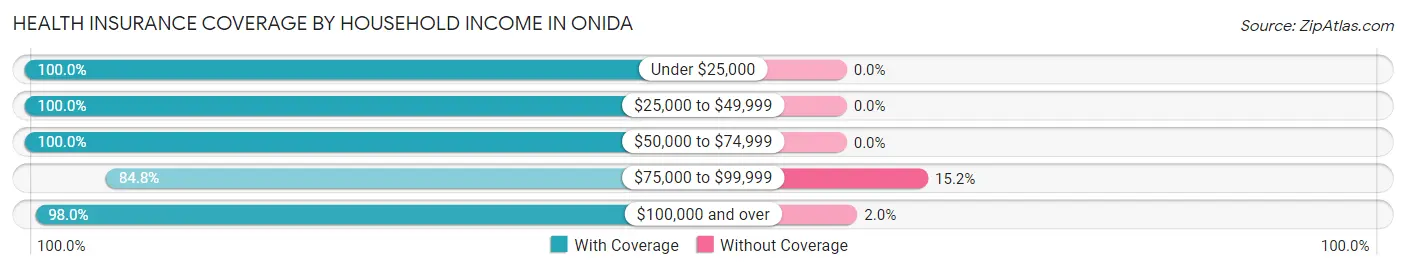
| Household Income | With Coverage | Without Coverage |
| Under $25,000 | 31 (100.0%) | 0 (0.0%) |
| $25,000 to $49,999 | 66 (100.0%) | 0 (0.0%) |
| $50,000 to $74,999 | 133 (100.0%) | 0 (0.0%) |
| $75,000 to $99,999 | 89 (84.8%) | 16 (15.2%) |
| $100,000 and over | 246 (98.0%) | 5 (2.0%) |
Public vs Private Health Insurance Coverage by Age in Onida
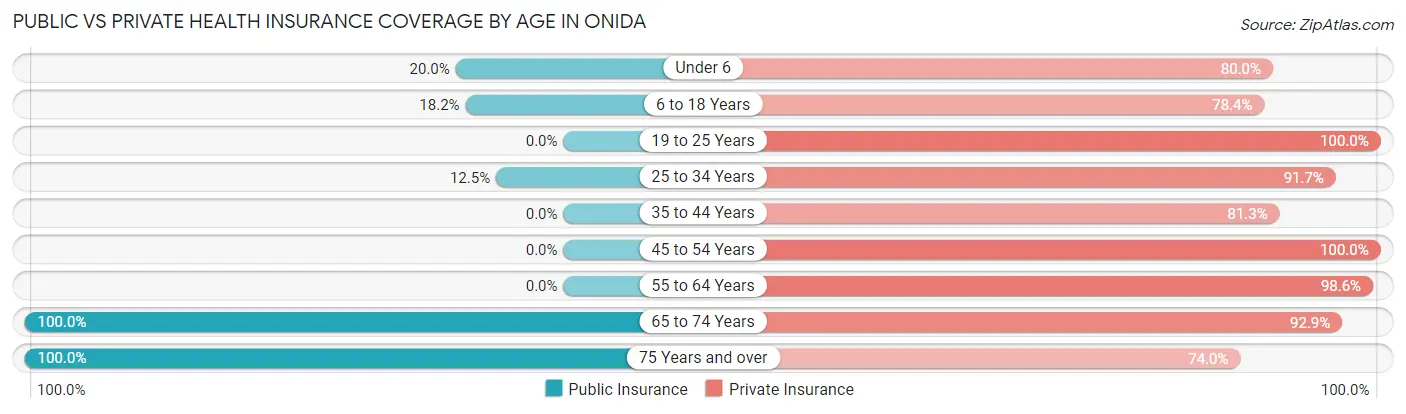
| Age Bracket | Public Insurance | Private Insurance |
| Under 6 | 12 (20.0%) | 48 (80.0%) |
| 6 to 18 Years | 16 (18.2%) | 69 (78.4%) |
| 19 to 25 Years | 0 (0.0%) | 28 (100.0%) |
| 25 to 34 Years | 6 (12.5%) | 44 (91.7%) |
| 35 to 44 Years | 0 (0.0%) | 39 (81.2%) |
| 45 to 54 Years | 0 (0.0%) | 58 (100.0%) |
| 55 to 64 Years | 0 (0.0%) | 139 (98.6%) |
| 65 to 74 Years | 42 (100.0%) | 39 (92.9%) |
| 75 Years and over | 73 (100.0%) | 54 (74.0%) |
| Total | 149 (25.4%) | 518 (88.4%) |
Disability Status by Sex by Age in Onida
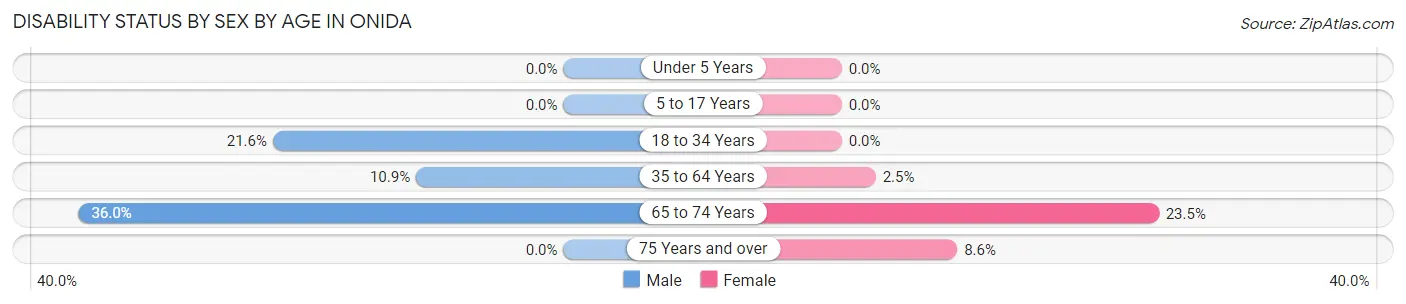
| Age Bracket | Male | Female |
| Under 5 Years | 0 (0.0%) | 0 (0.0%) |
| 5 to 17 Years | 0 (0.0%) | 0 (0.0%) |
| 18 to 34 Years | 11 (21.6%) | 0 (0.0%) |
| 35 to 64 Years | 14 (10.9%) | 3 (2.5%) |
| 65 to 74 Years | 9 (36.0%) | 4 (23.5%) |
| 75 Years and over | 0 (0.0%) | 3 (8.6%) |
Disability Class by Sex by Age in Onida
Disability Class: Hearing Difficulty
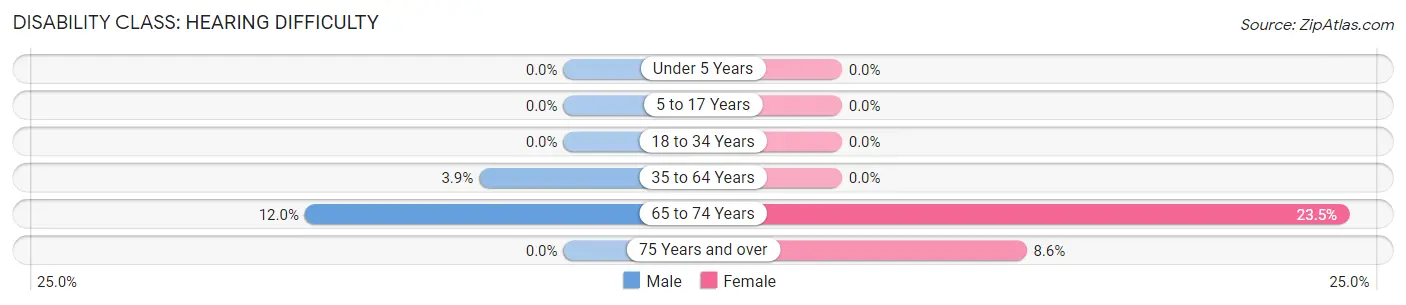
| Age Bracket | Male | Female |
| Under 5 Years | 0 (0.0%) | 0 (0.0%) |
| 5 to 17 Years | 0 (0.0%) | 0 (0.0%) |
| 18 to 34 Years | 0 (0.0%) | 0 (0.0%) |
| 35 to 64 Years | 5 (3.9%) | 0 (0.0%) |
| 65 to 74 Years | 3 (12.0%) | 4 (23.5%) |
| 75 Years and over | 0 (0.0%) | 3 (8.6%) |
Disability Class: Vision Difficulty
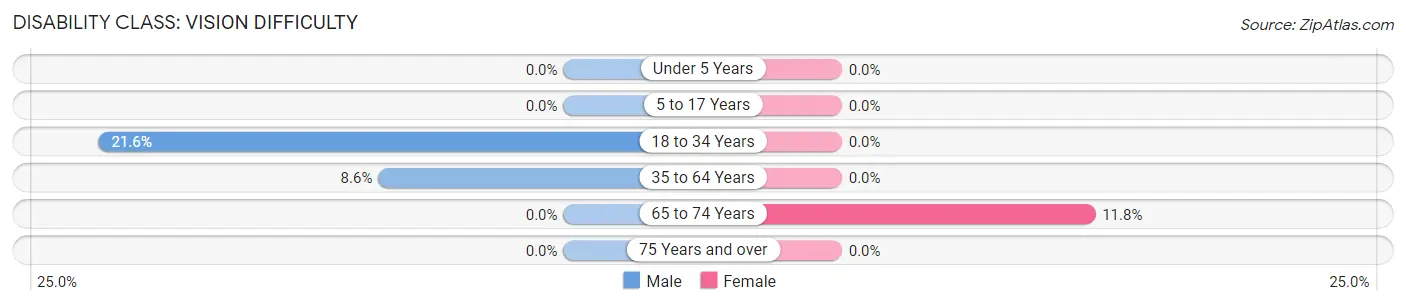
| Age Bracket | Male | Female |
| Under 5 Years | 0 (0.0%) | 0 (0.0%) |
| 5 to 17 Years | 0 (0.0%) | 0 (0.0%) |
| 18 to 34 Years | 11 (21.6%) | 0 (0.0%) |
| 35 to 64 Years | 11 (8.6%) | 0 (0.0%) |
| 65 to 74 Years | 0 (0.0%) | 2 (11.8%) |
| 75 Years and over | 0 (0.0%) | 0 (0.0%) |
Disability Class: Cognitive Difficulty
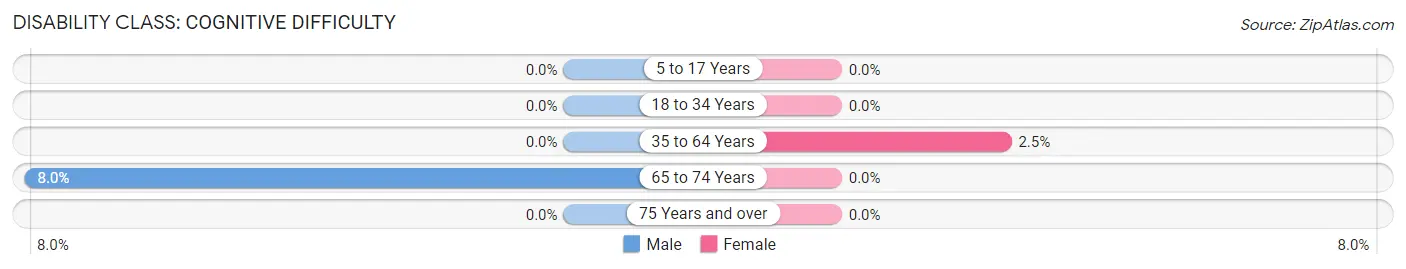
| Age Bracket | Male | Female |
| 5 to 17 Years | 0 (0.0%) | 0 (0.0%) |
| 18 to 34 Years | 0 (0.0%) | 0 (0.0%) |
| 35 to 64 Years | 0 (0.0%) | 3 (2.5%) |
| 65 to 74 Years | 2 (8.0%) | 0 (0.0%) |
| 75 Years and over | 0 (0.0%) | 0 (0.0%) |
Disability Class: Ambulatory Difficulty
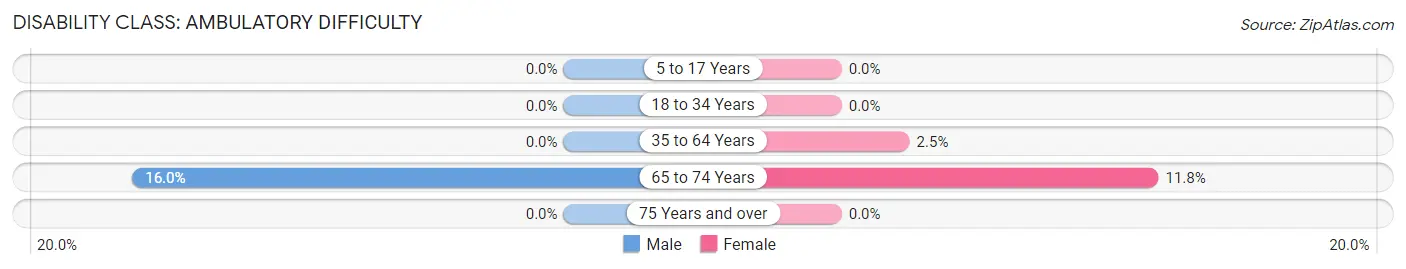
| Age Bracket | Male | Female |
| 5 to 17 Years | 0 (0.0%) | 0 (0.0%) |
| 18 to 34 Years | 0 (0.0%) | 0 (0.0%) |
| 35 to 64 Years | 0 (0.0%) | 3 (2.5%) |
| 65 to 74 Years | 4 (16.0%) | 2 (11.8%) |
| 75 Years and over | 0 (0.0%) | 0 (0.0%) |
Disability Class: Self-Care Difficulty
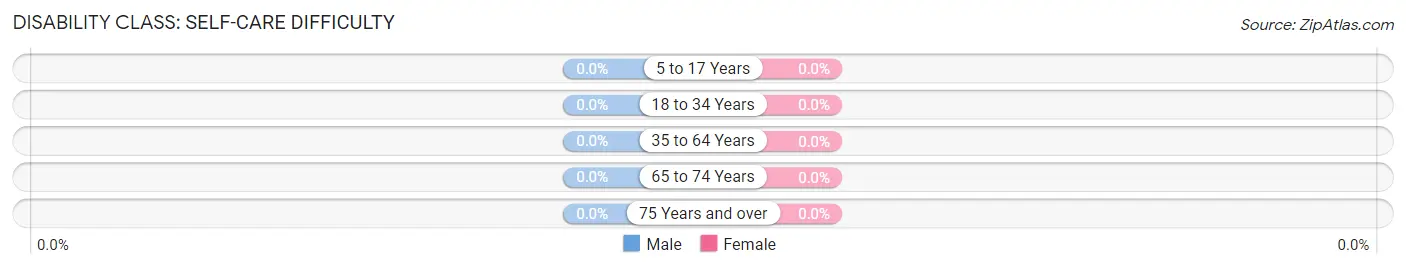
| Age Bracket | Male | Female |
| 5 to 17 Years | 0 (0.0%) | 0 (0.0%) |
| 18 to 34 Years | 0 (0.0%) | 0 (0.0%) |
| 35 to 64 Years | 0 (0.0%) | 0 (0.0%) |
| 65 to 74 Years | 0 (0.0%) | 0 (0.0%) |
| 75 Years and over | 0 (0.0%) | 0 (0.0%) |
Technology Access in Onida
Computing Device Access in Onida
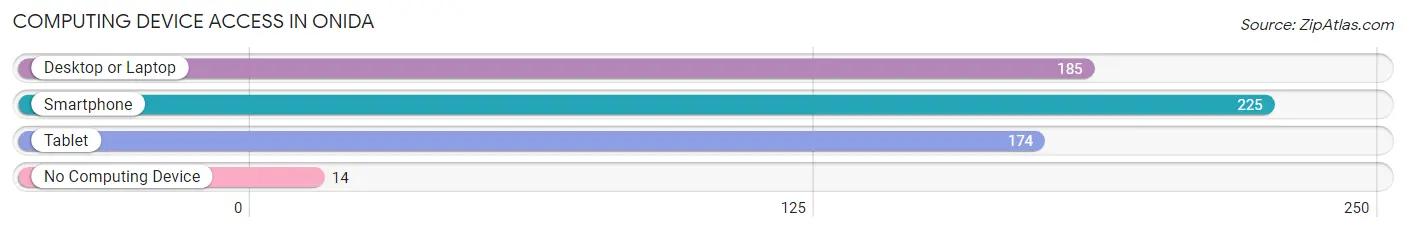
| Device Type | # Households | % Households |
| Desktop or Laptop | 185 | 71.2% |
| Smartphone | 225 | 86.5% |
| Tablet | 174 | 66.9% |
| No Computing Device | 14 | 5.4% |
| Total | 260 | 100.0% |
Internet Access in Onida
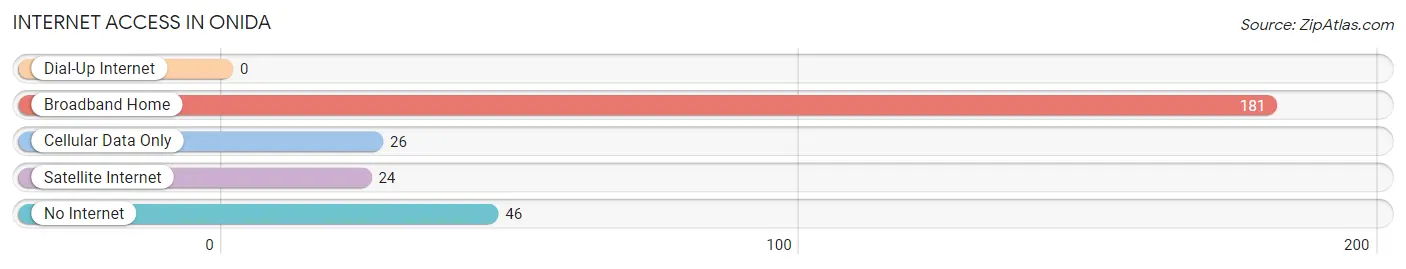
| Internet Type | # Households | % Households |
| Dial-Up Internet | 0 | 0.0% |
| Broadband Home | 181 | 69.6% |
| Cellular Data Only | 26 | 10.0% |
| Satellite Internet | 24 | 9.2% |
| No Internet | 46 | 17.7% |
| Total | 260 | 100.0% |
Onida Summary
Onida is a small town located in Sully County, South Dakota, United States. It is situated on the banks of the Missouri River, approximately 20 miles south of Pierre, the state capital. The population of Onida was estimated to be 545 in 2020.
History
Onida was founded in 1883 by the Chicago, Milwaukee, St. Paul and Pacific Railroad. The town was named after the Onida Indians, a tribe of the Sioux Nation. The Onida Indians had lived in the area for centuries before the arrival of the railroad.
The town was originally a farming community, but in the early 1900s, the railroad began to bring in more people and businesses. The town grew rapidly, and by 1910, Onida had a population of over 1,000.
In the 1920s, Onida was a thriving community with a variety of businesses, including a bank, a hotel, a movie theater, and a variety of stores. The town also had a school, a library, and a hospital.
Geography
Onida is located in Sully County, South Dakota, on the banks of the Missouri River. The town is situated in the rolling hills of the Great Plains, and is surrounded by farmland. The town is located approximately 20 miles south of Pierre, the state capital.
The climate in Onida is generally mild, with hot summers and cold winters. The average annual temperature is around 50 degrees Fahrenheit. The average annual precipitation is around 20 inches.
Economy
The economy of Onida is largely based on agriculture. The town is surrounded by farmland, and many of the residents are involved in farming and ranching. The town also has a variety of small businesses, including a grocery store, a hardware store, and a few restaurants.
The town is also home to a number of manufacturing companies, including a furniture factory and a plastics factory. The town also has a number of service-based businesses, including a bank, a post office, and a variety of other businesses.
Demographics
The population of Onida was estimated to be 545 in 2020. The town is predominantly white, with a small minority population. The median household income in Onida is around $45,000, and the median home value is around $100,000.
The town has a high rate of homeownership, with over 80% of the population owning their own homes. The town also has a high rate of educational attainment, with over 90% of the population having at least a high school diploma.
Conclusion
Onida is a small town located in Sully County, South Dakota, United States. It is situated on the banks of the Missouri River, approximately 20 miles south of Pierre, the state capital. The population of Onida was estimated to be 545 in 2020. The town is predominantly white, with a small minority population. The economy of Onida is largely based on agriculture, and the town also has a variety of small businesses and manufacturing companies. The town has a high rate of homeownership and educational attainment.
Common Questions
What is Per Capita Income in Onida?
Per Capita income in Onida is $41,578.
What is the Median Family Income in Onida?
Median Family Income in Onida is $99,583.
What is the Median Household income in Onida?
Median Household Income in Onida is $67,500.
What is Income or Wage Gap in Onida?
Income or Wage Gap in Onida is 42.0%.
Women in Onida earn 58.0 cents for every dollar earned by a man.
What is Inequality or Gini Index in Onida?
Inequality or Gini Index in Onida is 0.39.
What is the Total Population of Onida?
Total Population of Onida is 586.
What is the Total Male Population of Onida?
Total Male Population of Onida is 296.
What is the Total Female Population of Onida?
Total Female Population of Onida is 290.
What is the Ratio of Males per 100 Females in Onida?
There are 102.07 Males per 100 Females in Onida.
What is the Ratio of Females per 100 Males in Onida?
There are 97.97 Females per 100 Males in Onida.
What is the Median Population Age in Onida?
Median Population Age in Onida is 52.3 Years.
What is the Average Family Size in Onida
Average Family Size in Onida is 3.0 People.
What is the Average Household Size in Onida
Average Household Size in Onida is 2.2 People.
How Large is the Labor Force in Onida?
There are 327 People in the Labor Forcein in Onida.
What is the Percentage of People in the Labor Force in Onida?
70.6% of People are in the Labor Force in Onida.