Lake City, SD Map & Demographics
Lake City Map
Lake City Overview
$26,253
PER CAPITA INCOME
$93,750
AVG FAMILY INCOME
$51,250
AVG HOUSEHOLD INCOME
0.31
INEQUALITY / GINI INDEX
53
TOTAL POPULATION
32
MALE POPULATION
21
FEMALE POPULATION
152.38
MALES / 100 FEMALES
65.62
FEMALES / 100 MALES
56.5
MEDIAN AGE
3.5
AVG FAMILY SIZE
2.6
AVG HOUSEHOLD SIZE
34
LABOR FORCE [ PEOPLE ]
79.1%
PERCENT IN LABOR FORCE
2.9%
UNEMPLOYMENT RATE
Lake City Zip Codes
Lake City Area Codes
Income in Lake City
Income Overview in Lake City
Per Capita Income in Lake City is $26,253, while median incomes of families and households are $93,750 and $51,250 respectively.
| Characteristic | Number | Measure |
| Per Capita Income | 53 | $26,253 |
| Median Family Income | 13 | $93,750 |
| Mean Family Income | 13 | $75,331 |
| Median Household Income | 20 | $51,250 |
| Mean Household Income | 20 | $63,215 |
| Income Deficit | 13 | $0 |
| Wage / Income Gap (%) | 53 | 0.00% |
| Wage / Income Gap ($) | 53 | 100.00¢ per $1 |
| Gini / Inequality Index | 53 | 0.31 |
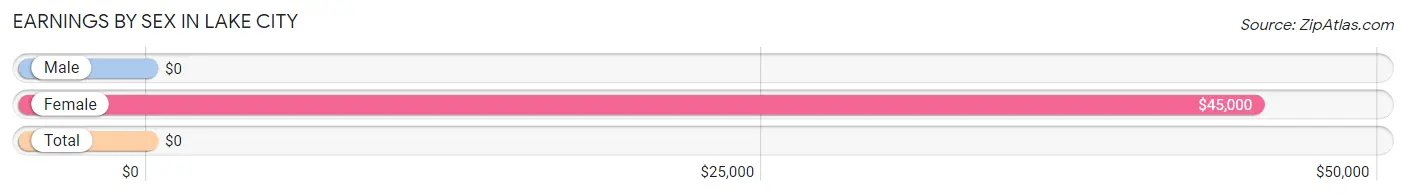
Earnings by Sex in Lake City
| Sex | Number | Average Earnings |
| Male | 23 (65.7%) | $0 |
| Female | 12 (34.3%) | $45,000 |
| Total | 35 (100.0%) | $0 |
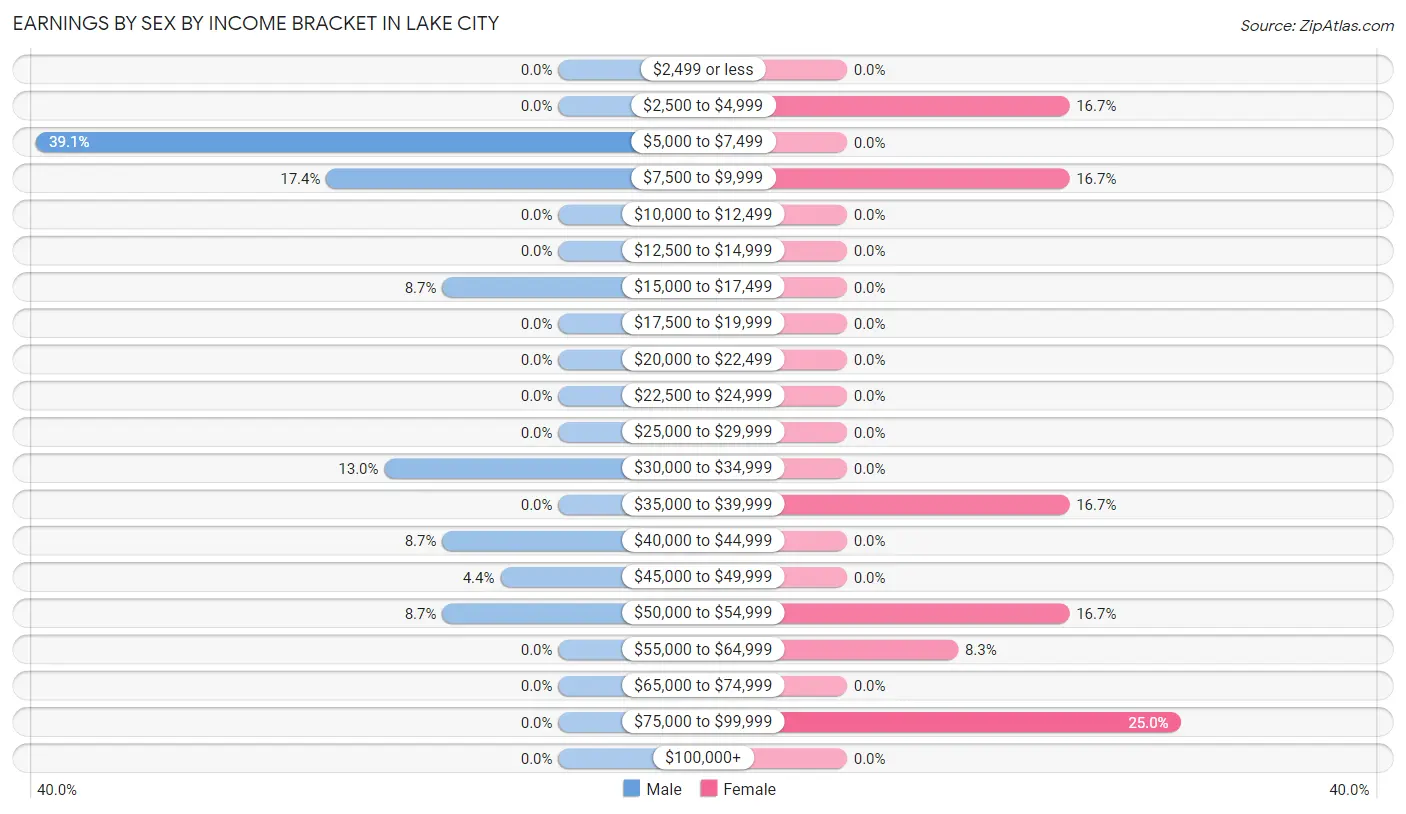
Earnings by Sex by Income Bracket in Lake City
The most common earnings brackets in Lake City are $5,000 to $7,499 for men (9 | 39.1%) and $75,000 to $99,999 for women (3 | 25.0%).
| Income | Male | Female |
| $2,499 or less | 0 (0.0%) | 0 (0.0%) |
| $2,500 to $4,999 | 0 (0.0%) | 2 (16.7%) |
| $5,000 to $7,499 | 9 (39.1%) | 0 (0.0%) |
| $7,500 to $9,999 | 4 (17.4%) | 2 (16.7%) |
| $10,000 to $12,499 | 0 (0.0%) | 0 (0.0%) |
| $12,500 to $14,999 | 0 (0.0%) | 0 (0.0%) |
| $15,000 to $17,499 | 2 (8.7%) | 0 (0.0%) |
| $17,500 to $19,999 | 0 (0.0%) | 0 (0.0%) |
| $20,000 to $22,499 | 0 (0.0%) | 0 (0.0%) |
| $22,500 to $24,999 | 0 (0.0%) | 0 (0.0%) |
| $25,000 to $29,999 | 0 (0.0%) | 0 (0.0%) |
| $30,000 to $34,999 | 3 (13.0%) | 0 (0.0%) |
| $35,000 to $39,999 | 0 (0.0%) | 2 (16.7%) |
| $40,000 to $44,999 | 2 (8.7%) | 0 (0.0%) |
| $45,000 to $49,999 | 1 (4.3%) | 0 (0.0%) |
| $50,000 to $54,999 | 2 (8.7%) | 2 (16.7%) |
| $55,000 to $64,999 | 0 (0.0%) | 1 (8.3%) |
| $65,000 to $74,999 | 0 (0.0%) | 0 (0.0%) |
| $75,000 to $99,999 | 0 (0.0%) | 3 (25.0%) |
| $100,000+ | 0 (0.0%) | 0 (0.0%) |
| Total | 23 (100.0%) | 12 (100.0%) |
Earnings by Sex by Educational Attainment in Lake City
| Educational Attainment | Male Income | Female Income |
| Less than High School | - | - |
| High School Diploma | - | - |
| College or Associate's Degree | - | - |
| Bachelor's Degree | - | - |
| Graduate Degree | - | - |
| Total | - | - |
Family Income in Lake City
Family Income Brackets in Lake City
According to the Lake City family income data, there are 4 families falling into the $75,000 to $99,999 income range, which is the most common income bracket and makes up 30.8% of all families.
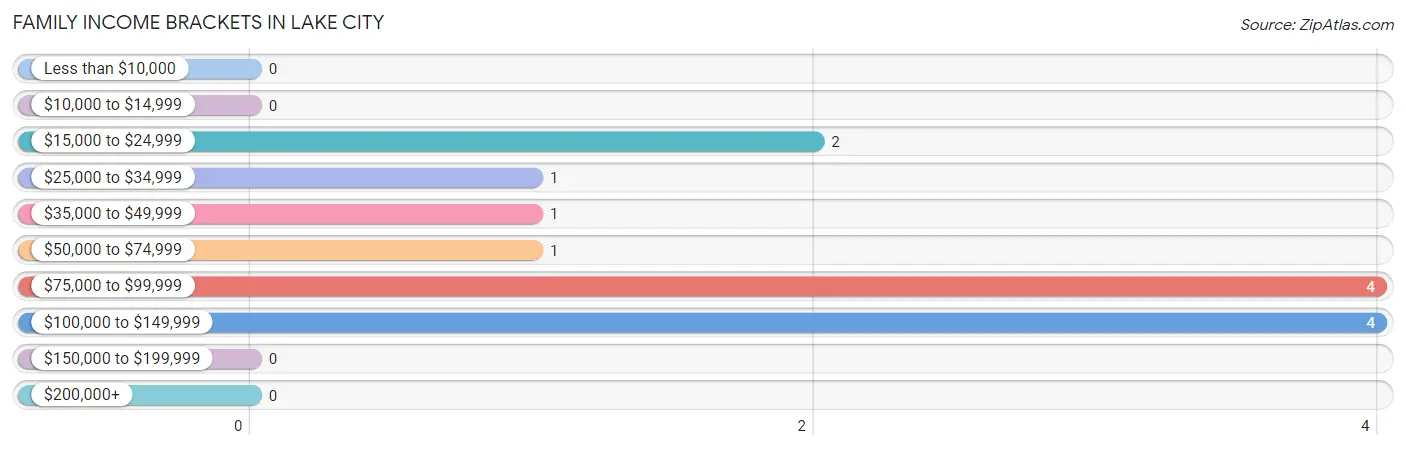
| Income Bracket | # Families | % Families |
| Less than $10,000 | 0 | 0.0% |
| $10,000 to $14,999 | 0 | 0.0% |
| $15,000 to $24,999 | 2 | 15.4% |
| $25,000 to $34,999 | 1 | 7.7% |
| $35,000 to $49,999 | 1 | 7.7% |
| $50,000 to $74,999 | 1 | 7.7% |
| $75,000 to $99,999 | 4 | 30.8% |
| $100,000 to $149,999 | 4 | 30.8% |
| $150,000 to $199,999 | 0 | 0.0% |
| $200,000+ | 0 | 0.0% |
Family Income by Famaliy Size in Lake City
2-person families (8 | 61.5%) account for the highest median family income in Lake City with $87,500 per family, while 2-person families (8 | 61.5%) have the highest median income of $43,750 per family member.
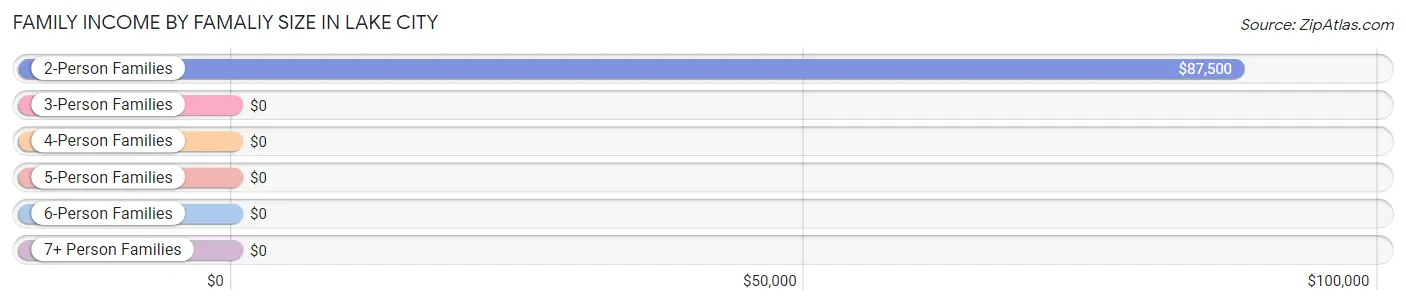
| Income Bracket | # Families | Median Income |
| 2-Person Families | 8 (61.5%) | $87,500 |
| 3-Person Families | 3 (23.1%) | $0 |
| 4-Person Families | 2 (15.4%) | $0 |
| 5-Person Families | 0 (0.0%) | $0 |
| 6-Person Families | 0 (0.0%) | $0 |
| 7+ Person Families | 0 (0.0%) | $0 |
| Total | 13 (100.0%) | $93,750 |
Family Income by Number of Earners in Lake City
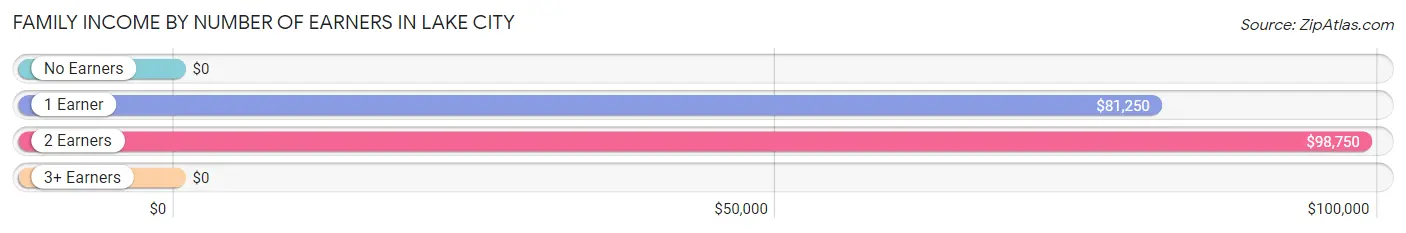
| Number of Earners | # Families | Median Income |
| No Earners | 2 (15.4%) | $0 |
| 1 Earner | 3 (23.1%) | $81,250 |
| 2 Earners | 8 (61.5%) | $98,750 |
| 3+ Earners | 0 (0.0%) | $0 |
| Total | 13 (100.0%) | $93,750 |
Household Income in Lake City
Household Income Brackets in Lake City
With 5 households falling in the category, the $25,000 to $34,999 income range is the most frequent in Lake City, accounting for 25.0% of all households.
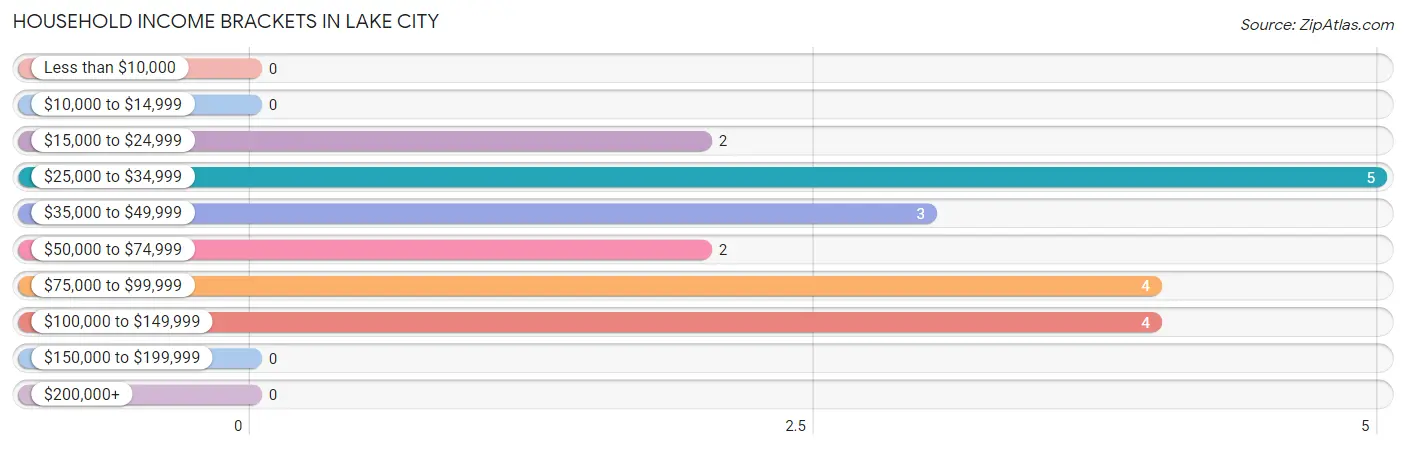
| Income Bracket | # Households | % Households |
| Less than $10,000 | 0 | 0.0% |
| $10,000 to $14,999 | 0 | 0.0% |
| $15,000 to $24,999 | 2 | 10.0% |
| $25,000 to $34,999 | 5 | 25.0% |
| $35,000 to $49,999 | 3 | 15.0% |
| $50,000 to $74,999 | 2 | 10.0% |
| $75,000 to $99,999 | 4 | 20.0% |
| $100,000 to $149,999 | 4 | 20.0% |
| $150,000 to $199,999 | 0 | 0.0% |
| $200,000+ | 0 | 0.0% |
Household Income by Householder Age in Lake City
The median household income in Lake City is $51,250, with the highest median household income of $40,625 found in the 65+ years age bracket for the primary householder. A total of 13 households (65.0%) fall into this category.
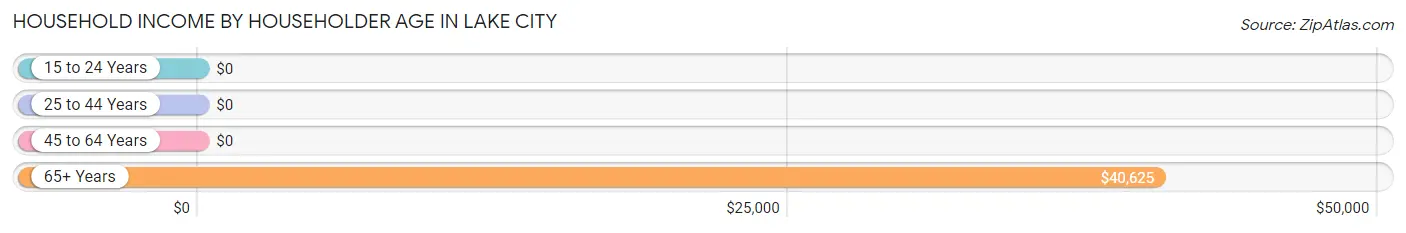
| Income Bracket | # Households | Median Income |
| 15 to 24 Years | 0 (0.0%) | $0 |
| 25 to 44 Years | 3 (15.0%) | $0 |
| 45 to 64 Years | 4 (20.0%) | $0 |
| 65+ Years | 13 (65.0%) | $40,625 |
| Total | 20 (100.0%) | $51,250 |
Poverty in Lake City
Income Below Poverty by Sex and Age in Lake City
With 28.1% poverty level for males and 38.1% for females among the residents of Lake City, 25 to 34 year old males and 12 to 14 year old females are the most vulnerable to poverty, with 9 males (81.8%) and 6 females (100.0%) in their respective age groups living below the poverty level.
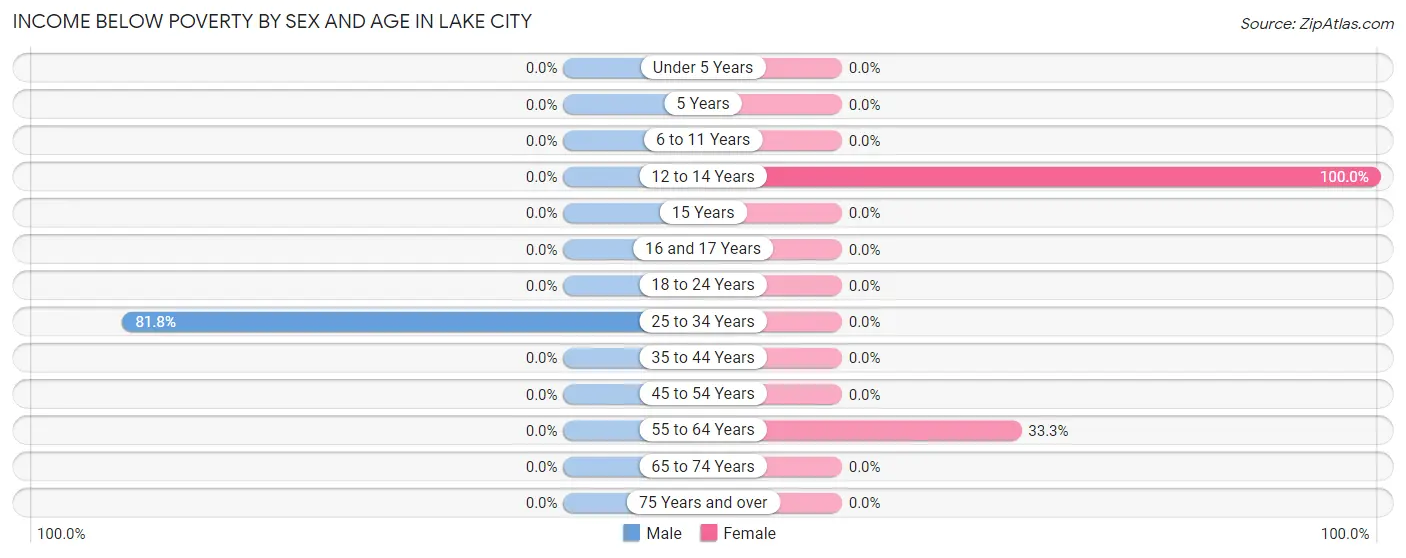
| Age Bracket | Male | Female |
| Under 5 Years | 0 (0.0%) | 0 (0.0%) |
| 5 Years | 0 (0.0%) | 0 (0.0%) |
| 6 to 11 Years | 0 (0.0%) | 0 (0.0%) |
| 12 to 14 Years | 0 (0.0%) | 6 (100.0%) |
| 15 Years | 0 (0.0%) | 0 (0.0%) |
| 16 and 17 Years | 0 (0.0%) | 0 (0.0%) |
| 18 to 24 Years | 0 (0.0%) | 0 (0.0%) |
| 25 to 34 Years | 9 (81.8%) | 0 (0.0%) |
| 35 to 44 Years | 0 (0.0%) | 0 (0.0%) |
| 45 to 54 Years | 0 (0.0%) | 0 (0.0%) |
| 55 to 64 Years | 0 (0.0%) | 2 (33.3%) |
| 65 to 74 Years | 0 (0.0%) | 0 (0.0%) |
| 75 Years and over | 0 (0.0%) | 0 (0.0%) |
| Total | 9 (28.1%) | 8 (38.1%) |
Income Above Poverty by Sex and Age in Lake City
According to the poverty statistics in Lake City, males aged under 5 years and females aged 25 to 34 years are the age groups that are most secure financially, with 100.0% of males and 100.0% of females in these age groups living above the poverty line.
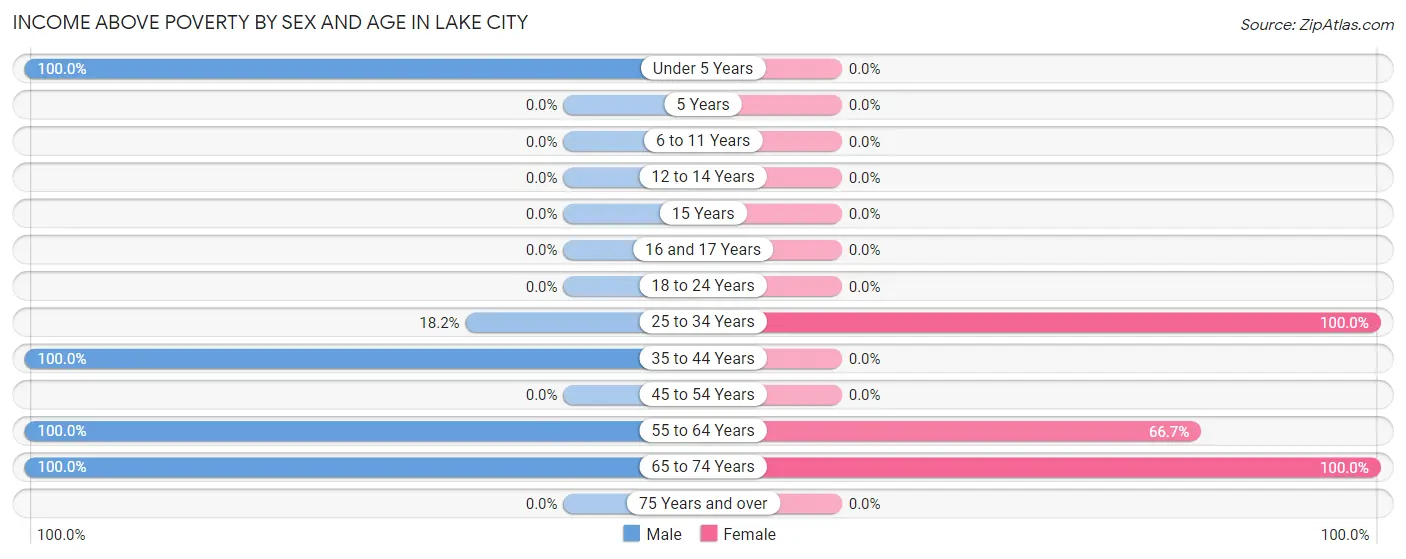
| Age Bracket | Male | Female |
| Under 5 Years | 4 (100.0%) | 0 (0.0%) |
| 5 Years | 0 (0.0%) | 0 (0.0%) |
| 6 to 11 Years | 0 (0.0%) | 0 (0.0%) |
| 12 to 14 Years | 0 (0.0%) | 0 (0.0%) |
| 15 Years | 0 (0.0%) | 0 (0.0%) |
| 16 and 17 Years | 0 (0.0%) | 0 (0.0%) |
| 18 to 24 Years | 0 (0.0%) | 0 (0.0%) |
| 25 to 34 Years | 2 (18.2%) | 3 (100.0%) |
| 35 to 44 Years | 1 (100.0%) | 0 (0.0%) |
| 45 to 54 Years | 0 (0.0%) | 0 (0.0%) |
| 55 to 64 Years | 2 (100.0%) | 4 (66.7%) |
| 65 to 74 Years | 14 (100.0%) | 6 (100.0%) |
| 75 Years and over | 0 (0.0%) | 0 (0.0%) |
| Total | 23 (71.9%) | 13 (61.9%) |
Income Below Poverty Among Married-Couple Families in Lake City
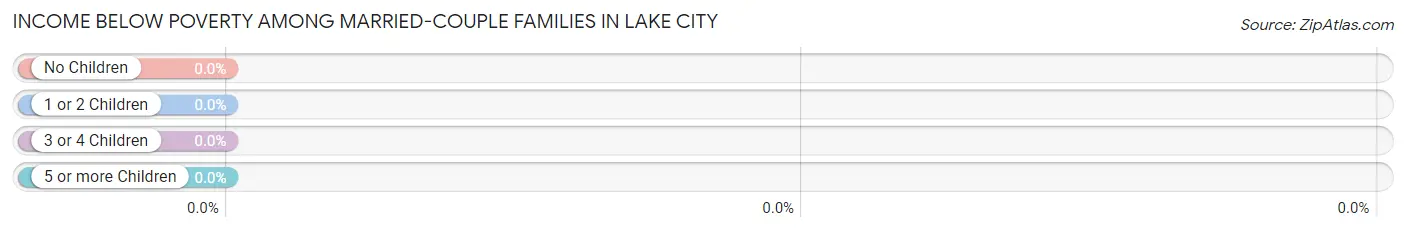
| Children | Above Poverty | Below Poverty |
| No Children | 8 (100.0%) | 0 (0.0%) |
| 1 or 2 Children | 3 (100.0%) | 0 (0.0%) |
| 3 or 4 Children | 0 (0.0%) | 0 (0.0%) |
| 5 or more Children | 0 (0.0%) | 0 (0.0%) |
| Total | 11 (100.0%) | 0 (0.0%) |
Income Below Poverty Among Single-Parent Households in Lake City
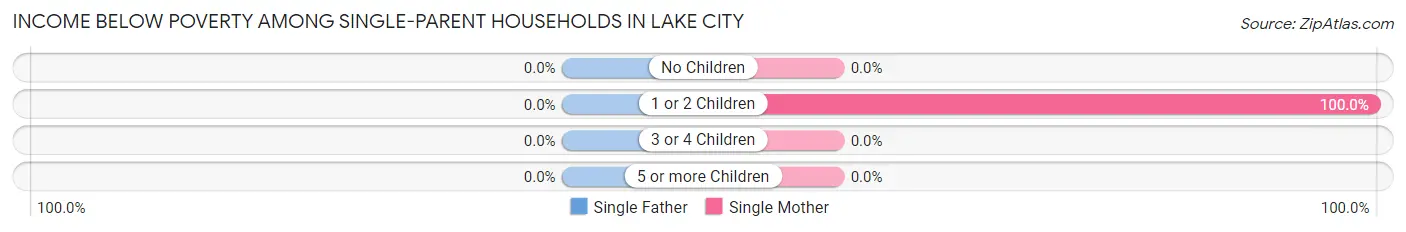
| Children | Single Father | Single Mother |
| No Children | 0 (0.0%) | 0 (0.0%) |
| 1 or 2 Children | 0 (0.0%) | 2 (100.0%) |
| 3 or 4 Children | 0 (0.0%) | 0 (0.0%) |
| 5 or more Children | 0 (0.0%) | 0 (0.0%) |
| Total | 0 (0.0%) | 2 (100.0%) |
Income Below Poverty Among Married-Couple vs Single-Parent Households in Lake City
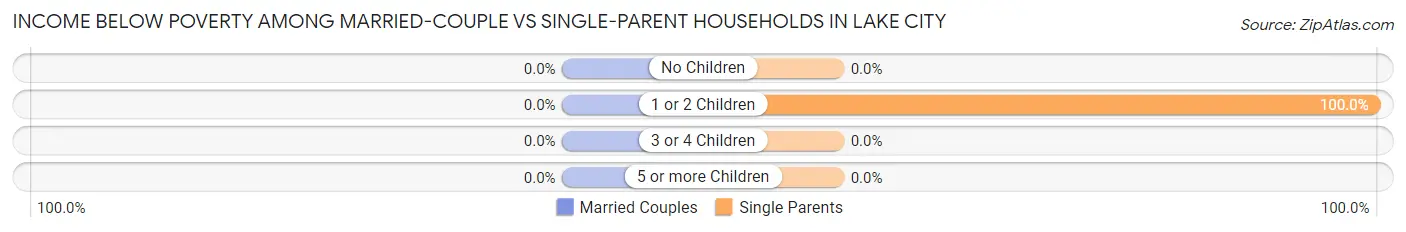
| Children | Married-Couple Families | Single-Parent Households |
| No Children | 0 (0.0%) | 0 (0.0%) |
| 1 or 2 Children | 0 (0.0%) | 2 (100.0%) |
| 3 or 4 Children | 0 (0.0%) | 0 (0.0%) |
| 5 or more Children | 0 (0.0%) | 0 (0.0%) |
| Total | 0 (0.0%) | 2 (100.0%) |
Race in Lake City
The most populous races in Lake City are , and White / Caucasian (53 | 100.0%).
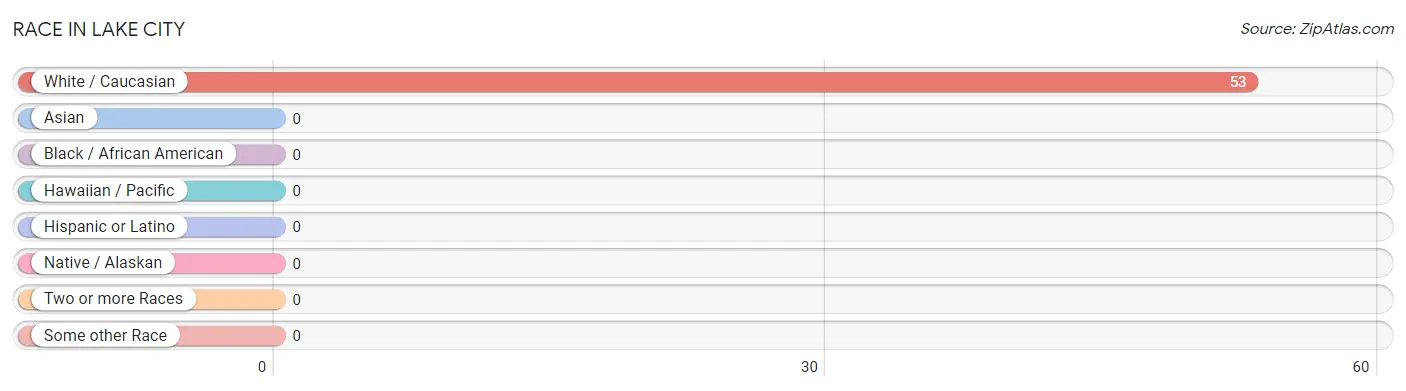
| Race | # Population | % Population |
| Asian | 0 | 0.0% |
| Black / African American | 0 | 0.0% |
| Hawaiian / Pacific | 0 | 0.0% |
| Hispanic or Latino | 0 | 0.0% |
| Native / Alaskan | 0 | 0.0% |
| White / Caucasian | 53 | 100.0% |
| Two or more Races | 0 | 0.0% |
| Some other Race | 0 | 0.0% |
| Total | 53 | 100.0% |
Ancestry in Lake City
The most populous ancestries reported in Lake City are Norwegian (27 | 50.9%), German (14 | 26.4%), Irish (4 | 7.5%), Swedish (4 | 7.5%), and Polish (3 | 5.7%), together accounting for 98.1% of all Lake City residents.
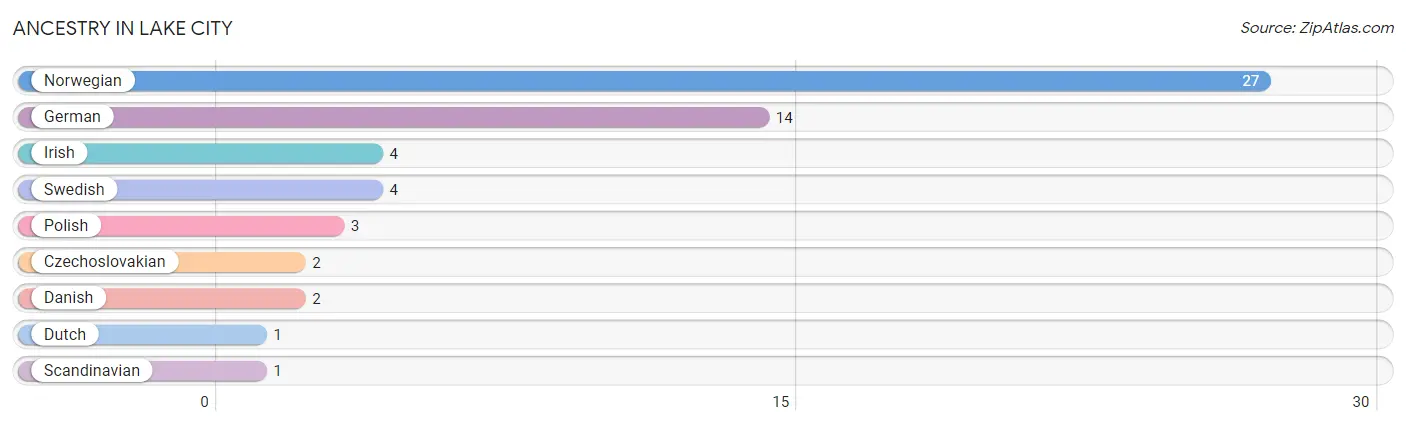
| Ancestry | # Population | % Population |
| Czechoslovakian | 2 | 3.8% |
| Danish | 2 | 3.8% |
| Dutch | 1 | 1.9% |
| German | 14 | 26.4% |
| Irish | 4 | 7.5% |
| Norwegian | 27 | 50.9% |
| Polish | 3 | 5.7% |
| Scandinavian | 1 | 1.9% |
| Swedish | 4 | 7.5% | View All 9 Rows |
Immigrants in Lake City
The most numerous immigrant groups reported in Lake City came from , and Canada (6 | 11.3%), together accounting for 11.3% of all Lake City residents.

| Immigration Origin | # Population | % Population |
| Canada | 6 | 11.3% | View All 1 Rows |
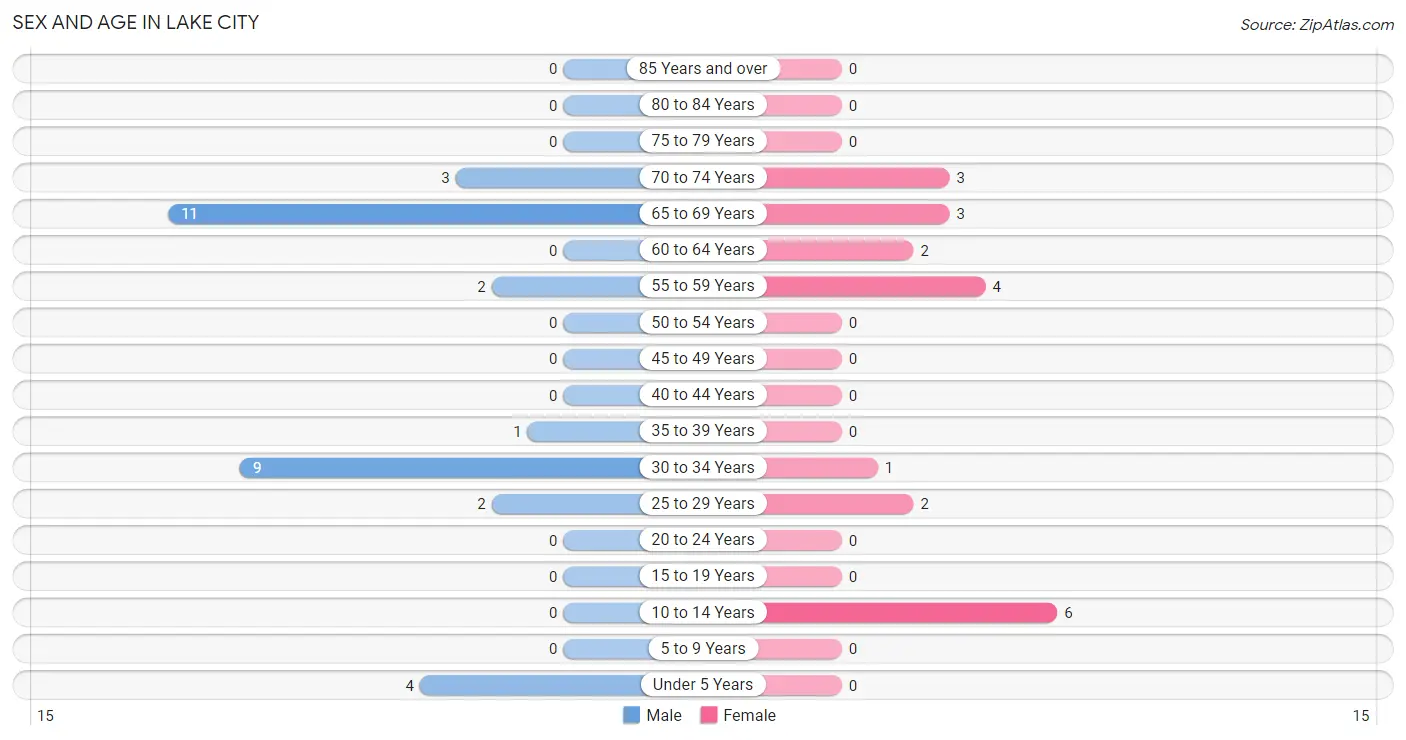
Sex and Age in Lake City
Sex and Age in Lake City
The most populous age groups in Lake City are 65 to 69 Years (11 | 34.4%) for men and 10 to 14 Years (6 | 28.6%) for women.
| Age Bracket | Male | Female |
| Under 5 Years | 4 (12.5%) | 0 (0.0%) |
| 5 to 9 Years | 0 (0.0%) | 0 (0.0%) |
| 10 to 14 Years | 0 (0.0%) | 6 (28.6%) |
| 15 to 19 Years | 0 (0.0%) | 0 (0.0%) |
| 20 to 24 Years | 0 (0.0%) | 0 (0.0%) |
| 25 to 29 Years | 2 (6.2%) | 2 (9.5%) |
| 30 to 34 Years | 9 (28.1%) | 1 (4.8%) |
| 35 to 39 Years | 1 (3.1%) | 0 (0.0%) |
| 40 to 44 Years | 0 (0.0%) | 0 (0.0%) |
| 45 to 49 Years | 0 (0.0%) | 0 (0.0%) |
| 50 to 54 Years | 0 (0.0%) | 0 (0.0%) |
| 55 to 59 Years | 2 (6.2%) | 4 (19.1%) |
| 60 to 64 Years | 0 (0.0%) | 2 (9.5%) |
| 65 to 69 Years | 11 (34.4%) | 3 (14.3%) |
| 70 to 74 Years | 3 (9.4%) | 3 (14.3%) |
| 75 to 79 Years | 0 (0.0%) | 0 (0.0%) |
| 80 to 84 Years | 0 (0.0%) | 0 (0.0%) |
| 85 Years and over | 0 (0.0%) | 0 (0.0%) |
| Total | 32 (100.0%) | 21 (100.0%) |
Families and Households in Lake City
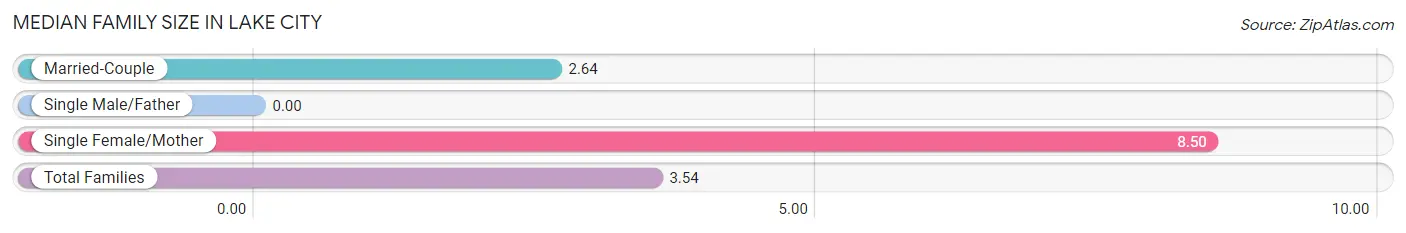
Median Family Size in Lake City
| Family Type | # Families | Family Size |
| Married-Couple | 11 (84.6%) | 2.64 |
| Single Male/Father | 0 (0.0%) | - |
| Single Female/Mother | 2 (15.4%) | 8.50 |
| Total Families | 13 (100.0%) | 3.54 |
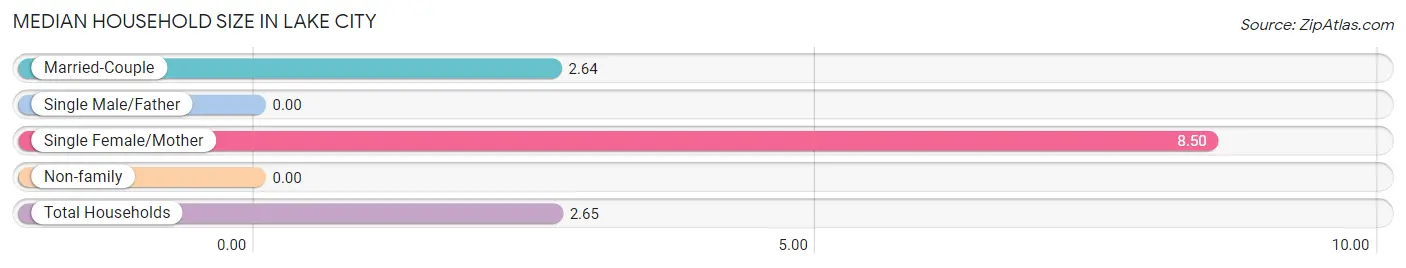
Median Household Size in Lake City
| Household Type | # Households | Household Size |
| Married-Couple | 11 (55.0%) | 2.64 |
| Single Male/Father | 0 (0.0%) | - |
| Single Female/Mother | 2 (10.0%) | 8.50 |
| Non-family | 7 (35.0%) | - |
| Total Households | 20 (100.0%) | 2.65 |
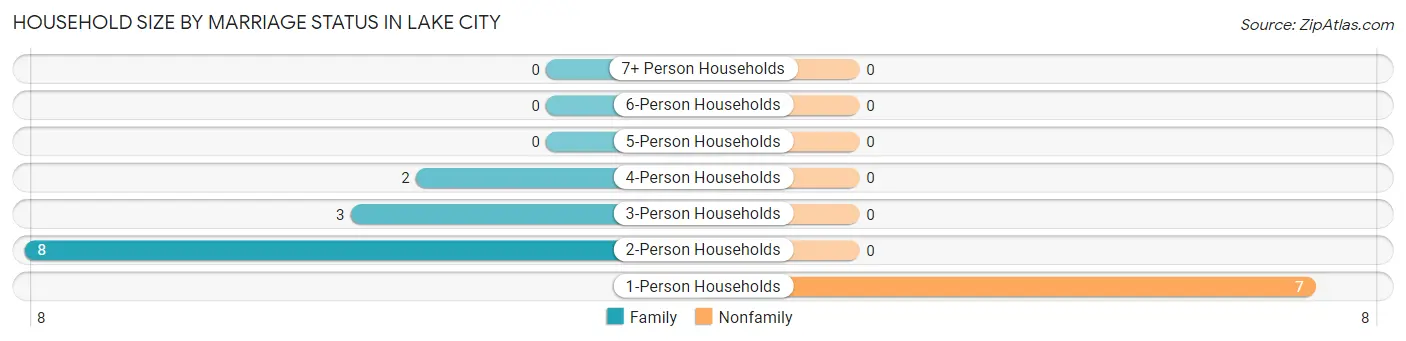
Household Size by Marriage Status in Lake City
Out of a total of 20 households in Lake City, 13 (65.0%) are family households, while 7 (35.0%) are nonfamily households. The most numerous type of family households are 2-person households, comprising 8, and the most common type of nonfamily households are 1-person households, comprising 7.
| Household Size | Family Households | Nonfamily Households |
| 1-Person Households | - | 7 (35.0%) |
| 2-Person Households | 8 (40.0%) | 0 (0.0%) |
| 3-Person Households | 3 (15.0%) | 0 (0.0%) |
| 4-Person Households | 2 (10.0%) | 0 (0.0%) |
| 5-Person Households | 0 (0.0%) | 0 (0.0%) |
| 6-Person Households | 0 (0.0%) | 0 (0.0%) |
| 7+ Person Households | 0 (0.0%) | 0 (0.0%) |
| Total | 13 (65.0%) | 7 (35.0%) |
Female Fertility in Lake City
Fertility by Age in Lake City
Average fertility rate in Lake City is 667.0 births per 1,000 women. Women in the age bracket of 20 to 34 years have the highest fertility rate with 667.0 births per 1,000 women. Women in the age bracket of 20 to 34 years acount for 100.0% of all women with births.
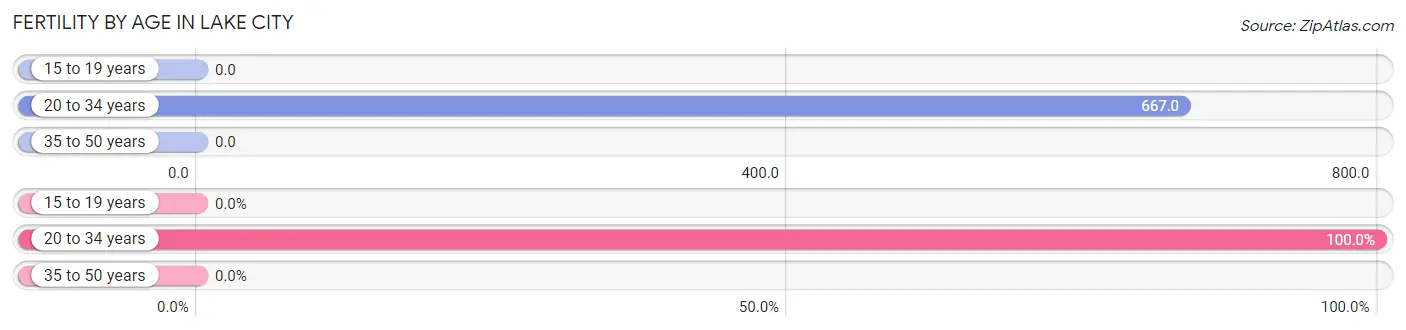
| Age Bracket | Women with Births | Births / 1,000 Women |
| 15 to 19 years | 0 (0.0%) | 0.0 |
| 20 to 34 years | 2 (100.0%) | 667.0 |
| 35 to 50 years | 0 (0.0%) | 0.0 |
| Total | 2 (100.0%) | 667.0 |
Fertility by Age by Marriage Status in Lake City
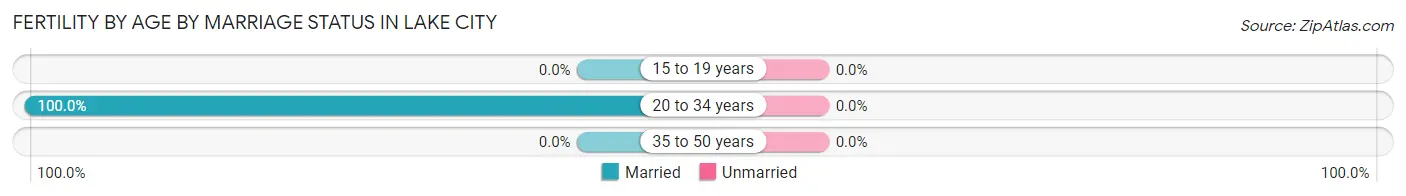
| Age Bracket | Married | Unmarried |
| 15 to 19 years | 0 (0.0%) | 0 (0.0%) |
| 20 to 34 years | 2 (100.0%) | 0 (0.0%) |
| 35 to 50 years | 0 (0.0%) | 0 (0.0%) |
| Total | 2 (100.0%) | 0 (0.0%) |
Fertility by Education in Lake City
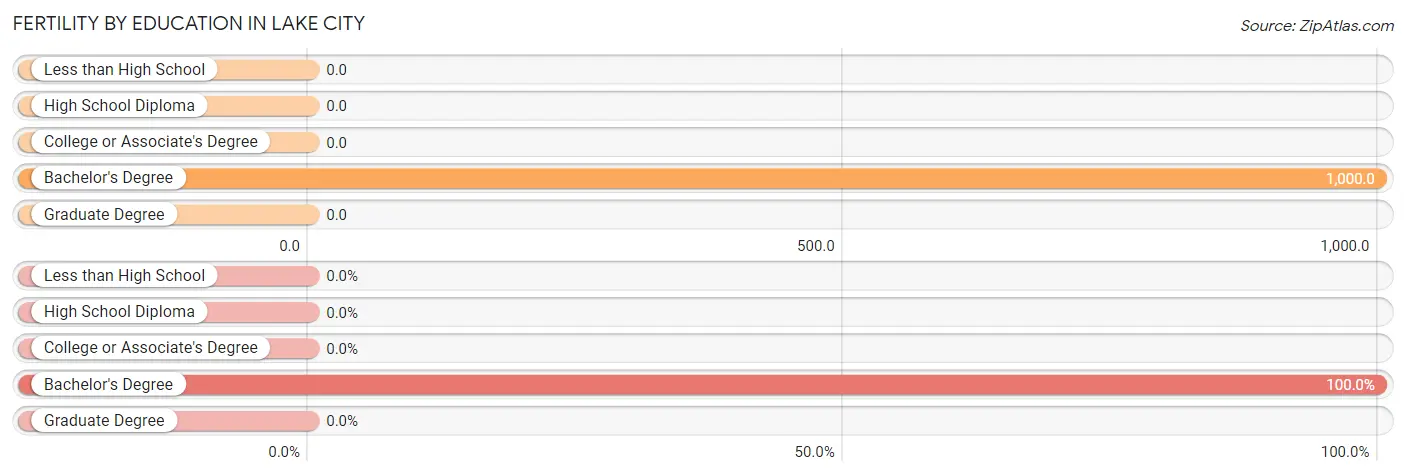
| Educational Attainment | Women with Births | Births / 1,000 Women |
| Less than High School | 0 (0.0%) | 0.0 |
| High School Diploma | 0 (0.0%) | 0.0 |
| College or Associate's Degree | 0 (0.0%) | 0.0 |
| Bachelor's Degree | 2 (100.0%) | 1,000.0 |
| Graduate Degree | 0 (0.0%) | 0.0 |
| Total | 2 (100.0%) | 667.0 |
Fertility by Education by Marriage Status in Lake City
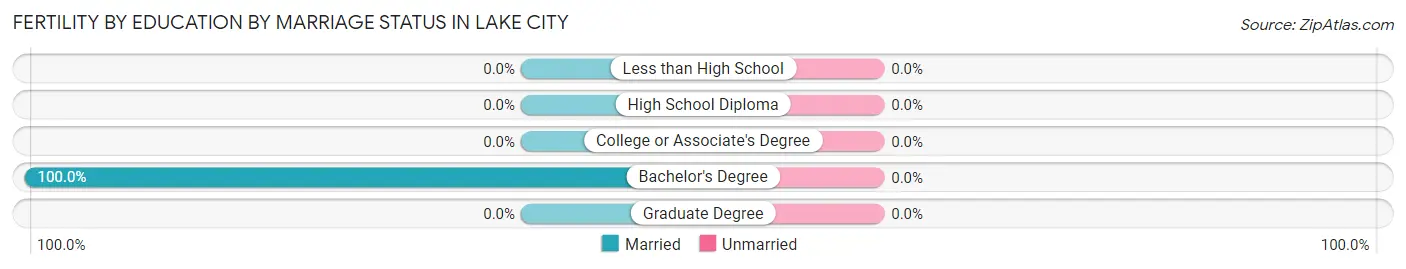
| Educational Attainment | Married | Unmarried |
| Less than High School | 0 (0.0%) | 0 (0.0%) |
| High School Diploma | 0 (0.0%) | 0 (0.0%) |
| College or Associate's Degree | 0 (0.0%) | 0 (0.0%) |
| Bachelor's Degree | 2 (100.0%) | 0 (0.0%) |
| Graduate Degree | 0 (0.0%) | 0 (0.0%) |
| Total | 2 (100.0%) | 0 (0.0%) |
Employment Characteristics in Lake City
Employment by Class of Employer in Lake City
Among the 33 employed individuals in Lake City, self-employed (not incorporated) (15 | 45.5%), private company employees (9 | 27.3%), and state government employees (4 | 12.1%) make up the most common classes of employment.
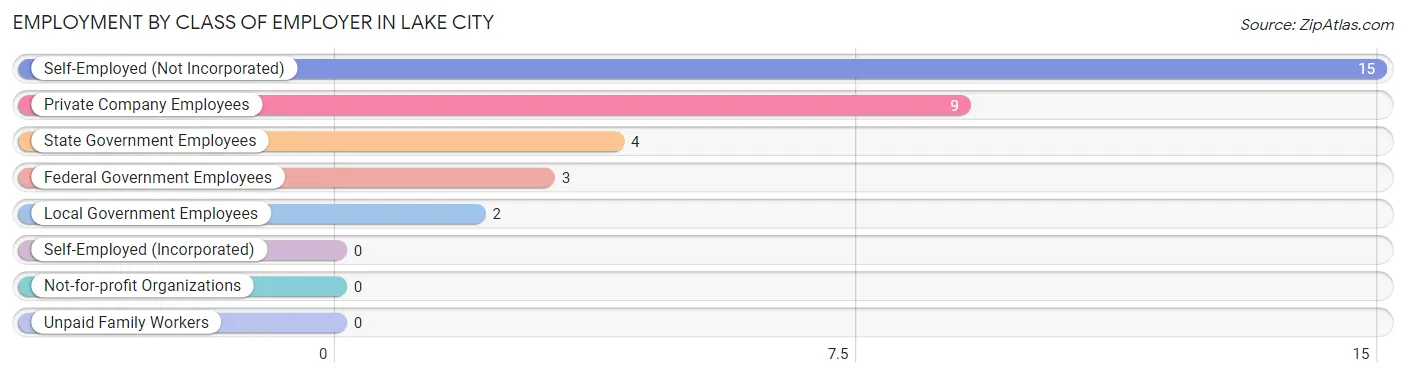
| Employer Class | # Employees | % Employees |
| Private Company Employees | 9 | 27.3% |
| Self-Employed (Incorporated) | 0 | 0.0% |
| Self-Employed (Not Incorporated) | 15 | 45.5% |
| Not-for-profit Organizations | 0 | 0.0% |
| Local Government Employees | 2 | 6.1% |
| State Government Employees | 4 | 12.1% |
| Federal Government Employees | 3 | 9.1% |
| Unpaid Family Workers | 0 | 0.0% |
| Total | 33 | 100.0% |
Employment Status by Age in Lake City
According to the labor force statistics for Lake City, out of the total population over 16 years of age (43), 79.1% or 34 individuals are in the labor force, with 2.9% or 1 of them unemployed. The age group with the highest labor force participation rate is 25 to 29 years, with 100.0% or 4 individuals in the labor force. Within the labor force, the 30 to 34 years age range has the highest percentage of unemployed individuals, with 10.0% or 1 of them being unemployed.
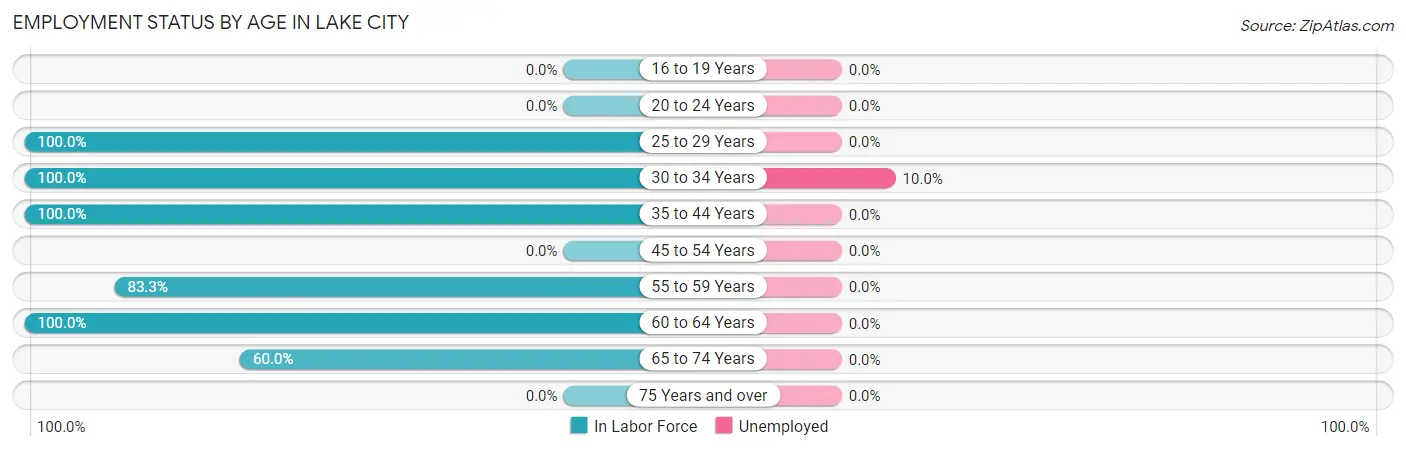
| Age Bracket | In Labor Force | Unemployed |
| 16 to 19 Years | 0 (0.0%) | 0 (0.0%) |
| 20 to 24 Years | 0 (0.0%) | 0 (0.0%) |
| 25 to 29 Years | 4 (100.0%) | 0 (0.0%) |
| 30 to 34 Years | 10 (100.0%) | 1 (10.0%) |
| 35 to 44 Years | 1 (100.0%) | 0 (0.0%) |
| 45 to 54 Years | 0 (0.0%) | 0 (0.0%) |
| 55 to 59 Years | 5 (83.3%) | 0 (0.0%) |
| 60 to 64 Years | 2 (100.0%) | 0 (0.0%) |
| 65 to 74 Years | 12 (60.0%) | 0 (0.0%) |
| 75 Years and over | 0 (0.0%) | 0 (0.0%) |
| Total | 34 (79.1%) | 1 (2.9%) |
Employment Status by Educational Attainment in Lake City
According to labor force statistics for Lake City, 95.7% of individuals (22) out of the total population between 25 and 64 years of age (23) are in the labor force, with 4.5% or 1 of them being unemployed. The group with the highest labor force participation rate are those with the educational attainment of high school diploma, with 100.0% or 11 individuals in the labor force. Within the labor force, individuals with college / associate degree education have the highest percentage of unemployment, with 16.7% or 1 of them being unemployed.
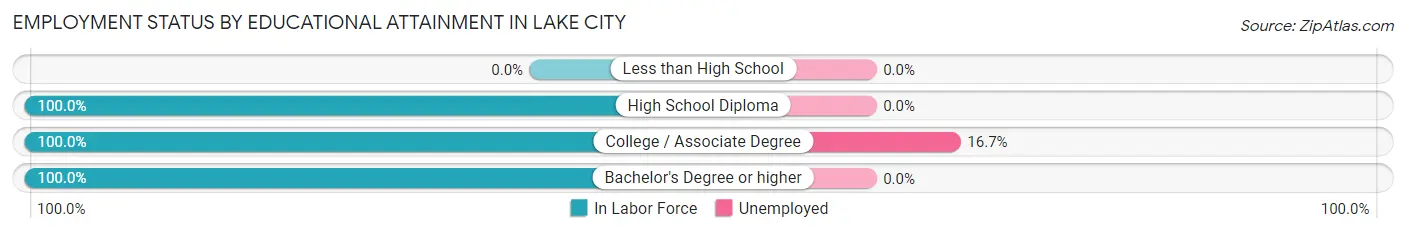
| Educational Attainment | In Labor Force | Unemployed |
| Less than High School | 0 (0.0%) | 0 (0.0%) |
| High School Diploma | 11 (100.0%) | 0 (0.0%) |
| College / Associate Degree | 6 (100.0%) | 1 (16.7%) |
| Bachelor's Degree or higher | 5 (100.0%) | 0 (0.0%) |
| Total | 22 (95.7%) | 1 (4.5%) |
Employment Occupations by Sex in Lake City
Management, Business, Science and Arts Occupations
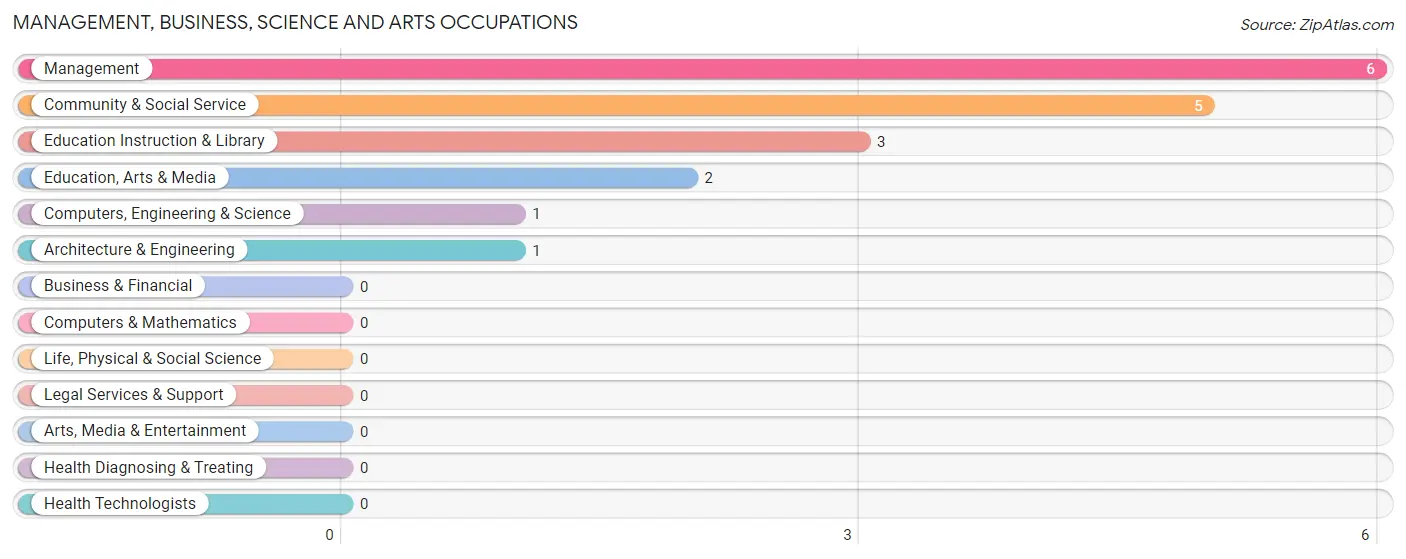
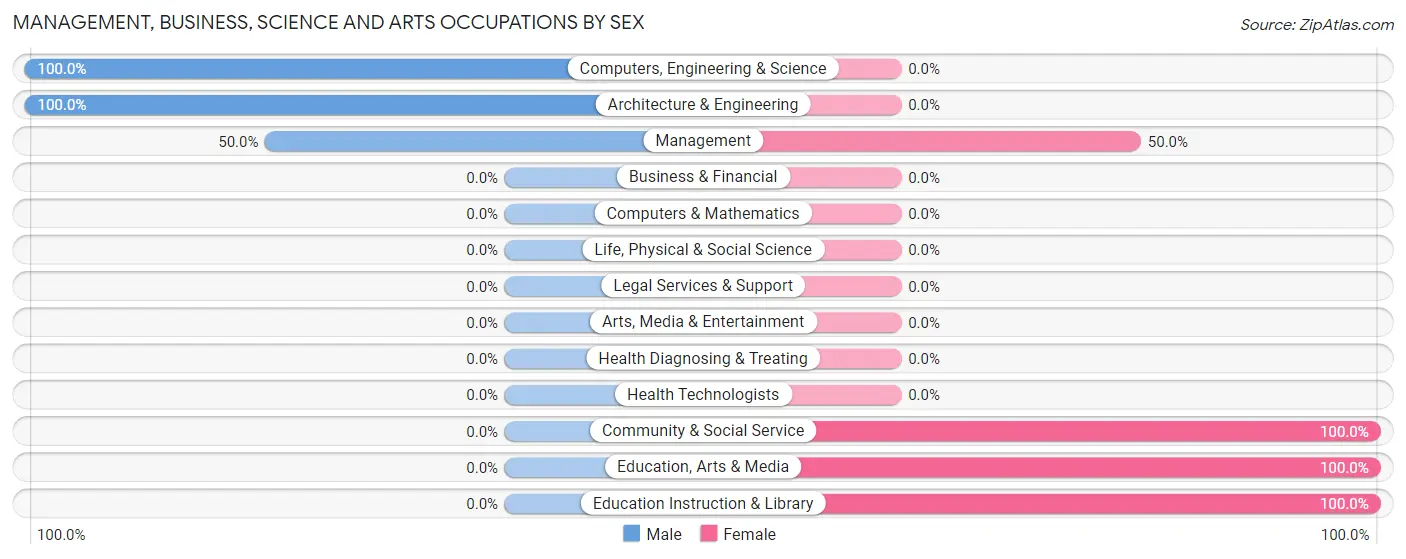
The most common Management, Business, Science and Arts occupations in Lake City are Management (6 | 18.2%), Community & Social Service (5 | 15.1%), Education Instruction & Library (3 | 9.1%), Education, Arts & Media (2 | 6.1%), and Computers, Engineering & Science (1 | 3.0%).
Management, Business, Science and Arts Occupations by Sex
Within the Management, Business, Science and Arts occupations in Lake City, the most male-oriented occupations are Computers, Engineering & Science (100.0%), Architecture & Engineering (100.0%), and Management (50.0%), while the most female-oriented occupations are Community & Social Service (100.0%), Education, Arts & Media (100.0%), and Education Instruction & Library (100.0%).
| Occupation | Male | Female |
| Management | 3 (50.0%) | 3 (50.0%) |
| Business & Financial | 0 (0.0%) | 0 (0.0%) |
| Computers, Engineering & Science | 1 (100.0%) | 0 (0.0%) |
| Computers & Mathematics | 0 (0.0%) | 0 (0.0%) |
| Architecture & Engineering | 1 (100.0%) | 0 (0.0%) |
| Life, Physical & Social Science | 0 (0.0%) | 0 (0.0%) |
| Community & Social Service | 0 (0.0%) | 5 (100.0%) |
| Education, Arts & Media | 0 (0.0%) | 2 (100.0%) |
| Legal Services & Support | 0 (0.0%) | 0 (0.0%) |
| Education Instruction & Library | 0 (0.0%) | 3 (100.0%) |
| Arts, Media & Entertainment | 0 (0.0%) | 0 (0.0%) |
| Health Diagnosing & Treating | 0 (0.0%) | 0 (0.0%) |
| Health Technologists | 0 (0.0%) | 0 (0.0%) |
| Total (Category) | 4 (33.3%) | 8 (66.7%) |
| Total (Overall) | 22 (66.7%) | 11 (33.3%) |
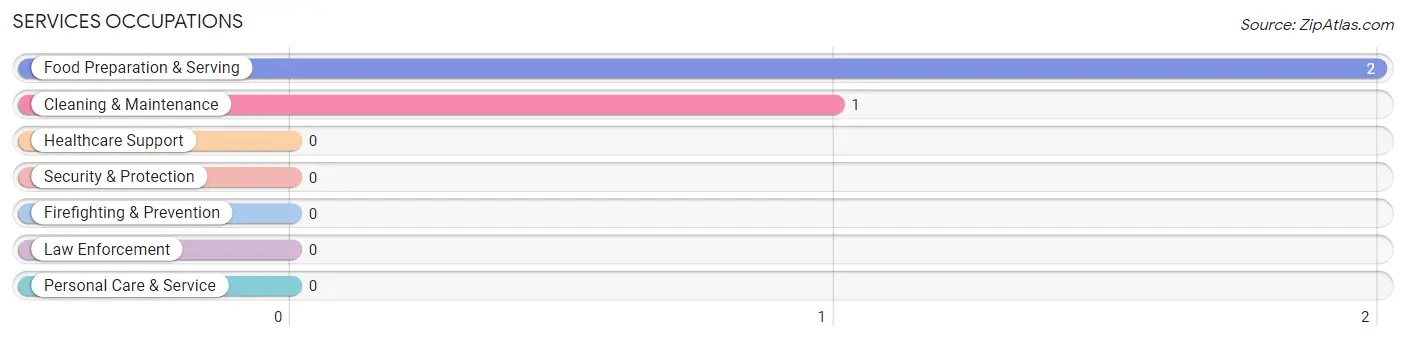
Services Occupations
The most common Services occupations in Lake City are Food Preparation & Serving (2 | 6.1%), and Cleaning & Maintenance (1 | 3.0%).
Services Occupations by Sex
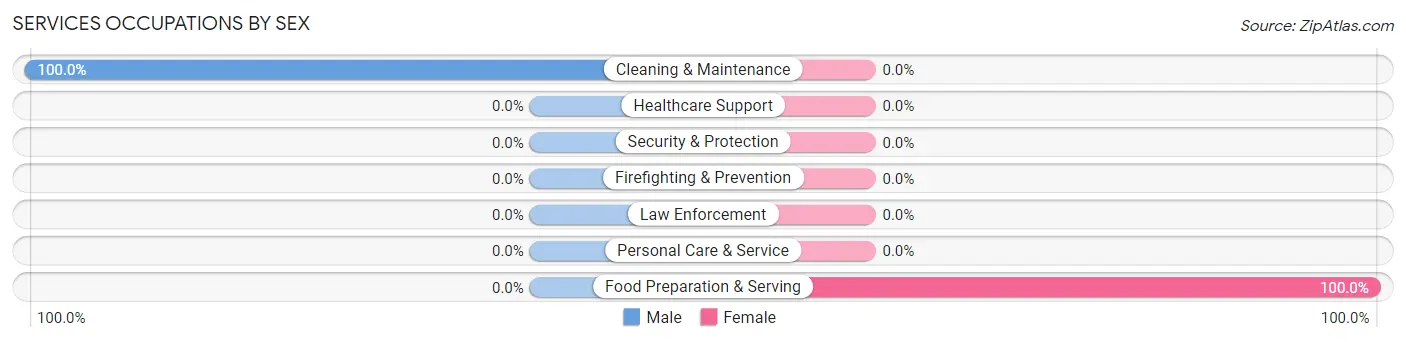
| Occupation | Male | Female |
| Healthcare Support | 0 (0.0%) | 0 (0.0%) |
| Security & Protection | 0 (0.0%) | 0 (0.0%) |
| Firefighting & Prevention | 0 (0.0%) | 0 (0.0%) |
| Law Enforcement | 0 (0.0%) | 0 (0.0%) |
| Food Preparation & Serving | 0 (0.0%) | 2 (100.0%) |
| Cleaning & Maintenance | 1 (100.0%) | 0 (0.0%) |
| Personal Care & Service | 0 (0.0%) | 0 (0.0%) |
| Total (Category) | 1 (33.3%) | 2 (66.7%) |
| Total (Overall) | 22 (66.7%) | 11 (33.3%) |
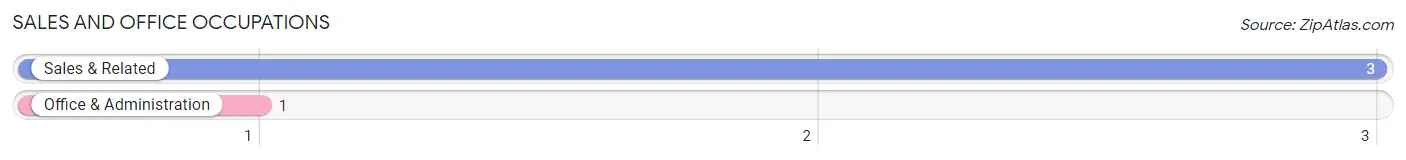
Sales and Office Occupations
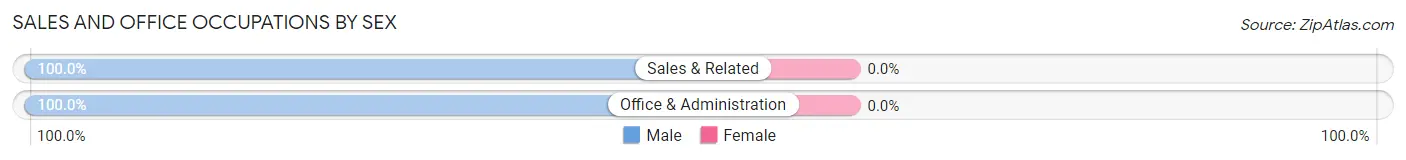
The most common Sales and Office occupations in Lake City are Sales & Related (3 | 9.1%), and Office & Administration (1 | 3.0%).
Sales and Office Occupations by Sex
| Occupation | Male | Female |
| Sales & Related | 3 (100.0%) | 0 (0.0%) |
| Office & Administration | 1 (100.0%) | 0 (0.0%) |
| Total (Category) | 4 (100.0%) | 0 (0.0%) |
| Total (Overall) | 22 (66.7%) | 11 (33.3%) |
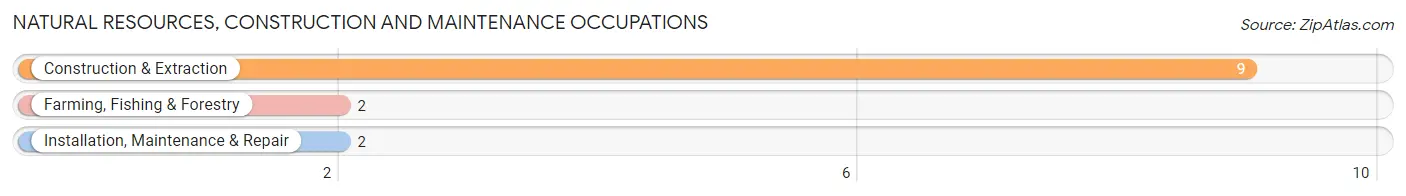
Natural Resources, Construction and Maintenance Occupations
The most common Natural Resources, Construction and Maintenance occupations in Lake City are Construction & Extraction (9 | 27.3%), Farming, Fishing & Forestry (2 | 6.1%), and Installation, Maintenance & Repair (2 | 6.1%).
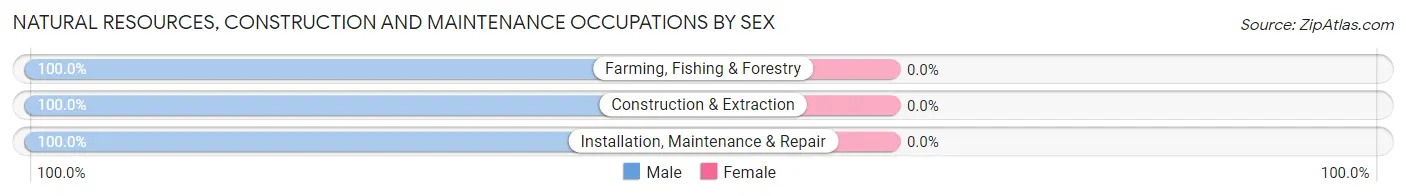
Natural Resources, Construction and Maintenance Occupations by Sex
| Occupation | Male | Female |
| Farming, Fishing & Forestry | 2 (100.0%) | 0 (0.0%) |
| Construction & Extraction | 9 (100.0%) | 0 (0.0%) |
| Installation, Maintenance & Repair | 2 (100.0%) | 0 (0.0%) |
| Total (Category) | 13 (100.0%) | 0 (0.0%) |
| Total (Overall) | 22 (66.7%) | 11 (33.3%) |
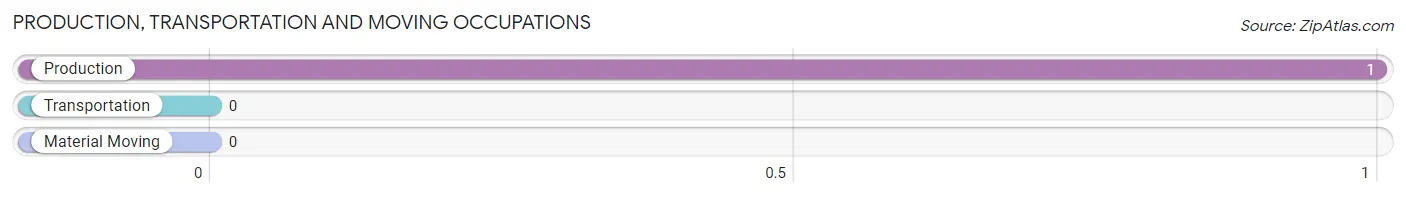
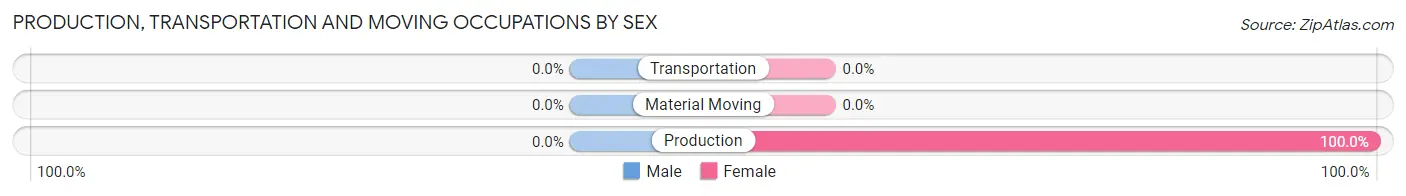
Production, Transportation and Moving Occupations
The most common Production, Transportation and Moving occupations in Lake City are , and Production (1 | 3.0%).
Production, Transportation and Moving Occupations by Sex
| Occupation | Male | Female |
| Production | 0 (0.0%) | 1 (100.0%) |
| Transportation | 0 (0.0%) | 0 (0.0%) |
| Material Moving | 0 (0.0%) | 0 (0.0%) |
| Total (Category) | 0 (0.0%) | 1 (100.0%) |
| Total (Overall) | 22 (66.7%) | 11 (33.3%) |
Employment Industries by Sex in Lake City
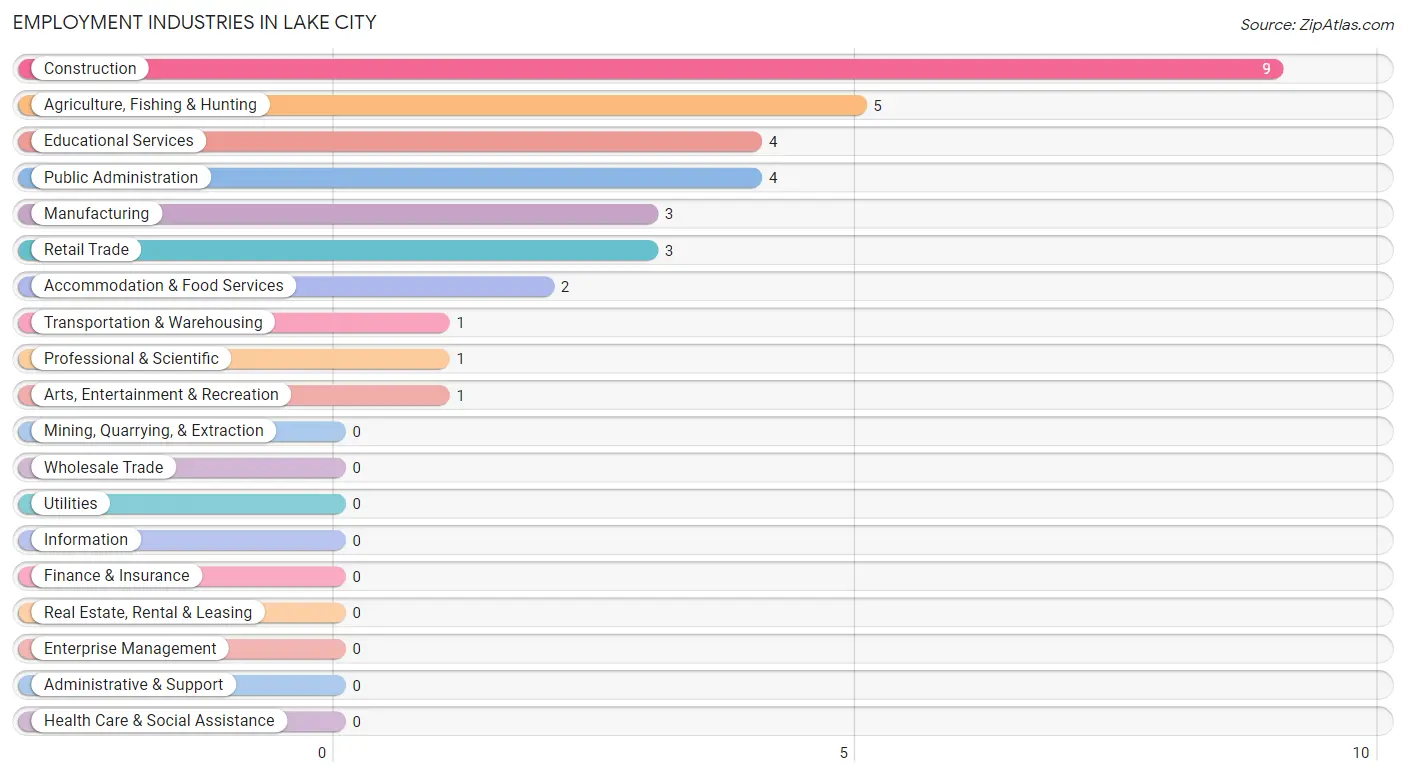
Employment Industries in Lake City
The major employment industries in Lake City include Construction (9 | 27.3%), Agriculture, Fishing & Hunting (5 | 15.1%), Educational Services (4 | 12.1%), Public Administration (4 | 12.1%), and Manufacturing (3 | 9.1%).
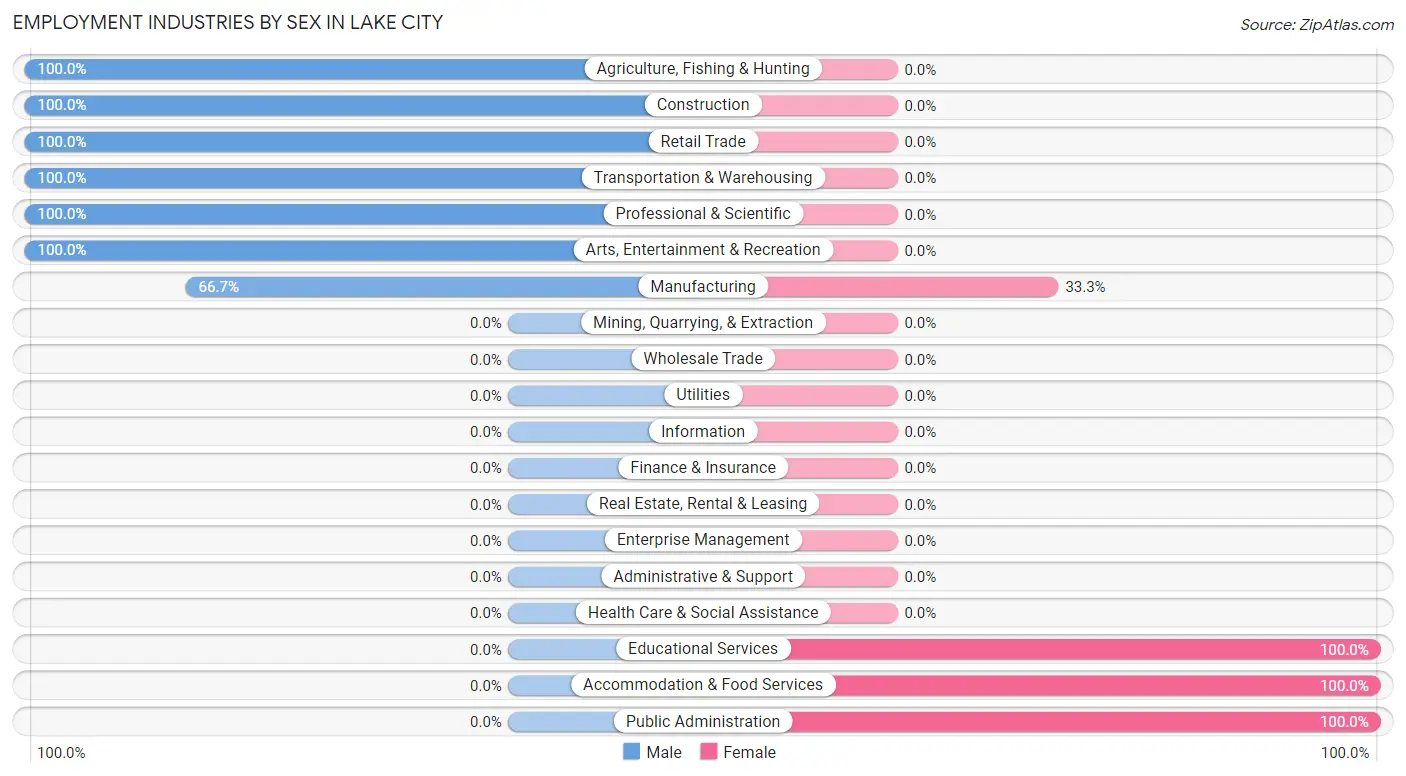
Employment Industries by Sex in Lake City
The Lake City industries that see more men than women are Agriculture, Fishing & Hunting (100.0%), Construction (100.0%), and Retail Trade (100.0%), whereas the industries that tend to have a higher number of women are Educational Services (100.0%), Accommodation & Food Services (100.0%), and Public Administration (100.0%).
| Industry | Male | Female |
| Agriculture, Fishing & Hunting | 5 (100.0%) | 0 (0.0%) |
| Mining, Quarrying, & Extraction | 0 (0.0%) | 0 (0.0%) |
| Construction | 9 (100.0%) | 0 (0.0%) |
| Manufacturing | 2 (66.7%) | 1 (33.3%) |
| Wholesale Trade | 0 (0.0%) | 0 (0.0%) |
| Retail Trade | 3 (100.0%) | 0 (0.0%) |
| Transportation & Warehousing | 1 (100.0%) | 0 (0.0%) |
| Utilities | 0 (0.0%) | 0 (0.0%) |
| Information | 0 (0.0%) | 0 (0.0%) |
| Finance & Insurance | 0 (0.0%) | 0 (0.0%) |
| Real Estate, Rental & Leasing | 0 (0.0%) | 0 (0.0%) |
| Professional & Scientific | 1 (100.0%) | 0 (0.0%) |
| Enterprise Management | 0 (0.0%) | 0 (0.0%) |
| Administrative & Support | 0 (0.0%) | 0 (0.0%) |
| Educational Services | 0 (0.0%) | 4 (100.0%) |
| Health Care & Social Assistance | 0 (0.0%) | 0 (0.0%) |
| Arts, Entertainment & Recreation | 1 (100.0%) | 0 (0.0%) |
| Accommodation & Food Services | 0 (0.0%) | 2 (100.0%) |
| Public Administration | 0 (0.0%) | 4 (100.0%) |
| Total | 22 (66.7%) | 11 (33.3%) |
Education in Lake City
School Enrollment in Lake City
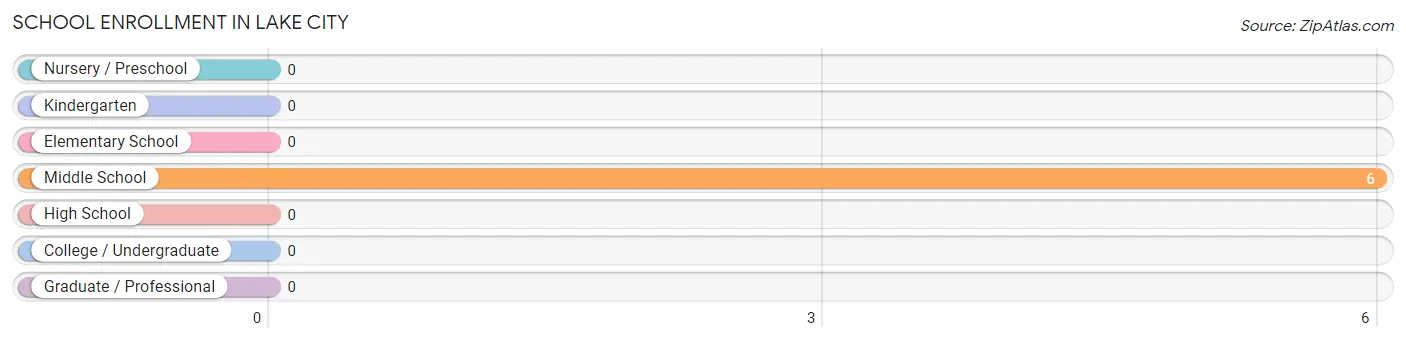
| School Level | # Students | % Students |
| Nursery / Preschool | 0 | 0.0% |
| Kindergarten | 0 | 0.0% |
| Elementary School | 0 | 0.0% |
| Middle School | 6 | 100.0% |
| High School | 0 | 0.0% |
| College / Undergraduate | 0 | 0.0% |
| Graduate / Professional | 0 | 0.0% |
| Total | 6 | 100.0% |
School Enrollment by Age by Funding Source in Lake City
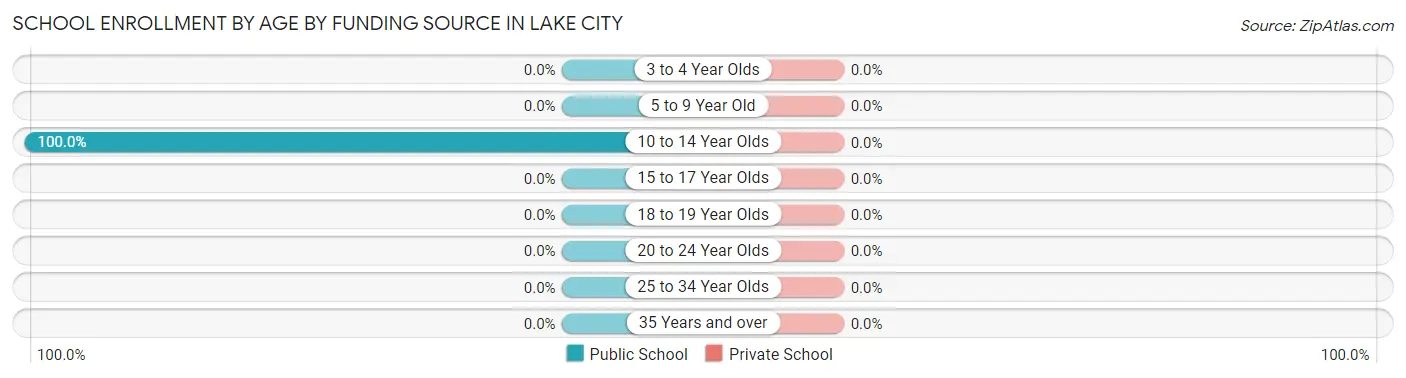
| Age Bracket | Public School | Private School |
| 3 to 4 Year Olds | 0 (0.0%) | 0 (0.0%) |
| 5 to 9 Year Old | 0 (0.0%) | 0 (0.0%) |
| 10 to 14 Year Olds | 6 (100.0%) | 0 (0.0%) |
| 15 to 17 Year Olds | 0 (0.0%) | 0 (0.0%) |
| 18 to 19 Year Olds | 0 (0.0%) | 0 (0.0%) |
| 20 to 24 Year Olds | 0 (0.0%) | 0 (0.0%) |
| 25 to 34 Year Olds | 0 (0.0%) | 0 (0.0%) |
| 35 Years and over | 0 (0.0%) | 0 (0.0%) |
| Total | 6 (100.0%) | 0 (0.0%) |
Educational Attainment by Field of Study in Lake City
Business (5 | 35.7%), education (4 | 28.6%), bio, nature & agricultural (3 | 21.4%), and science & technology (2 | 14.3%) are the most common fields of study among 14 individuals in Lake City who have obtained a bachelor's degree or higher.
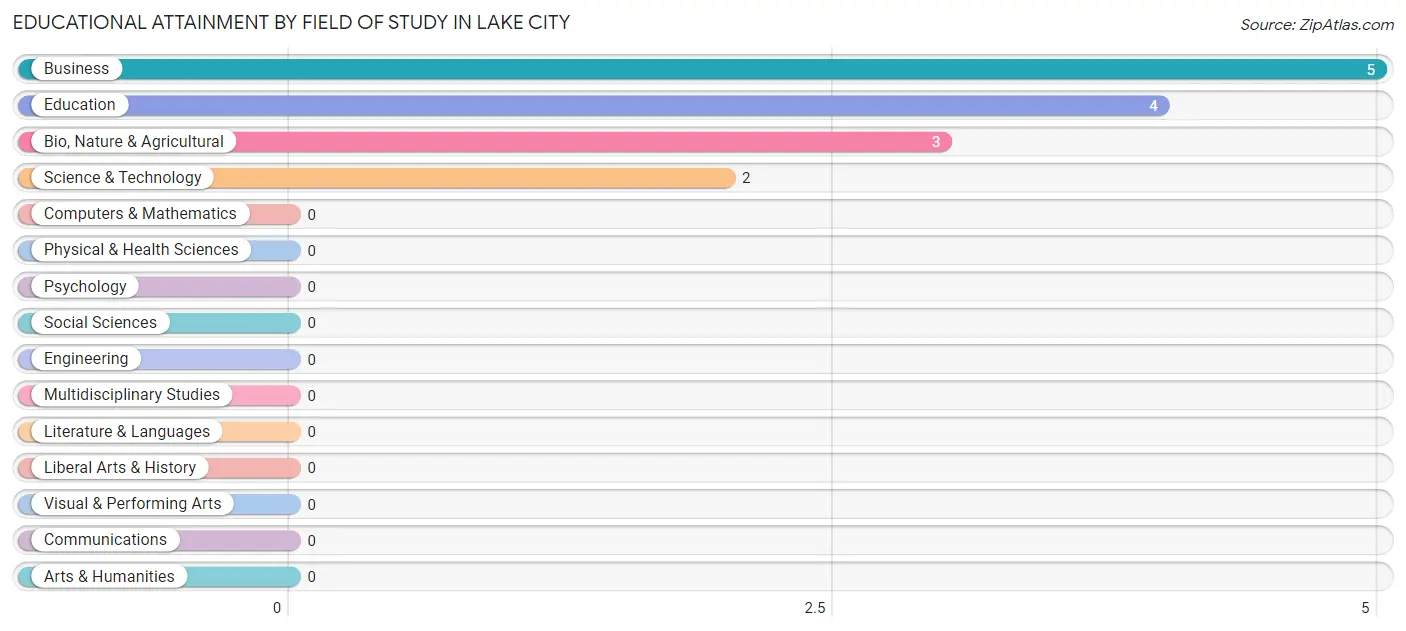
| Field of Study | # Graduates | % Graduates |
| Computers & Mathematics | 0 | 0.0% |
| Bio, Nature & Agricultural | 3 | 21.4% |
| Physical & Health Sciences | 0 | 0.0% |
| Psychology | 0 | 0.0% |
| Social Sciences | 0 | 0.0% |
| Engineering | 0 | 0.0% |
| Multidisciplinary Studies | 0 | 0.0% |
| Science & Technology | 2 | 14.3% |
| Business | 5 | 35.7% |
| Education | 4 | 28.6% |
| Literature & Languages | 0 | 0.0% |
| Liberal Arts & History | 0 | 0.0% |
| Visual & Performing Arts | 0 | 0.0% |
| Communications | 0 | 0.0% |
| Arts & Humanities | 0 | 0.0% |
| Total | 14 | 100.0% |
Transportation & Commute in Lake City
Vehicle Availability by Sex in Lake City
The most prevalent vehicle ownership categories in Lake City are males with 2 vehicles (12, accounting for 54.5%) and females with 2 vehicles (3, making up 109.1%).
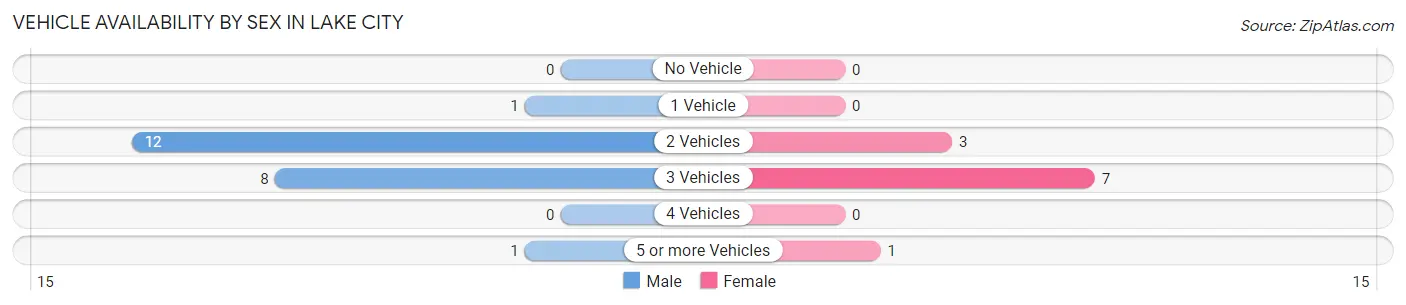
| Vehicles Available | Male | Female |
| No Vehicle | 0 (0.0%) | 0 (0.0%) |
| 1 Vehicle | 1 (4.5%) | 0 (0.0%) |
| 2 Vehicles | 12 (54.5%) | 3 (27.3%) |
| 3 Vehicles | 8 (36.4%) | 7 (63.6%) |
| 4 Vehicles | 0 (0.0%) | 0 (0.0%) |
| 5 or more Vehicles | 1 (4.5%) | 1 (9.1%) |
| Total | 22 (100.0%) | 11 (100.0%) |
Commute Time in Lake City
The most frequently occuring commute durations in Lake City are 5 to 9 minutes (16 commuters, 48.5%), 25 to 29 minutes (4 commuters, 12.1%), and less than 5 minutes (3 commuters, 9.1%).
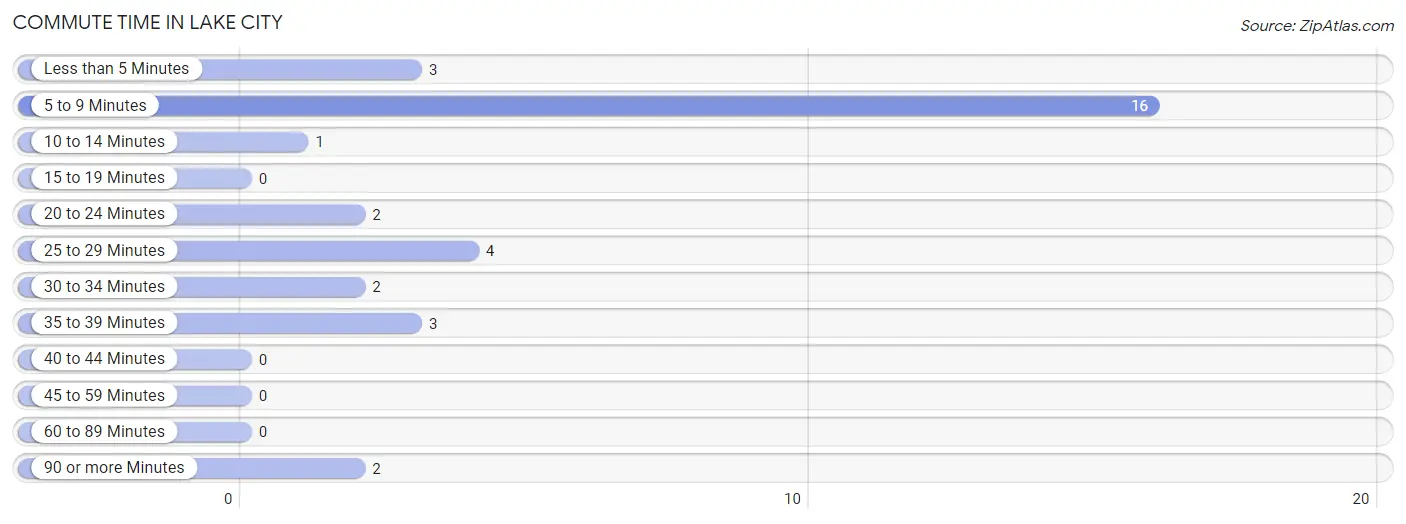
| Commute Time | # Commuters | % Commuters |
| Less than 5 Minutes | 3 | 9.1% |
| 5 to 9 Minutes | 16 | 48.5% |
| 10 to 14 Minutes | 1 | 3.0% |
| 15 to 19 Minutes | 0 | 0.0% |
| 20 to 24 Minutes | 2 | 6.1% |
| 25 to 29 Minutes | 4 | 12.1% |
| 30 to 34 Minutes | 2 | 6.1% |
| 35 to 39 Minutes | 3 | 9.1% |
| 40 to 44 Minutes | 0 | 0.0% |
| 45 to 59 Minutes | 0 | 0.0% |
| 60 to 89 Minutes | 0 | 0.0% |
| 90 or more Minutes | 2 | 6.1% |
Commute Time by Sex in Lake City
The most common commute times in Lake City are 5 to 9 minutes (14 commuters, 63.6%) for males and 25 to 29 minutes (4 commuters, 36.4%) for females.
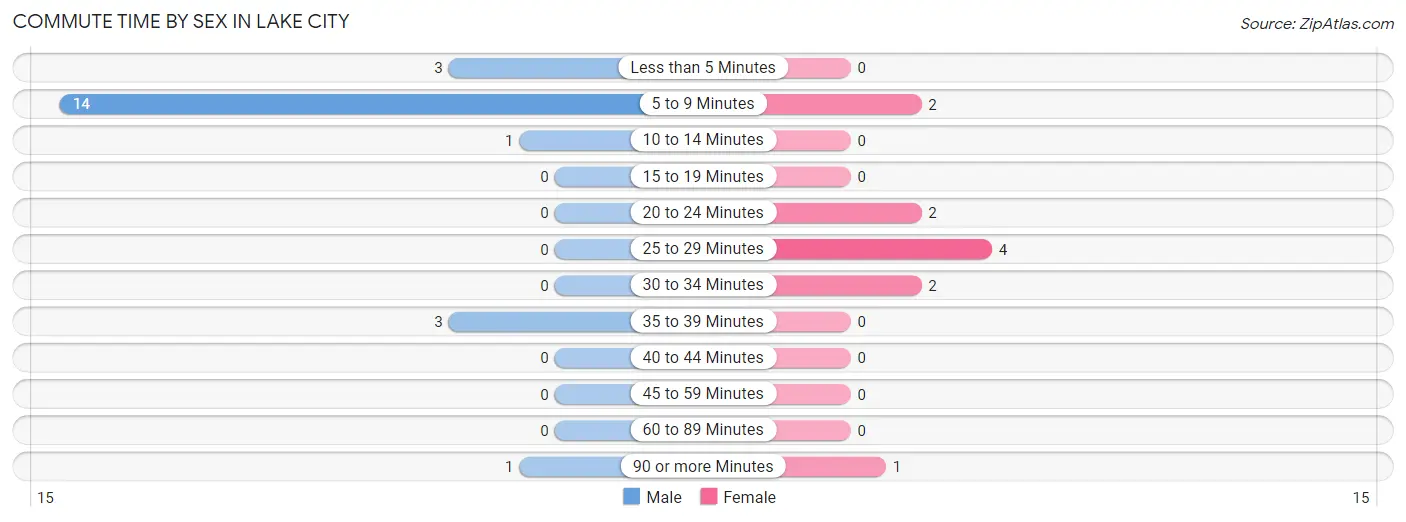
| Commute Time | Male | Female |
| Less than 5 Minutes | 3 (13.6%) | 0 (0.0%) |
| 5 to 9 Minutes | 14 (63.6%) | 2 (18.2%) |
| 10 to 14 Minutes | 1 (4.5%) | 0 (0.0%) |
| 15 to 19 Minutes | 0 (0.0%) | 0 (0.0%) |
| 20 to 24 Minutes | 0 (0.0%) | 2 (18.2%) |
| 25 to 29 Minutes | 0 (0.0%) | 4 (36.4%) |
| 30 to 34 Minutes | 0 (0.0%) | 2 (18.2%) |
| 35 to 39 Minutes | 3 (13.6%) | 0 (0.0%) |
| 40 to 44 Minutes | 0 (0.0%) | 0 (0.0%) |
| 45 to 59 Minutes | 0 (0.0%) | 0 (0.0%) |
| 60 to 89 Minutes | 0 (0.0%) | 0 (0.0%) |
| 90 or more Minutes | 1 (4.5%) | 1 (9.1%) |
Time of Departure to Work by Sex in Lake City
The most frequent times of departure to work in Lake City are 12:00 PM to 3:59 PM (9, 40.9%) for males and 7:00 AM to 7:29 AM (5, 45.5%) for females.
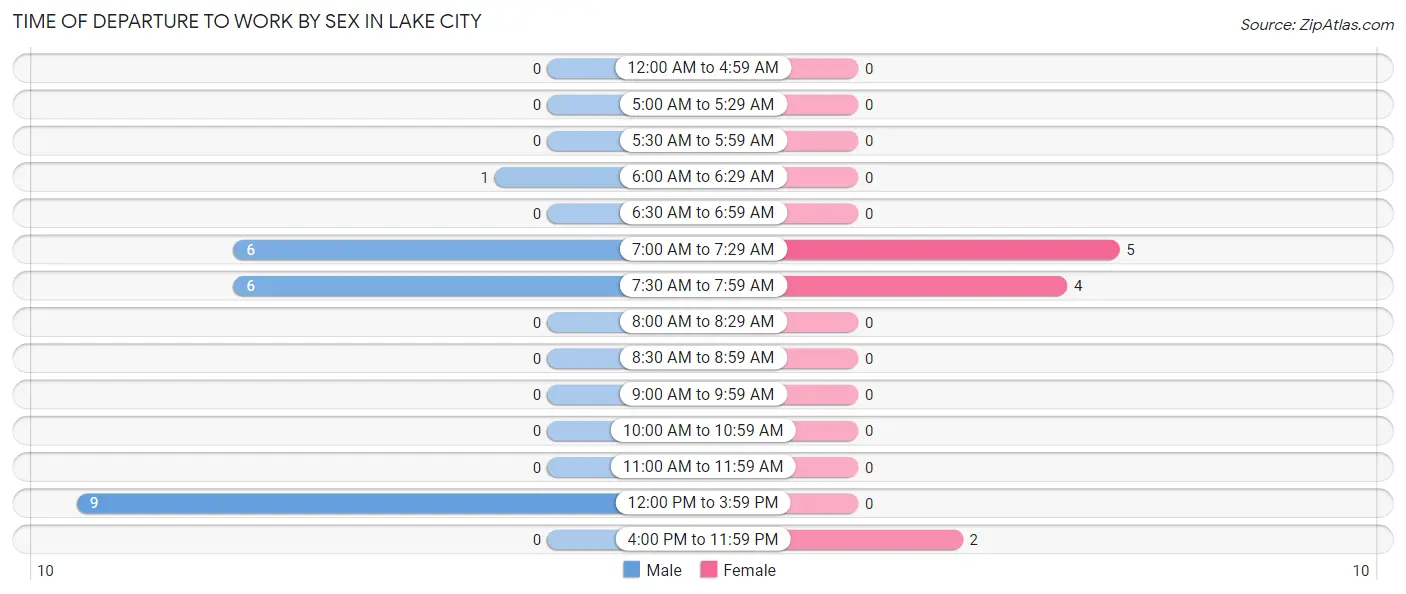
| Time of Departure | Male | Female |
| 12:00 AM to 4:59 AM | 0 (0.0%) | 0 (0.0%) |
| 5:00 AM to 5:29 AM | 0 (0.0%) | 0 (0.0%) |
| 5:30 AM to 5:59 AM | 0 (0.0%) | 0 (0.0%) |
| 6:00 AM to 6:29 AM | 1 (4.5%) | 0 (0.0%) |
| 6:30 AM to 6:59 AM | 0 (0.0%) | 0 (0.0%) |
| 7:00 AM to 7:29 AM | 6 (27.3%) | 5 (45.5%) |
| 7:30 AM to 7:59 AM | 6 (27.3%) | 4 (36.4%) |
| 8:00 AM to 8:29 AM | 0 (0.0%) | 0 (0.0%) |
| 8:30 AM to 8:59 AM | 0 (0.0%) | 0 (0.0%) |
| 9:00 AM to 9:59 AM | 0 (0.0%) | 0 (0.0%) |
| 10:00 AM to 10:59 AM | 0 (0.0%) | 0 (0.0%) |
| 11:00 AM to 11:59 AM | 0 (0.0%) | 0 (0.0%) |
| 12:00 PM to 3:59 PM | 9 (40.9%) | 0 (0.0%) |
| 4:00 PM to 11:59 PM | 0 (0.0%) | 2 (18.2%) |
| Total | 22 (100.0%) | 11 (100.0%) |
Housing Occupancy in Lake City
Occupancy by Ownership in Lake City
Of the total 20 dwellings in Lake City, owner-occupied units account for 18 (90.0%), while renter-occupied units make up 2 (10.0%).
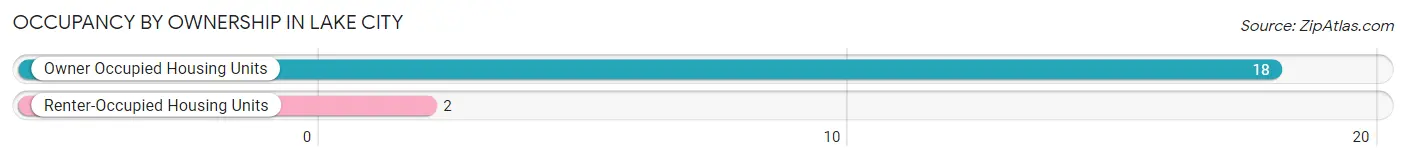
| Occupancy | # Housing Units | % Housing Units |
| Owner Occupied Housing Units | 18 | 90.0% |
| Renter-Occupied Housing Units | 2 | 10.0% |
| Total Occupied Housing Units | 20 | 100.0% |
Occupancy by Household Size in Lake City
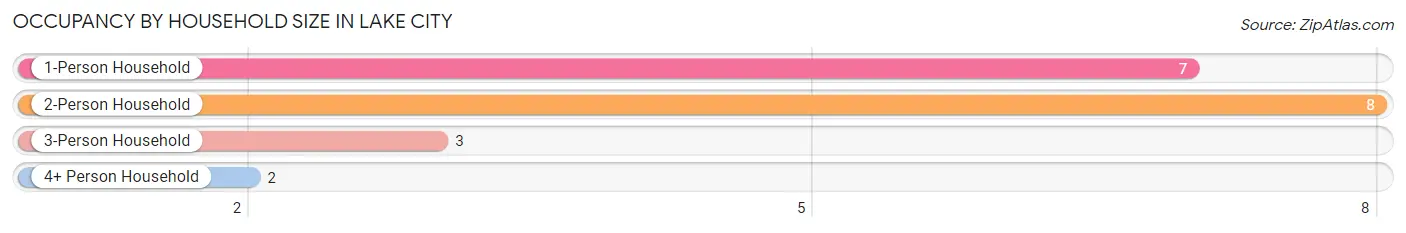
| Household Size | # Housing Units | % Housing Units |
| 1-Person Household | 7 | 35.0% |
| 2-Person Household | 8 | 40.0% |
| 3-Person Household | 3 | 15.0% |
| 4+ Person Household | 2 | 10.0% |
| Total Housing Units | 20 | 100.0% |
Occupancy by Ownership by Household Size in Lake City
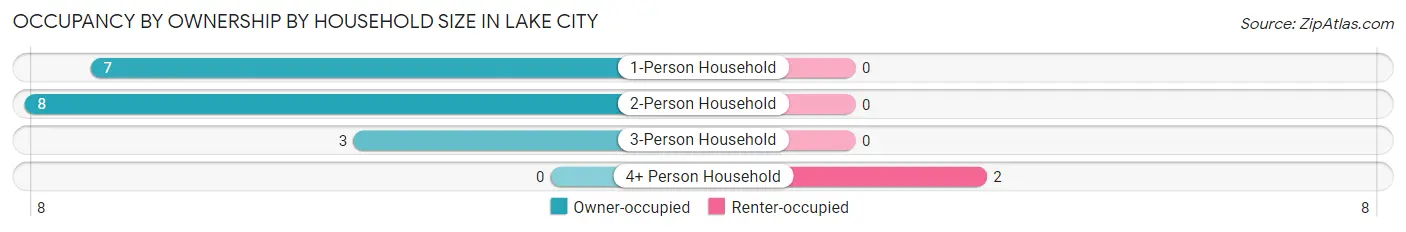
| Household Size | Owner-occupied | Renter-occupied |
| 1-Person Household | 7 (100.0%) | 0 (0.0%) |
| 2-Person Household | 8 (100.0%) | 0 (0.0%) |
| 3-Person Household | 3 (100.0%) | 0 (0.0%) |
| 4+ Person Household | 0 (0.0%) | 2 (100.0%) |
| Total Housing Units | 18 (90.0%) | 2 (10.0%) |
Occupancy by Educational Attainment in Lake City
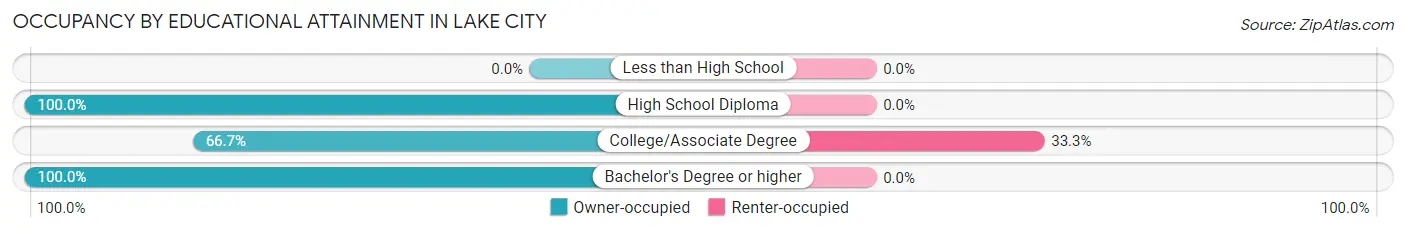
| Household Size | Owner-occupied | Renter-occupied |
| Less than High School | 0 (0.0%) | 0 (0.0%) |
| High School Diploma | 6 (100.0%) | 0 (0.0%) |
| College/Associate Degree | 4 (66.7%) | 2 (33.3%) |
| Bachelor's Degree or higher | 8 (100.0%) | 0 (0.0%) |
Occupancy by Age of Householder in Lake City
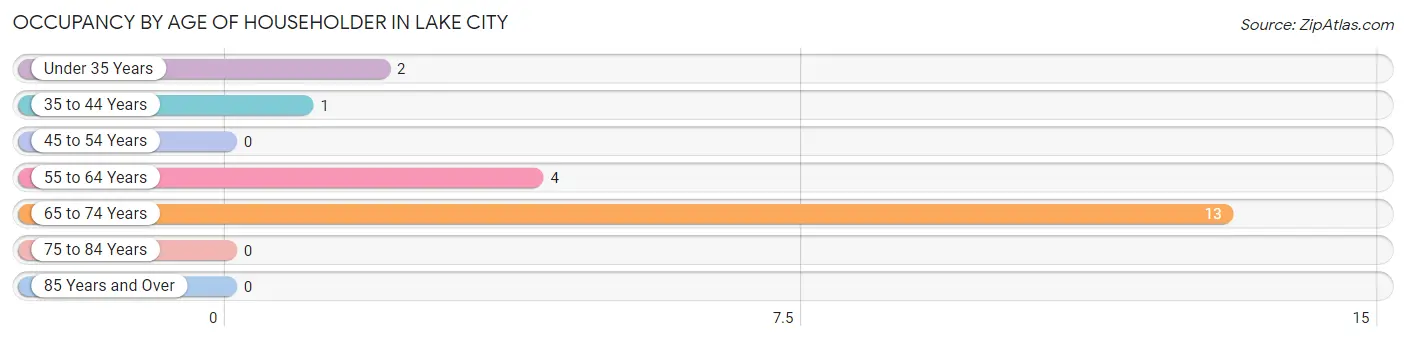
| Age Bracket | # Households | % Households |
| Under 35 Years | 2 | 10.0% |
| 35 to 44 Years | 1 | 5.0% |
| 45 to 54 Years | 0 | 0.0% |
| 55 to 64 Years | 4 | 20.0% |
| 65 to 74 Years | 13 | 65.0% |
| 75 to 84 Years | 0 | 0.0% |
| 85 Years and Over | 0 | 0.0% |
| Total | 20 | 100.0% |
Housing Finances in Lake City
Median Income by Occupancy in Lake City
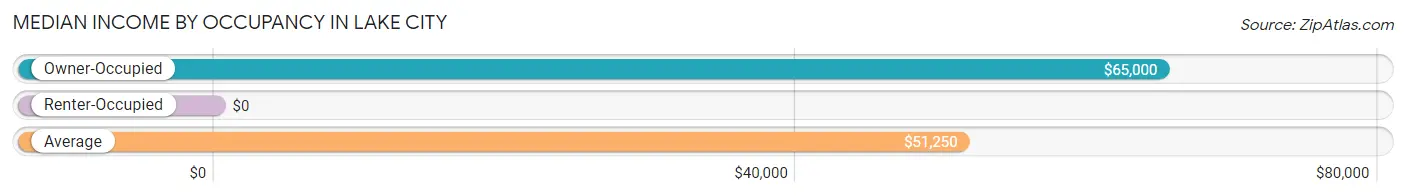
| Occupancy Type | # Households | Median Income |
| Owner-Occupied | 18 (90.0%) | $65,000 |
| Renter-Occupied | 2 (10.0%) | $0 |
| Average | 20 (100.0%) | $51,250 |
Occupancy by Householder Income Bracket in Lake City
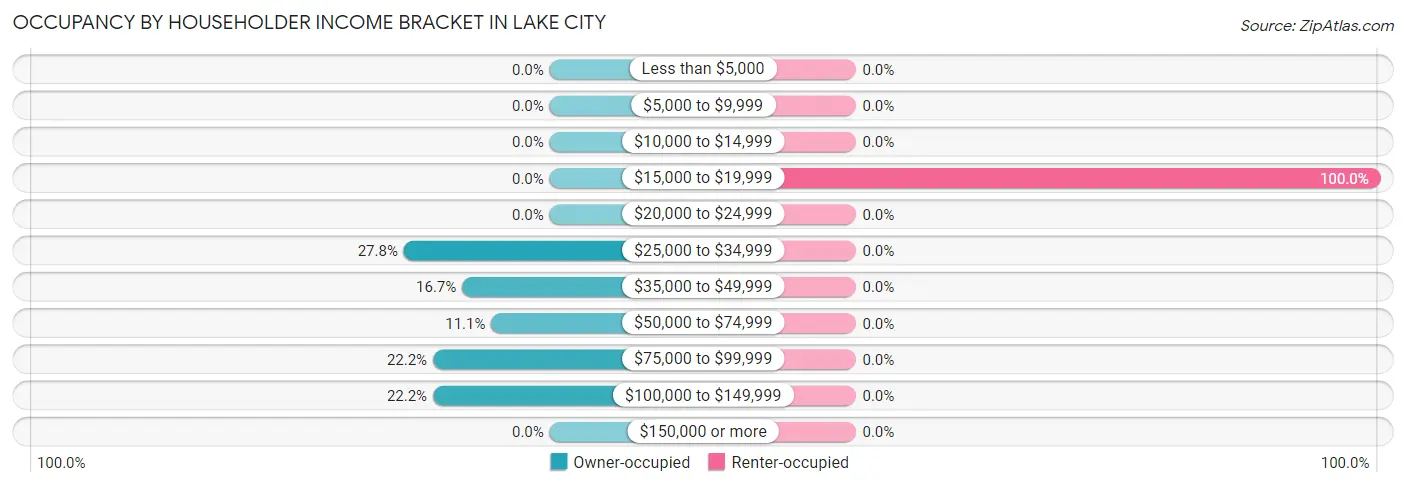
| Income Bracket | Owner-occupied | Renter-occupied |
| Less than $5,000 | 0 (0.0%) | 0 (0.0%) |
| $5,000 to $9,999 | 0 (0.0%) | 0 (0.0%) |
| $10,000 to $14,999 | 0 (0.0%) | 0 (0.0%) |
| $15,000 to $19,999 | 0 (0.0%) | 2 (100.0%) |
| $20,000 to $24,999 | 0 (0.0%) | 0 (0.0%) |
| $25,000 to $34,999 | 5 (27.8%) | 0 (0.0%) |
| $35,000 to $49,999 | 3 (16.7%) | 0 (0.0%) |
| $50,000 to $74,999 | 2 (11.1%) | 0 (0.0%) |
| $75,000 to $99,999 | 4 (22.2%) | 0 (0.0%) |
| $100,000 to $149,999 | 4 (22.2%) | 0 (0.0%) |
| $150,000 or more | 0 (0.0%) | 0 (0.0%) |
| Total | 18 (100.0%) | 2 (100.0%) |
Monthly Housing Cost Tiers in Lake City
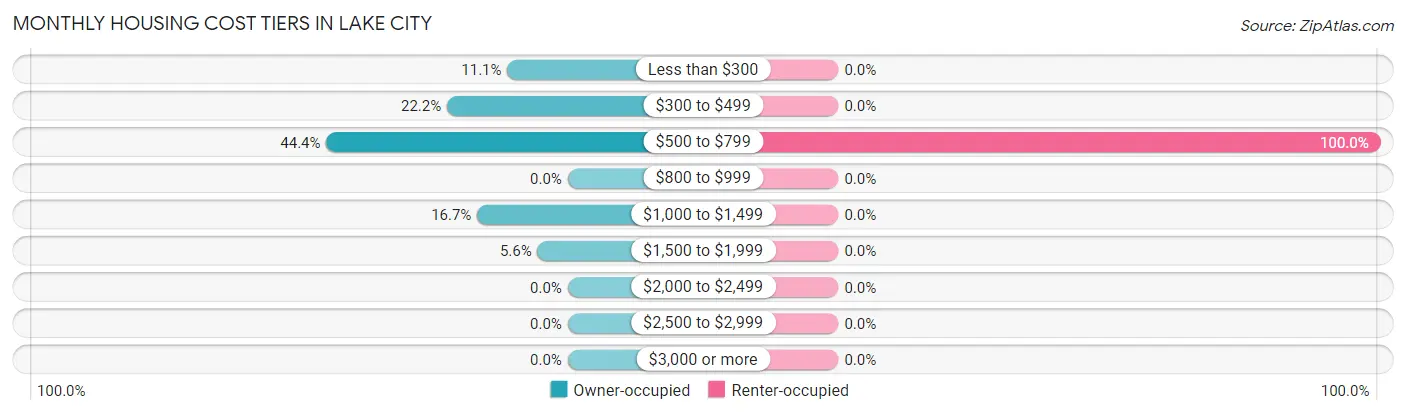
| Monthly Cost | Owner-occupied | Renter-occupied |
| Less than $300 | 2 (11.1%) | 0 (0.0%) |
| $300 to $499 | 4 (22.2%) | 0 (0.0%) |
| $500 to $799 | 8 (44.4%) | 2 (100.0%) |
| $800 to $999 | 0 (0.0%) | 0 (0.0%) |
| $1,000 to $1,499 | 3 (16.7%) | 0 (0.0%) |
| $1,500 to $1,999 | 1 (5.6%) | 0 (0.0%) |
| $2,000 to $2,499 | 0 (0.0%) | 0 (0.0%) |
| $2,500 to $2,999 | 0 (0.0%) | 0 (0.0%) |
| $3,000 or more | 0 (0.0%) | 0 (0.0%) |
| Total | 18 (100.0%) | 2 (100.0%) |
Physical Housing Characteristics in Lake City
Housing Structures in Lake City
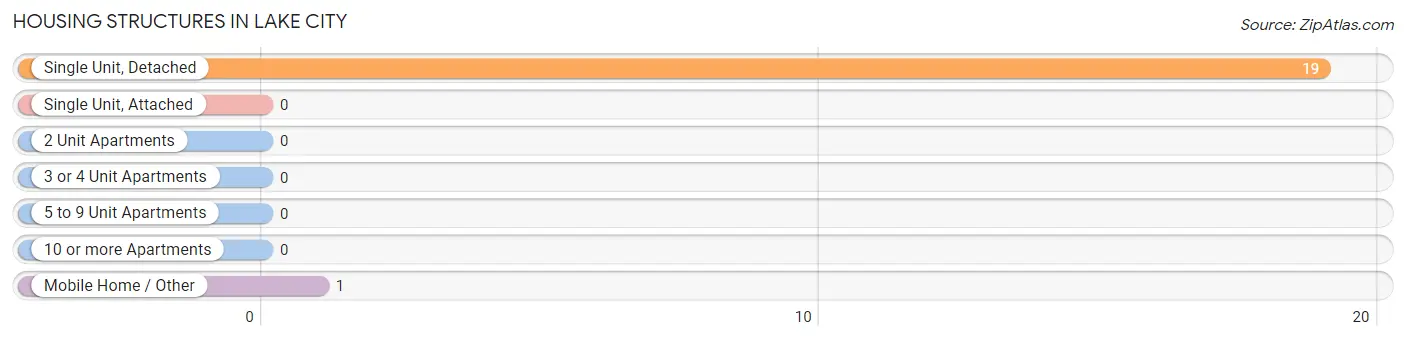
| Structure Type | # Housing Units | % Housing Units |
| Single Unit, Detached | 19 | 95.0% |
| Single Unit, Attached | 0 | 0.0% |
| 2 Unit Apartments | 0 | 0.0% |
| 3 or 4 Unit Apartments | 0 | 0.0% |
| 5 to 9 Unit Apartments | 0 | 0.0% |
| 10 or more Apartments | 0 | 0.0% |
| Mobile Home / Other | 1 | 5.0% |
| Total | 20 | 100.0% |
Housing Structures by Occupancy in Lake City
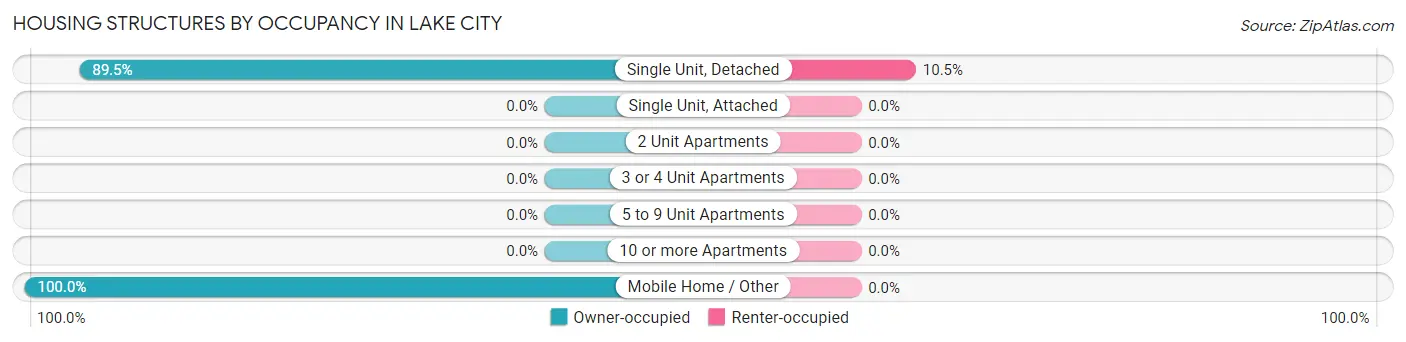
| Structure Type | Owner-occupied | Renter-occupied |
| Single Unit, Detached | 17 (89.5%) | 2 (10.5%) |
| Single Unit, Attached | 0 (0.0%) | 0 (0.0%) |
| 2 Unit Apartments | 0 (0.0%) | 0 (0.0%) |
| 3 or 4 Unit Apartments | 0 (0.0%) | 0 (0.0%) |
| 5 to 9 Unit Apartments | 0 (0.0%) | 0 (0.0%) |
| 10 or more Apartments | 0 (0.0%) | 0 (0.0%) |
| Mobile Home / Other | 1 (100.0%) | 0 (0.0%) |
| Total | 18 (90.0%) | 2 (10.0%) |
Housing Structures by Number of Rooms in Lake City
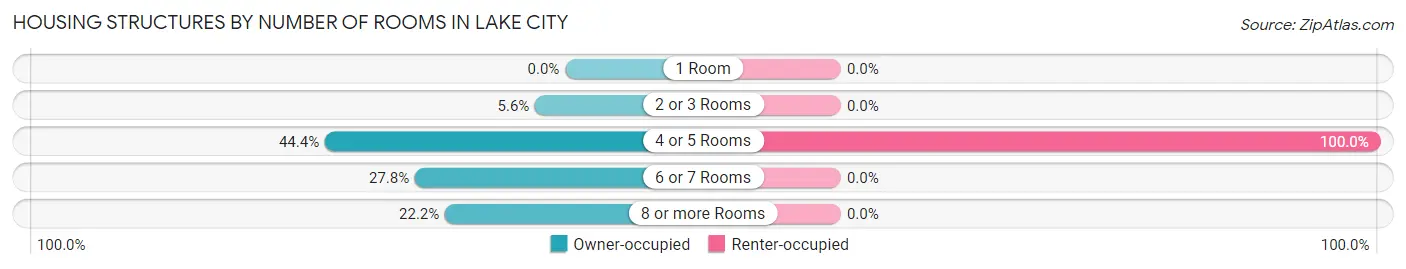
| Number of Rooms | Owner-occupied | Renter-occupied |
| 1 Room | 0 (0.0%) | 0 (0.0%) |
| 2 or 3 Rooms | 1 (5.6%) | 0 (0.0%) |
| 4 or 5 Rooms | 8 (44.4%) | 2 (100.0%) |
| 6 or 7 Rooms | 5 (27.8%) | 0 (0.0%) |
| 8 or more Rooms | 4 (22.2%) | 0 (0.0%) |
| Total | 18 (100.0%) | 2 (100.0%) |
Housing Structure by Heating Type in Lake City
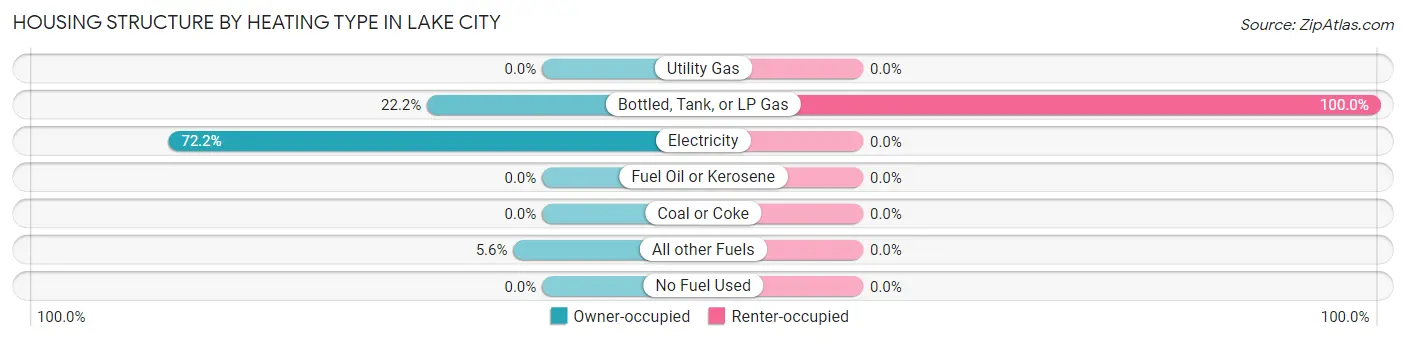
| Heating Type | Owner-occupied | Renter-occupied |
| Utility Gas | 0 (0.0%) | 0 (0.0%) |
| Bottled, Tank, or LP Gas | 4 (22.2%) | 2 (100.0%) |
| Electricity | 13 (72.2%) | 0 (0.0%) |
| Fuel Oil or Kerosene | 0 (0.0%) | 0 (0.0%) |
| Coal or Coke | 0 (0.0%) | 0 (0.0%) |
| All other Fuels | 1 (5.6%) | 0 (0.0%) |
| No Fuel Used | 0 (0.0%) | 0 (0.0%) |
| Total | 18 (100.0%) | 2 (100.0%) |
Household Vehicle Usage in Lake City
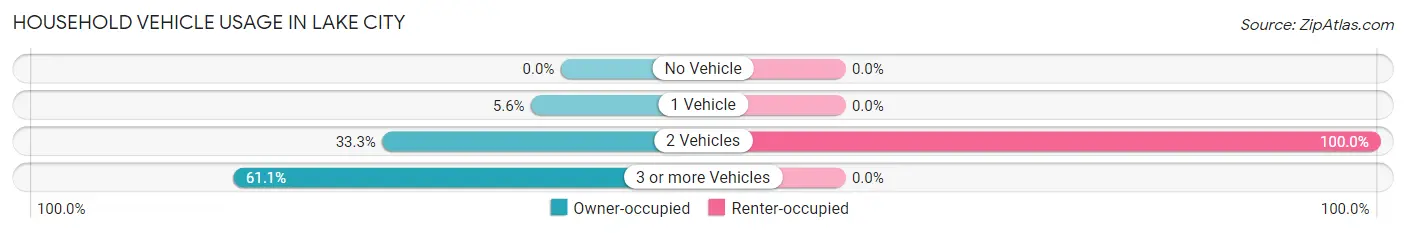
| Vehicles per Household | Owner-occupied | Renter-occupied |
| No Vehicle | 0 (0.0%) | 0 (0.0%) |
| 1 Vehicle | 1 (5.6%) | 0 (0.0%) |
| 2 Vehicles | 6 (33.3%) | 2 (100.0%) |
| 3 or more Vehicles | 11 (61.1%) | 0 (0.0%) |
| Total | 18 (100.0%) | 2 (100.0%) |
Real Estate & Mortgages in Lake City
Real Estate and Mortgage Overview in Lake City
| Characteristic | Without Mortgage | With Mortgage |
| Housing Units | 11 | 7 |
| Median Property Value | - | - |
| Median Household Income | - | - |
| Monthly Housing Costs | $475 | $0 |
| Real Estate Taxes | $950 | $0 |
Property Value by Mortgage Status in Lake City
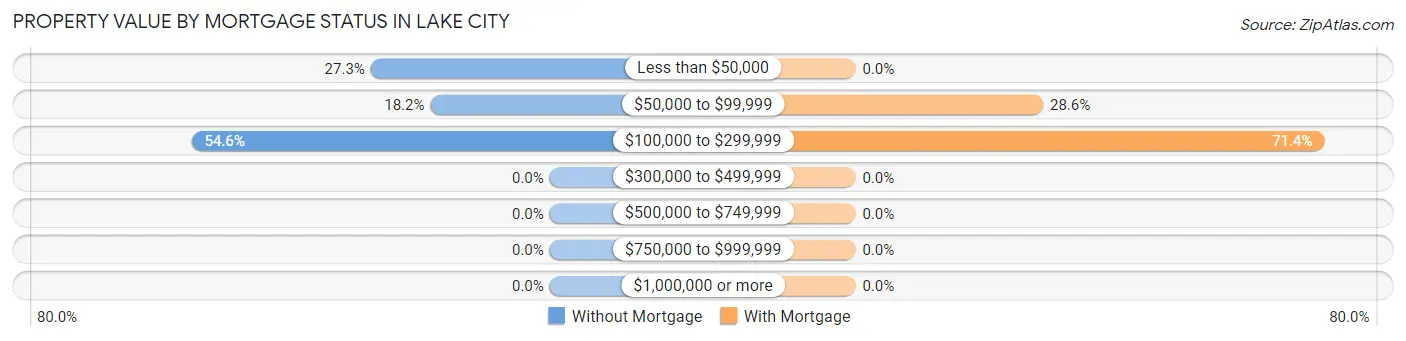
| Property Value | Without Mortgage | With Mortgage |
| Less than $50,000 | 3 (27.3%) | 0 (0.0%) |
| $50,000 to $99,999 | 2 (18.2%) | 2 (28.6%) |
| $100,000 to $299,999 | 6 (54.5%) | 5 (71.4%) |
| $300,000 to $499,999 | 0 (0.0%) | 0 (0.0%) |
| $500,000 to $749,999 | 0 (0.0%) | 0 (0.0%) |
| $750,000 to $999,999 | 0 (0.0%) | 0 (0.0%) |
| $1,000,000 or more | 0 (0.0%) | 0 (0.0%) |
| Total | 11 (100.0%) | 7 (100.0%) |
Household Income by Mortgage Status in Lake City
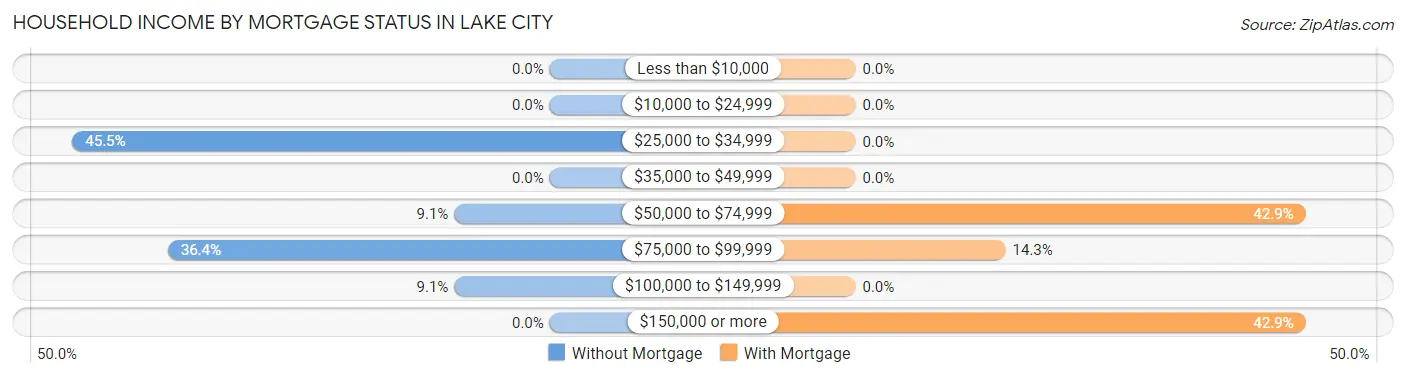
| Household Income | Without Mortgage | With Mortgage |
| Less than $10,000 | 0 (0.0%) | 0 (0.0%) |
| $10,000 to $24,999 | 0 (0.0%) | 0 (0.0%) |
| $25,000 to $34,999 | 5 (45.5%) | 0 (0.0%) |
| $35,000 to $49,999 | 0 (0.0%) | 0 (0.0%) |
| $50,000 to $74,999 | 1 (9.1%) | 3 (42.9%) |
| $75,000 to $99,999 | 4 (36.4%) | 1 (14.3%) |
| $100,000 to $149,999 | 1 (9.1%) | 0 (0.0%) |
| $150,000 or more | 0 (0.0%) | 3 (42.9%) |
| Total | 11 (100.0%) | 7 (100.0%) |
Property Value to Household Income Ratio in Lake City
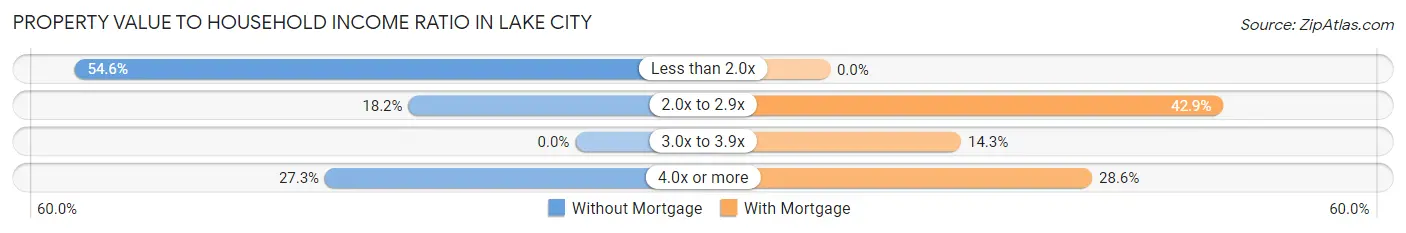
| Value-to-Income Ratio | Without Mortgage | With Mortgage |
| Less than 2.0x | 6 (54.5%) | 0 (0.0%) |
| 2.0x to 2.9x | 2 (18.2%) | 3 (42.9%) |
| 3.0x to 3.9x | 0 (0.0%) | 1 (14.3%) |
| 4.0x or more | 3 (27.3%) | 2 (28.6%) |
| Total | 11 (100.0%) | 7 (100.0%) |
Real Estate Taxes by Mortgage Status in Lake City
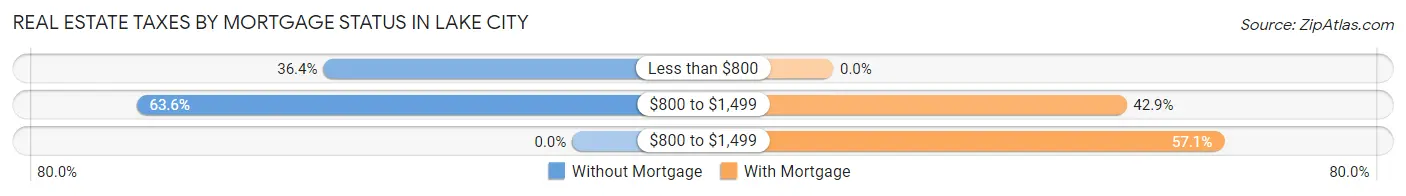
| Property Taxes | Without Mortgage | With Mortgage |
| Less than $800 | 4 (36.4%) | 0 (0.0%) |
| $800 to $1,499 | 7 (63.6%) | 3 (42.9%) |
| $800 to $1,499 | 0 (0.0%) | 4 (57.1%) |
| Total | 11 (100.0%) | 7 (100.0%) |
Health & Disability in Lake City
Health Insurance Coverage by Age in Lake City
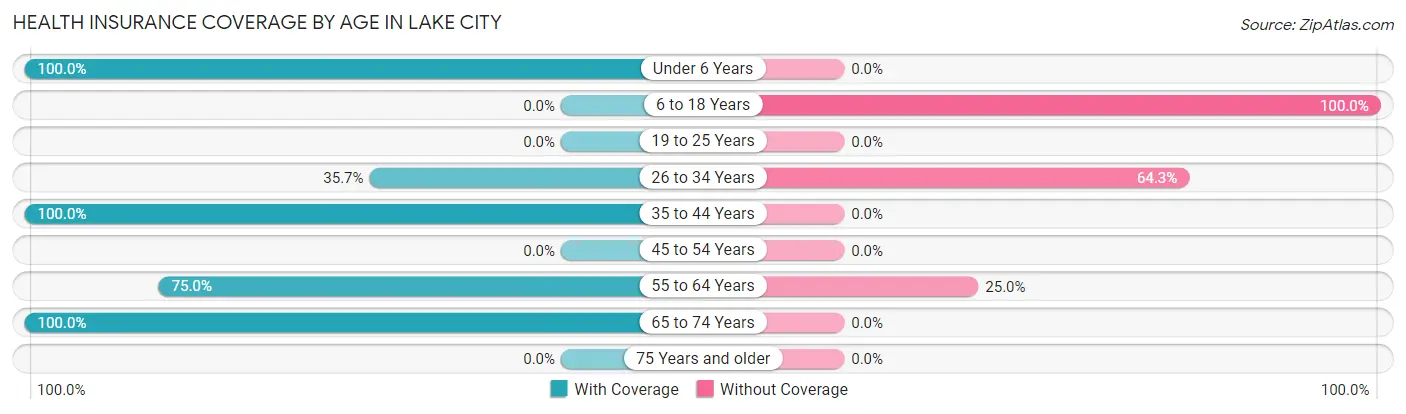
| Age Bracket | With Coverage | Without Coverage |
| Under 6 Years | 4 (100.0%) | 0 (0.0%) |
| 6 to 18 Years | 0 (0.0%) | 6 (100.0%) |
| 19 to 25 Years | 0 (0.0%) | 0 (0.0%) |
| 26 to 34 Years | 5 (35.7%) | 9 (64.3%) |
| 35 to 44 Years | 1 (100.0%) | 0 (0.0%) |
| 45 to 54 Years | 0 (0.0%) | 0 (0.0%) |
| 55 to 64 Years | 6 (75.0%) | 2 (25.0%) |
| 65 to 74 Years | 20 (100.0%) | 0 (0.0%) |
| 75 Years and older | 0 (0.0%) | 0 (0.0%) |
| Total | 36 (67.9%) | 17 (32.1%) |
Health Insurance Coverage by Citizenship Status in Lake City
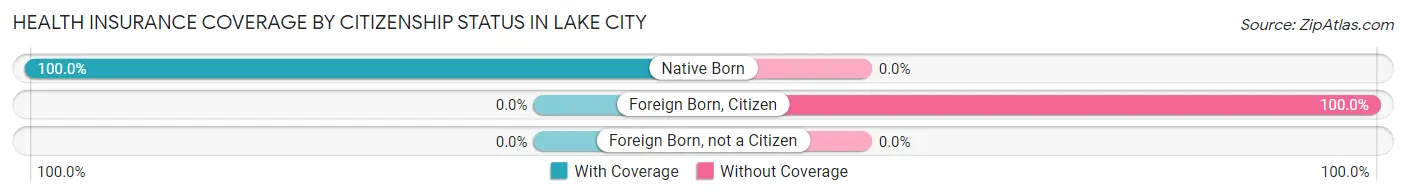
| Citizenship Status | With Coverage | Without Coverage |
| Native Born | 4 (100.0%) | 0 (0.0%) |
| Foreign Born, Citizen | 0 (0.0%) | 6 (100.0%) |
| Foreign Born, not a Citizen | 0 (0.0%) | 0 (0.0%) |
Health Insurance Coverage by Household Income in Lake City
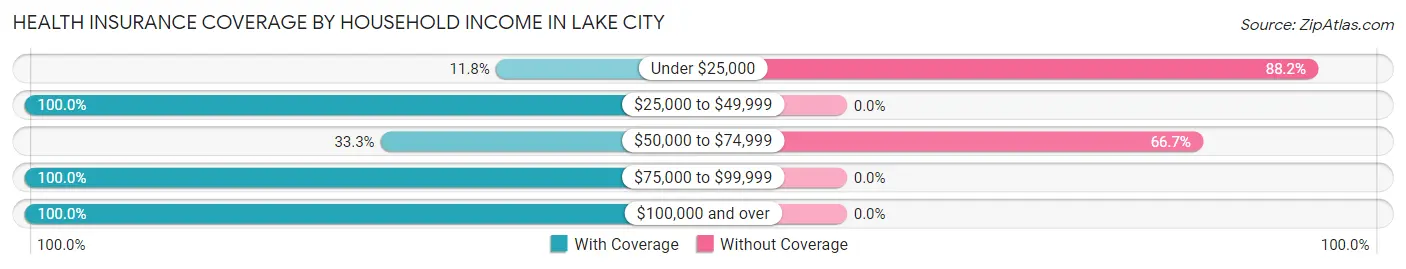
| Household Income | With Coverage | Without Coverage |
| Under $25,000 | 2 (11.8%) | 15 (88.2%) |
| $25,000 to $49,999 | 11 (100.0%) | 0 (0.0%) |
| $50,000 to $74,999 | 1 (33.3%) | 2 (66.7%) |
| $75,000 to $99,999 | 9 (100.0%) | 0 (0.0%) |
| $100,000 and over | 13 (100.0%) | 0 (0.0%) |
Public vs Private Health Insurance Coverage by Age in Lake City
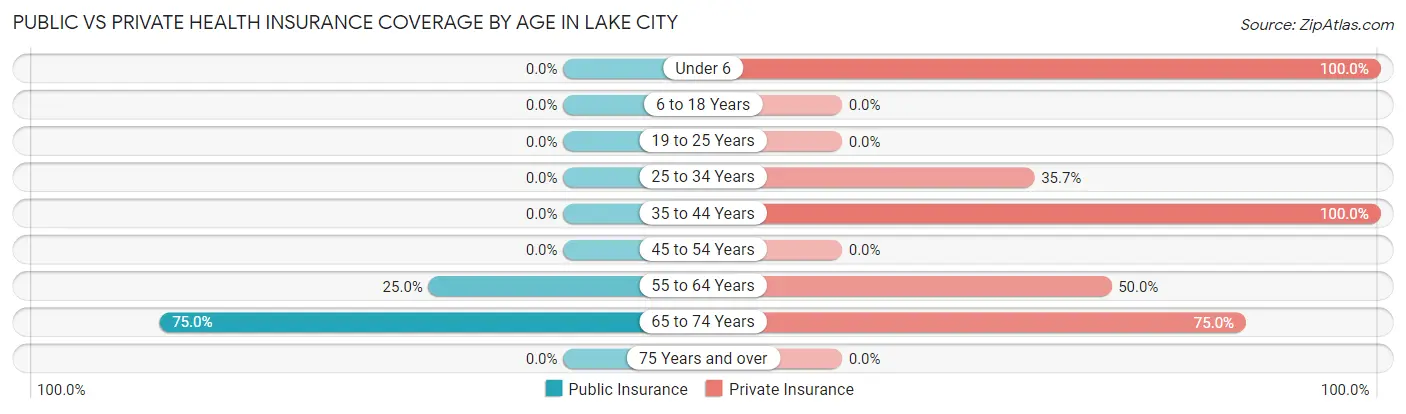
| Age Bracket | Public Insurance | Private Insurance |
| Under 6 | 0 (0.0%) | 4 (100.0%) |
| 6 to 18 Years | 0 (0.0%) | 0 (0.0%) |
| 19 to 25 Years | 0 (0.0%) | 0 (0.0%) |
| 25 to 34 Years | 0 (0.0%) | 5 (35.7%) |
| 35 to 44 Years | 0 (0.0%) | 1 (100.0%) |
| 45 to 54 Years | 0 (0.0%) | 0 (0.0%) |
| 55 to 64 Years | 2 (25.0%) | 4 (50.0%) |
| 65 to 74 Years | 15 (75.0%) | 15 (75.0%) |
| 75 Years and over | 0 (0.0%) | 0 (0.0%) |
| Total | 17 (32.1%) | 29 (54.7%) |
Disability Status by Sex by Age in Lake City
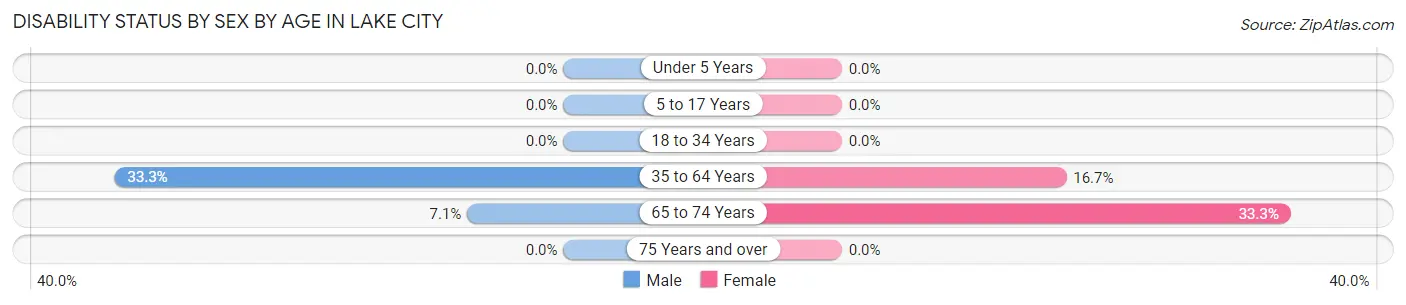
| Age Bracket | Male | Female |
| Under 5 Years | 0 (0.0%) | 0 (0.0%) |
| 5 to 17 Years | 0 (0.0%) | 0 (0.0%) |
| 18 to 34 Years | 0 (0.0%) | 0 (0.0%) |
| 35 to 64 Years | 1 (33.3%) | 1 (16.7%) |
| 65 to 74 Years | 1 (7.1%) | 2 (33.3%) |
| 75 Years and over | 0 (0.0%) | 0 (0.0%) |
Disability Class by Sex by Age in Lake City
Disability Class: Hearing Difficulty
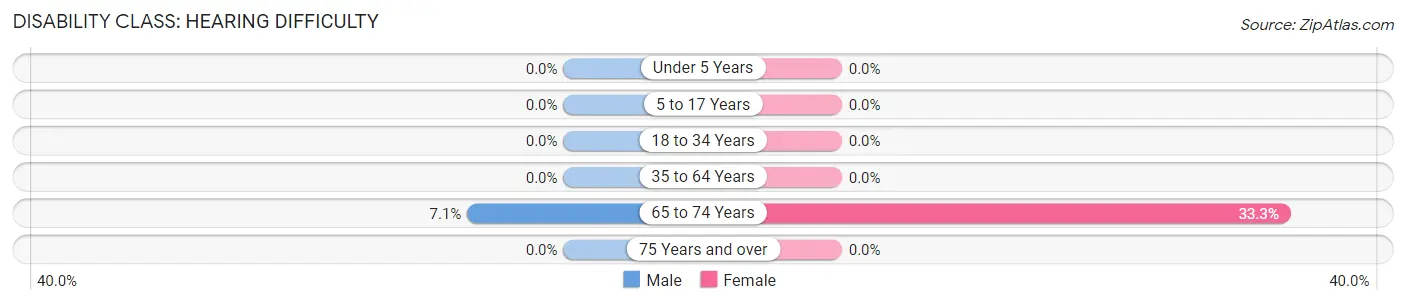
| Age Bracket | Male | Female |
| Under 5 Years | 0 (0.0%) | 0 (0.0%) |
| 5 to 17 Years | 0 (0.0%) | 0 (0.0%) |
| 18 to 34 Years | 0 (0.0%) | 0 (0.0%) |
| 35 to 64 Years | 0 (0.0%) | 0 (0.0%) |
| 65 to 74 Years | 1 (7.1%) | 2 (33.3%) |
| 75 Years and over | 0 (0.0%) | 0 (0.0%) |
Disability Class: Vision Difficulty
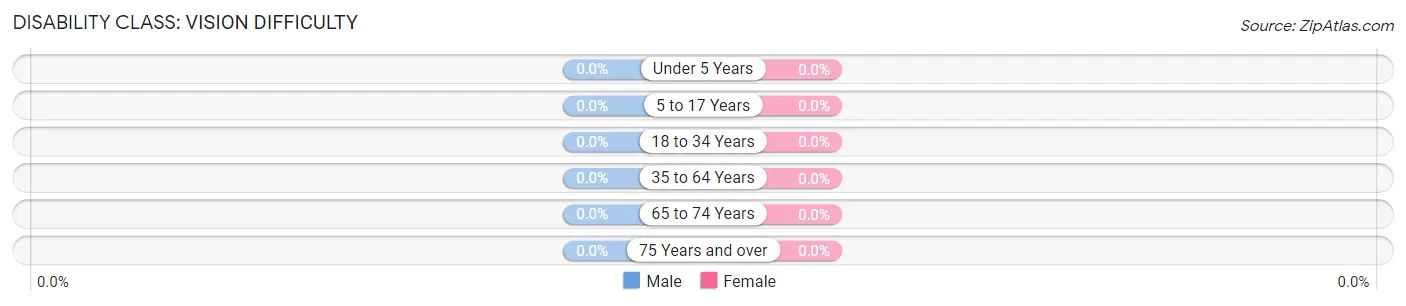
| Age Bracket | Male | Female |
| Under 5 Years | 0 (0.0%) | 0 (0.0%) |
| 5 to 17 Years | 0 (0.0%) | 0 (0.0%) |
| 18 to 34 Years | 0 (0.0%) | 0 (0.0%) |
| 35 to 64 Years | 0 (0.0%) | 0 (0.0%) |
| 65 to 74 Years | 0 (0.0%) | 0 (0.0%) |
| 75 Years and over | 0 (0.0%) | 0 (0.0%) |
Disability Class: Cognitive Difficulty
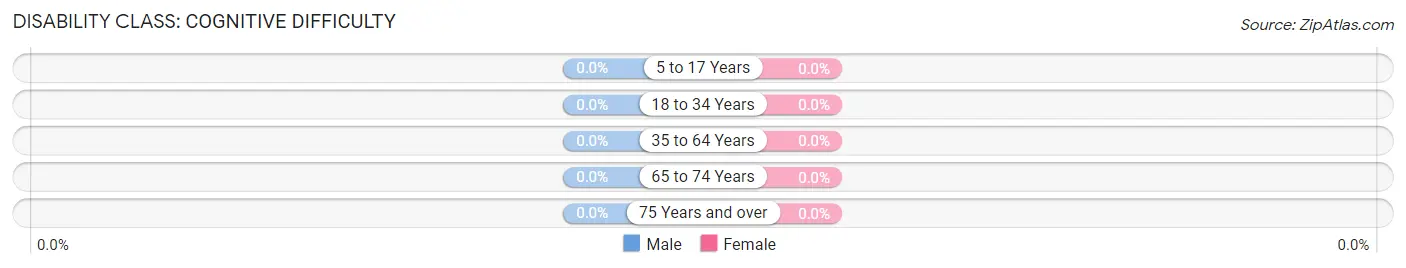
| Age Bracket | Male | Female |
| 5 to 17 Years | 0 (0.0%) | 0 (0.0%) |
| 18 to 34 Years | 0 (0.0%) | 0 (0.0%) |
| 35 to 64 Years | 0 (0.0%) | 0 (0.0%) |
| 65 to 74 Years | 0 (0.0%) | 0 (0.0%) |
| 75 Years and over | 0 (0.0%) | 0 (0.0%) |
Disability Class: Ambulatory Difficulty
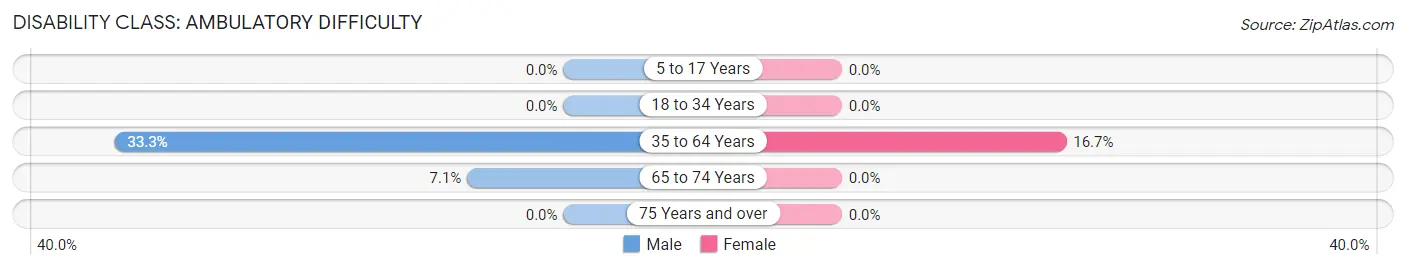
| Age Bracket | Male | Female |
| 5 to 17 Years | 0 (0.0%) | 0 (0.0%) |
| 18 to 34 Years | 0 (0.0%) | 0 (0.0%) |
| 35 to 64 Years | 1 (33.3%) | 1 (16.7%) |
| 65 to 74 Years | 1 (7.1%) | 0 (0.0%) |
| 75 Years and over | 0 (0.0%) | 0 (0.0%) |
Disability Class: Self-Care Difficulty
| Age Bracket | Male | Female |
| 5 to 17 Years | 0 (0.0%) | 0 (0.0%) |
| 18 to 34 Years | 0 (0.0%) | 0 (0.0%) |
| 35 to 64 Years | 0 (0.0%) | 0 (0.0%) |
| 65 to 74 Years | 0 (0.0%) | 0 (0.0%) |
| 75 Years and over | 0 (0.0%) | 0 (0.0%) |
Technology Access in Lake City
Computing Device Access in Lake City
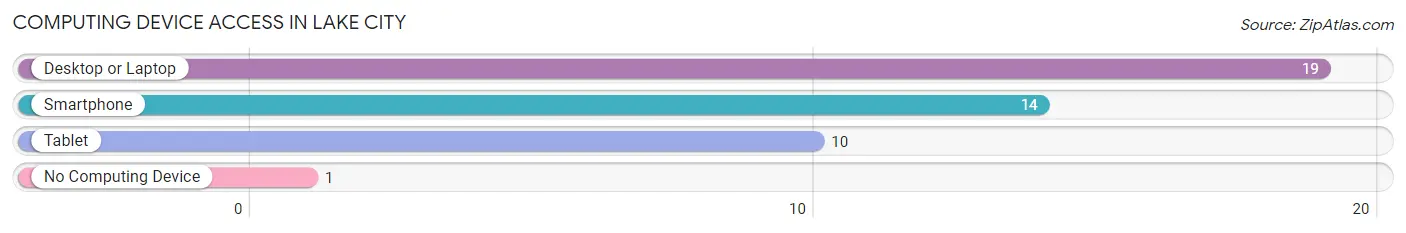
| Device Type | # Households | % Households |
| Desktop or Laptop | 19 | 95.0% |
| Smartphone | 14 | 70.0% |
| Tablet | 10 | 50.0% |
| No Computing Device | 1 | 5.0% |
| Total | 20 | 100.0% |
Internet Access in Lake City
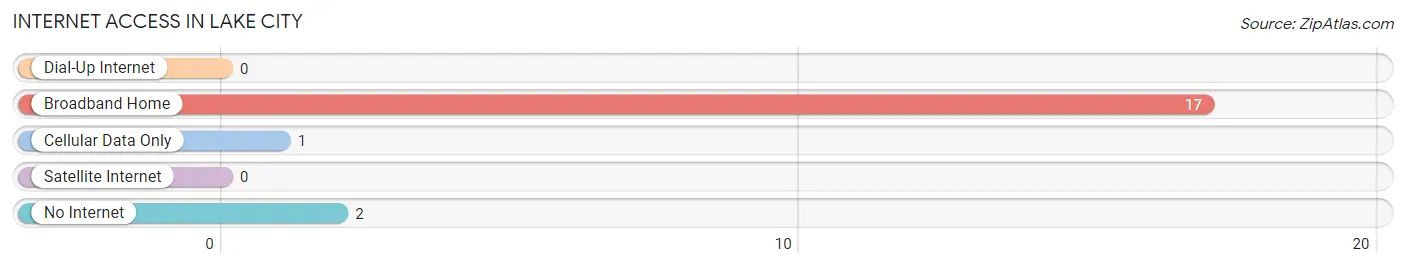
| Internet Type | # Households | % Households |
| Dial-Up Internet | 0 | 0.0% |
| Broadband Home | 17 | 85.0% |
| Cellular Data Only | 1 | 5.0% |
| Satellite Internet | 0 | 0.0% |
| No Internet | 2 | 10.0% |
| Total | 20 | 100.0% |
Lake City Summary
City of Lake City South Dakota
Lake City, South Dakota is a small city located in the southeastern corner of the state. It is situated in the heart of the Missouri River Valley, and is surrounded by rolling hills and lush farmland. The city is home to a population of approximately 1,500 people, and is the county seat of Lake County.
History
The area that is now Lake City was first settled in the late 1800s by a group of German immigrants. The town was originally named “New Berlin”, but was later changed to Lake City in 1883. The name was chosen to reflect the nearby lake, which was created by the damming of the Missouri River.
The city was officially incorporated in 1887, and quickly grew to become a bustling center of commerce and industry. The city was home to a variety of businesses, including a flour mill, a creamery, a lumber yard, and a brickyard. The city also had a thriving agricultural sector, with many farmers growing wheat, corn, and other crops.
In the early 1900s, the city experienced a period of rapid growth. The population increased from just over 500 in 1900 to nearly 1,500 by 1910. This growth was largely due to the construction of the Lake City and Sioux Falls Railroad, which connected the city to the larger cities of Sioux Falls and Yankton.
Geography
Lake City is located in the southeastern corner of South Dakota, in the heart of the Missouri River Valley. The city is situated on the banks of the Missouri River, and is surrounded by rolling hills and lush farmland. The city is located approximately 50 miles east of Sioux Falls, and is about a two-hour drive from the state capital of Pierre.
The city has a total area of 1.3 square miles, all of which is land. The city has a humid continental climate, with hot summers and cold winters. The average annual temperature is 48 degrees Fahrenheit, and the average annual precipitation is 22 inches.
Economy
The economy of Lake City is largely based on agriculture and tourism. The city is home to a variety of farms, which produce a variety of crops, including wheat, corn, and soybeans. The city is also home to a number of tourist attractions, including the Lake City Historical Museum, the Lake City Aquarium, and the Lake City Zoo.
The city is also home to a number of small businesses, including restaurants, retail stores, and service providers. The city is also home to a number of manufacturing companies, which produce a variety of products, including furniture, clothing, and electronics.
Demographics
As of the 2010 census, the population of Lake City was 1,521. The racial makeup of the city was 97.2% White, 0.7% African American, 0.3% Native American, 0.2% Asian, 0.1% Pacific Islander, 0.7% from other races, and 0.9% from two or more races. Hispanic or Latino of any race were 1.7% of the population.
The median income for a household in the city was $37,500, and the median income for a family was $45,000. The per capita income for the city was $19,000. About 11.2% of families and 14.2% of the population were below the poverty line, including 18.2% of those under age 18 and 8.3% of those age 65 or over.
Common Questions
What is Per Capita Income in Lake City?
Per Capita income in Lake City is $26,253.
What is the Median Family Income in Lake City?
Median Family Income in Lake City is $93,750.
What is the Median Household income in Lake City?
Median Household Income in Lake City is $51,250.
What is Inequality or Gini Index in Lake City?
Inequality or Gini Index in Lake City is 0.31.
What is the Total Population of Lake City?
Total Population of Lake City is 53.
What is the Total Male Population of Lake City?
Total Male Population of Lake City is 32.
What is the Total Female Population of Lake City?
Total Female Population of Lake City is 21.
What is the Ratio of Males per 100 Females in Lake City?
There are 152.38 Males per 100 Females in Lake City.
What is the Ratio of Females per 100 Males in Lake City?
There are 65.62 Females per 100 Males in Lake City.
What is the Median Population Age in Lake City?
Median Population Age in Lake City is 56.5 Years.
What is the Average Family Size in Lake City
Average Family Size in Lake City is 3.5 People.
What is the Average Household Size in Lake City
Average Household Size in Lake City is 2.6 People.
How Large is the Labor Force in Lake City?
There are 34 People in the Labor Forcein in Lake City.
What is the Percentage of People in the Labor Force in Lake City?
79.1% of People are in the Labor Force in Lake City.
What is the Unemployment Rate in Lake City?
Unemployment Rate in Lake City is 2.9%.