Veblen, SD Map & Demographics
Veblen Map
Veblen Overview
$20,267
PER CAPITA INCOME
$55,625
AVG FAMILY INCOME
$47,917
AVG HOUSEHOLD INCOME
29.8%
WAGE / INCOME GAP [ % ]
70.2¢/ $1
WAGE / INCOME GAP [ $ ]
0.34
INEQUALITY / GINI INDEX
472
TOTAL POPULATION
246
MALE POPULATION
226
FEMALE POPULATION
108.85
MALES / 100 FEMALES
91.87
FEMALES / 100 MALES
32.1
MEDIAN AGE
4.6
AVG FAMILY SIZE
3.1
AVG HOUSEHOLD SIZE
182
LABOR FORCE [ PEOPLE ]
53.8%
PERCENT IN LABOR FORCE
6.0%
UNEMPLOYMENT RATE
Veblen Zip Codes
Veblen Area Codes
Income in Veblen
Income Overview in Veblen
Per Capita Income in Veblen is $20,267, while median incomes of families and households are $55,625 and $47,917 respectively.
| Characteristic | Number | Measure |
| Per Capita Income | 472 | $20,267 |
| Median Family Income | 82 | $55,625 |
| Mean Family Income | 82 | $60,823 |
| Median Household Income | 154 | $47,917 |
| Mean Household Income | 154 | $51,869 |
| Income Deficit | 82 | $0 |
| Wage / Income Gap (%) | 472 | 29.78% |
| Wage / Income Gap ($) | 472 | 70.22¢ per $1 |
| Gini / Inequality Index | 472 | 0.34 |
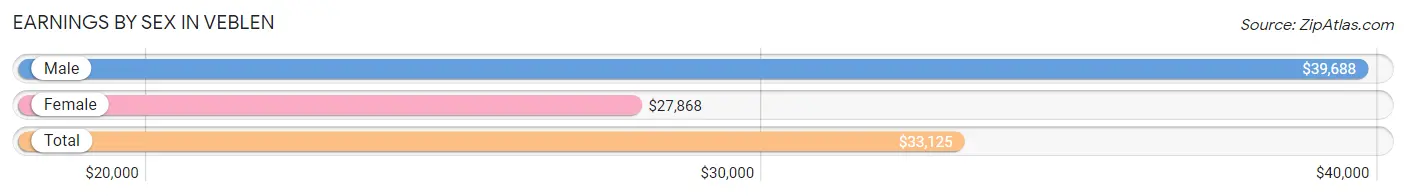
Earnings by Sex in Veblen
Average Earnings in Veblen are $33,125, $39,688 for men and $27,868 for women, a difference of 29.8%.
| Sex | Number | Average Earnings |
| Male | 122 (64.5%) | $39,688 |
| Female | 67 (35.4%) | $27,868 |
| Total | 189 (100.0%) | $33,125 |
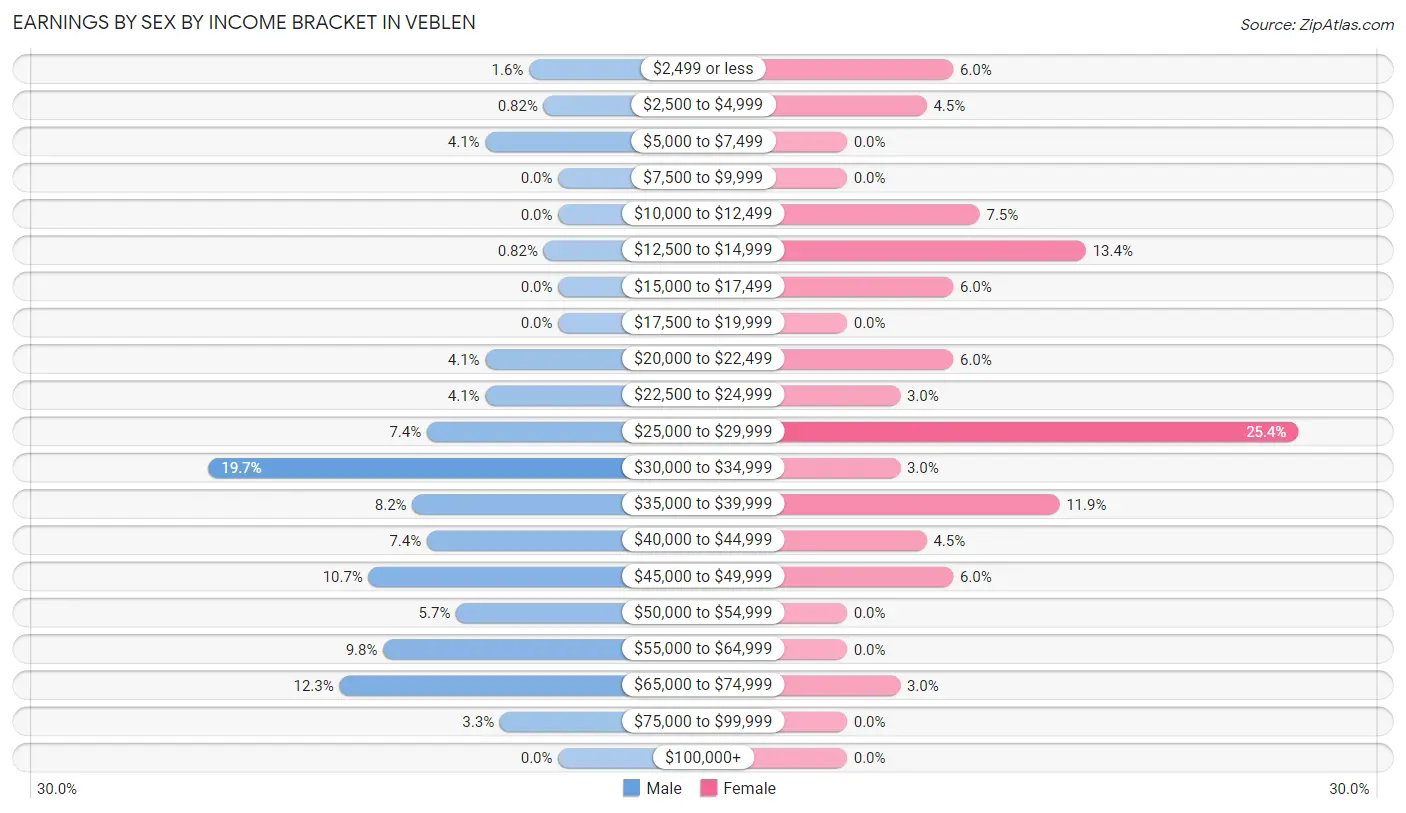
Earnings by Sex by Income Bracket in Veblen
The most common earnings brackets in Veblen are $30,000 to $34,999 for men (24 | 19.7%) and $25,000 to $29,999 for women (17 | 25.4%).
| Income | Male | Female |
| $2,499 or less | 2 (1.6%) | 4 (6.0%) |
| $2,500 to $4,999 | 1 (0.8%) | 3 (4.5%) |
| $5,000 to $7,499 | 5 (4.1%) | 0 (0.0%) |
| $7,500 to $9,999 | 0 (0.0%) | 0 (0.0%) |
| $10,000 to $12,499 | 0 (0.0%) | 5 (7.5%) |
| $12,500 to $14,999 | 1 (0.8%) | 9 (13.4%) |
| $15,000 to $17,499 | 0 (0.0%) | 4 (6.0%) |
| $17,500 to $19,999 | 0 (0.0%) | 0 (0.0%) |
| $20,000 to $22,499 | 5 (4.1%) | 4 (6.0%) |
| $22,500 to $24,999 | 5 (4.1%) | 2 (3.0%) |
| $25,000 to $29,999 | 9 (7.4%) | 17 (25.4%) |
| $30,000 to $34,999 | 24 (19.7%) | 2 (3.0%) |
| $35,000 to $39,999 | 10 (8.2%) | 8 (11.9%) |
| $40,000 to $44,999 | 9 (7.4%) | 3 (4.5%) |
| $45,000 to $49,999 | 13 (10.7%) | 4 (6.0%) |
| $50,000 to $54,999 | 7 (5.7%) | 0 (0.0%) |
| $55,000 to $64,999 | 12 (9.8%) | 0 (0.0%) |
| $65,000 to $74,999 | 15 (12.3%) | 2 (3.0%) |
| $75,000 to $99,999 | 4 (3.3%) | 0 (0.0%) |
| $100,000+ | 0 (0.0%) | 0 (0.0%) |
| Total | 122 (100.0%) | 67 (100.0%) |
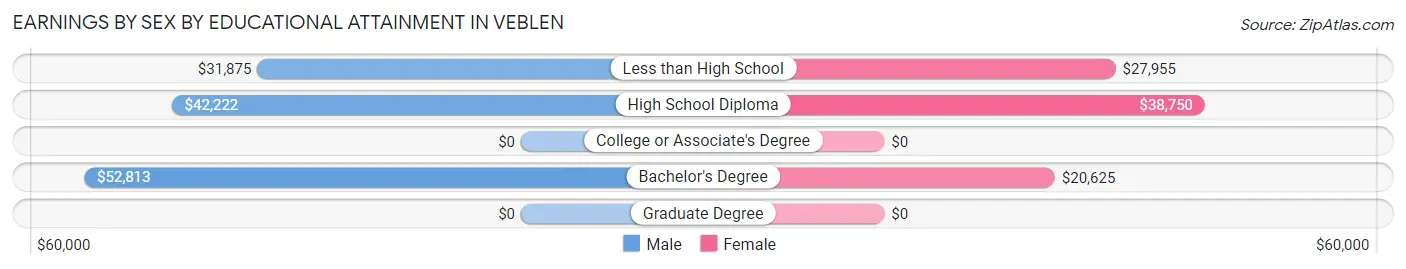
Earnings by Sex by Educational Attainment in Veblen
Average earnings in Veblen are $40,556 for men and $27,857 for women, a difference of 31.3%. Men with an educational attainment of bachelor's degree enjoy the highest average annual earnings of $52,813, while those with less than high school education earn the least with $31,875. Women with an educational attainment of high school diploma earn the most with the average annual earnings of $38,750, while those with bachelor's degree education have the smallest earnings of $20,625.
| Educational Attainment | Male Income | Female Income |
| Less than High School | $31,875 | $27,955 |
| High School Diploma | $42,222 | $38,750 |
| College or Associate's Degree | - | - |
| Bachelor's Degree | $52,813 | $20,625 |
| Graduate Degree | - | - |
| Total | $40,556 | $27,857 |
Family Income in Veblen
Family Income Brackets in Veblen
According to the Veblen family income data, there are 17 families falling into the $35,000 to $49,999 income range, which is the most common income bracket and makes up 20.7% of all families.
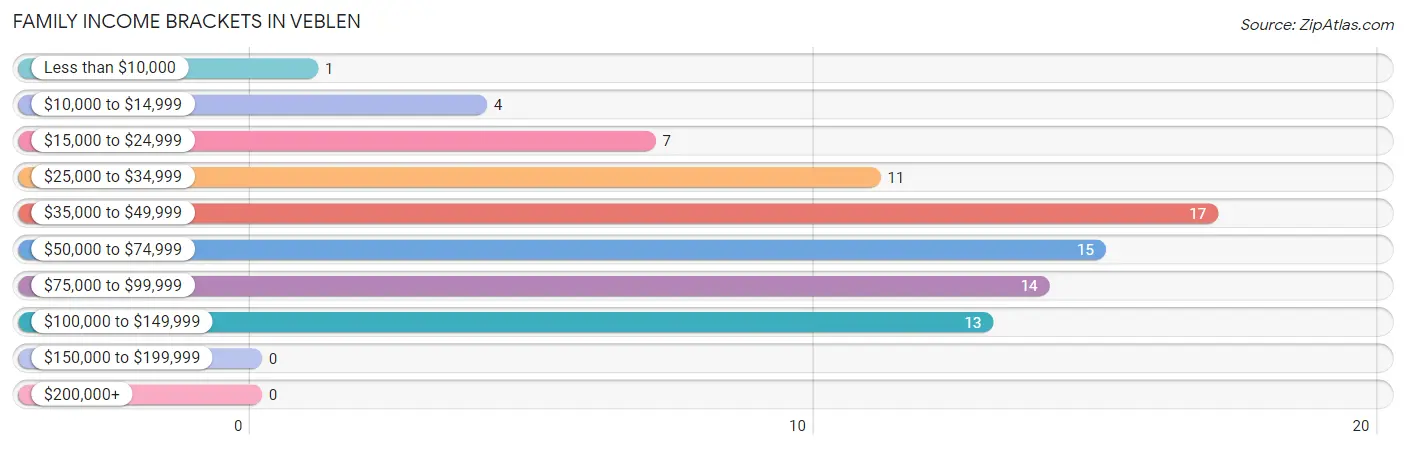
| Income Bracket | # Families | % Families |
| Less than $10,000 | 1 | 1.2% |
| $10,000 to $14,999 | 4 | 4.9% |
| $15,000 to $24,999 | 7 | 8.5% |
| $25,000 to $34,999 | 11 | 13.4% |
| $35,000 to $49,999 | 17 | 20.7% |
| $50,000 to $74,999 | 15 | 18.3% |
| $75,000 to $99,999 | 14 | 17.1% |
| $100,000 to $149,999 | 13 | 15.9% |
| $150,000 to $199,999 | 0 | 0.0% |
| $200,000+ | 0 | 0.0% |
Family Income by Famaliy Size in Veblen
5-person families (7 | 8.5%) account for the highest median family income in Veblen with $86,250 per family, while 2-person families (34 | 41.5%) have the highest median income of $24,772 per family member.
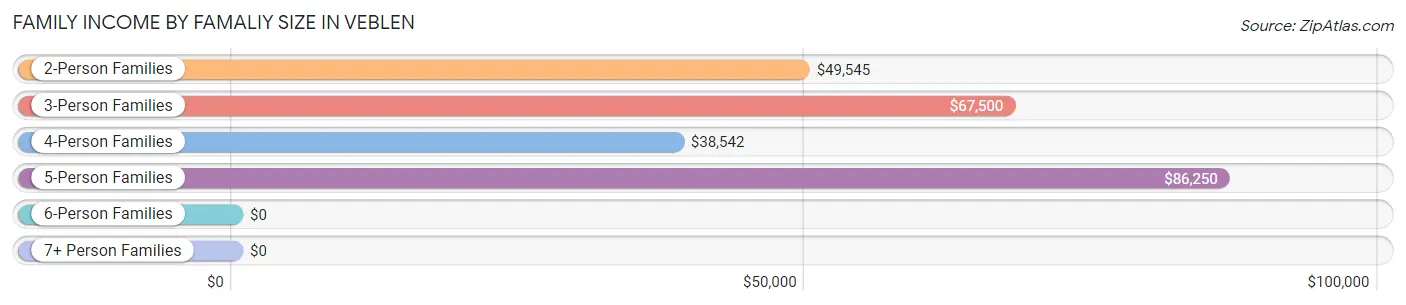
| Income Bracket | # Families | Median Income |
| 2-Person Families | 34 (41.5%) | $49,545 |
| 3-Person Families | 16 (19.5%) | $67,500 |
| 4-Person Families | 19 (23.2%) | $38,542 |
| 5-Person Families | 7 (8.5%) | $86,250 |
| 6-Person Families | 2 (2.4%) | $0 |
| 7+ Person Families | 4 (4.9%) | $0 |
| Total | 82 (100.0%) | $55,625 |
Family Income by Number of Earners in Veblen
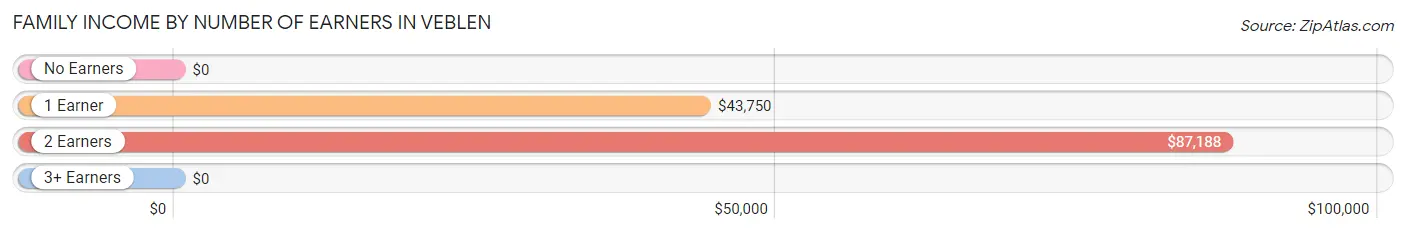
| Number of Earners | # Families | Median Income |
| No Earners | 13 (15.9%) | $0 |
| 1 Earner | 38 (46.3%) | $43,750 |
| 2 Earners | 27 (32.9%) | $87,188 |
| 3+ Earners | 4 (4.9%) | $0 |
| Total | 82 (100.0%) | $55,625 |
Household Income in Veblen
Household Income Brackets in Veblen
With 32 households falling in the category, the $35,000 to $49,999 income range is the most frequent in Veblen, accounting for 20.8% of all households.
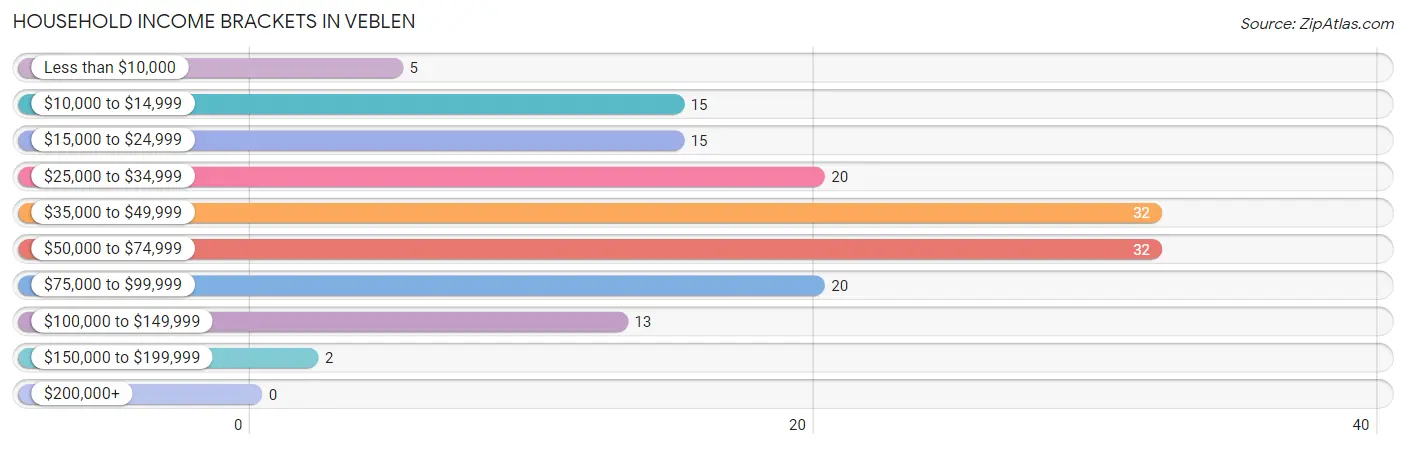
| Income Bracket | # Households | % Households |
| Less than $10,000 | 5 | 3.2% |
| $10,000 to $14,999 | 15 | 9.7% |
| $15,000 to $24,999 | 15 | 9.7% |
| $25,000 to $34,999 | 20 | 13.0% |
| $35,000 to $49,999 | 32 | 20.8% |
| $50,000 to $74,999 | 32 | 20.8% |
| $75,000 to $99,999 | 20 | 13.0% |
| $100,000 to $149,999 | 13 | 8.4% |
| $150,000 to $199,999 | 2 | 1.3% |
| $200,000+ | 0 | 0.0% |
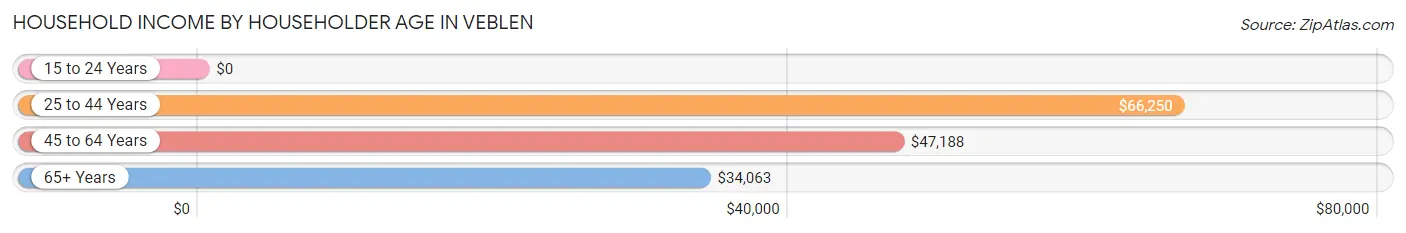
Household Income by Householder Age in Veblen
The median household income in Veblen is $47,917, with the highest median household income of $66,250 found in the 25 to 44 years age bracket for the primary householder. A total of 50 households (32.5%) fall into this category. Meanwhile, the 15 to 24 years age bracket for the primary householder has the lowest median household income of $0, with 1 households (0.6%) in this group.
| Income Bracket | # Households | Median Income |
| 15 to 24 Years | 1 (0.6%) | $0 |
| 25 to 44 Years | 50 (32.5%) | $66,250 |
| 45 to 64 Years | 42 (27.3%) | $47,188 |
| 65+ Years | 61 (39.6%) | $34,063 |
| Total | 154 (100.0%) | $47,917 |
Poverty in Veblen
Income Below Poverty by Sex and Age in Veblen
With 17.5% poverty level for males and 16.8% for females among the residents of Veblen, 5 year old males and 5 year old females are the most vulnerable to poverty, with 1 males (100.0%) and 2 females (66.7%) in their respective age groups living below the poverty level.
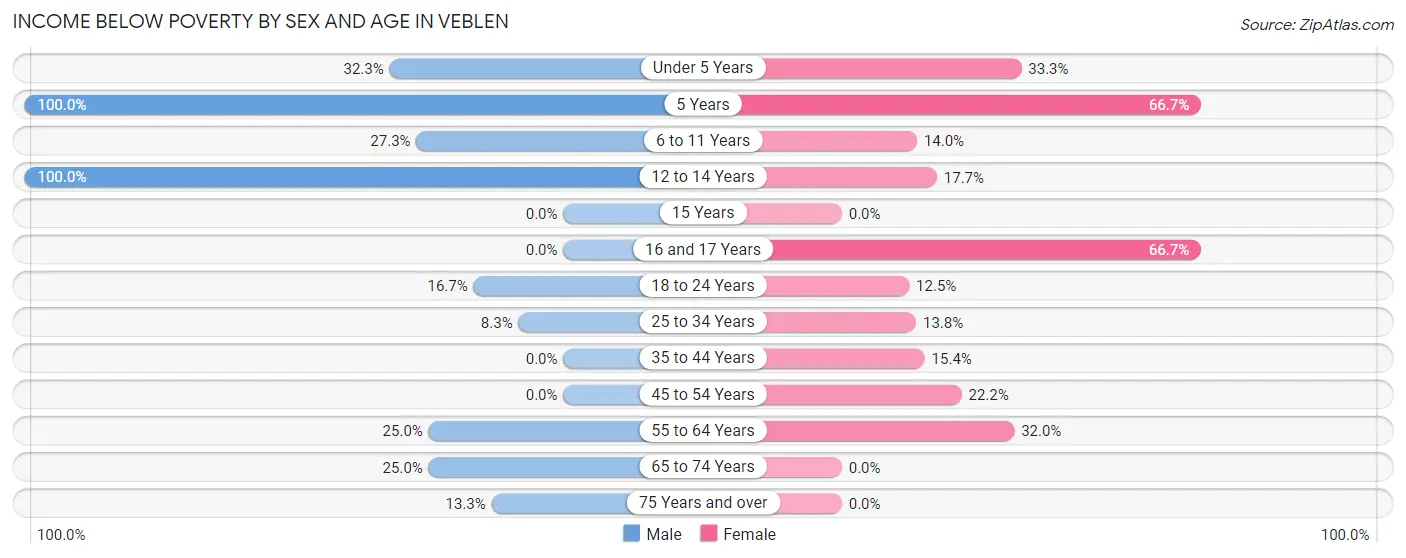
| Age Bracket | Male | Female |
| Under 5 Years | 10 (32.3%) | 4 (33.3%) |
| 5 Years | 1 (100.0%) | 2 (66.7%) |
| 6 to 11 Years | 6 (27.3%) | 6 (14.0%) |
| 12 to 14 Years | 5 (100.0%) | 3 (17.6%) |
| 15 Years | 0 (0.0%) | 0 (0.0%) |
| 16 and 17 Years | 0 (0.0%) | 2 (66.7%) |
| 18 to 24 Years | 1 (16.7%) | 3 (12.5%) |
| 25 to 34 Years | 5 (8.3%) | 4 (13.8%) |
| 35 to 44 Years | 0 (0.0%) | 4 (15.4%) |
| 45 to 54 Years | 0 (0.0%) | 2 (22.2%) |
| 55 to 64 Years | 5 (25.0%) | 8 (32.0%) |
| 65 to 74 Years | 6 (25.0%) | 0 (0.0%) |
| 75 Years and over | 4 (13.3%) | 0 (0.0%) |
| Total | 43 (17.5%) | 38 (16.8%) |
Income Above Poverty by Sex and Age in Veblen
According to the poverty statistics in Veblen, males aged 16 and 17 years and females aged 65 to 74 years are the age groups that are most secure financially, with 100.0% of males and 100.0% of females in these age groups living above the poverty line.
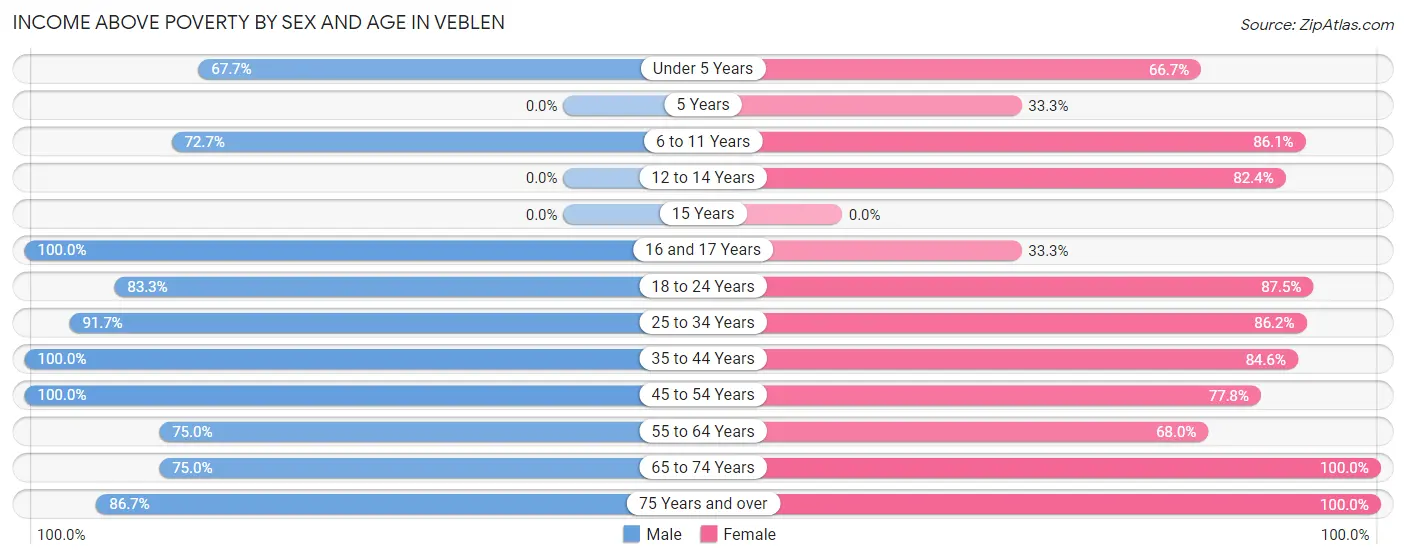
| Age Bracket | Male | Female |
| Under 5 Years | 21 (67.7%) | 8 (66.7%) |
| 5 Years | 0 (0.0%) | 1 (33.3%) |
| 6 to 11 Years | 16 (72.7%) | 37 (86.1%) |
| 12 to 14 Years | 0 (0.0%) | 14 (82.4%) |
| 15 Years | 0 (0.0%) | 0 (0.0%) |
| 16 and 17 Years | 2 (100.0%) | 1 (33.3%) |
| 18 to 24 Years | 5 (83.3%) | 21 (87.5%) |
| 25 to 34 Years | 55 (91.7%) | 25 (86.2%) |
| 35 to 44 Years | 23 (100.0%) | 22 (84.6%) |
| 45 to 54 Years | 22 (100.0%) | 7 (77.8%) |
| 55 to 64 Years | 15 (75.0%) | 17 (68.0%) |
| 65 to 74 Years | 18 (75.0%) | 8 (100.0%) |
| 75 Years and over | 26 (86.7%) | 27 (100.0%) |
| Total | 203 (82.5%) | 188 (83.2%) |
Income Below Poverty Among Married-Couple Families in Veblen
The poverty statistics for married-couple families in Veblen show that 4.6% or 3 of the total 65 families live below the poverty line. Families with 5 or more children have the highest poverty rate of 100.0%, comprising of 3 families. On the other hand, families with no children have the lowest poverty rate of 0.0%, which includes 0 families.
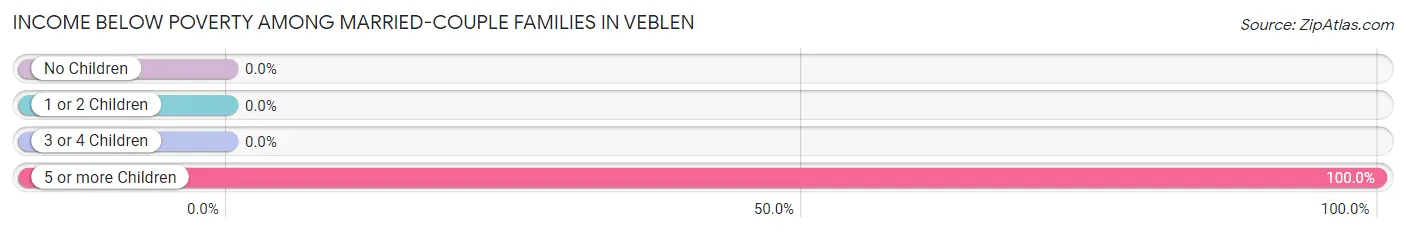
| Children | Above Poverty | Below Poverty |
| No Children | 38 (100.0%) | 0 (0.0%) |
| 1 or 2 Children | 19 (100.0%) | 0 (0.0%) |
| 3 or 4 Children | 5 (100.0%) | 0 (0.0%) |
| 5 or more Children | 0 (0.0%) | 3 (100.0%) |
| Total | 62 (95.4%) | 3 (4.6%) |
Income Below Poverty Among Single-Parent Households in Veblen
According to the poverty data in Veblen, 25.0% or 1 single-father households and 46.2% or 6 single-mother households are living below the poverty line. Among single-father households, those with 1 or 2 children have the highest poverty rate, with 1 households (100.0%) experiencing poverty. Likewise, among single-mother households, those with 5 or more children have the highest poverty rate, with 1 households (100.0%) falling below the poverty line.
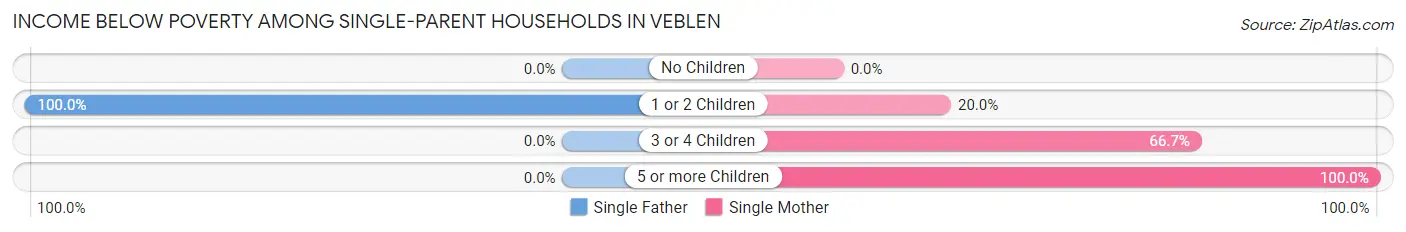
| Children | Single Father | Single Mother |
| No Children | 0 (0.0%) | 0 (0.0%) |
| 1 or 2 Children | 1 (100.0%) | 1 (20.0%) |
| 3 or 4 Children | 0 (0.0%) | 4 (66.7%) |
| 5 or more Children | 0 (0.0%) | 1 (100.0%) |
| Total | 1 (25.0%) | 6 (46.2%) |
Income Below Poverty Among Married-Couple vs Single-Parent Households in Veblen
The poverty data for Veblen shows that 3 of the married-couple family households (4.6%) and 7 of the single-parent households (41.2%) are living below the poverty level. Within the married-couple family households, those with 5 or more children have the highest poverty rate, with 3 households (100.0%) falling below the poverty line. Among the single-parent households, those with 5 or more children have the highest poverty rate, with 1 household (100.0%) living below poverty.
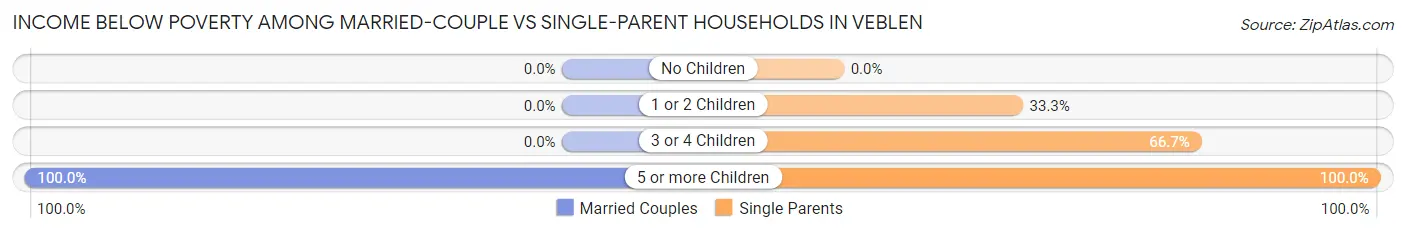
| Children | Married-Couple Families | Single-Parent Households |
| No Children | 0 (0.0%) | 0 (0.0%) |
| 1 or 2 Children | 0 (0.0%) | 2 (33.3%) |
| 3 or 4 Children | 0 (0.0%) | 4 (66.7%) |
| 5 or more Children | 3 (100.0%) | 1 (100.0%) |
| Total | 3 (4.6%) | 7 (41.2%) |
Race in Veblen
The most populous races in Veblen are Hispanic or Latino (203 | 43.0%), White / Caucasian (187 | 39.6%), and Some other Race (142 | 30.1%).
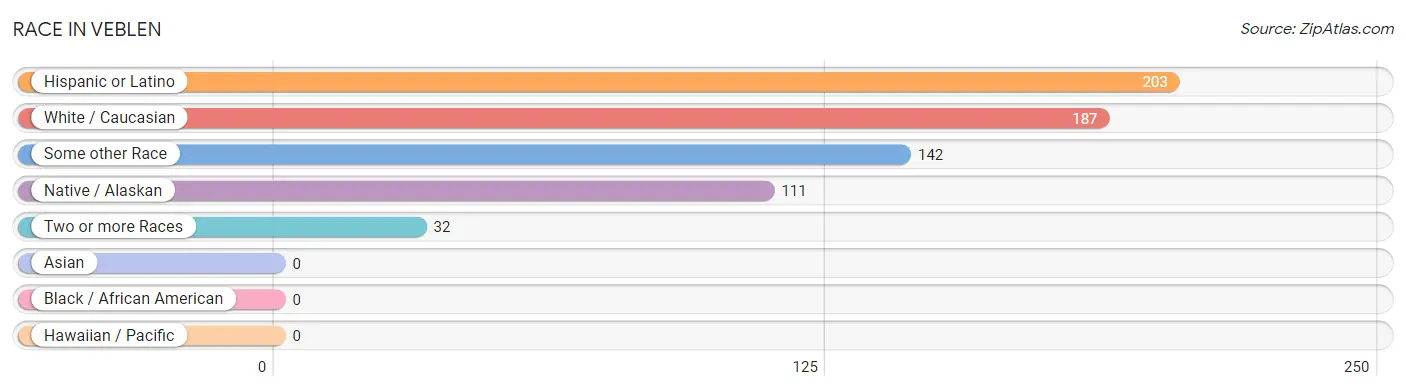
| Race | # Population | % Population |
| Asian | 0 | 0.0% |
| Black / African American | 0 | 0.0% |
| Hawaiian / Pacific | 0 | 0.0% |
| Hispanic or Latino | 203 | 43.0% |
| Native / Alaskan | 111 | 23.5% |
| White / Caucasian | 187 | 39.6% |
| Two or more Races | 32 | 6.8% |
| Some other Race | 142 | 30.1% |
| Total | 472 | 100.0% |
Ancestry in Veblen
The most populous ancestries reported in Veblen are Mexican (155 | 32.8%), German (106 | 22.5%), Sioux (98 | 20.8%), Central American (48 | 10.2%), and Norwegian (47 | 10.0%), together accounting for 96.2% of all Veblen residents.
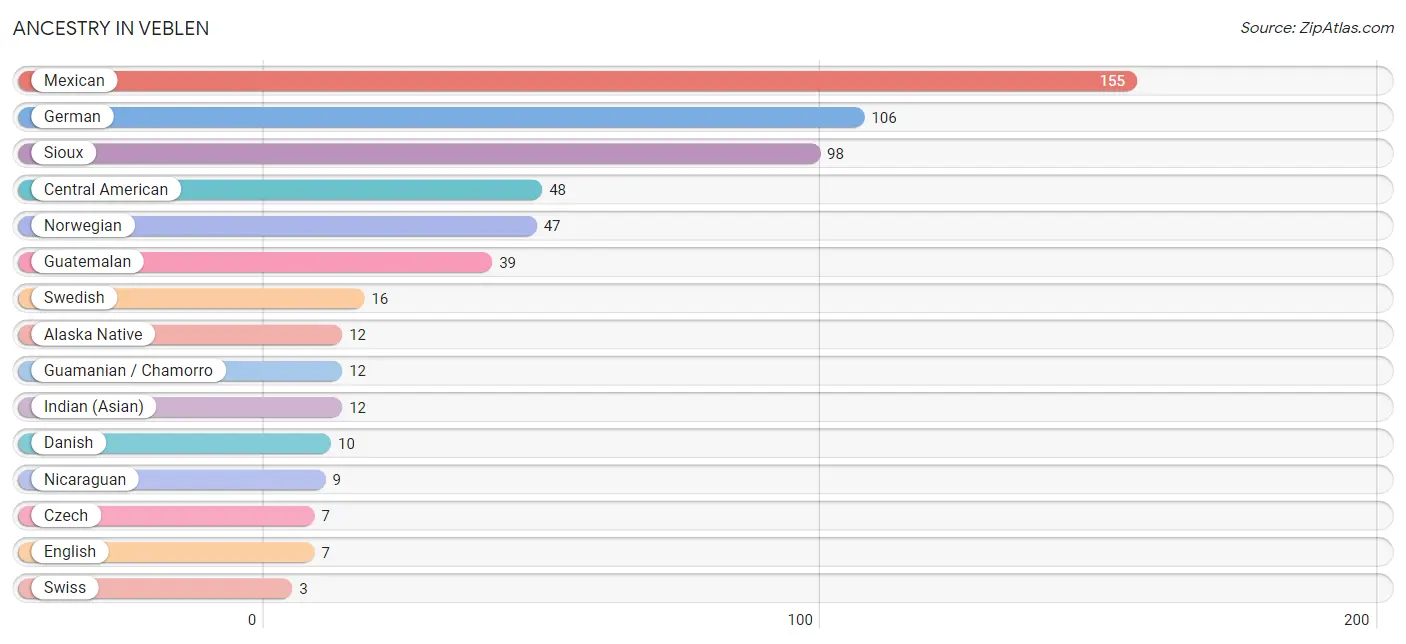
| Ancestry | # Population | % Population |
| Alaska Native | 12 | 2.5% |
| Central American | 48 | 10.2% |
| Czech | 7 | 1.5% |
| Danish | 10 | 2.1% |
| English | 7 | 1.5% |
| German | 106 | 22.5% |
| Guamanian / Chamorro | 12 | 2.5% |
| Guatemalan | 39 | 8.3% |
| Indian (Asian) | 12 | 2.5% |
| Irish | 1 | 0.2% |
| Lithuanian | 2 | 0.4% |
| Mexican | 155 | 32.8% |
| Nicaraguan | 9 | 1.9% |
| Norwegian | 47 | 10.0% |
| Polish | 2 | 0.4% |
| Sioux | 98 | 20.8% |
| Swedish | 16 | 3.4% |
| Swiss | 3 | 0.6% | View All 18 Rows |
Immigrants in Veblen
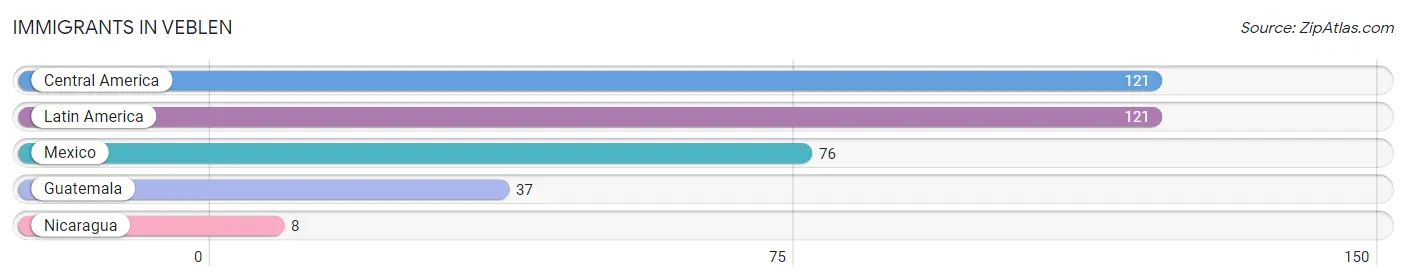
The most numerous immigrant groups reported in Veblen came from Central America (121 | 25.6%), Latin America (121 | 25.6%), Mexico (76 | 16.1%), Guatemala (37 | 7.8%), and Nicaragua (8 | 1.7%), together accounting for 76.9% of all Veblen residents.
| Immigration Origin | # Population | % Population |
| Central America | 121 | 25.6% |
| Guatemala | 37 | 7.8% |
| Latin America | 121 | 25.6% |
| Mexico | 76 | 16.1% |
| Nicaragua | 8 | 1.7% | View All 5 Rows |
Sex and Age in Veblen
Sex and Age in Veblen
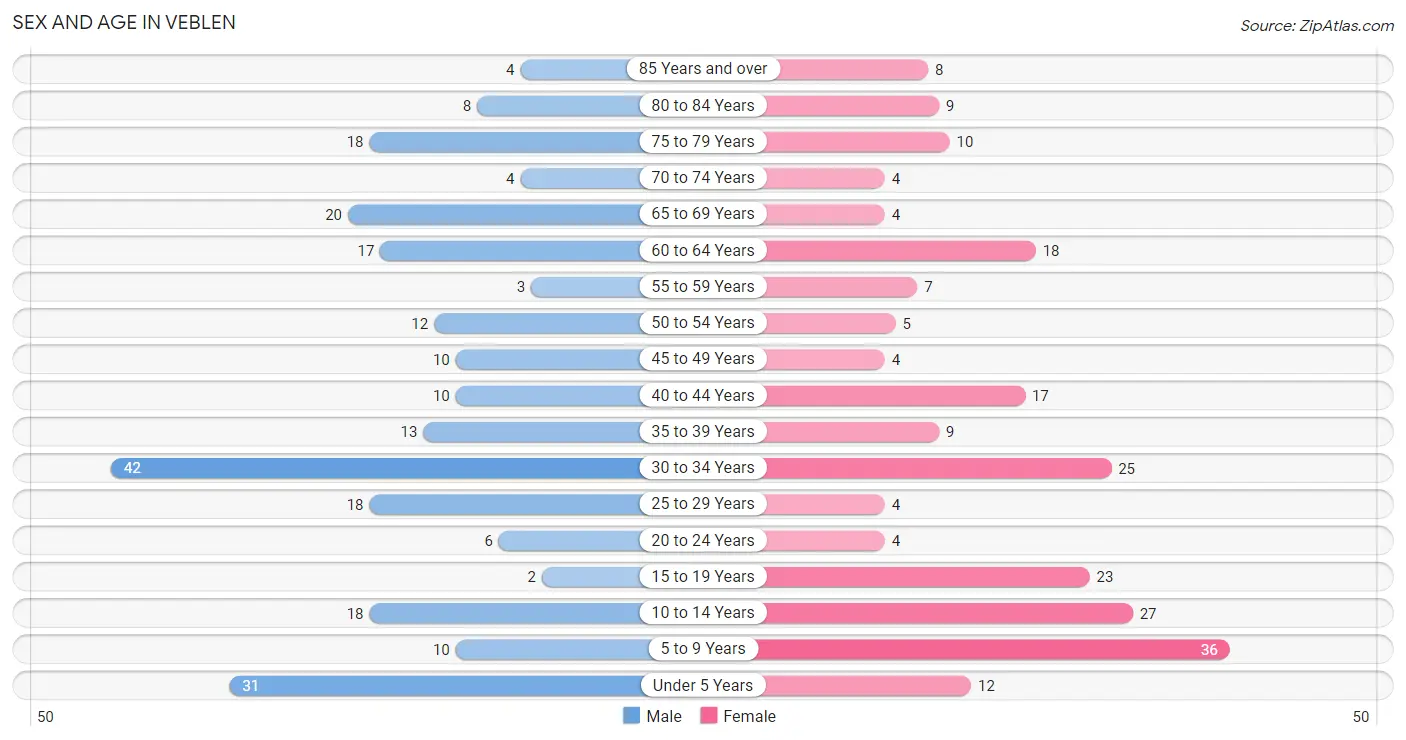
The most populous age groups in Veblen are 30 to 34 Years (42 | 17.1%) for men and 5 to 9 Years (36 | 15.9%) for women.
| Age Bracket | Male | Female |
| Under 5 Years | 31 (12.6%) | 12 (5.3%) |
| 5 to 9 Years | 10 (4.1%) | 36 (15.9%) |
| 10 to 14 Years | 18 (7.3%) | 27 (11.9%) |
| 15 to 19 Years | 2 (0.8%) | 23 (10.2%) |
| 20 to 24 Years | 6 (2.4%) | 4 (1.8%) |
| 25 to 29 Years | 18 (7.3%) | 4 (1.8%) |
| 30 to 34 Years | 42 (17.1%) | 25 (11.1%) |
| 35 to 39 Years | 13 (5.3%) | 9 (4.0%) |
| 40 to 44 Years | 10 (4.1%) | 17 (7.5%) |
| 45 to 49 Years | 10 (4.1%) | 4 (1.8%) |
| 50 to 54 Years | 12 (4.9%) | 5 (2.2%) |
| 55 to 59 Years | 3 (1.2%) | 7 (3.1%) |
| 60 to 64 Years | 17 (6.9%) | 18 (8.0%) |
| 65 to 69 Years | 20 (8.1%) | 4 (1.8%) |
| 70 to 74 Years | 4 (1.6%) | 4 (1.8%) |
| 75 to 79 Years | 18 (7.3%) | 10 (4.4%) |
| 80 to 84 Years | 8 (3.3%) | 9 (4.0%) |
| 85 Years and over | 4 (1.6%) | 8 (3.5%) |
| Total | 246 (100.0%) | 226 (100.0%) |
Families and Households in Veblen
Median Family Size in Veblen
The median family size in Veblen is 4.61 persons per family, with single male/father families (4 | 4.9%) accounting for the largest median family size of 7.25 persons per family. On the other hand, married-couple families (65 | 79.3%) represent the smallest median family size with 4.11 persons per family.
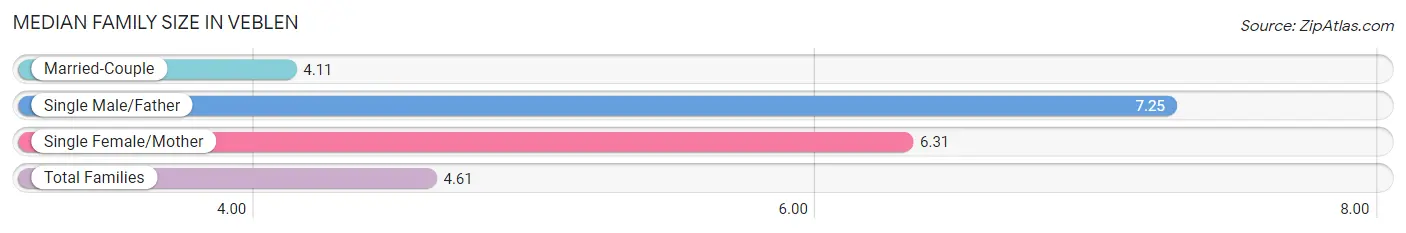
| Family Type | # Families | Family Size |
| Married-Couple | 65 (79.3%) | 4.11 |
| Single Male/Father | 4 (4.9%) | 7.25 |
| Single Female/Mother | 13 (15.9%) | 6.31 |
| Total Families | 82 (100.0%) | 4.61 |
Median Household Size in Veblen
The median household size in Veblen is 3.06 persons per household, with single male/father households (4 | 2.6%) accounting for the largest median household size of 8.25 persons per household. non-family households (72 | 46.8%) represent the smallest median household size with 1.19 persons per household.
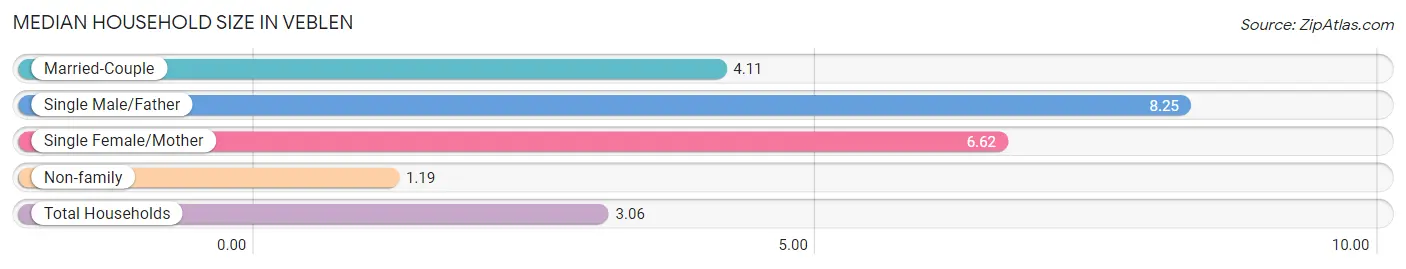
| Household Type | # Households | Household Size |
| Married-Couple | 65 (42.2%) | 4.11 |
| Single Male/Father | 4 (2.6%) | 8.25 |
| Single Female/Mother | 13 (8.4%) | 6.62 |
| Non-family | 72 (46.8%) | 1.19 |
| Total Households | 154 (100.0%) | 3.06 |
Household Size by Marriage Status in Veblen
Out of a total of 154 households in Veblen, 82 (53.2%) are family households, while 72 (46.8%) are nonfamily households. The most numerous type of family households are 2-person households, comprising 31, and the most common type of nonfamily households are 1-person households, comprising 65.
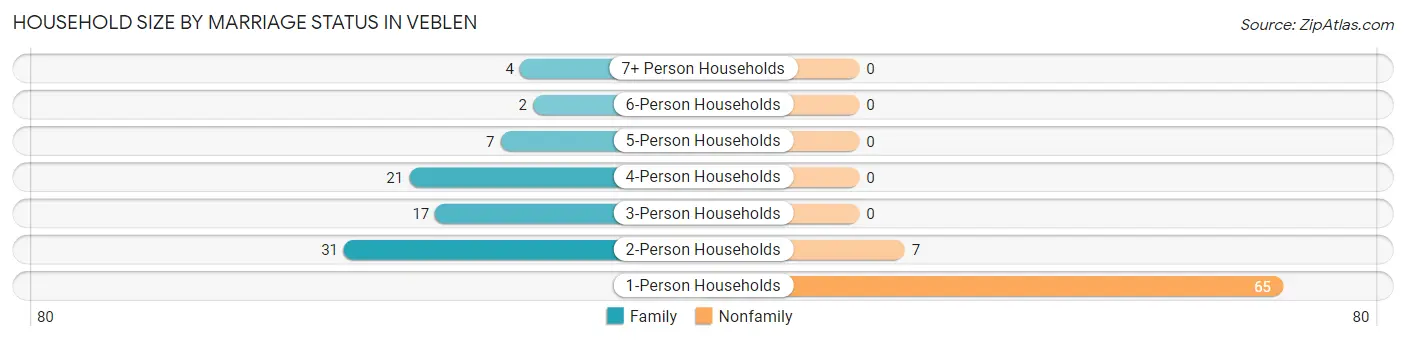
| Household Size | Family Households | Nonfamily Households |
| 1-Person Households | - | 65 (42.2%) |
| 2-Person Households | 31 (20.1%) | 7 (4.5%) |
| 3-Person Households | 17 (11.0%) | 0 (0.0%) |
| 4-Person Households | 21 (13.6%) | 0 (0.0%) |
| 5-Person Households | 7 (4.5%) | 0 (0.0%) |
| 6-Person Households | 2 (1.3%) | 0 (0.0%) |
| 7+ Person Households | 4 (2.6%) | 0 (0.0%) |
| Total | 82 (53.2%) | 72 (46.8%) |
Female Fertility in Veblen
Fertility by Age in Veblen
Average fertility rate in Veblen is 105.0 births per 1,000 women. Women in the age bracket of 20 to 34 years have the highest fertility rate with 273.0 births per 1,000 women. Women in the age bracket of 20 to 34 years acount for 100.0% of all women with births.
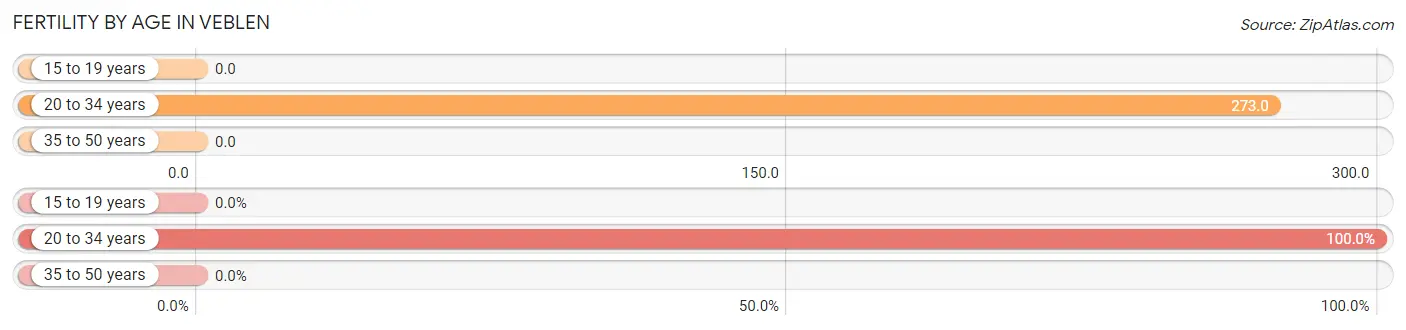
| Age Bracket | Women with Births | Births / 1,000 Women |
| 15 to 19 years | 0 (0.0%) | 0.0 |
| 20 to 34 years | 9 (100.0%) | 273.0 |
| 35 to 50 years | 0 (0.0%) | 0.0 |
| Total | 9 (100.0%) | 105.0 |
Fertility by Age by Marriage Status in Veblen
88.9% of women with births (9) in Veblen are married. The highest percentage of unmarried women with births falls into 20 to 34 years age bracket with 11.1% of them unmarried at the time of birth, while the lowest percentage of unmarried women with births belong to 20 to 34 years age bracket with 11.1% of them unmarried.
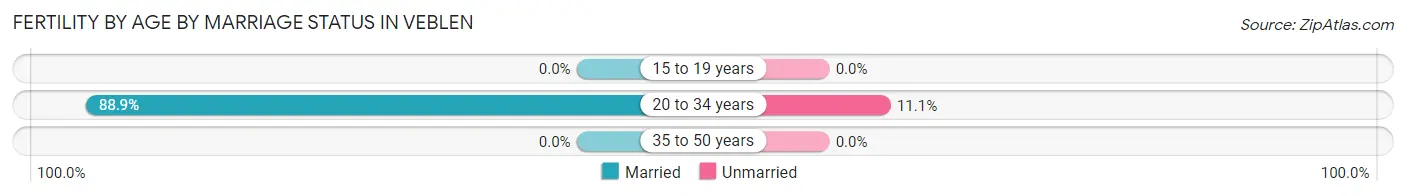
| Age Bracket | Married | Unmarried |
| 15 to 19 years | 0 (0.0%) | 0 (0.0%) |
| 20 to 34 years | 8 (88.9%) | 1 (11.1%) |
| 35 to 50 years | 0 (0.0%) | 0 (0.0%) |
| Total | 8 (88.9%) | 1 (11.1%) |
Fertility by Education in Veblen
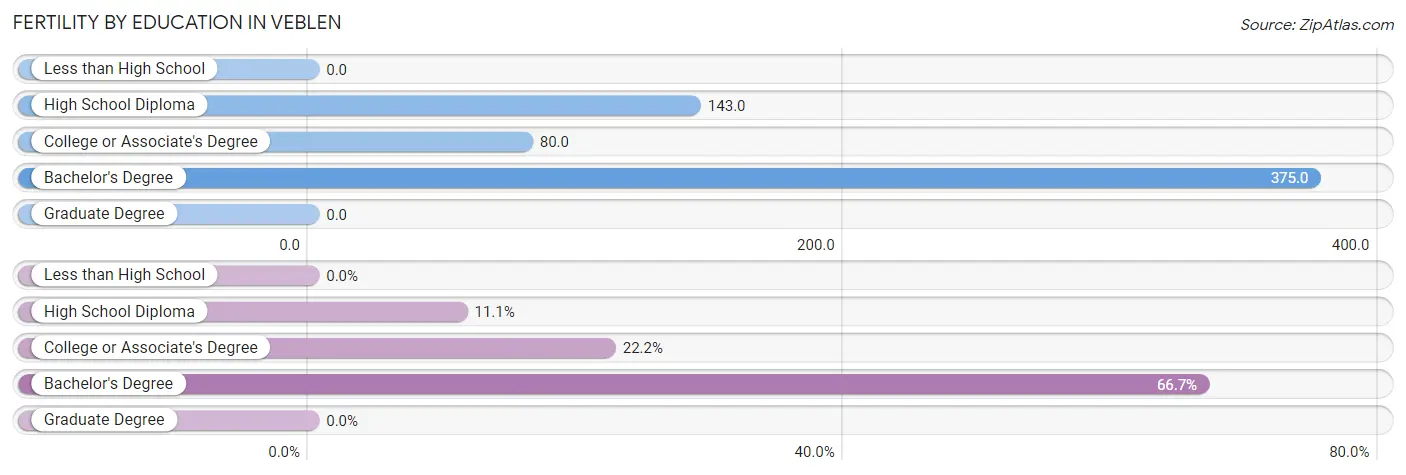
| Educational Attainment | Women with Births | Births / 1,000 Women |
| Less than High School | 0 (0.0%) | 0.0 |
| High School Diploma | 1 (11.1%) | 143.0 |
| College or Associate's Degree | 2 (22.2%) | 80.0 |
| Bachelor's Degree | 6 (66.7%) | 375.0 |
| Graduate Degree | 0 (0.0%) | 0.0 |
| Total | 9 (100.0%) | 105.0 |
Fertility by Education by Marriage Status in Veblen
11.1% of women with births in Veblen are unmarried. Women with the educational attainment of college or associate's degree are most likely to be married with 100.0% of them married at childbirth, while women with the educational attainment of high school diploma are least likely to be married with 100.0% of them unmarried at childbirth.
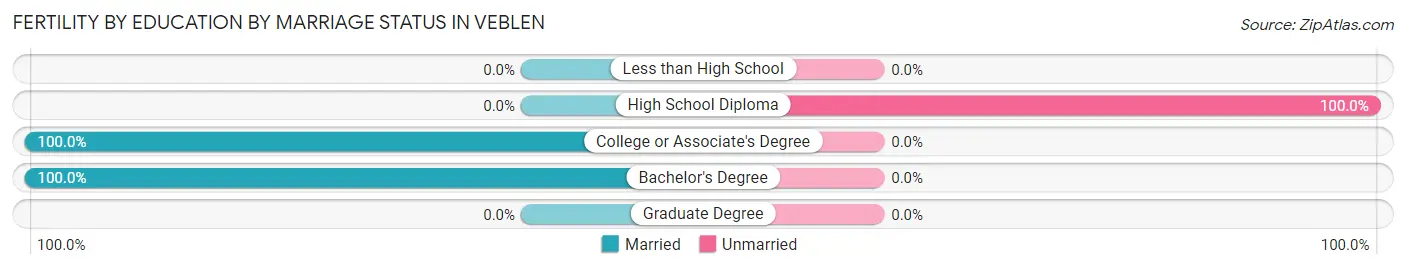
| Educational Attainment | Married | Unmarried |
| Less than High School | 0 (0.0%) | 0 (0.0%) |
| High School Diploma | 0 (0.0%) | 1 (100.0%) |
| College or Associate's Degree | 2 (100.0%) | 0 (0.0%) |
| Bachelor's Degree | 6 (100.0%) | 0 (0.0%) |
| Graduate Degree | 0 (0.0%) | 0 (0.0%) |
| Total | 8 (88.9%) | 1 (11.1%) |
Employment Characteristics in Veblen
Employment by Class of Employer in Veblen
Among the 166 employed individuals in Veblen, private company employees (113 | 68.1%), local government employees (21 | 12.7%), and self-employed (incorporated) (10 | 6.0%) make up the most common classes of employment.
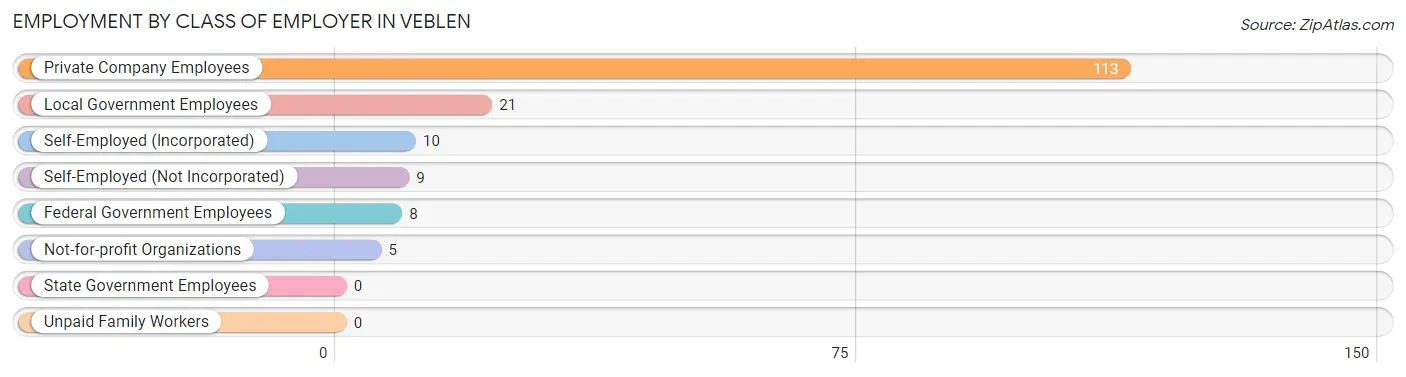
| Employer Class | # Employees | % Employees |
| Private Company Employees | 113 | 68.1% |
| Self-Employed (Incorporated) | 10 | 6.0% |
| Self-Employed (Not Incorporated) | 9 | 5.4% |
| Not-for-profit Organizations | 5 | 3.0% |
| Local Government Employees | 21 | 12.7% |
| State Government Employees | 0 | 0.0% |
| Federal Government Employees | 8 | 4.8% |
| Unpaid Family Workers | 0 | 0.0% |
| Total | 166 | 100.0% |
Employment Status by Age in Veblen
According to the labor force statistics for Veblen, out of the total population over 16 years of age (338), 53.8% or 182 individuals are in the labor force, with 6.0% or 11 of them unemployed. The age group with the highest labor force participation rate is 20 to 24 years, with 100.0% or 10 individuals in the labor force. Within the labor force, the 35 to 44 years age range has the highest percentage of unemployed individuals, with 10.4% or 5 of them being unemployed.
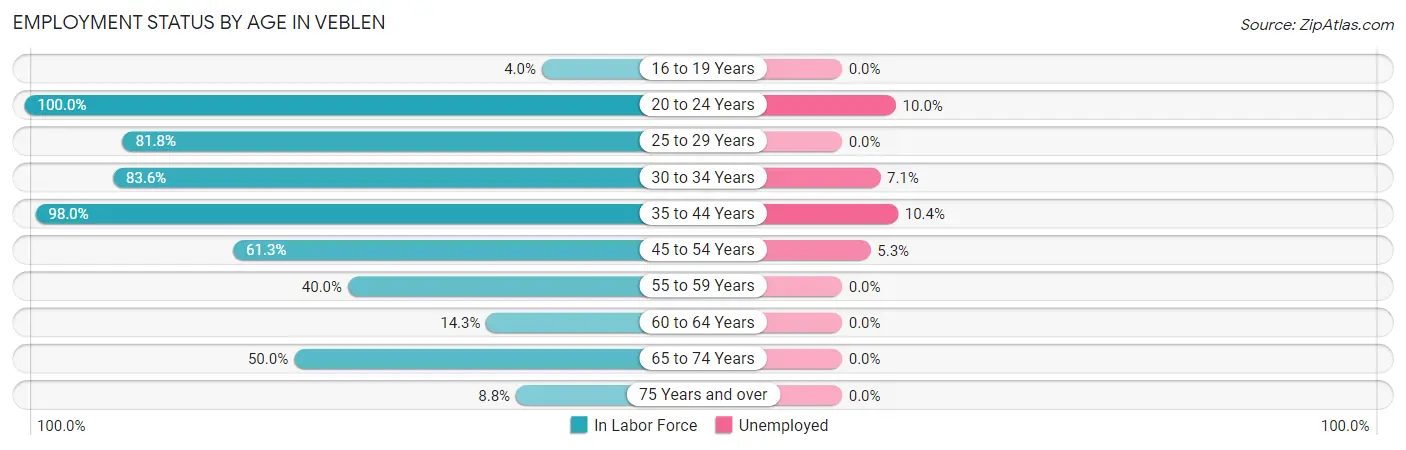
| Age Bracket | In Labor Force | Unemployed |
| 16 to 19 Years | 1 (4.0%) | 0 (0.0%) |
| 20 to 24 Years | 10 (100.0%) | 1 (10.0%) |
| 25 to 29 Years | 18 (81.8%) | 0 (0.0%) |
| 30 to 34 Years | 56 (83.6%) | 4 (7.1%) |
| 35 to 44 Years | 48 (98.0%) | 5 (10.4%) |
| 45 to 54 Years | 19 (61.3%) | 1 (5.3%) |
| 55 to 59 Years | 4 (40.0%) | 0 (0.0%) |
| 60 to 64 Years | 5 (14.3%) | 0 (0.0%) |
| 65 to 74 Years | 16 (50.0%) | 0 (0.0%) |
| 75 Years and over | 5 (8.8%) | 0 (0.0%) |
| Total | 182 (53.8%) | 11 (6.0%) |
Employment Status by Educational Attainment in Veblen
According to labor force statistics for Veblen, 70.1% of individuals (150) out of the total population between 25 and 64 years of age (214) are in the labor force, with 6.7% or 10 of them being unemployed. The group with the highest labor force participation rate are those with the educational attainment of high school diploma, with 73.1% or 38 individuals in the labor force. Within the labor force, individuals with college / associate degree education have the highest percentage of unemployment, with 23.8% or 5 of them being unemployed.
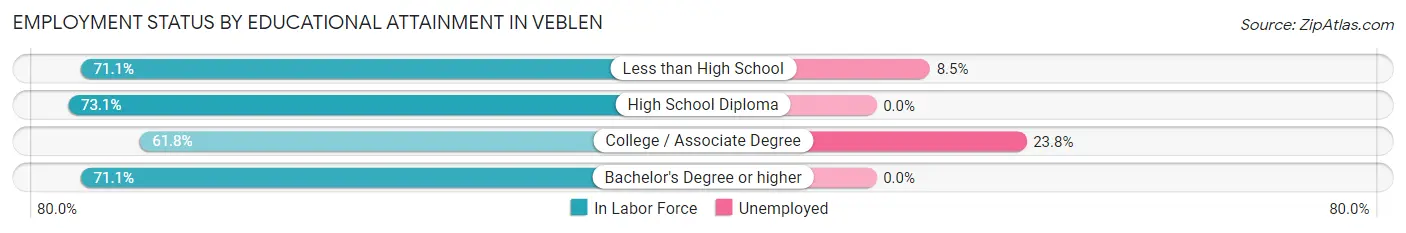
| Educational Attainment | In Labor Force | Unemployed |
| Less than High School | 59 (71.1%) | 7 (8.5%) |
| High School Diploma | 38 (73.1%) | 0 (0.0%) |
| College / Associate Degree | 21 (61.8%) | 8 (23.8%) |
| Bachelor's Degree or higher | 32 (71.1%) | 0 (0.0%) |
| Total | 150 (70.1%) | 14 (6.7%) |
Employment Occupations by Sex in Veblen
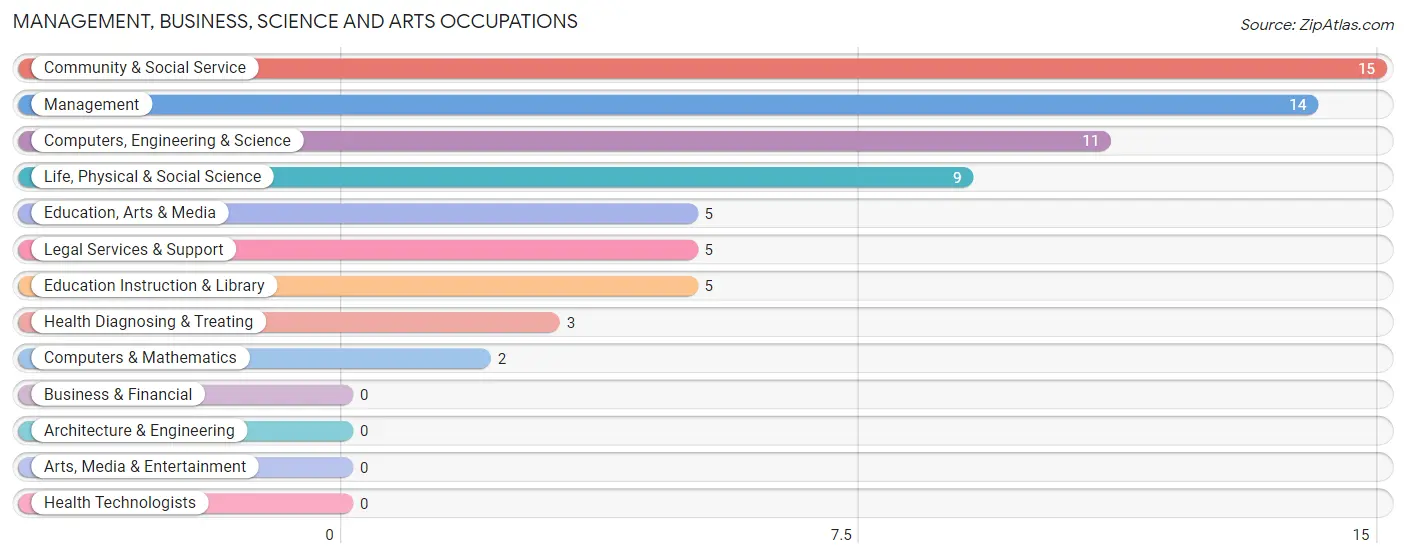
Management, Business, Science and Arts Occupations
The most common Management, Business, Science and Arts occupations in Veblen are Community & Social Service (15 | 8.8%), Management (14 | 8.2%), Computers, Engineering & Science (11 | 6.4%), Life, Physical & Social Science (9 | 5.3%), and Education, Arts & Media (5 | 2.9%).
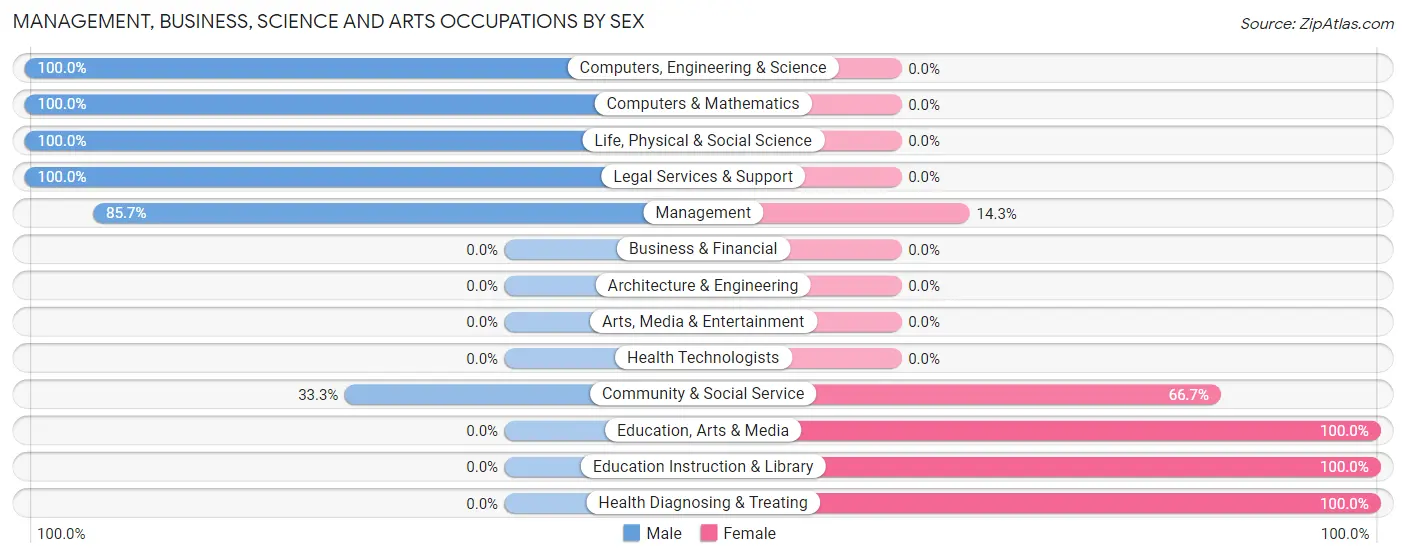
Management, Business, Science and Arts Occupations by Sex
Within the Management, Business, Science and Arts occupations in Veblen, the most male-oriented occupations are Computers, Engineering & Science (100.0%), Computers & Mathematics (100.0%), and Life, Physical & Social Science (100.0%), while the most female-oriented occupations are Education, Arts & Media (100.0%), Education Instruction & Library (100.0%), and Health Diagnosing & Treating (100.0%).
| Occupation | Male | Female |
| Management | 12 (85.7%) | 2 (14.3%) |
| Business & Financial | 0 (0.0%) | 0 (0.0%) |
| Computers, Engineering & Science | 11 (100.0%) | 0 (0.0%) |
| Computers & Mathematics | 2 (100.0%) | 0 (0.0%) |
| Architecture & Engineering | 0 (0.0%) | 0 (0.0%) |
| Life, Physical & Social Science | 9 (100.0%) | 0 (0.0%) |
| Community & Social Service | 5 (33.3%) | 10 (66.7%) |
| Education, Arts & Media | 0 (0.0%) | 5 (100.0%) |
| Legal Services & Support | 5 (100.0%) | 0 (0.0%) |
| Education Instruction & Library | 0 (0.0%) | 5 (100.0%) |
| Arts, Media & Entertainment | 0 (0.0%) | 0 (0.0%) |
| Health Diagnosing & Treating | 0 (0.0%) | 3 (100.0%) |
| Health Technologists | 0 (0.0%) | 0 (0.0%) |
| Total (Category) | 28 (65.1%) | 15 (34.9%) |
| Total (Overall) | 112 (65.5%) | 59 (34.5%) |
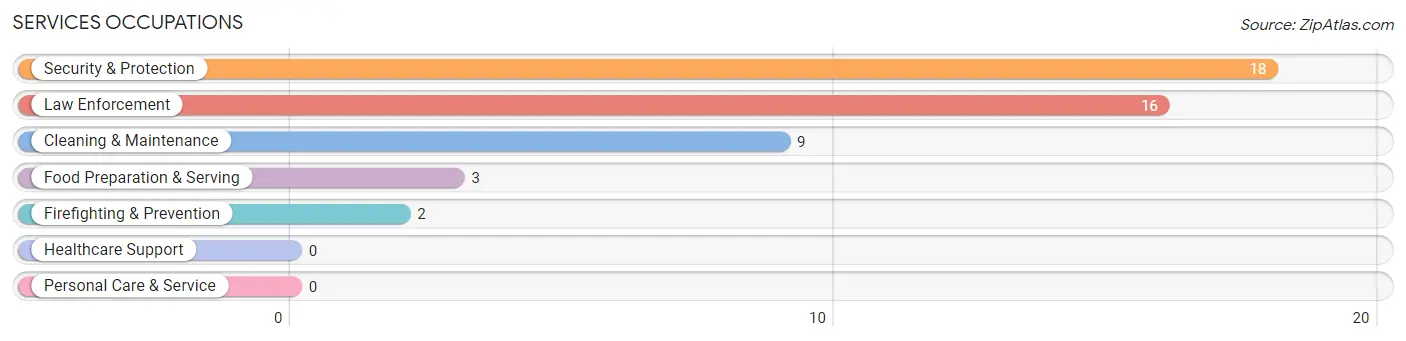
Services Occupations
The most common Services occupations in Veblen are Security & Protection (18 | 10.5%), Law Enforcement (16 | 9.4%), Cleaning & Maintenance (9 | 5.3%), Food Preparation & Serving (3 | 1.8%), and Firefighting & Prevention (2 | 1.2%).
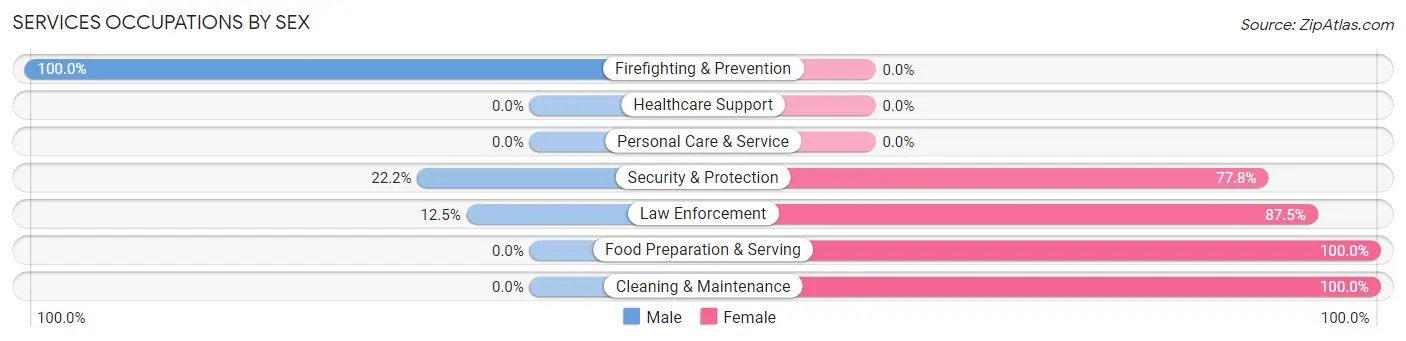
Services Occupations by Sex
Within the Services occupations in Veblen, the most male-oriented occupations are Firefighting & Prevention (100.0%), Security & Protection (22.2%), and Law Enforcement (12.5%), while the most female-oriented occupations are Food Preparation & Serving (100.0%), Cleaning & Maintenance (100.0%), and Law Enforcement (87.5%).
| Occupation | Male | Female |
| Healthcare Support | 0 (0.0%) | 0 (0.0%) |
| Security & Protection | 4 (22.2%) | 14 (77.8%) |
| Firefighting & Prevention | 2 (100.0%) | 0 (0.0%) |
| Law Enforcement | 2 (12.5%) | 14 (87.5%) |
| Food Preparation & Serving | 0 (0.0%) | 3 (100.0%) |
| Cleaning & Maintenance | 0 (0.0%) | 9 (100.0%) |
| Personal Care & Service | 0 (0.0%) | 0 (0.0%) |
| Total (Category) | 4 (13.3%) | 26 (86.7%) |
| Total (Overall) | 112 (65.5%) | 59 (34.5%) |
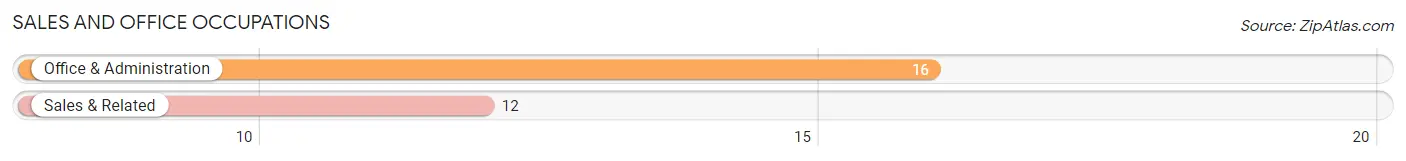
Sales and Office Occupations
The most common Sales and Office occupations in Veblen are Office & Administration (16 | 9.4%), and Sales & Related (12 | 7.0%).
Sales and Office Occupations by Sex
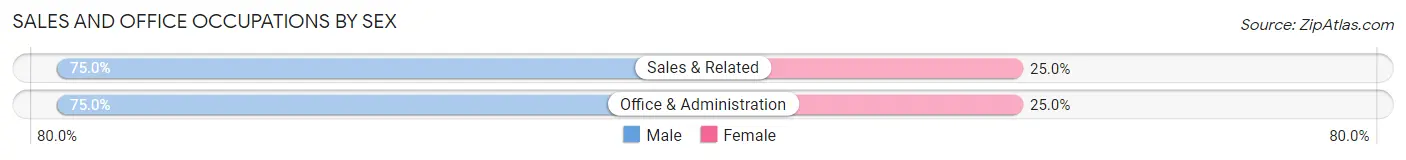
| Occupation | Male | Female |
| Sales & Related | 9 (75.0%) | 3 (25.0%) |
| Office & Administration | 12 (75.0%) | 4 (25.0%) |
| Total (Category) | 21 (75.0%) | 7 (25.0%) |
| Total (Overall) | 112 (65.5%) | 59 (34.5%) |
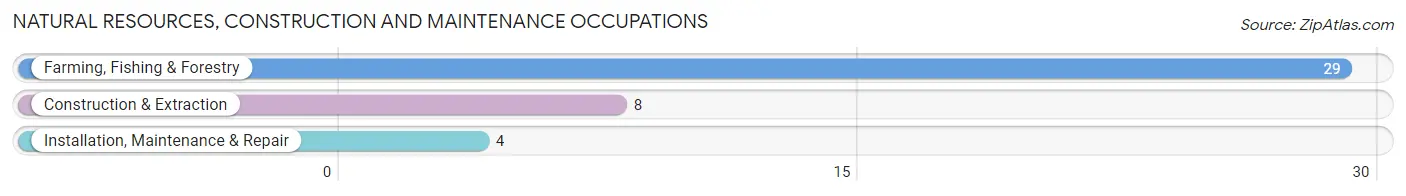
Natural Resources, Construction and Maintenance Occupations
The most common Natural Resources, Construction and Maintenance occupations in Veblen are Farming, Fishing & Forestry (29 | 17.0%), Construction & Extraction (8 | 4.7%), and Installation, Maintenance & Repair (4 | 2.3%).
Natural Resources, Construction and Maintenance Occupations by Sex
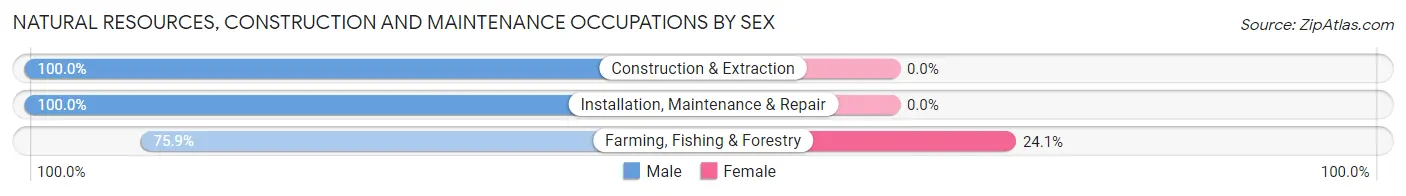
| Occupation | Male | Female |
| Farming, Fishing & Forestry | 22 (75.9%) | 7 (24.1%) |
| Construction & Extraction | 8 (100.0%) | 0 (0.0%) |
| Installation, Maintenance & Repair | 4 (100.0%) | 0 (0.0%) |
| Total (Category) | 34 (82.9%) | 7 (17.1%) |
| Total (Overall) | 112 (65.5%) | 59 (34.5%) |
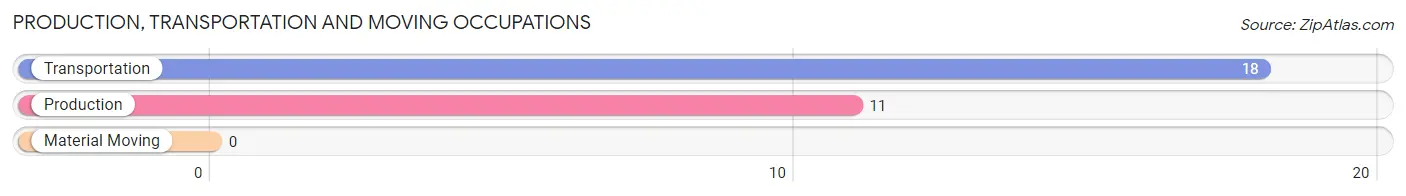
Production, Transportation and Moving Occupations
The most common Production, Transportation and Moving occupations in Veblen are Transportation (18 | 10.5%), and Production (11 | 6.4%).
Production, Transportation and Moving Occupations by Sex
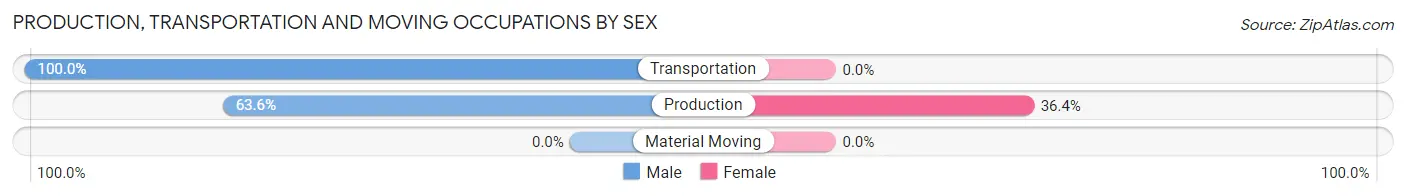
| Occupation | Male | Female |
| Production | 7 (63.6%) | 4 (36.4%) |
| Transportation | 18 (100.0%) | 0 (0.0%) |
| Material Moving | 0 (0.0%) | 0 (0.0%) |
| Total (Category) | 25 (86.2%) | 4 (13.8%) |
| Total (Overall) | 112 (65.5%) | 59 (34.5%) |
Employment Industries by Sex in Veblen
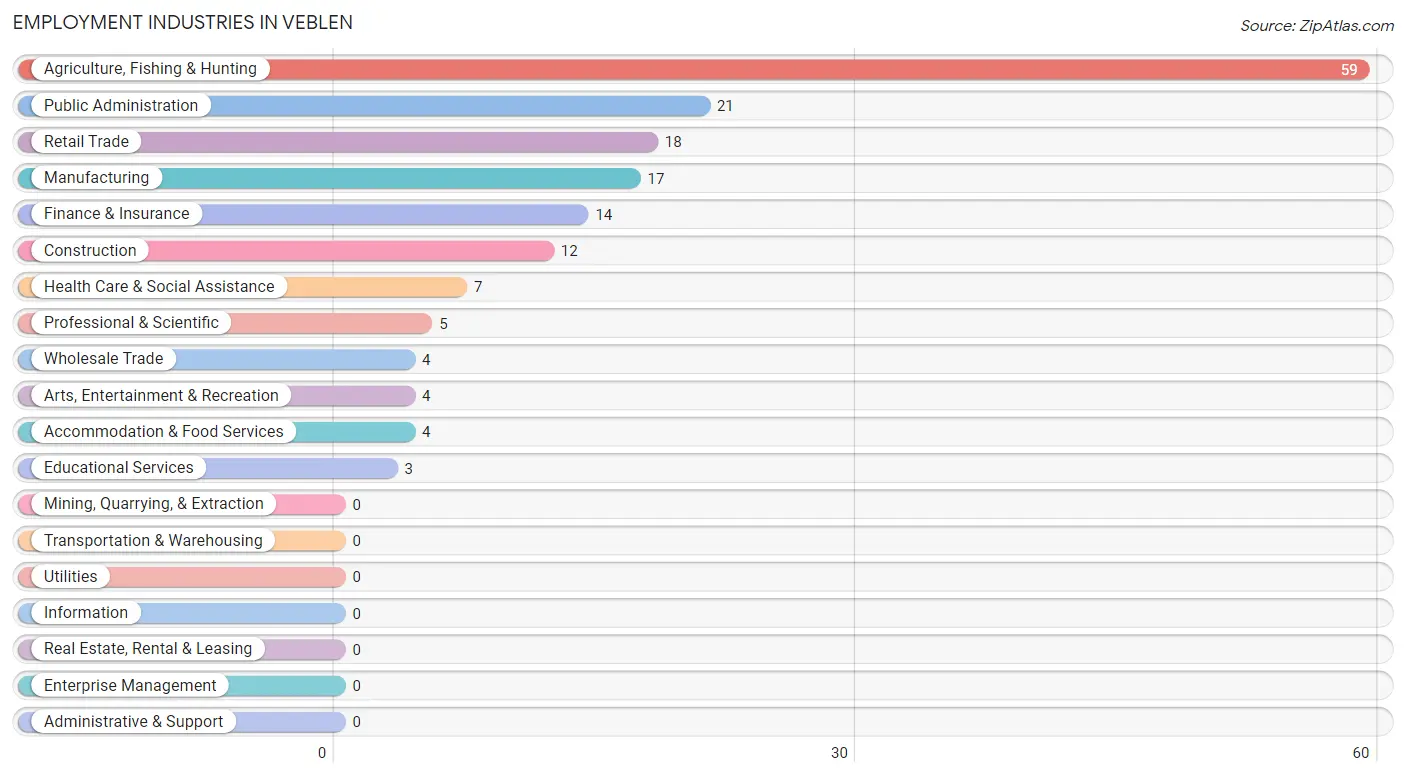
Employment Industries in Veblen
The major employment industries in Veblen include Agriculture, Fishing & Hunting (59 | 34.5%), Public Administration (21 | 12.3%), Retail Trade (18 | 10.5%), Manufacturing (17 | 9.9%), and Finance & Insurance (14 | 8.2%).
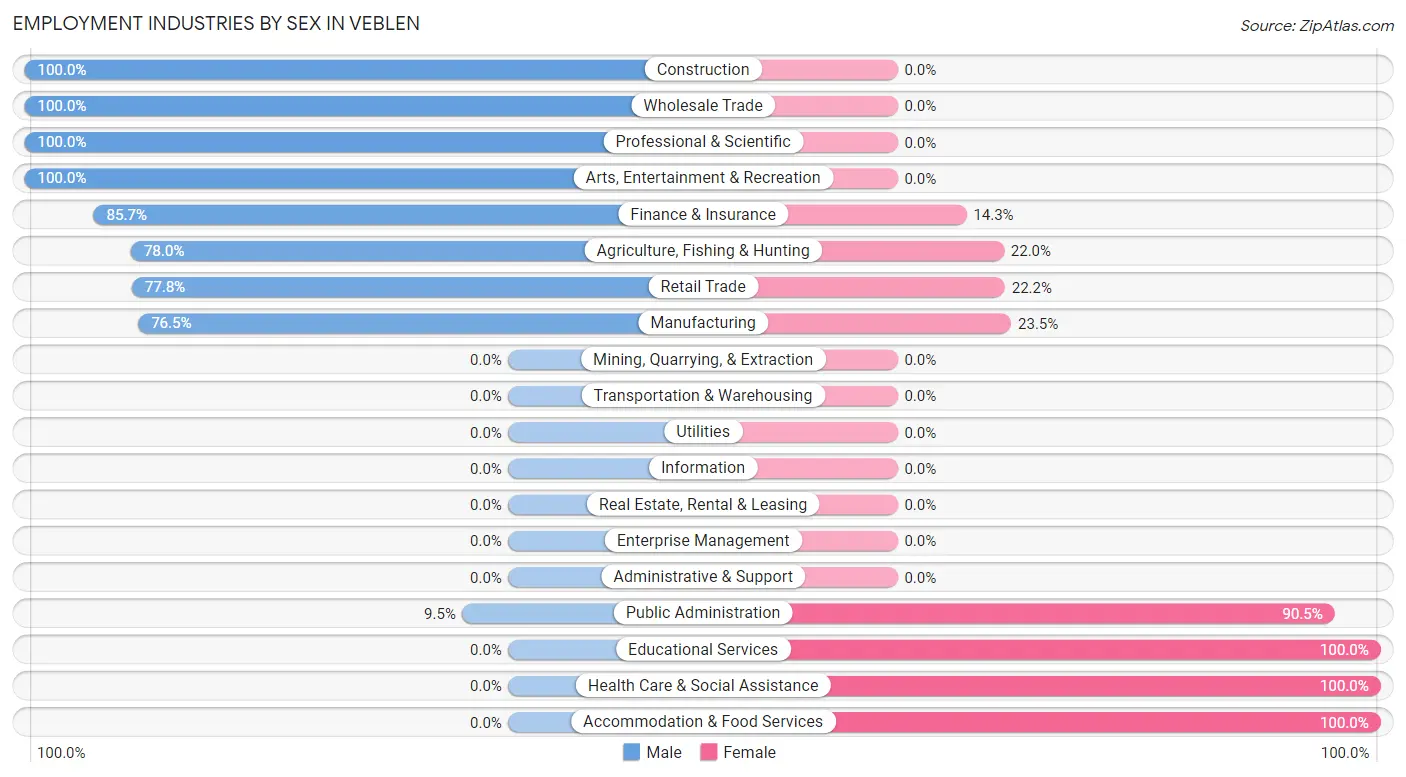
Employment Industries by Sex in Veblen
The Veblen industries that see more men than women are Construction (100.0%), Wholesale Trade (100.0%), and Professional & Scientific (100.0%), whereas the industries that tend to have a higher number of women are Educational Services (100.0%), Health Care & Social Assistance (100.0%), and Accommodation & Food Services (100.0%).
| Industry | Male | Female |
| Agriculture, Fishing & Hunting | 46 (78.0%) | 13 (22.0%) |
| Mining, Quarrying, & Extraction | 0 (0.0%) | 0 (0.0%) |
| Construction | 12 (100.0%) | 0 (0.0%) |
| Manufacturing | 13 (76.5%) | 4 (23.5%) |
| Wholesale Trade | 4 (100.0%) | 0 (0.0%) |
| Retail Trade | 14 (77.8%) | 4 (22.2%) |
| Transportation & Warehousing | 0 (0.0%) | 0 (0.0%) |
| Utilities | 0 (0.0%) | 0 (0.0%) |
| Information | 0 (0.0%) | 0 (0.0%) |
| Finance & Insurance | 12 (85.7%) | 2 (14.3%) |
| Real Estate, Rental & Leasing | 0 (0.0%) | 0 (0.0%) |
| Professional & Scientific | 5 (100.0%) | 0 (0.0%) |
| Enterprise Management | 0 (0.0%) | 0 (0.0%) |
| Administrative & Support | 0 (0.0%) | 0 (0.0%) |
| Educational Services | 0 (0.0%) | 3 (100.0%) |
| Health Care & Social Assistance | 0 (0.0%) | 7 (100.0%) |
| Arts, Entertainment & Recreation | 4 (100.0%) | 0 (0.0%) |
| Accommodation & Food Services | 0 (0.0%) | 4 (100.0%) |
| Public Administration | 2 (9.5%) | 19 (90.5%) |
| Total | 112 (65.5%) | 59 (34.5%) |
Education in Veblen
School Enrollment in Veblen
The most common levels of schooling among the 120 students in Veblen are elementary school (50 | 41.7%), middle school (34 | 28.3%), and college / undergraduate (21 | 17.5%).
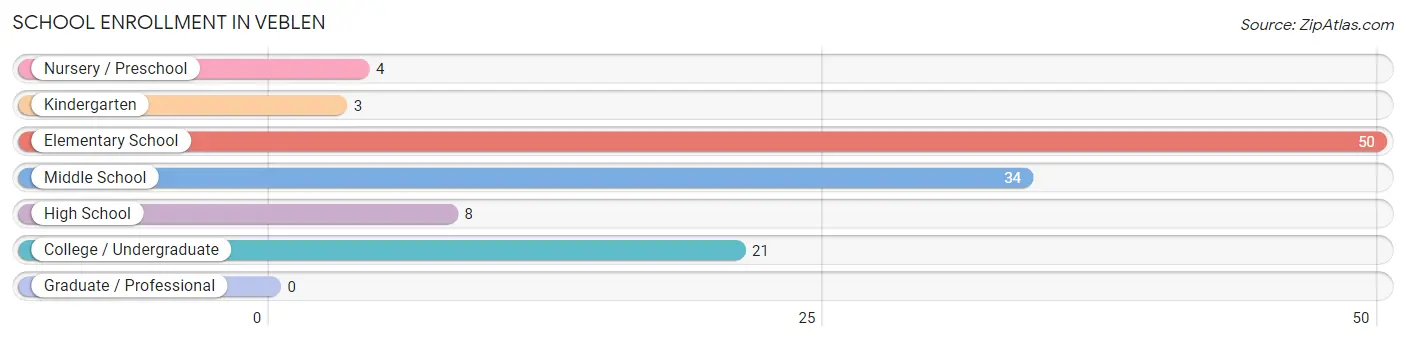
| School Level | # Students | % Students |
| Nursery / Preschool | 4 | 3.3% |
| Kindergarten | 3 | 2.5% |
| Elementary School | 50 | 41.7% |
| Middle School | 34 | 28.3% |
| High School | 8 | 6.7% |
| College / Undergraduate | 21 | 17.5% |
| Graduate / Professional | 0 | 0.0% |
| Total | 120 | 100.0% |
School Enrollment by Age by Funding Source in Veblen
Out of a total of 120 students who are enrolled in schools in Veblen, 2 (1.7%) attend a private institution, while the remaining 118 (98.3%) are enrolled in public schools. The age group of 25 to 34 year olds has the highest likelihood of being enrolled in private schools, with 2 (100.0% in the age bracket) enrolled. Conversely, the age group of 3 to 4 year olds has the lowest likelihood of being enrolled in a private school, with 2 (100.0% in the age bracket) attending a public institution.
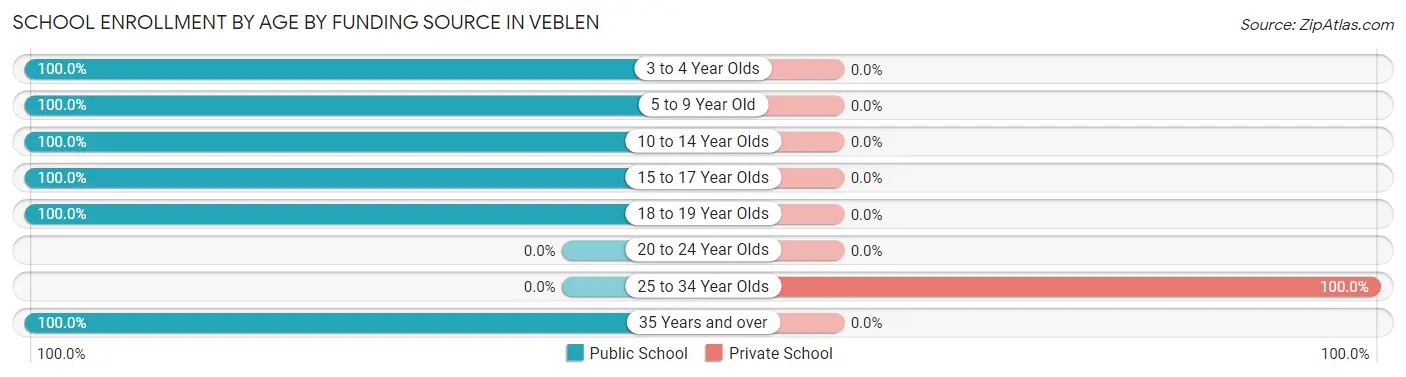
| Age Bracket | Public School | Private School |
| 3 to 4 Year Olds | 2 (100.0%) | 0 (0.0%) |
| 5 to 9 Year Old | 44 (100.0%) | 0 (0.0%) |
| 10 to 14 Year Olds | 45 (100.0%) | 0 (0.0%) |
| 15 to 17 Year Olds | 5 (100.0%) | 0 (0.0%) |
| 18 to 19 Year Olds | 20 (100.0%) | 0 (0.0%) |
| 20 to 24 Year Olds | 0 (0.0%) | 0 (0.0%) |
| 25 to 34 Year Olds | 0 (0.0%) | 2 (100.0%) |
| 35 Years and over | 2 (100.0%) | 0 (0.0%) |
| Total | 118 (98.3%) | 2 (1.7%) |
Educational Attainment by Field of Study in Veblen
Bio, nature & agricultural (24 | 39.3%), engineering (13 | 21.3%), social sciences (5 | 8.2%), science & technology (4 | 6.6%), and business (4 | 6.6%) are the most common fields of study among 61 individuals in Veblen who have obtained a bachelor's degree or higher.
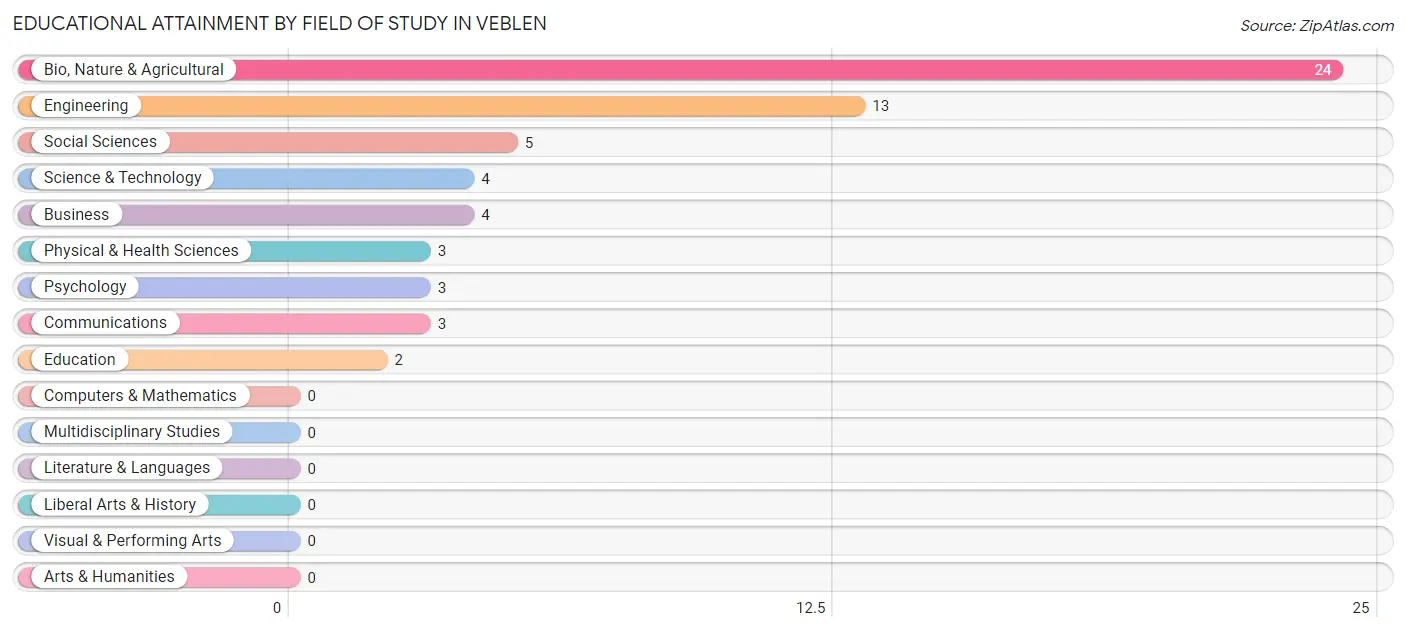
| Field of Study | # Graduates | % Graduates |
| Computers & Mathematics | 0 | 0.0% |
| Bio, Nature & Agricultural | 24 | 39.3% |
| Physical & Health Sciences | 3 | 4.9% |
| Psychology | 3 | 4.9% |
| Social Sciences | 5 | 8.2% |
| Engineering | 13 | 21.3% |
| Multidisciplinary Studies | 0 | 0.0% |
| Science & Technology | 4 | 6.6% |
| Business | 4 | 6.6% |
| Education | 2 | 3.3% |
| Literature & Languages | 0 | 0.0% |
| Liberal Arts & History | 0 | 0.0% |
| Visual & Performing Arts | 0 | 0.0% |
| Communications | 3 | 4.9% |
| Arts & Humanities | 0 | 0.0% |
| Total | 61 | 100.0% |
Transportation & Commute in Veblen
Vehicle Availability by Sex in Veblen
The most prevalent vehicle ownership categories in Veblen are males with 2 vehicles (49, accounting for 45.8%) and females with 2 vehicles (8, making up 83.1%).
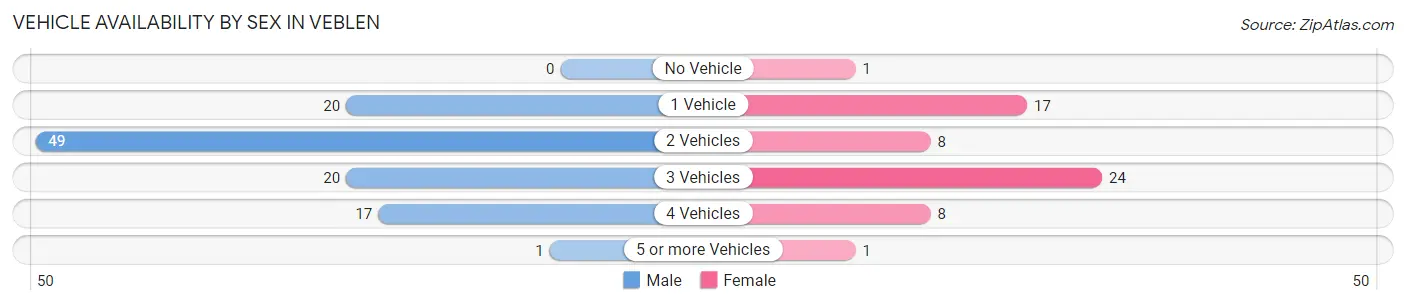
| Vehicles Available | Male | Female |
| No Vehicle | 0 (0.0%) | 1 (1.7%) |
| 1 Vehicle | 20 (18.7%) | 17 (28.8%) |
| 2 Vehicles | 49 (45.8%) | 8 (13.6%) |
| 3 Vehicles | 20 (18.7%) | 24 (40.7%) |
| 4 Vehicles | 17 (15.9%) | 8 (13.6%) |
| 5 or more Vehicles | 1 (0.9%) | 1 (1.7%) |
| Total | 107 (100.0%) | 59 (100.0%) |
Commute Time in Veblen
The most frequently occuring commute durations in Veblen are 5 to 9 minutes (54 commuters, 32.5%), 30 to 34 minutes (40 commuters, 24.1%), and 10 to 14 minutes (24 commuters, 14.5%).
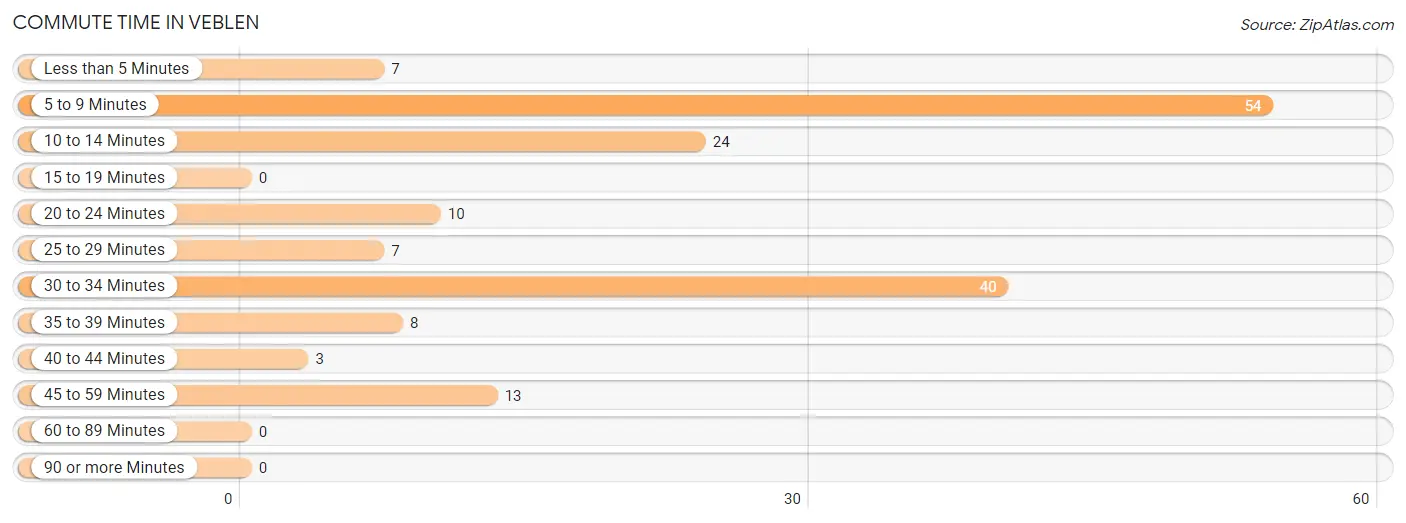
| Commute Time | # Commuters | % Commuters |
| Less than 5 Minutes | 7 | 4.2% |
| 5 to 9 Minutes | 54 | 32.5% |
| 10 to 14 Minutes | 24 | 14.5% |
| 15 to 19 Minutes | 0 | 0.0% |
| 20 to 24 Minutes | 10 | 6.0% |
| 25 to 29 Minutes | 7 | 4.2% |
| 30 to 34 Minutes | 40 | 24.1% |
| 35 to 39 Minutes | 8 | 4.8% |
| 40 to 44 Minutes | 3 | 1.8% |
| 45 to 59 Minutes | 13 | 7.8% |
| 60 to 89 Minutes | 0 | 0.0% |
| 90 or more Minutes | 0 | 0.0% |
Commute Time by Sex in Veblen
The most common commute times in Veblen are 5 to 9 minutes (34 commuters, 31.8%) for males and 30 to 34 minutes (22 commuters, 37.3%) for females.
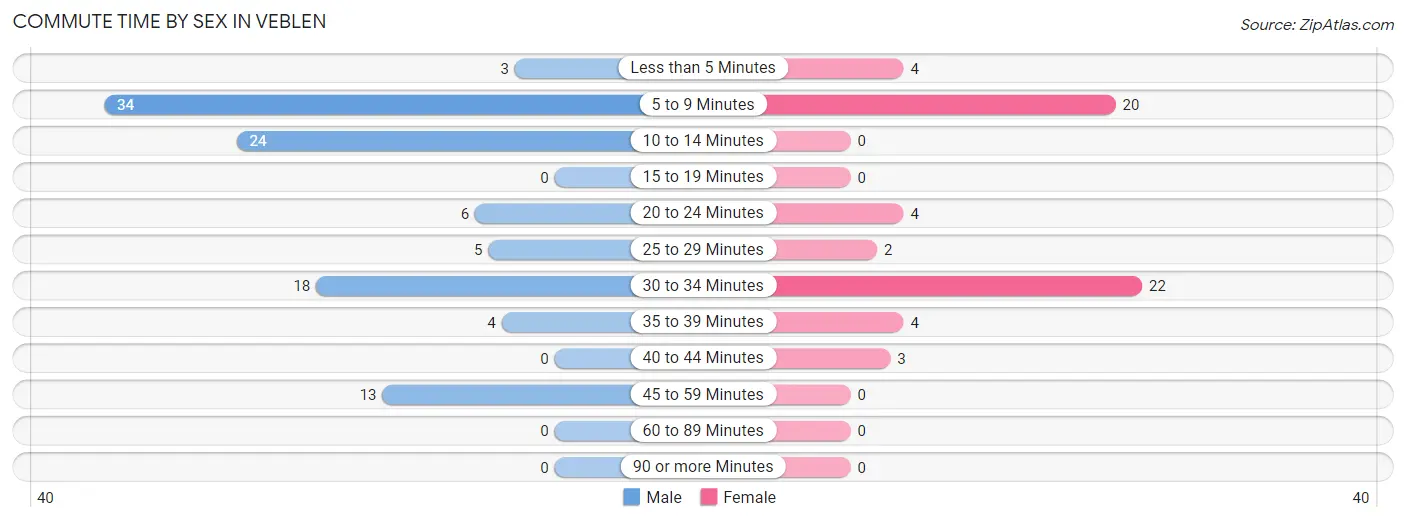
| Commute Time | Male | Female |
| Less than 5 Minutes | 3 (2.8%) | 4 (6.8%) |
| 5 to 9 Minutes | 34 (31.8%) | 20 (33.9%) |
| 10 to 14 Minutes | 24 (22.4%) | 0 (0.0%) |
| 15 to 19 Minutes | 0 (0.0%) | 0 (0.0%) |
| 20 to 24 Minutes | 6 (5.6%) | 4 (6.8%) |
| 25 to 29 Minutes | 5 (4.7%) | 2 (3.4%) |
| 30 to 34 Minutes | 18 (16.8%) | 22 (37.3%) |
| 35 to 39 Minutes | 4 (3.7%) | 4 (6.8%) |
| 40 to 44 Minutes | 0 (0.0%) | 3 (5.1%) |
| 45 to 59 Minutes | 13 (12.1%) | 0 (0.0%) |
| 60 to 89 Minutes | 0 (0.0%) | 0 (0.0%) |
| 90 or more Minutes | 0 (0.0%) | 0 (0.0%) |
Time of Departure to Work by Sex in Veblen
The most frequent times of departure to work in Veblen are 6:00 AM to 6:29 AM (30, 28.0%) for males and 12:00 PM to 3:59 PM (14, 23.7%) for females.
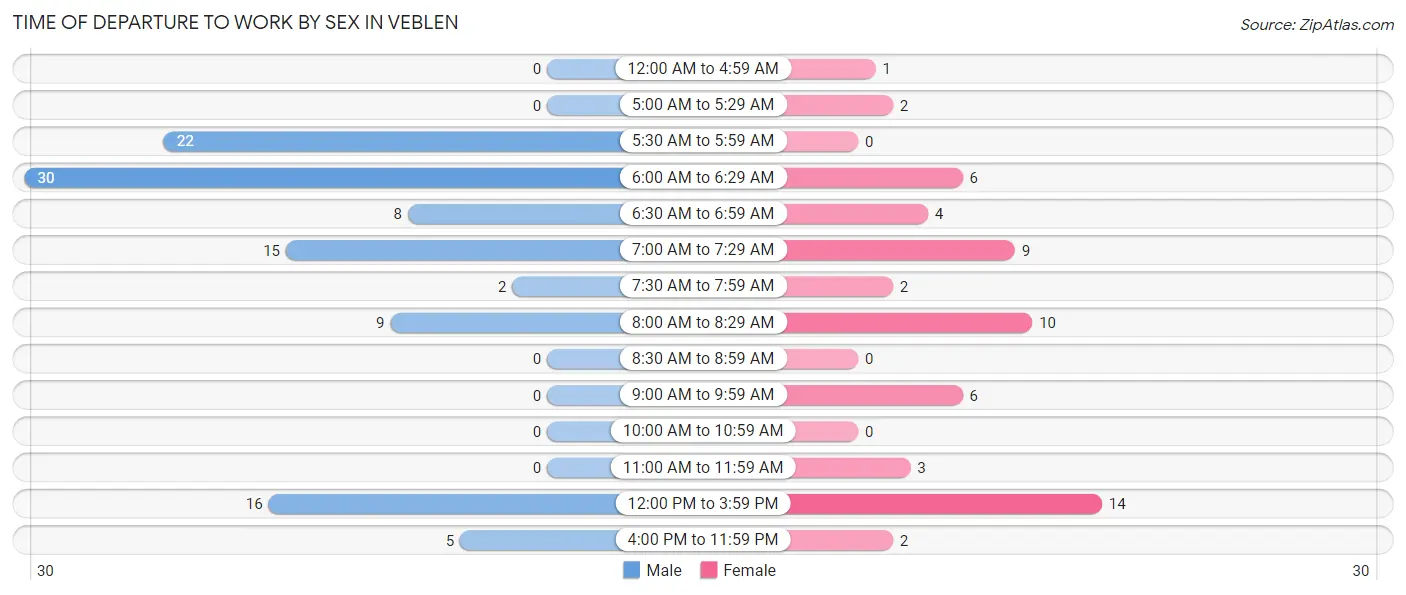
| Time of Departure | Male | Female |
| 12:00 AM to 4:59 AM | 0 (0.0%) | 1 (1.7%) |
| 5:00 AM to 5:29 AM | 0 (0.0%) | 2 (3.4%) |
| 5:30 AM to 5:59 AM | 22 (20.6%) | 0 (0.0%) |
| 6:00 AM to 6:29 AM | 30 (28.0%) | 6 (10.2%) |
| 6:30 AM to 6:59 AM | 8 (7.5%) | 4 (6.8%) |
| 7:00 AM to 7:29 AM | 15 (14.0%) | 9 (15.2%) |
| 7:30 AM to 7:59 AM | 2 (1.9%) | 2 (3.4%) |
| 8:00 AM to 8:29 AM | 9 (8.4%) | 10 (17.0%) |
| 8:30 AM to 8:59 AM | 0 (0.0%) | 0 (0.0%) |
| 9:00 AM to 9:59 AM | 0 (0.0%) | 6 (10.2%) |
| 10:00 AM to 10:59 AM | 0 (0.0%) | 0 (0.0%) |
| 11:00 AM to 11:59 AM | 0 (0.0%) | 3 (5.1%) |
| 12:00 PM to 3:59 PM | 16 (14.9%) | 14 (23.7%) |
| 4:00 PM to 11:59 PM | 5 (4.7%) | 2 (3.4%) |
| Total | 107 (100.0%) | 59 (100.0%) |
Housing Occupancy in Veblen
Occupancy by Ownership in Veblen
Of the total 154 dwellings in Veblen, owner-occupied units account for 82 (53.2%), while renter-occupied units make up 72 (46.8%).
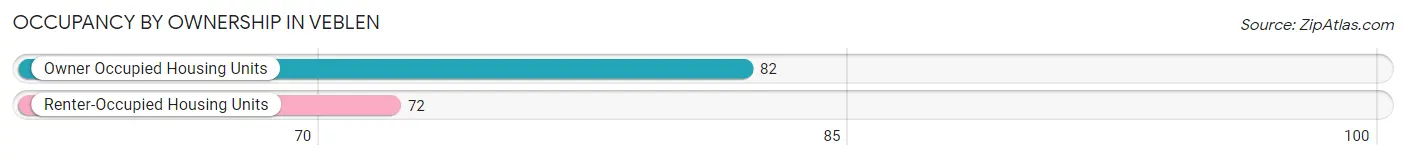
| Occupancy | # Housing Units | % Housing Units |
| Owner Occupied Housing Units | 82 | 53.2% |
| Renter-Occupied Housing Units | 72 | 46.8% |
| Total Occupied Housing Units | 154 | 100.0% |
Occupancy by Household Size in Veblen
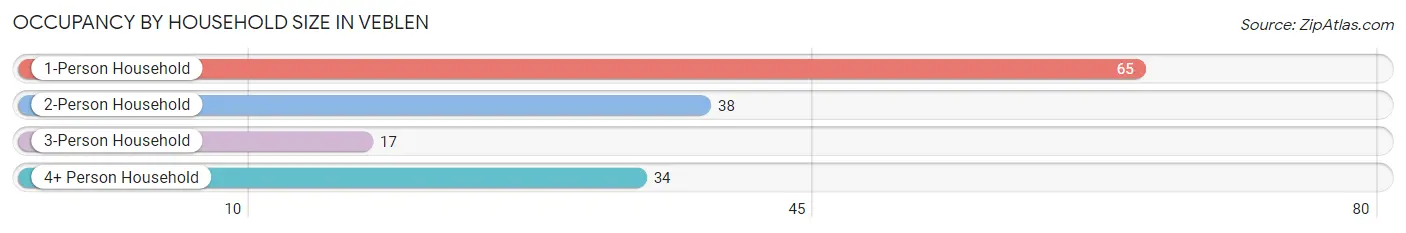
| Household Size | # Housing Units | % Housing Units |
| 1-Person Household | 65 | 42.2% |
| 2-Person Household | 38 | 24.7% |
| 3-Person Household | 17 | 11.0% |
| 4+ Person Household | 34 | 22.1% |
| Total Housing Units | 154 | 100.0% |
Occupancy by Ownership by Household Size in Veblen
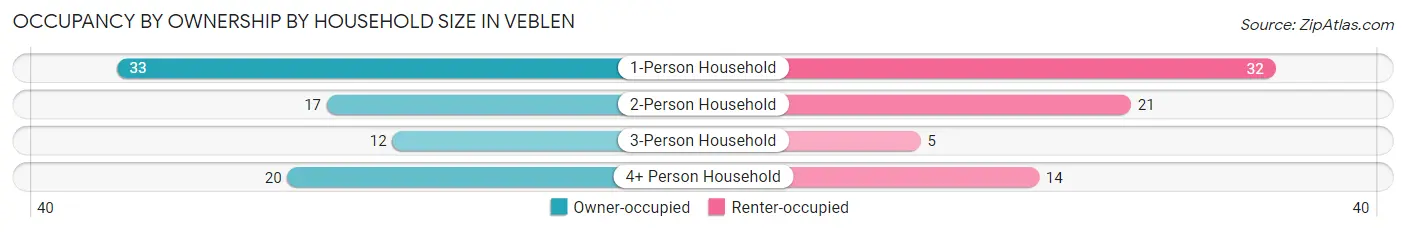
| Household Size | Owner-occupied | Renter-occupied |
| 1-Person Household | 33 (50.8%) | 32 (49.2%) |
| 2-Person Household | 17 (44.7%) | 21 (55.3%) |
| 3-Person Household | 12 (70.6%) | 5 (29.4%) |
| 4+ Person Household | 20 (58.8%) | 14 (41.2%) |
| Total Housing Units | 82 (53.2%) | 72 (46.8%) |
Occupancy by Educational Attainment in Veblen
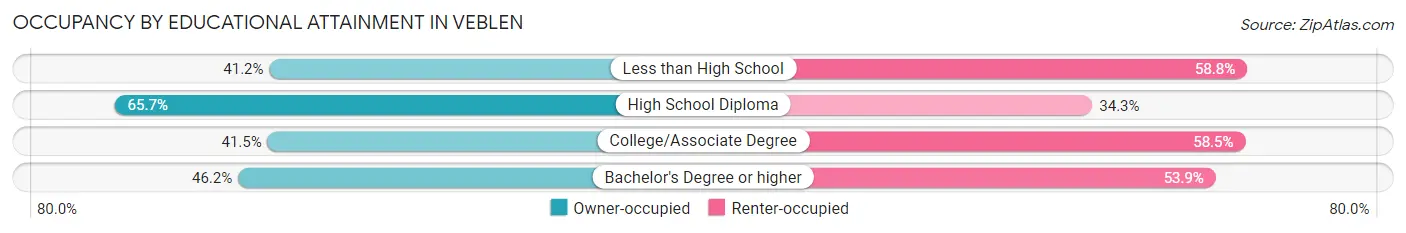
| Household Size | Owner-occupied | Renter-occupied |
| Less than High School | 7 (41.2%) | 10 (58.8%) |
| High School Diploma | 46 (65.7%) | 24 (34.3%) |
| College/Associate Degree | 17 (41.5%) | 24 (58.5%) |
| Bachelor's Degree or higher | 12 (46.2%) | 14 (53.8%) |
Occupancy by Age of Householder in Veblen
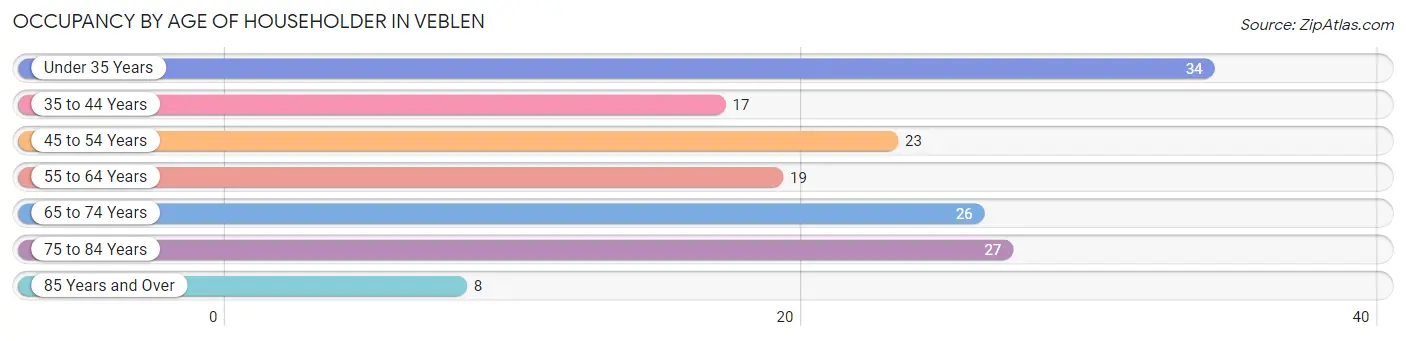
| Age Bracket | # Households | % Households |
| Under 35 Years | 34 | 22.1% |
| 35 to 44 Years | 17 | 11.0% |
| 45 to 54 Years | 23 | 14.9% |
| 55 to 64 Years | 19 | 12.3% |
| 65 to 74 Years | 26 | 16.9% |
| 75 to 84 Years | 27 | 17.5% |
| 85 Years and Over | 8 | 5.2% |
| Total | 154 | 100.0% |
Housing Finances in Veblen
Median Income by Occupancy in Veblen
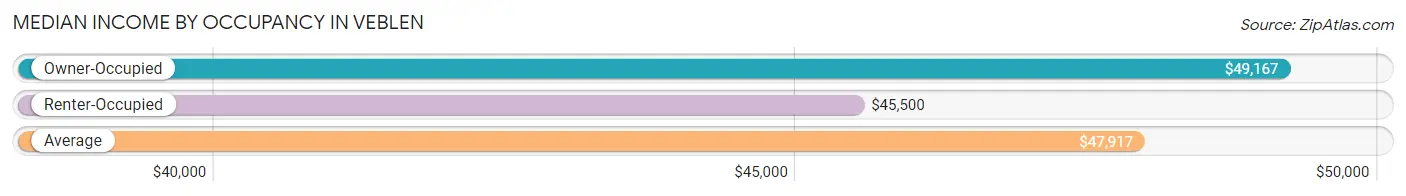
| Occupancy Type | # Households | Median Income |
| Owner-Occupied | 82 (53.2%) | $49,167 |
| Renter-Occupied | 72 (46.8%) | $45,500 |
| Average | 154 (100.0%) | $47,917 |
Occupancy by Householder Income Bracket in Veblen
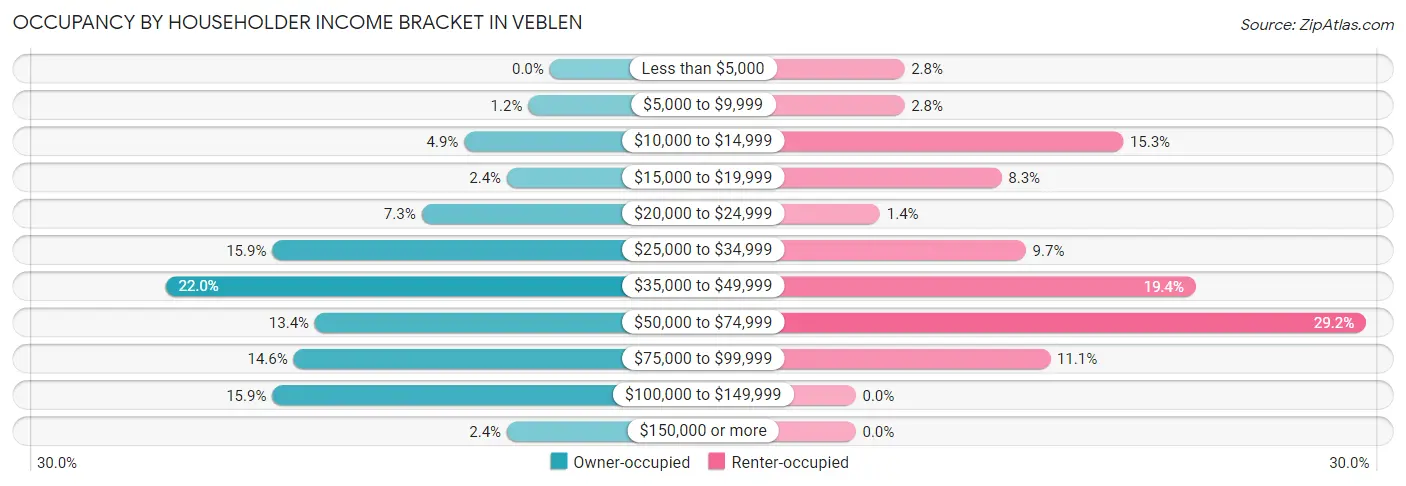
| Income Bracket | Owner-occupied | Renter-occupied |
| Less than $5,000 | 0 (0.0%) | 2 (2.8%) |
| $5,000 to $9,999 | 1 (1.2%) | 2 (2.8%) |
| $10,000 to $14,999 | 4 (4.9%) | 11 (15.3%) |
| $15,000 to $19,999 | 2 (2.4%) | 6 (8.3%) |
| $20,000 to $24,999 | 6 (7.3%) | 1 (1.4%) |
| $25,000 to $34,999 | 13 (15.9%) | 7 (9.7%) |
| $35,000 to $49,999 | 18 (22.0%) | 14 (19.4%) |
| $50,000 to $74,999 | 11 (13.4%) | 21 (29.2%) |
| $75,000 to $99,999 | 12 (14.6%) | 8 (11.1%) |
| $100,000 to $149,999 | 13 (15.9%) | 0 (0.0%) |
| $150,000 or more | 2 (2.4%) | 0 (0.0%) |
| Total | 82 (100.0%) | 72 (100.0%) |
Monthly Housing Cost Tiers in Veblen
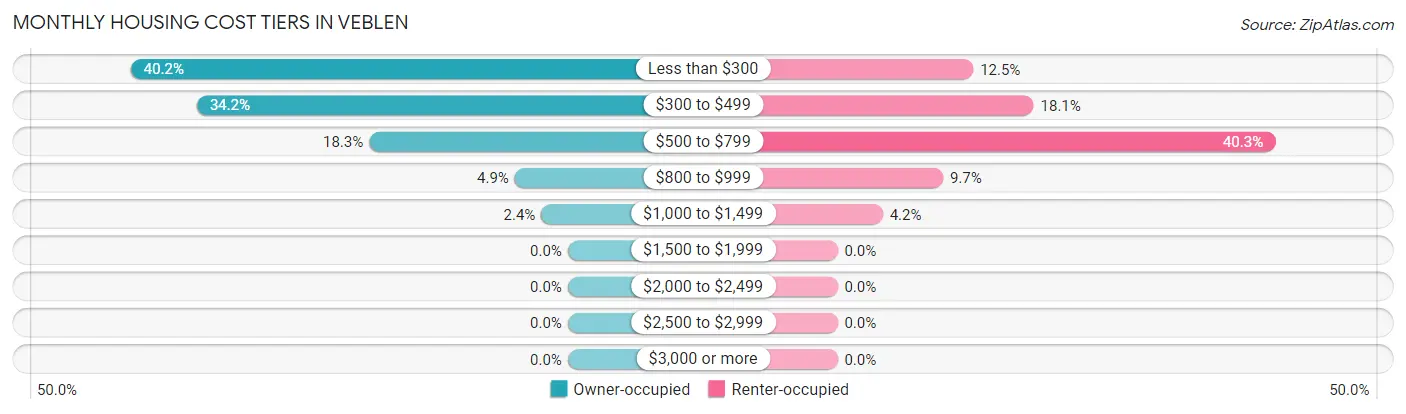
| Monthly Cost | Owner-occupied | Renter-occupied |
| Less than $300 | 33 (40.2%) | 9 (12.5%) |
| $300 to $499 | 28 (34.2%) | 13 (18.1%) |
| $500 to $799 | 15 (18.3%) | 29 (40.3%) |
| $800 to $999 | 4 (4.9%) | 7 (9.7%) |
| $1,000 to $1,499 | 2 (2.4%) | 3 (4.2%) |
| $1,500 to $1,999 | 0 (0.0%) | 0 (0.0%) |
| $2,000 to $2,499 | 0 (0.0%) | 0 (0.0%) |
| $2,500 to $2,999 | 0 (0.0%) | 0 (0.0%) |
| $3,000 or more | 0 (0.0%) | 0 (0.0%) |
| Total | 82 (100.0%) | 72 (100.0%) |
Physical Housing Characteristics in Veblen
Housing Structures in Veblen
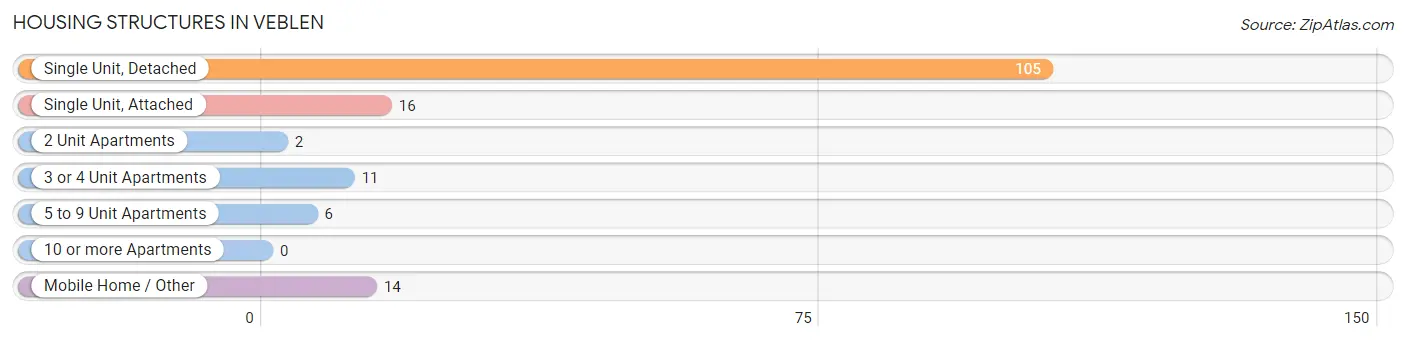
| Structure Type | # Housing Units | % Housing Units |
| Single Unit, Detached | 105 | 68.2% |
| Single Unit, Attached | 16 | 10.4% |
| 2 Unit Apartments | 2 | 1.3% |
| 3 or 4 Unit Apartments | 11 | 7.1% |
| 5 to 9 Unit Apartments | 6 | 3.9% |
| 10 or more Apartments | 0 | 0.0% |
| Mobile Home / Other | 14 | 9.1% |
| Total | 154 | 100.0% |
Housing Structures by Occupancy in Veblen
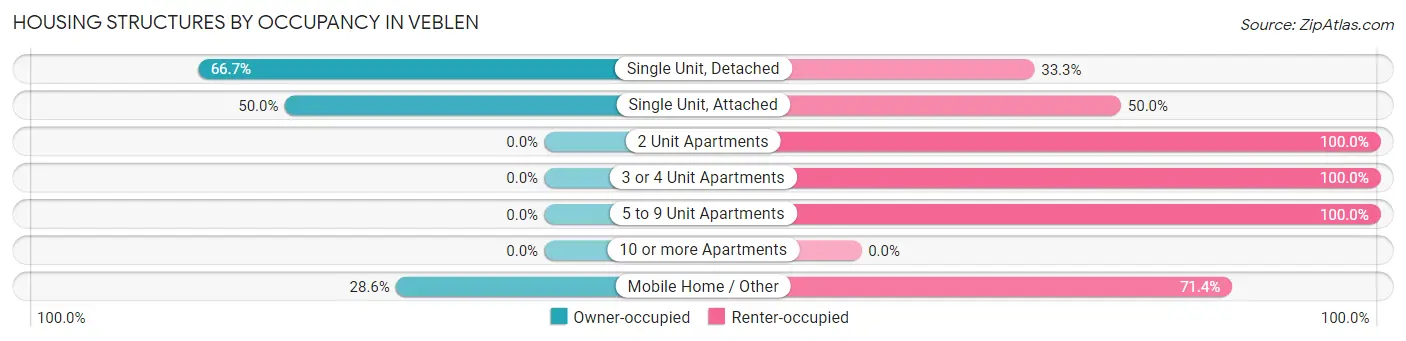
| Structure Type | Owner-occupied | Renter-occupied |
| Single Unit, Detached | 70 (66.7%) | 35 (33.3%) |
| Single Unit, Attached | 8 (50.0%) | 8 (50.0%) |
| 2 Unit Apartments | 0 (0.0%) | 2 (100.0%) |
| 3 or 4 Unit Apartments | 0 (0.0%) | 11 (100.0%) |
| 5 to 9 Unit Apartments | 0 (0.0%) | 6 (100.0%) |
| 10 or more Apartments | 0 (0.0%) | 0 (0.0%) |
| Mobile Home / Other | 4 (28.6%) | 10 (71.4%) |
| Total | 82 (53.2%) | 72 (46.8%) |
Housing Structures by Number of Rooms in Veblen
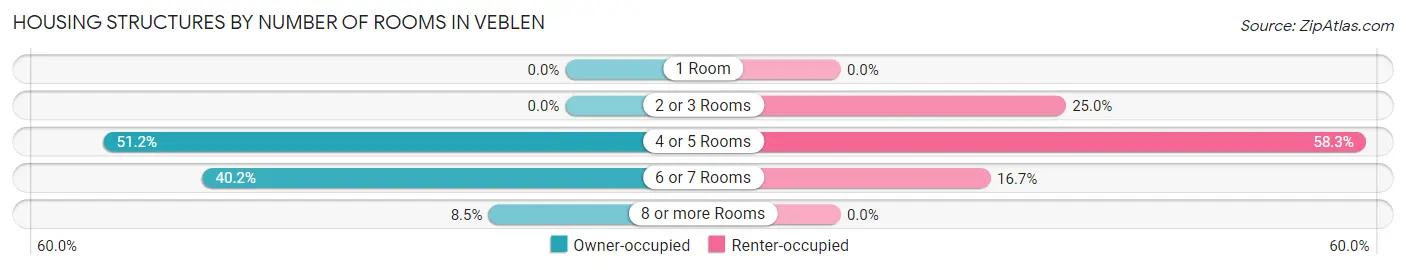
| Number of Rooms | Owner-occupied | Renter-occupied |
| 1 Room | 0 (0.0%) | 0 (0.0%) |
| 2 or 3 Rooms | 0 (0.0%) | 18 (25.0%) |
| 4 or 5 Rooms | 42 (51.2%) | 42 (58.3%) |
| 6 or 7 Rooms | 33 (40.2%) | 12 (16.7%) |
| 8 or more Rooms | 7 (8.5%) | 0 (0.0%) |
| Total | 82 (100.0%) | 72 (100.0%) |
Housing Structure by Heating Type in Veblen
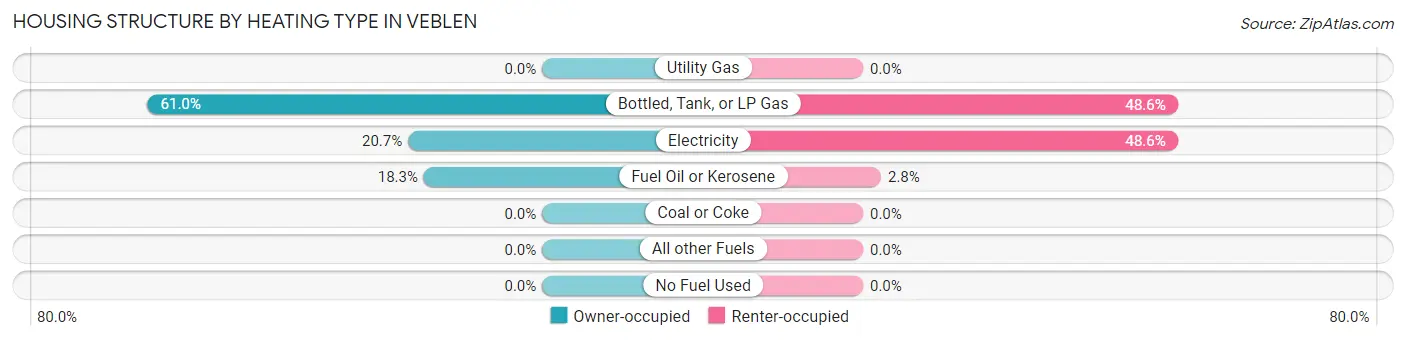
| Heating Type | Owner-occupied | Renter-occupied |
| Utility Gas | 0 (0.0%) | 0 (0.0%) |
| Bottled, Tank, or LP Gas | 50 (61.0%) | 35 (48.6%) |
| Electricity | 17 (20.7%) | 35 (48.6%) |
| Fuel Oil or Kerosene | 15 (18.3%) | 2 (2.8%) |
| Coal or Coke | 0 (0.0%) | 0 (0.0%) |
| All other Fuels | 0 (0.0%) | 0 (0.0%) |
| No Fuel Used | 0 (0.0%) | 0 (0.0%) |
| Total | 82 (100.0%) | 72 (100.0%) |
Household Vehicle Usage in Veblen
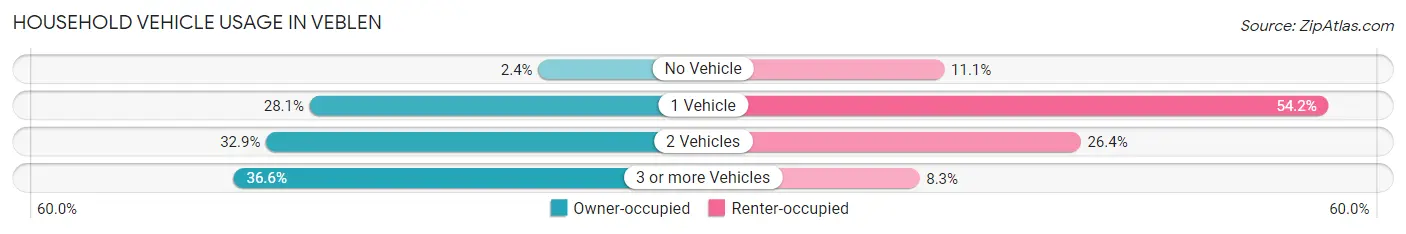
| Vehicles per Household | Owner-occupied | Renter-occupied |
| No Vehicle | 2 (2.4%) | 8 (11.1%) |
| 1 Vehicle | 23 (28.1%) | 39 (54.2%) |
| 2 Vehicles | 27 (32.9%) | 19 (26.4%) |
| 3 or more Vehicles | 30 (36.6%) | 6 (8.3%) |
| Total | 82 (100.0%) | 72 (100.0%) |
Real Estate & Mortgages in Veblen
Real Estate and Mortgage Overview in Veblen
| Characteristic | Without Mortgage | With Mortgage |
| Housing Units | 70 | 12 |
| Median Property Value | - | - |
| Median Household Income | $48,611 | $0 |
| Monthly Housing Costs | $314 | $0 |
| Real Estate Taxes | $381 | $0 |
Property Value by Mortgage Status in Veblen
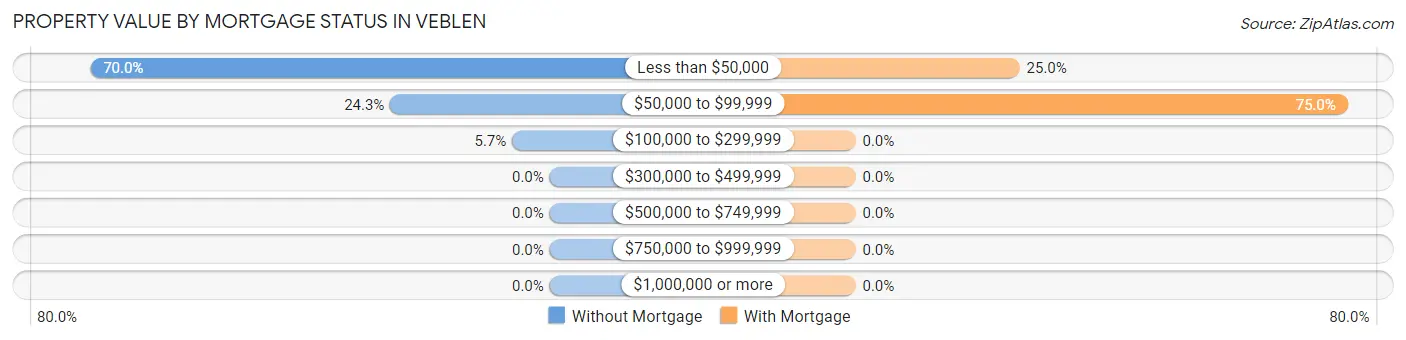
| Property Value | Without Mortgage | With Mortgage |
| Less than $50,000 | 49 (70.0%) | 3 (25.0%) |
| $50,000 to $99,999 | 17 (24.3%) | 9 (75.0%) |
| $100,000 to $299,999 | 4 (5.7%) | 0 (0.0%) |
| $300,000 to $499,999 | 0 (0.0%) | 0 (0.0%) |
| $500,000 to $749,999 | 0 (0.0%) | 0 (0.0%) |
| $750,000 to $999,999 | 0 (0.0%) | 0 (0.0%) |
| $1,000,000 or more | 0 (0.0%) | 0 (0.0%) |
| Total | 70 (100.0%) | 12 (100.0%) |
Household Income by Mortgage Status in Veblen
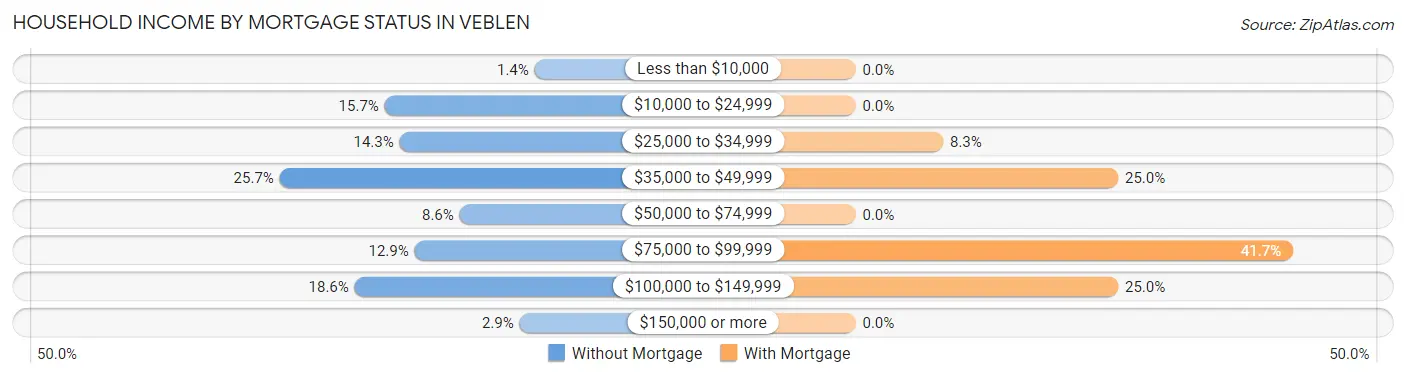
| Household Income | Without Mortgage | With Mortgage |
| Less than $10,000 | 1 (1.4%) | 0 (0.0%) |
| $10,000 to $24,999 | 11 (15.7%) | 0 (0.0%) |
| $25,000 to $34,999 | 10 (14.3%) | 1 (8.3%) |
| $35,000 to $49,999 | 18 (25.7%) | 3 (25.0%) |
| $50,000 to $74,999 | 6 (8.6%) | 0 (0.0%) |
| $75,000 to $99,999 | 9 (12.9%) | 5 (41.7%) |
| $100,000 to $149,999 | 13 (18.6%) | 3 (25.0%) |
| $150,000 or more | 2 (2.9%) | 0 (0.0%) |
| Total | 70 (100.0%) | 12 (100.0%) |
Property Value to Household Income Ratio in Veblen
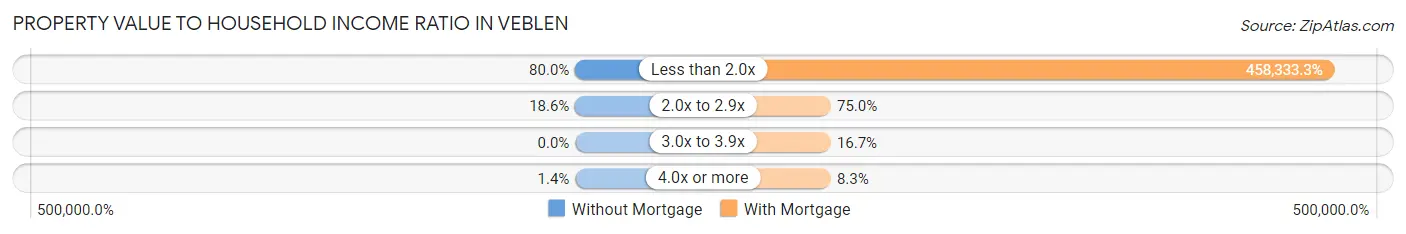
| Value-to-Income Ratio | Without Mortgage | With Mortgage |
| Less than 2.0x | 56 (80.0%) | 55,000 (458,333.3%) |
| 2.0x to 2.9x | 13 (18.6%) | 9 (75.0%) |
| 3.0x to 3.9x | 0 (0.0%) | 2 (16.7%) |
| 4.0x or more | 1 (1.4%) | 1 (8.3%) |
| Total | 70 (100.0%) | 12 (100.0%) |
Real Estate Taxes by Mortgage Status in Veblen
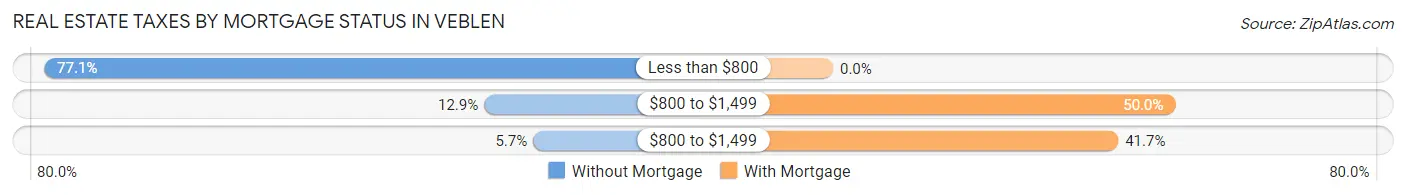
| Property Taxes | Without Mortgage | With Mortgage |
| Less than $800 | 54 (77.1%) | 0 (0.0%) |
| $800 to $1,499 | 9 (12.9%) | 6 (50.0%) |
| $800 to $1,499 | 4 (5.7%) | 5 (41.7%) |
| Total | 70 (100.0%) | 12 (100.0%) |
Health & Disability in Veblen
Health Insurance Coverage by Age in Veblen
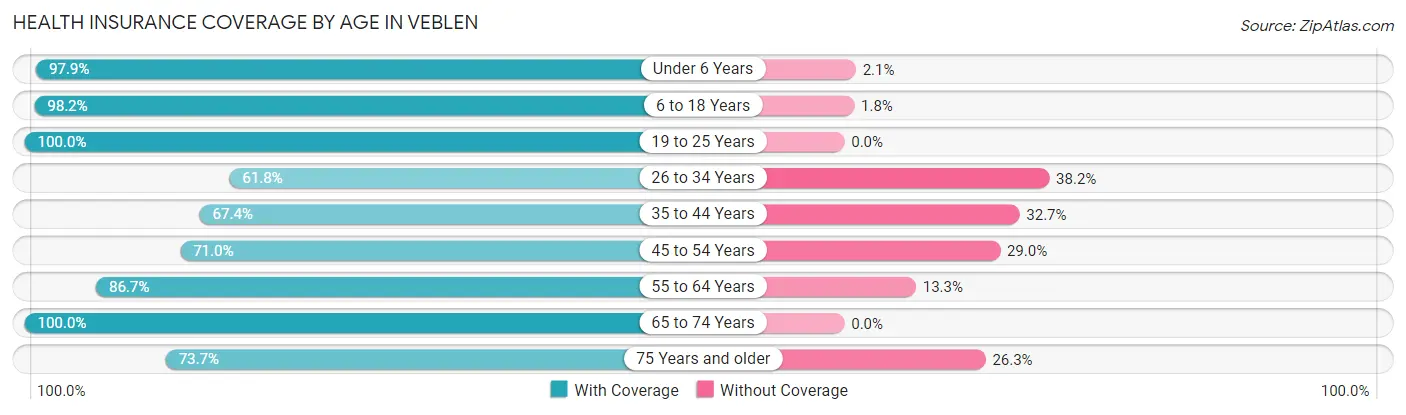
| Age Bracket | With Coverage | Without Coverage |
| Under 6 Years | 46 (97.9%) | 1 (2.1%) |
| 6 to 18 Years | 107 (98.2%) | 2 (1.8%) |
| 19 to 25 Years | 13 (100.0%) | 0 (0.0%) |
| 26 to 34 Years | 55 (61.8%) | 34 (38.2%) |
| 35 to 44 Years | 33 (67.3%) | 16 (32.7%) |
| 45 to 54 Years | 22 (71.0%) | 9 (29.0%) |
| 55 to 64 Years | 39 (86.7%) | 6 (13.3%) |
| 65 to 74 Years | 32 (100.0%) | 0 (0.0%) |
| 75 Years and older | 42 (73.7%) | 15 (26.3%) |
| Total | 389 (82.4%) | 83 (17.6%) |
Health Insurance Coverage by Citizenship Status in Veblen
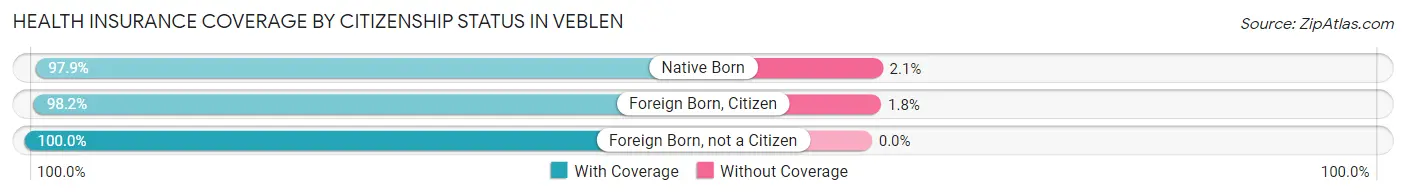
| Citizenship Status | With Coverage | Without Coverage |
| Native Born | 46 (97.9%) | 1 (2.1%) |
| Foreign Born, Citizen | 107 (98.2%) | 2 (1.8%) |
| Foreign Born, not a Citizen | 13 (100.0%) | 0 (0.0%) |
Health Insurance Coverage by Household Income in Veblen
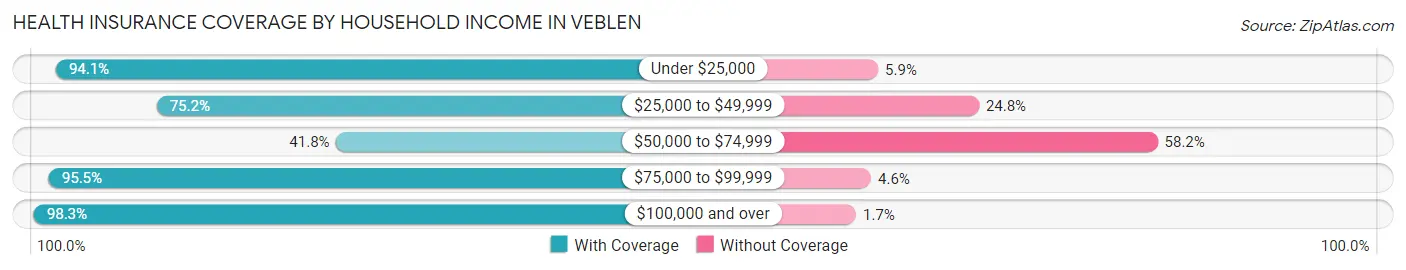
| Household Income | With Coverage | Without Coverage |
| Under $25,000 | 80 (94.1%) | 5 (5.9%) |
| $25,000 to $49,999 | 79 (75.2%) | 26 (24.8%) |
| $50,000 to $74,999 | 33 (41.8%) | 46 (58.2%) |
| $75,000 to $99,999 | 84 (95.5%) | 4 (4.5%) |
| $100,000 and over | 113 (98.3%) | 2 (1.7%) |
Public vs Private Health Insurance Coverage by Age in Veblen
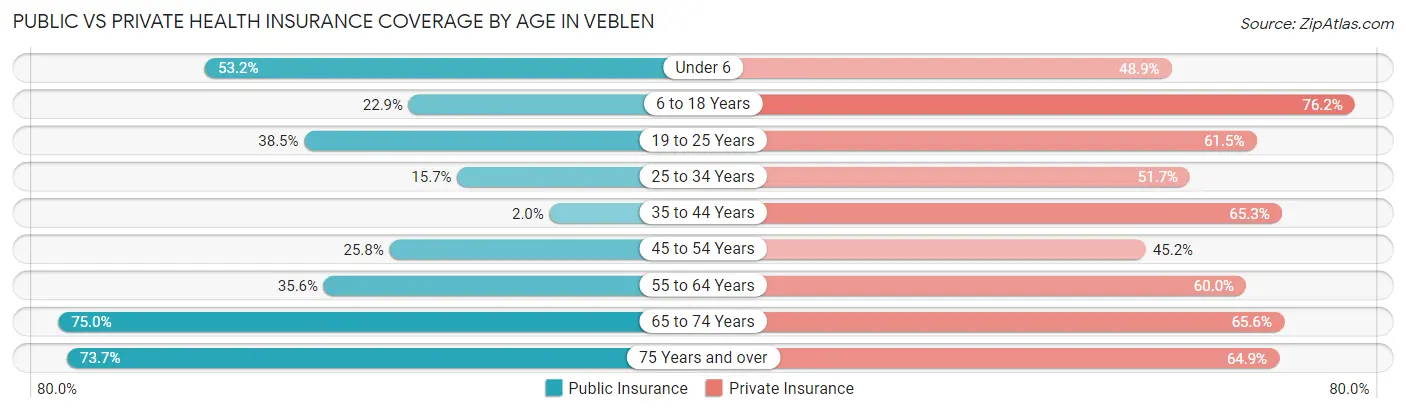
| Age Bracket | Public Insurance | Private Insurance |
| Under 6 | 25 (53.2%) | 23 (48.9%) |
| 6 to 18 Years | 25 (22.9%) | 83 (76.1%) |
| 19 to 25 Years | 5 (38.5%) | 8 (61.5%) |
| 25 to 34 Years | 14 (15.7%) | 46 (51.7%) |
| 35 to 44 Years | 1 (2.0%) | 32 (65.3%) |
| 45 to 54 Years | 8 (25.8%) | 14 (45.2%) |
| 55 to 64 Years | 16 (35.6%) | 27 (60.0%) |
| 65 to 74 Years | 24 (75.0%) | 21 (65.6%) |
| 75 Years and over | 42 (73.7%) | 37 (64.9%) |
| Total | 160 (33.9%) | 291 (61.7%) |
Disability Status by Sex by Age in Veblen
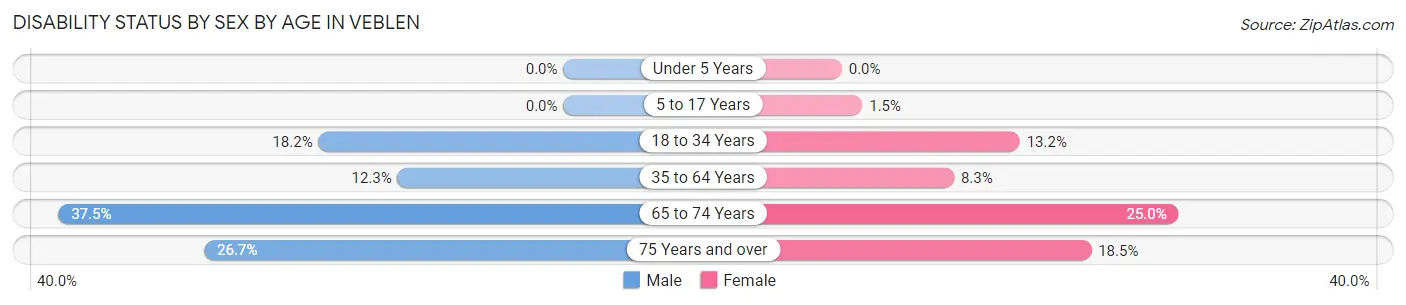
| Age Bracket | Male | Female |
| Under 5 Years | 0 (0.0%) | 0 (0.0%) |
| 5 to 17 Years | 0 (0.0%) | 1 (1.5%) |
| 18 to 34 Years | 12 (18.2%) | 7 (13.2%) |
| 35 to 64 Years | 8 (12.3%) | 5 (8.3%) |
| 65 to 74 Years | 9 (37.5%) | 2 (25.0%) |
| 75 Years and over | 8 (26.7%) | 5 (18.5%) |
Disability Class by Sex by Age in Veblen
Disability Class: Hearing Difficulty
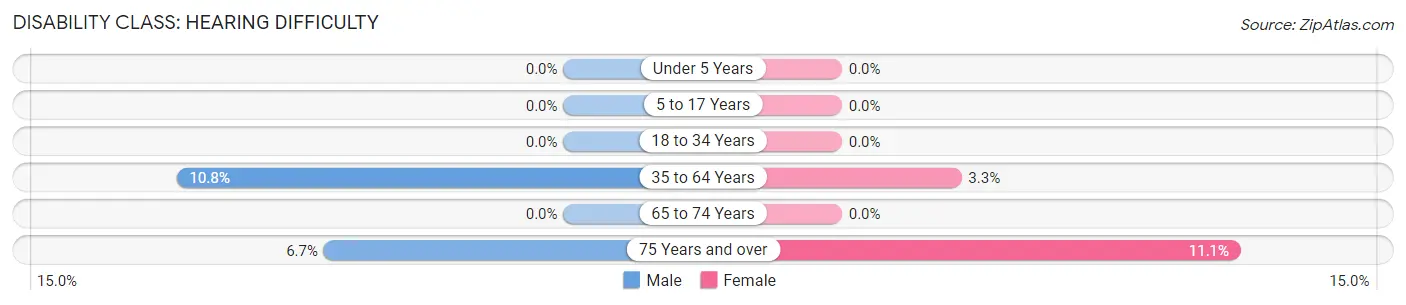
| Age Bracket | Male | Female |
| Under 5 Years | 0 (0.0%) | 0 (0.0%) |
| 5 to 17 Years | 0 (0.0%) | 0 (0.0%) |
| 18 to 34 Years | 0 (0.0%) | 0 (0.0%) |
| 35 to 64 Years | 7 (10.8%) | 2 (3.3%) |
| 65 to 74 Years | 0 (0.0%) | 0 (0.0%) |
| 75 Years and over | 2 (6.7%) | 3 (11.1%) |
Disability Class: Vision Difficulty
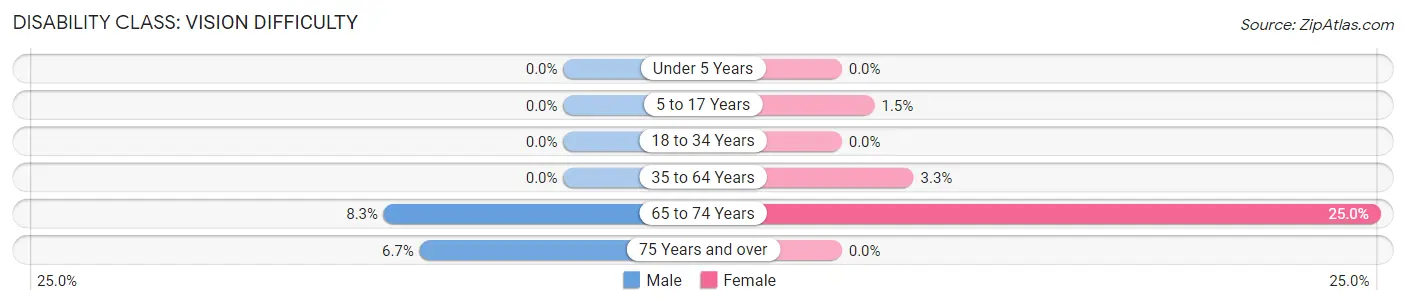
| Age Bracket | Male | Female |
| Under 5 Years | 0 (0.0%) | 0 (0.0%) |
| 5 to 17 Years | 0 (0.0%) | 1 (1.5%) |
| 18 to 34 Years | 0 (0.0%) | 0 (0.0%) |
| 35 to 64 Years | 0 (0.0%) | 2 (3.3%) |
| 65 to 74 Years | 2 (8.3%) | 2 (25.0%) |
| 75 Years and over | 2 (6.7%) | 0 (0.0%) |
Disability Class: Cognitive Difficulty
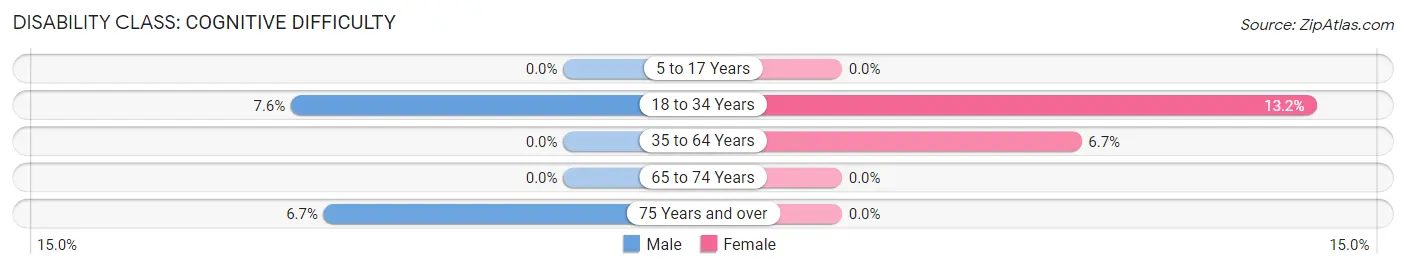
| Age Bracket | Male | Female |
| 5 to 17 Years | 0 (0.0%) | 0 (0.0%) |
| 18 to 34 Years | 5 (7.6%) | 7 (13.2%) |
| 35 to 64 Years | 0 (0.0%) | 4 (6.7%) |
| 65 to 74 Years | 0 (0.0%) | 0 (0.0%) |
| 75 Years and over | 2 (6.7%) | 0 (0.0%) |
Disability Class: Ambulatory Difficulty
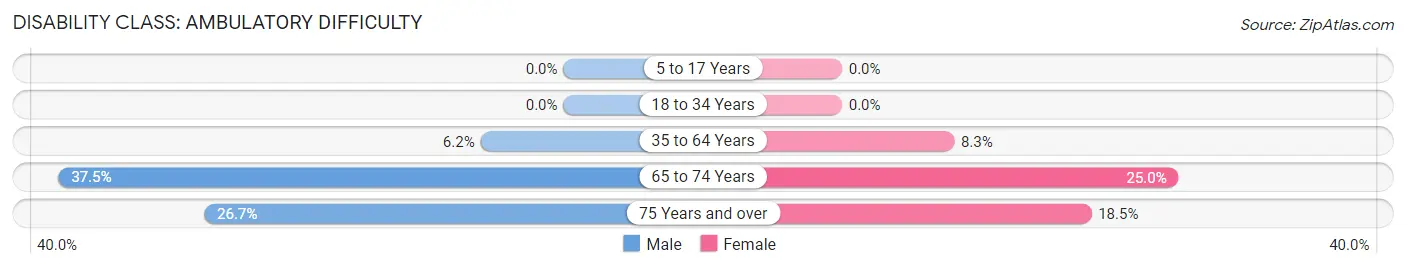
| Age Bracket | Male | Female |
| 5 to 17 Years | 0 (0.0%) | 0 (0.0%) |
| 18 to 34 Years | 0 (0.0%) | 0 (0.0%) |
| 35 to 64 Years | 4 (6.1%) | 5 (8.3%) |
| 65 to 74 Years | 9 (37.5%) | 2 (25.0%) |
| 75 Years and over | 8 (26.7%) | 5 (18.5%) |
Disability Class: Self-Care Difficulty
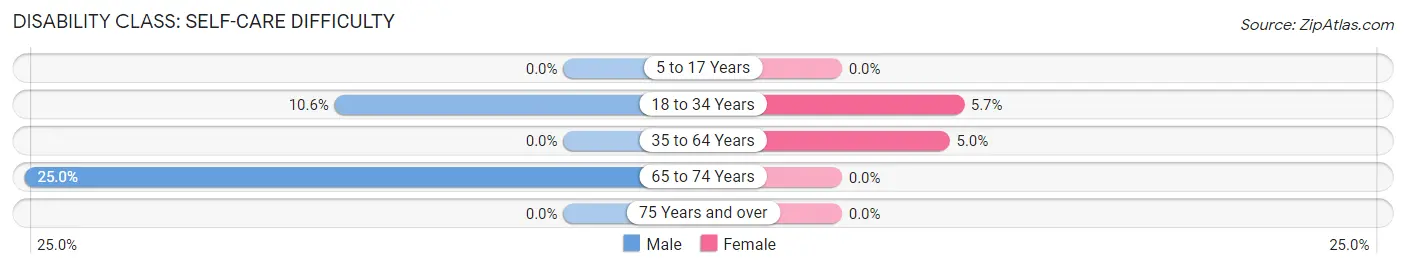
| Age Bracket | Male | Female |
| 5 to 17 Years | 0 (0.0%) | 0 (0.0%) |
| 18 to 34 Years | 7 (10.6%) | 3 (5.7%) |
| 35 to 64 Years | 0 (0.0%) | 3 (5.0%) |
| 65 to 74 Years | 6 (25.0%) | 0 (0.0%) |
| 75 Years and over | 0 (0.0%) | 0 (0.0%) |
Technology Access in Veblen
Computing Device Access in Veblen
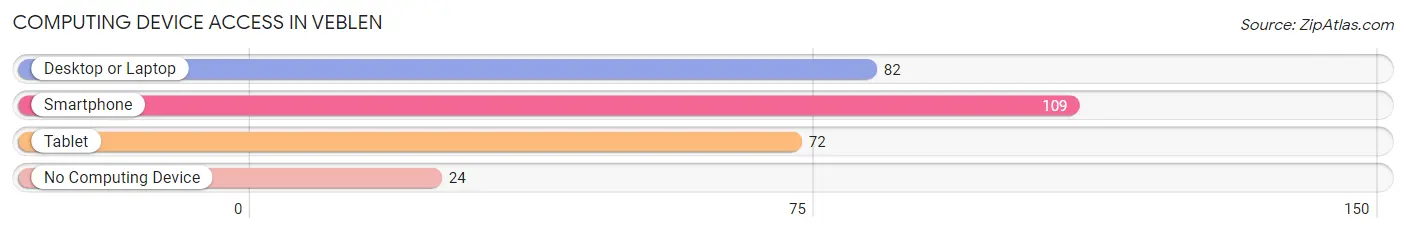
| Device Type | # Households | % Households |
| Desktop or Laptop | 82 | 53.2% |
| Smartphone | 109 | 70.8% |
| Tablet | 72 | 46.8% |
| No Computing Device | 24 | 15.6% |
| Total | 154 | 100.0% |
Internet Access in Veblen
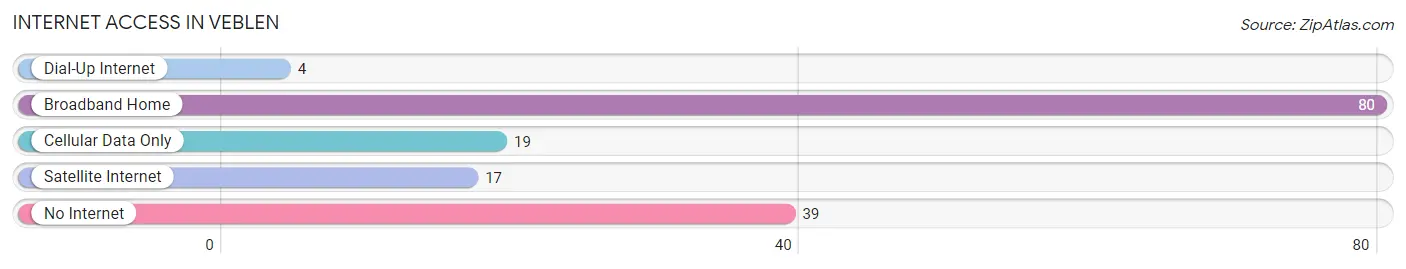
| Internet Type | # Households | % Households |
| Dial-Up Internet | 4 | 2.6% |
| Broadband Home | 80 | 51.9% |
| Cellular Data Only | 19 | 12.3% |
| Satellite Internet | 17 | 11.0% |
| No Internet | 39 | 25.3% |
| Total | 154 | 100.0% |
Veblen Summary
Veblen, South Dakota is a small town located in Marshall County, in the northeastern corner of the state. It is situated on the banks of the Big Sioux River, and is home to a population of just over 500 people. The town was founded in 1881 by Norwegian immigrants, and has a rich history of Norwegian culture and traditions.
Geographically, Veblen is located in the Coteau des Prairies, a region of rolling hills and prairie grasslands. The town is surrounded by agricultural land, and is home to a variety of wildlife, including deer, pheasants, and wild turkeys. The Big Sioux River runs through the town, providing a source of recreation for the locals.
The economy of Veblen is largely based on agriculture. The town is home to several grain elevators, and the surrounding area is home to many farms and ranches. The town also has a few small businesses, including a grocery store, a hardware store, and a few restaurants.
Demographically, Veblen is predominantly white, with a small population of Native Americans. The median age of the population is around 40, and the median household income is around $40,000. The town is home to a variety of religious denominations, including Lutheran, Catholic, and Methodist.
Veblen is a small town with a rich history and a strong sense of community. It is a great place to live, work, and raise a family. The town is home to a variety of recreational activities, including fishing, hunting, and camping. The town is also home to a variety of cultural events, such as the annual Veblen Days celebration. Veblen is a great place to call home, and is a great example of small-town America.
Common Questions
What is Per Capita Income in Veblen?
Per Capita income in Veblen is $20,267.
What is the Median Family Income in Veblen?
Median Family Income in Veblen is $55,625.
What is the Median Household income in Veblen?
Median Household Income in Veblen is $47,917.
What is Income or Wage Gap in Veblen?
Income or Wage Gap in Veblen is 29.8%.
Women in Veblen earn 70.2 cents for every dollar earned by a man.
What is Inequality or Gini Index in Veblen?
Inequality or Gini Index in Veblen is 0.34.
What is the Total Population of Veblen?
Total Population of Veblen is 472.
What is the Total Male Population of Veblen?
Total Male Population of Veblen is 246.
What is the Total Female Population of Veblen?
Total Female Population of Veblen is 226.
What is the Ratio of Males per 100 Females in Veblen?
There are 108.85 Males per 100 Females in Veblen.
What is the Ratio of Females per 100 Males in Veblen?
There are 91.87 Females per 100 Males in Veblen.
What is the Median Population Age in Veblen?
Median Population Age in Veblen is 32.1 Years.
What is the Average Family Size in Veblen
Average Family Size in Veblen is 4.6 People.
What is the Average Household Size in Veblen
Average Household Size in Veblen is 3.1 People.
How Large is the Labor Force in Veblen?
There are 182 People in the Labor Forcein in Veblen.
What is the Percentage of People in the Labor Force in Veblen?
53.8% of People are in the Labor Force in Veblen.
What is the Unemployment Rate in Veblen?
Unemployment Rate in Veblen is 6.0%.