Lake Preston, SD Map & Demographics
Lake Preston Map
Lake Preston Overview
$35,450
PER CAPITA INCOME
$83,571
AVG FAMILY INCOME
$59,766
AVG HOUSEHOLD INCOME
6.1%
WAGE / INCOME GAP [ % ]
93.9¢/ $1
WAGE / INCOME GAP [ $ ]
0.40
INEQUALITY / GINI INDEX
548
TOTAL POPULATION
267
MALE POPULATION
281
FEMALE POPULATION
95.02
MALES / 100 FEMALES
105.24
FEMALES / 100 MALES
46.2
MEDIAN AGE
3.3
AVG FAMILY SIZE
2.2
AVG HOUSEHOLD SIZE
254
LABOR FORCE [ PEOPLE ]
54.5%
PERCENT IN LABOR FORCE
0.4%
UNEMPLOYMENT RATE
Lake Preston Zip Codes
Lake Preston Area Codes
Income in Lake Preston
Income Overview in Lake Preston
Per Capita Income in Lake Preston is $35,450, while median incomes of families and households are $83,571 and $59,766 respectively.
| Characteristic | Number | Measure |
| Per Capita Income | 548 | $35,450 |
| Median Family Income | 122 | $83,571 |
| Mean Family Income | 122 | $95,193 |
| Median Household Income | 245 | $59,766 |
| Mean Household Income | 245 | $72,305 |
| Income Deficit | 122 | $0 |
| Wage / Income Gap (%) | 548 | 6.15% |
| Wage / Income Gap ($) | 548 | 93.85¢ per $1 |
| Gini / Inequality Index | 548 | 0.40 |
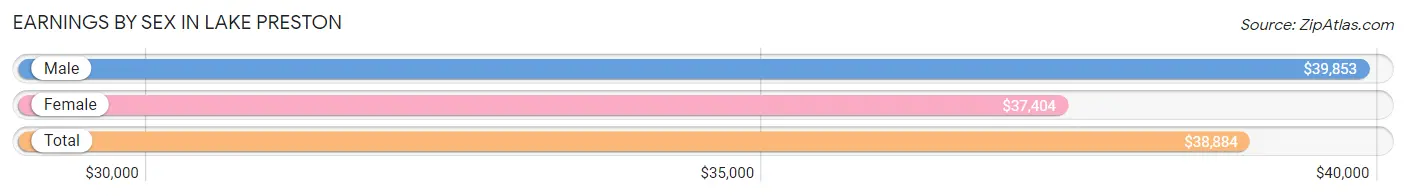
Earnings by Sex in Lake Preston
Average Earnings in Lake Preston are $38,884, $39,853 for men and $37,404 for women, a difference of 6.1%.
| Sex | Number | Average Earnings |
| Male | 152 (55.7%) | $39,853 |
| Female | 121 (44.3%) | $37,404 |
| Total | 273 (100.0%) | $38,884 |
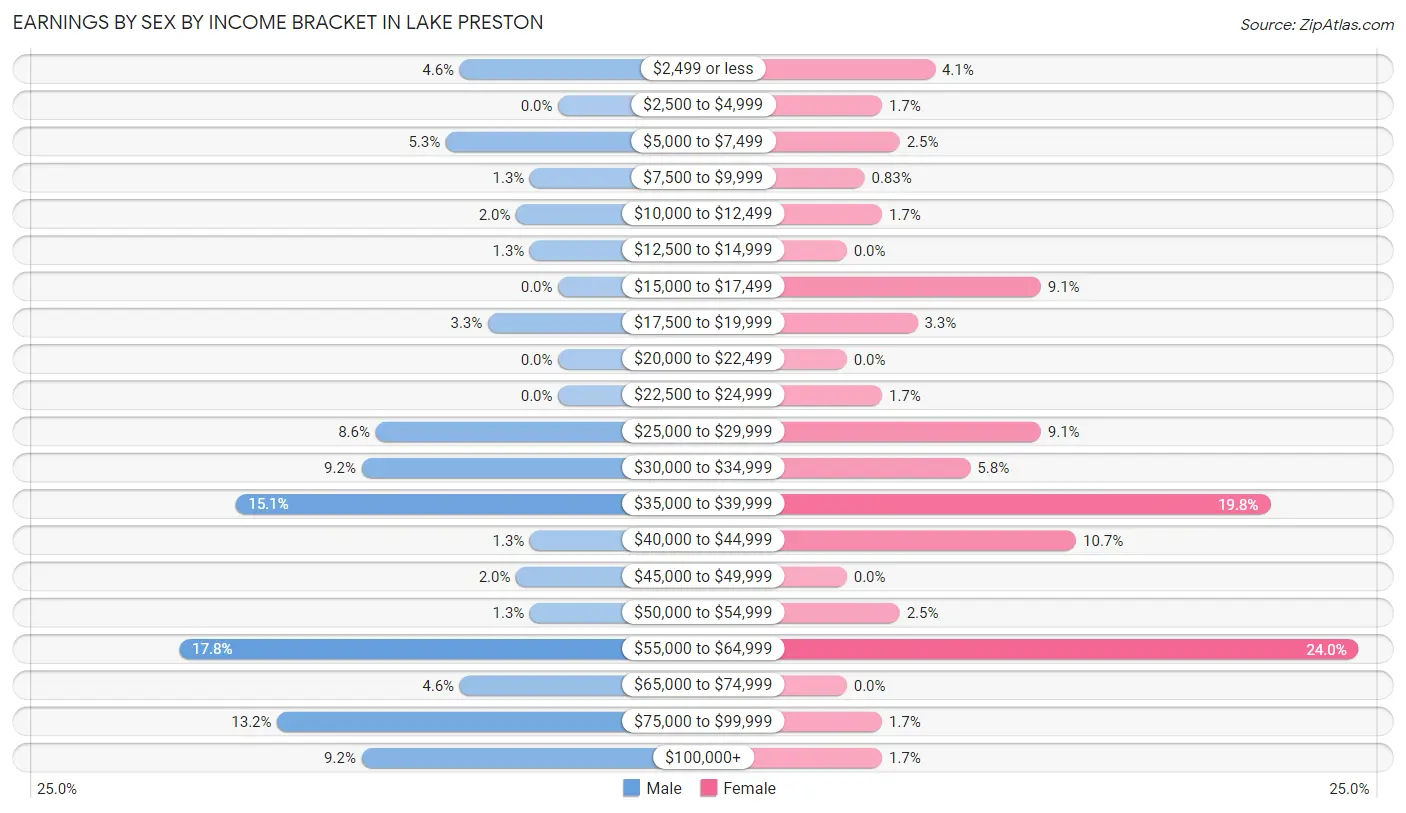
Earnings by Sex by Income Bracket in Lake Preston
The most common earnings brackets in Lake Preston are $55,000 to $64,999 for men (27 | 17.8%) and $55,000 to $64,999 for women (29 | 24.0%).
| Income | Male | Female |
| $2,499 or less | 7 (4.6%) | 5 (4.1%) |
| $2,500 to $4,999 | 0 (0.0%) | 2 (1.7%) |
| $5,000 to $7,499 | 8 (5.3%) | 3 (2.5%) |
| $7,500 to $9,999 | 2 (1.3%) | 1 (0.8%) |
| $10,000 to $12,499 | 3 (2.0%) | 2 (1.7%) |
| $12,500 to $14,999 | 2 (1.3%) | 0 (0.0%) |
| $15,000 to $17,499 | 0 (0.0%) | 11 (9.1%) |
| $17,500 to $19,999 | 5 (3.3%) | 4 (3.3%) |
| $20,000 to $22,499 | 0 (0.0%) | 0 (0.0%) |
| $22,500 to $24,999 | 0 (0.0%) | 2 (1.7%) |
| $25,000 to $29,999 | 13 (8.6%) | 11 (9.1%) |
| $30,000 to $34,999 | 14 (9.2%) | 7 (5.8%) |
| $35,000 to $39,999 | 23 (15.1%) | 24 (19.8%) |
| $40,000 to $44,999 | 2 (1.3%) | 13 (10.7%) |
| $45,000 to $49,999 | 3 (2.0%) | 0 (0.0%) |
| $50,000 to $54,999 | 2 (1.3%) | 3 (2.5%) |
| $55,000 to $64,999 | 27 (17.8%) | 29 (24.0%) |
| $65,000 to $74,999 | 7 (4.6%) | 0 (0.0%) |
| $75,000 to $99,999 | 20 (13.2%) | 2 (1.7%) |
| $100,000+ | 14 (9.2%) | 2 (1.7%) |
| Total | 152 (100.0%) | 121 (100.0%) |
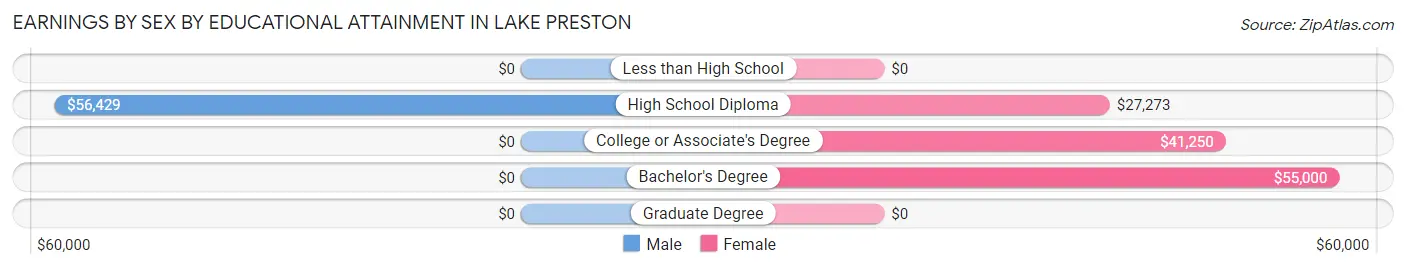
Earnings by Sex by Educational Attainment in Lake Preston
Average earnings in Lake Preston are $46,667 for men and $38,636 for women, a difference of 17.2%. Men with an educational attainment of high school diploma enjoy the highest average annual earnings of $56,429, while those with high school diploma education earn the least with $56,429. Women with an educational attainment of bachelor's degree earn the most with the average annual earnings of $55,000, while those with high school diploma education have the smallest earnings of $27,273.
| Educational Attainment | Male Income | Female Income |
| Less than High School | - | - |
| High School Diploma | $56,429 | $27,273 |
| College or Associate's Degree | - | - |
| Bachelor's Degree | - | - |
| Graduate Degree | - | - |
| Total | $46,667 | $38,636 |
Family Income in Lake Preston
Family Income Brackets in Lake Preston
According to the Lake Preston family income data, there are 31 families falling into the $100,000 to $149,999 income range, which is the most common income bracket and makes up 25.4% of all families.
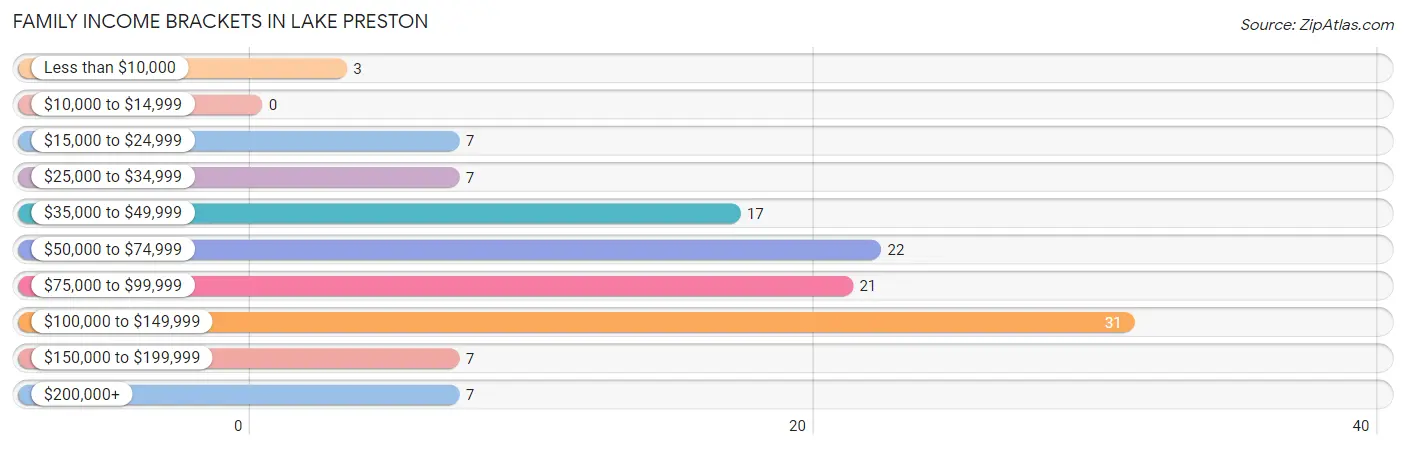
| Income Bracket | # Families | % Families |
| Less than $10,000 | 3 | 2.5% |
| $10,000 to $14,999 | 0 | 0.0% |
| $15,000 to $24,999 | 7 | 5.7% |
| $25,000 to $34,999 | 7 | 5.7% |
| $35,000 to $49,999 | 17 | 13.9% |
| $50,000 to $74,999 | 22 | 18.0% |
| $75,000 to $99,999 | 21 | 17.2% |
| $100,000 to $149,999 | 31 | 25.4% |
| $150,000 to $199,999 | 7 | 5.7% |
| $200,000+ | 7 | 5.7% |
Family Income by Famaliy Size in Lake Preston
4-person families (9 | 7.4%) account for the highest median family income in Lake Preston with $143,958 per family, while 3-person families (11 | 9.0%) have the highest median income of $44,583 per family member.
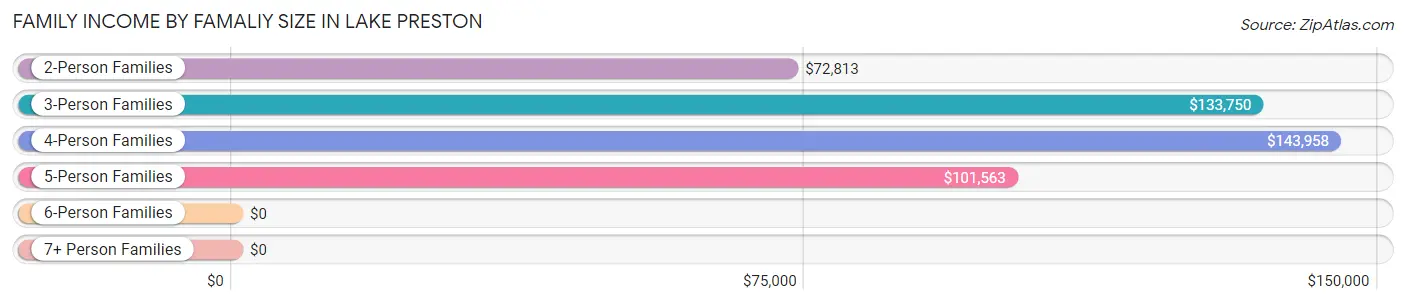
| Income Bracket | # Families | Median Income |
| 2-Person Families | 94 (77.0%) | $72,813 |
| 3-Person Families | 11 (9.0%) | $133,750 |
| 4-Person Families | 9 (7.4%) | $143,958 |
| 5-Person Families | 7 (5.7%) | $101,563 |
| 6-Person Families | 1 (0.8%) | $0 |
| 7+ Person Families | 0 (0.0%) | $0 |
| Total | 122 (100.0%) | $83,571 |
Family Income by Number of Earners in Lake Preston
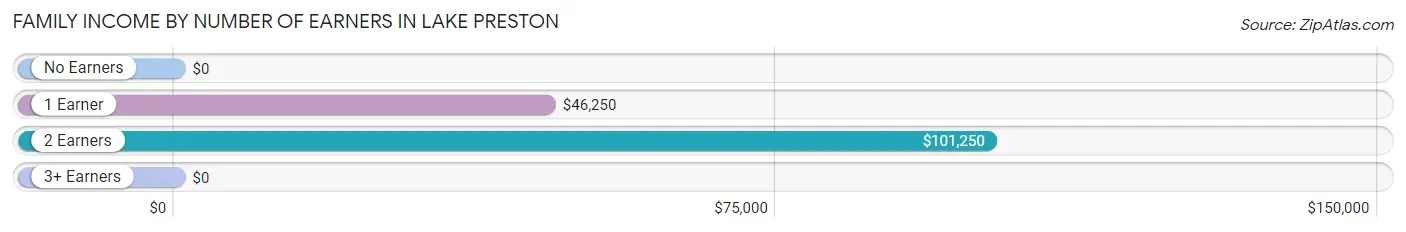
| Number of Earners | # Families | Median Income |
| No Earners | 9 (7.4%) | $0 |
| 1 Earner | 40 (32.8%) | $46,250 |
| 2 Earners | 70 (57.4%) | $101,250 |
| 3+ Earners | 3 (2.5%) | $0 |
| Total | 122 (100.0%) | $83,571 |
Household Income in Lake Preston
Household Income Brackets in Lake Preston
With 63 households falling in the category, the $50,000 to $74,999 income range is the most frequent in Lake Preston, accounting for 25.7% of all households. In contrast, only 5 households (2.0%) fall into the less than $10,000 income bracket, making it the least populous group.
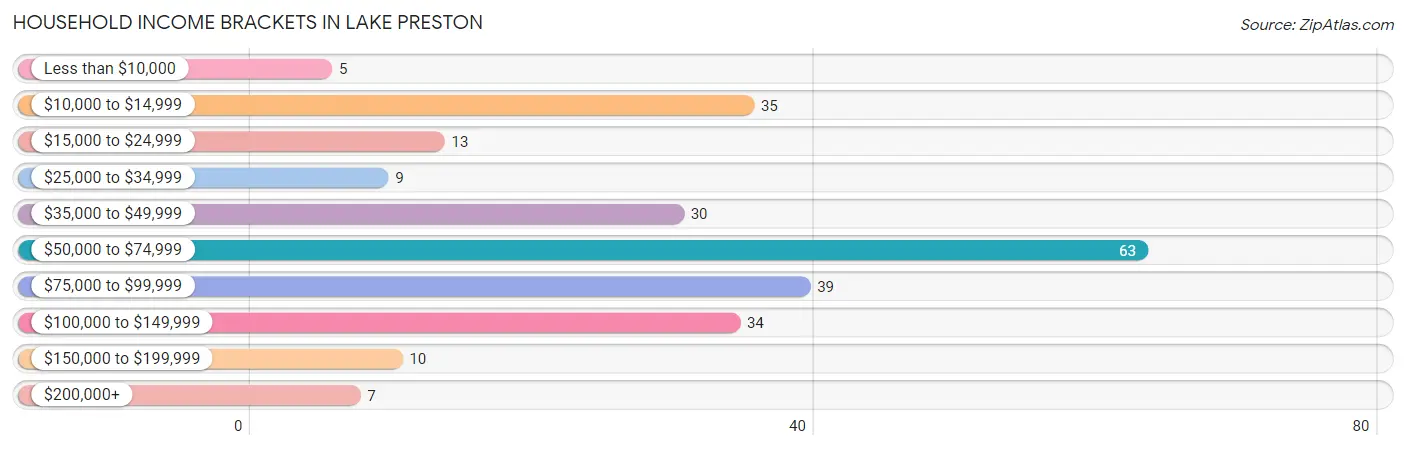
| Income Bracket | # Households | % Households |
| Less than $10,000 | 5 | 2.0% |
| $10,000 to $14,999 | 35 | 14.3% |
| $15,000 to $24,999 | 13 | 5.3% |
| $25,000 to $34,999 | 9 | 3.7% |
| $35,000 to $49,999 | 30 | 12.2% |
| $50,000 to $74,999 | 63 | 25.7% |
| $75,000 to $99,999 | 39 | 15.9% |
| $100,000 to $149,999 | 34 | 13.9% |
| $150,000 to $199,999 | 10 | 4.1% |
| $200,000+ | 7 | 2.9% |
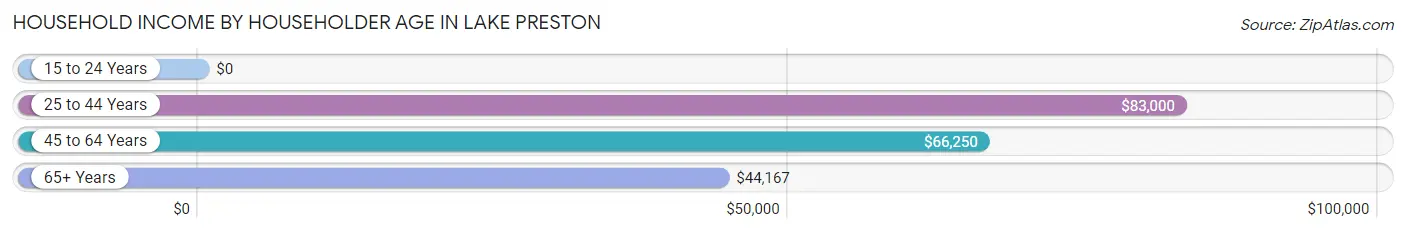
Household Income by Householder Age in Lake Preston
The median household income in Lake Preston is $59,766, with the highest median household income of $83,000 found in the 25 to 44 years age bracket for the primary householder. A total of 60 households (24.5%) fall into this category. Meanwhile, the 15 to 24 years age bracket for the primary householder has the lowest median household income of $0, with 7 households (2.9%) in this group.
| Income Bracket | # Households | Median Income |
| 15 to 24 Years | 7 (2.9%) | $0 |
| 25 to 44 Years | 60 (24.5%) | $83,000 |
| 45 to 64 Years | 86 (35.1%) | $66,250 |
| 65+ Years | 92 (37.6%) | $44,167 |
| Total | 245 (100.0%) | $59,766 |
Poverty in Lake Preston
Income Below Poverty by Sex and Age in Lake Preston
With 11.2% poverty level for males and 12.8% for females among the residents of Lake Preston, 12 to 14 year old males and 75 year old and over females are the most vulnerable to poverty, with 11 males (78.6%) and 26 females (50.0%) in their respective age groups living below the poverty level.
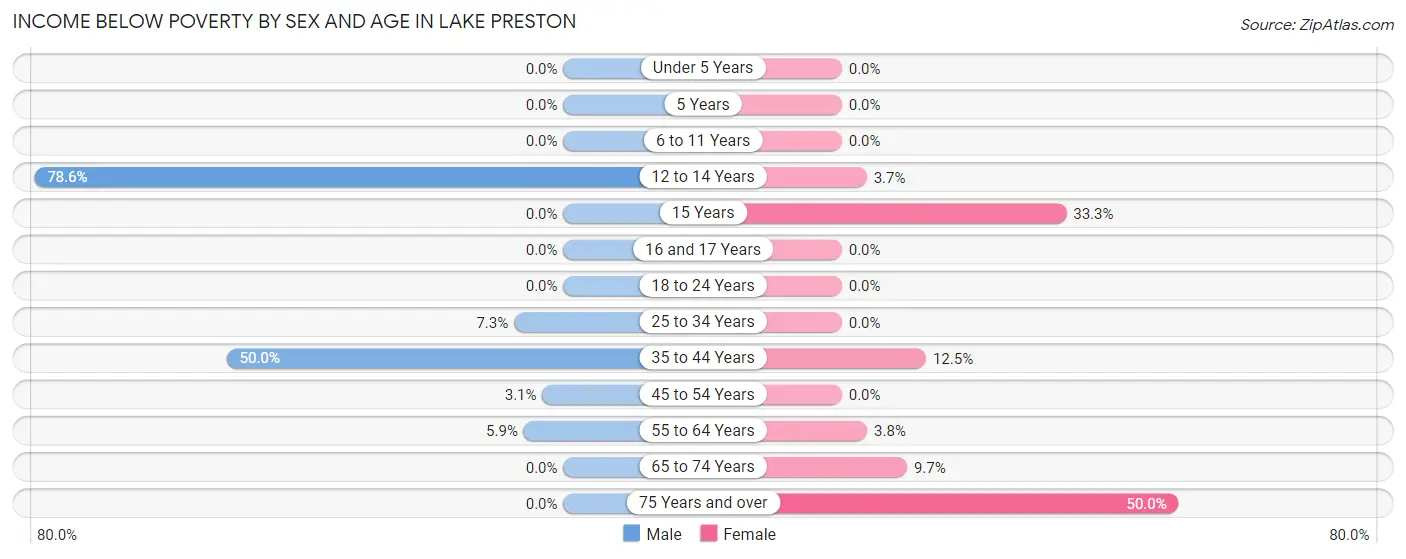
| Age Bracket | Male | Female |
| Under 5 Years | 0 (0.0%) | 0 (0.0%) |
| 5 Years | 0 (0.0%) | 0 (0.0%) |
| 6 to 11 Years | 0 (0.0%) | 0 (0.0%) |
| 12 to 14 Years | 11 (78.6%) | 1 (3.7%) |
| 15 Years | 0 (0.0%) | 1 (33.3%) |
| 16 and 17 Years | 0 (0.0%) | 0 (0.0%) |
| 18 to 24 Years | 0 (0.0%) | 0 (0.0%) |
| 25 to 34 Years | 3 (7.3%) | 0 (0.0%) |
| 35 to 44 Years | 12 (50.0%) | 3 (12.5%) |
| 45 to 54 Years | 1 (3.1%) | 0 (0.0%) |
| 55 to 64 Years | 3 (5.9%) | 2 (3.8%) |
| 65 to 74 Years | 0 (0.0%) | 3 (9.7%) |
| 75 Years and over | 0 (0.0%) | 26 (50.0%) |
| Total | 30 (11.2%) | 36 (12.8%) |
Income Above Poverty by Sex and Age in Lake Preston
According to the poverty statistics in Lake Preston, males aged under 5 years and females aged under 5 years are the age groups that are most secure financially, with 100.0% of males and 100.0% of females in these age groups living above the poverty line.
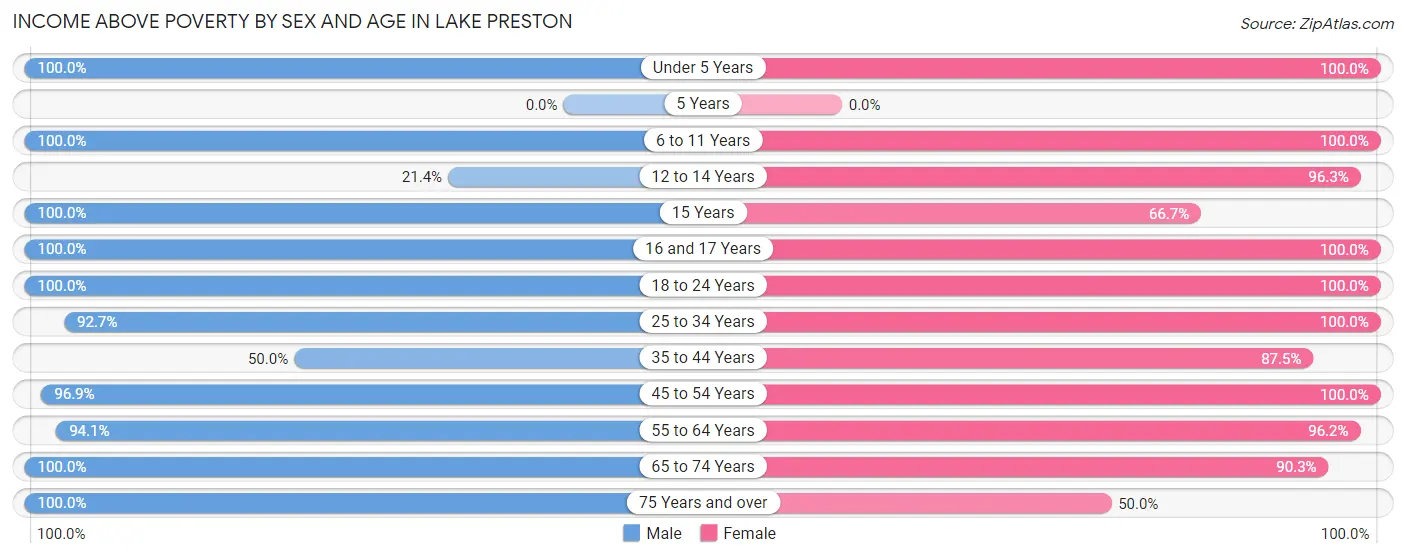
| Age Bracket | Male | Female |
| Under 5 Years | 4 (100.0%) | 5 (100.0%) |
| 5 Years | 0 (0.0%) | 0 (0.0%) |
| 6 to 11 Years | 16 (100.0%) | 7 (100.0%) |
| 12 to 14 Years | 3 (21.4%) | 26 (96.3%) |
| 15 Years | 6 (100.0%) | 2 (66.7%) |
| 16 and 17 Years | 1 (100.0%) | 5 (100.0%) |
| 18 to 24 Years | 31 (100.0%) | 6 (100.0%) |
| 25 to 34 Years | 38 (92.7%) | 56 (100.0%) |
| 35 to 44 Years | 12 (50.0%) | 21 (87.5%) |
| 45 to 54 Years | 31 (96.9%) | 12 (100.0%) |
| 55 to 64 Years | 48 (94.1%) | 51 (96.2%) |
| 65 to 74 Years | 30 (100.0%) | 28 (90.3%) |
| 75 Years and over | 17 (100.0%) | 26 (50.0%) |
| Total | 237 (88.8%) | 245 (87.2%) |
Income Below Poverty Among Married-Couple Families in Lake Preston
The poverty statistics for married-couple families in Lake Preston show that 5.4% or 6 of the total 111 families live below the poverty line. Families with 3 or 4 children have the highest poverty rate of 14.3%, comprising of 1 families. On the other hand, families with 1 or 2 children have the lowest poverty rate of 0.0%, which includes 0 families.
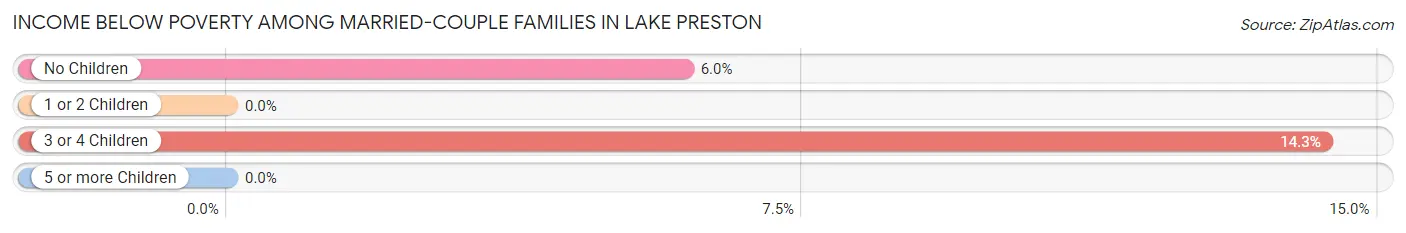
| Children | Above Poverty | Below Poverty |
| No Children | 79 (94.1%) | 5 (5.9%) |
| 1 or 2 Children | 20 (100.0%) | 0 (0.0%) |
| 3 or 4 Children | 6 (85.7%) | 1 (14.3%) |
| 5 or more Children | 0 (0.0%) | 0 (0.0%) |
| Total | 105 (94.6%) | 6 (5.4%) |
Income Below Poverty Among Single-Parent Households in Lake Preston
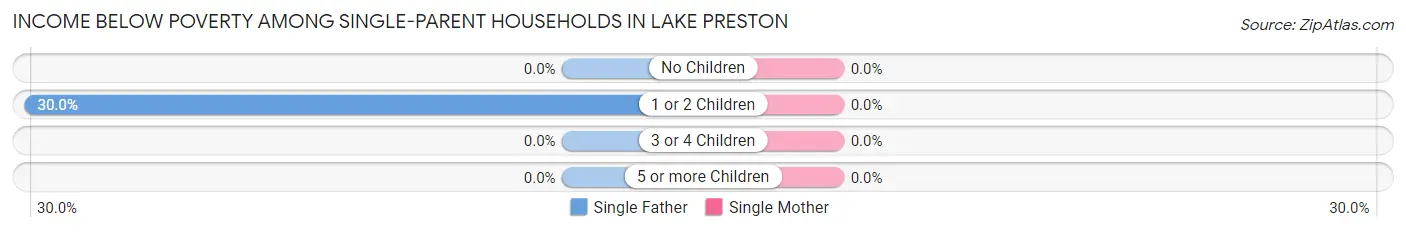
| Children | Single Father | Single Mother |
| No Children | 0 (0.0%) | 0 (0.0%) |
| 1 or 2 Children | 3 (30.0%) | 0 (0.0%) |
| 3 or 4 Children | 0 (0.0%) | 0 (0.0%) |
| 5 or more Children | 0 (0.0%) | 0 (0.0%) |
| Total | 3 (30.0%) | 0 (0.0%) |
Income Below Poverty Among Married-Couple vs Single-Parent Households in Lake Preston
The poverty data for Lake Preston shows that 6 of the married-couple family households (5.4%) and 3 of the single-parent households (27.3%) are living below the poverty level. Within the married-couple family households, those with 3 or 4 children have the highest poverty rate, with 1 households (14.3%) falling below the poverty line. Among the single-parent households, those with 1 or 2 children have the highest poverty rate, with 3 household (30.0%) living below poverty.
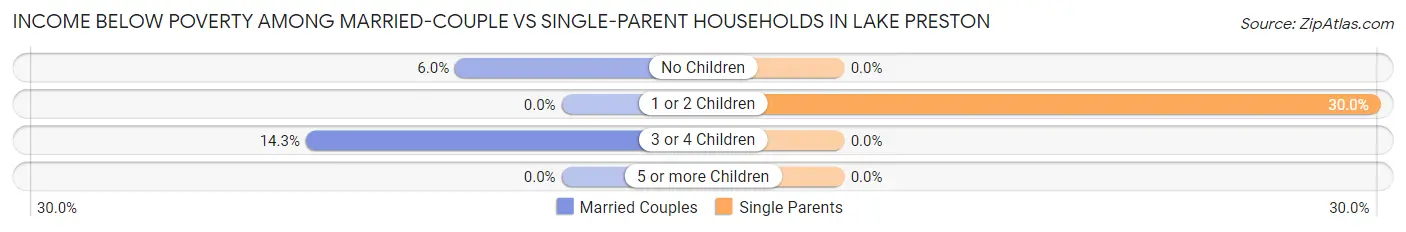
| Children | Married-Couple Families | Single-Parent Households |
| No Children | 5 (5.9%) | 0 (0.0%) |
| 1 or 2 Children | 0 (0.0%) | 3 (30.0%) |
| 3 or 4 Children | 1 (14.3%) | 0 (0.0%) |
| 5 or more Children | 0 (0.0%) | 0 (0.0%) |
| Total | 6 (5.4%) | 3 (27.3%) |
Race in Lake Preston
The most populous races in Lake Preston are White / Caucasian (438 | 79.9%), Two or more Races (93 | 17.0%), and Hispanic or Latino (75 | 13.7%).
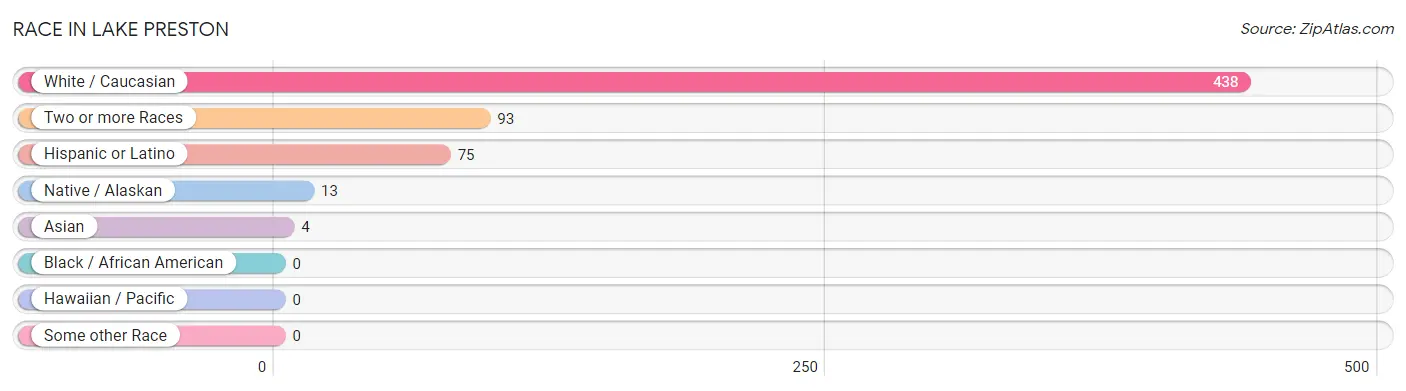
| Race | # Population | % Population |
| Asian | 4 | 0.7% |
| Black / African American | 0 | 0.0% |
| Hawaiian / Pacific | 0 | 0.0% |
| Hispanic or Latino | 75 | 13.7% |
| Native / Alaskan | 13 | 2.4% |
| White / Caucasian | 438 | 79.9% |
| Two or more Races | 93 | 17.0% |
| Some other Race | 0 | 0.0% |
| Total | 548 | 100.0% |
Ancestry in Lake Preston
The most populous ancestries reported in Lake Preston are German (187 | 34.1%), Norwegian (142 | 25.9%), Mexican (66 | 12.0%), Irish (38 | 6.9%), and English (34 | 6.2%), together accounting for 85.2% of all Lake Preston residents.
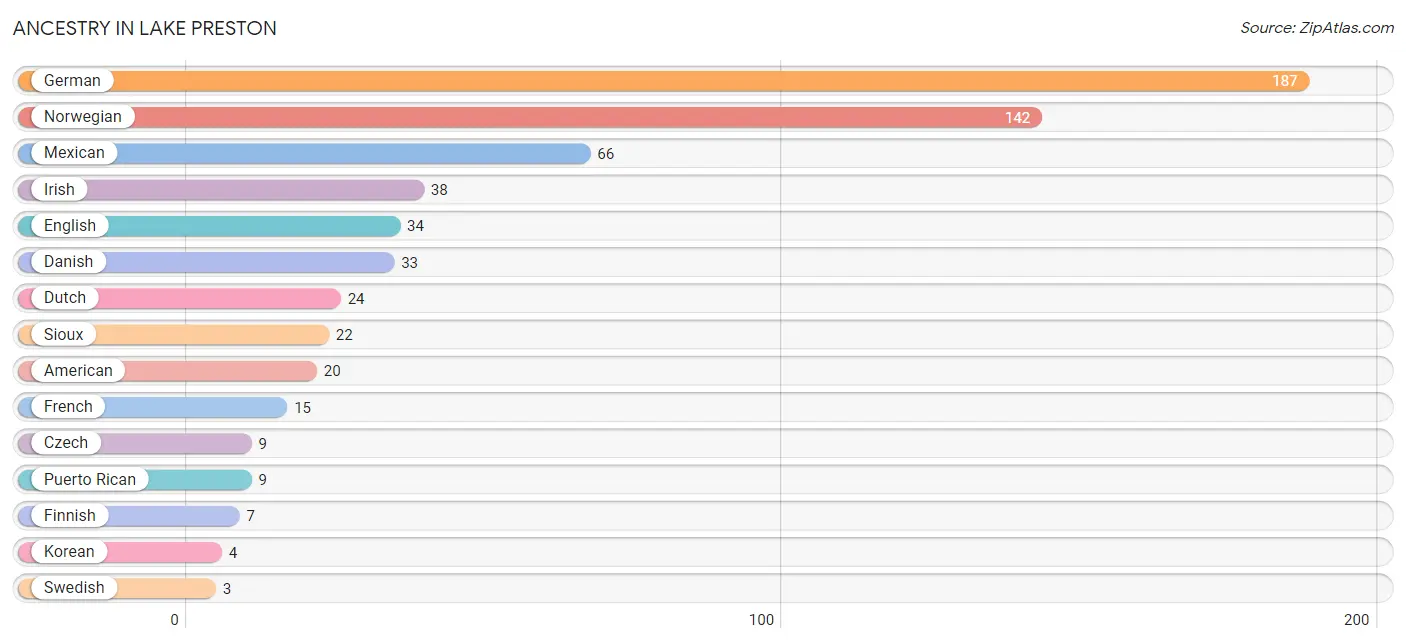
| Ancestry | # Population | % Population |
| American | 20 | 3.6% |
| Czech | 9 | 1.6% |
| Danish | 33 | 6.0% |
| Dutch | 24 | 4.4% |
| English | 34 | 6.2% |
| Finnish | 7 | 1.3% |
| French | 15 | 2.7% |
| German | 187 | 34.1% |
| Hungarian | 2 | 0.4% |
| Irish | 38 | 6.9% |
| Italian | 1 | 0.2% |
| Korean | 4 | 0.7% |
| Mexican | 66 | 12.0% |
| Northern European | 2 | 0.4% |
| Norwegian | 142 | 25.9% |
| Polish | 2 | 0.4% |
| Puerto Rican | 9 | 1.6% |
| Russian | 2 | 0.4% |
| Scottish | 2 | 0.4% |
| Sioux | 22 | 4.0% |
| Swedish | 3 | 0.5% |
| Welsh | 2 | 0.4% | View All 22 Rows |
Immigrants in Lake Preston
The most numerous immigrant groups reported in Lake Preston came from Central America (5 | 0.9%), Latin America (5 | 0.9%), Mexico (5 | 0.9%), Asia (4 | 0.7%), and Philippines (4 | 0.7%), together accounting for 4.2% of all Lake Preston residents.
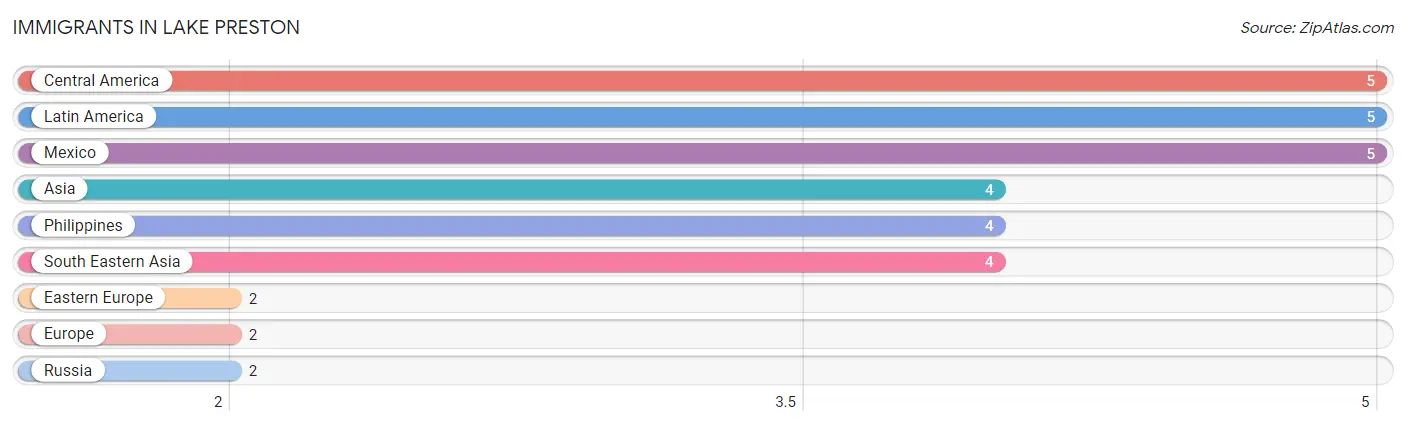
| Immigration Origin | # Population | % Population |
| Asia | 4 | 0.7% |
| Central America | 5 | 0.9% |
| Eastern Europe | 2 | 0.4% |
| Europe | 2 | 0.4% |
| Latin America | 5 | 0.9% |
| Mexico | 5 | 0.9% |
| Philippines | 4 | 0.7% |
| Russia | 2 | 0.4% |
| South Eastern Asia | 4 | 0.7% | View All 9 Rows |
Sex and Age in Lake Preston
Sex and Age in Lake Preston
The most populous age groups in Lake Preston are 60 to 64 Years (35 | 13.1%) for men and 25 to 29 Years (54 | 19.2%) for women.
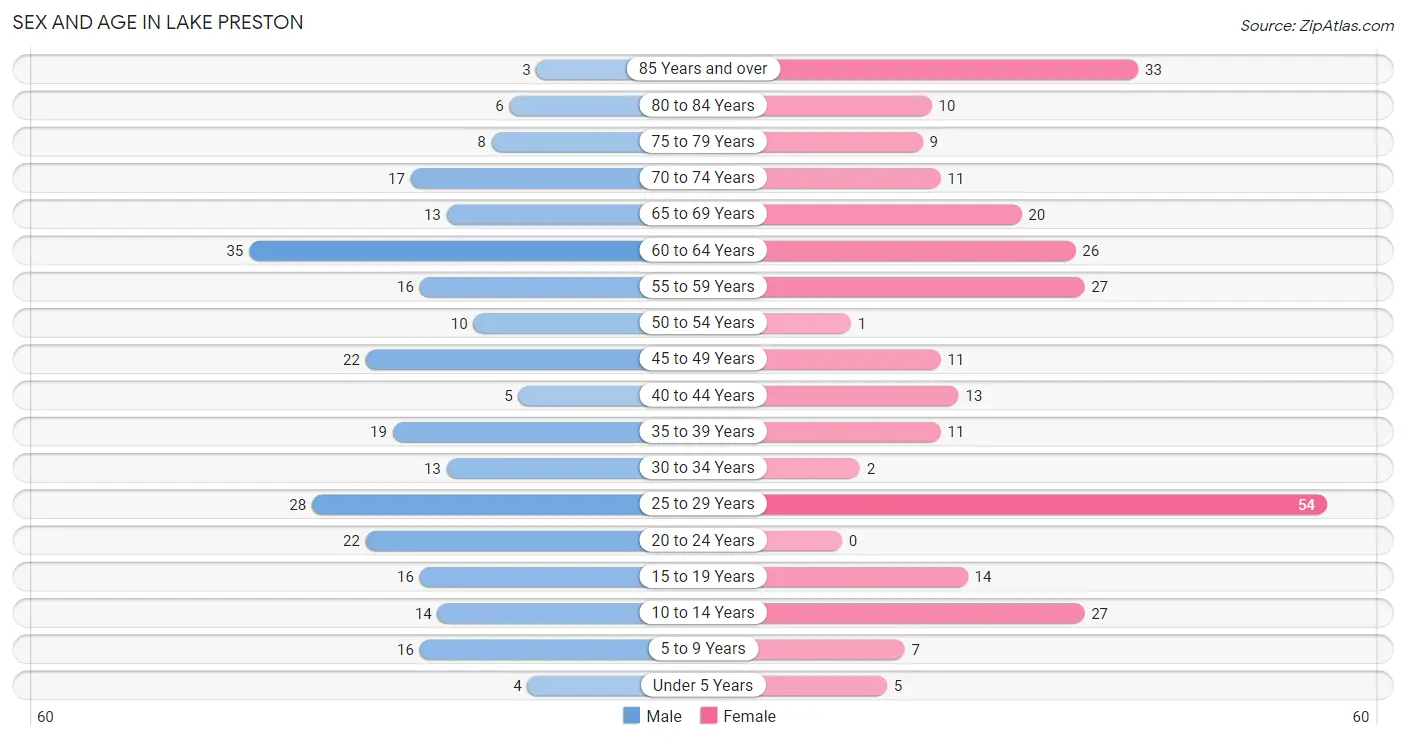
| Age Bracket | Male | Female |
| Under 5 Years | 4 (1.5%) | 5 (1.8%) |
| 5 to 9 Years | 16 (6.0%) | 7 (2.5%) |
| 10 to 14 Years | 14 (5.2%) | 27 (9.6%) |
| 15 to 19 Years | 16 (6.0%) | 14 (5.0%) |
| 20 to 24 Years | 22 (8.2%) | 0 (0.0%) |
| 25 to 29 Years | 28 (10.5%) | 54 (19.2%) |
| 30 to 34 Years | 13 (4.9%) | 2 (0.7%) |
| 35 to 39 Years | 19 (7.1%) | 11 (3.9%) |
| 40 to 44 Years | 5 (1.9%) | 13 (4.6%) |
| 45 to 49 Years | 22 (8.2%) | 11 (3.9%) |
| 50 to 54 Years | 10 (3.7%) | 1 (0.4%) |
| 55 to 59 Years | 16 (6.0%) | 27 (9.6%) |
| 60 to 64 Years | 35 (13.1%) | 26 (9.2%) |
| 65 to 69 Years | 13 (4.9%) | 20 (7.1%) |
| 70 to 74 Years | 17 (6.4%) | 11 (3.9%) |
| 75 to 79 Years | 8 (3.0%) | 9 (3.2%) |
| 80 to 84 Years | 6 (2.2%) | 10 (3.6%) |
| 85 Years and over | 3 (1.1%) | 33 (11.7%) |
| Total | 267 (100.0%) | 281 (100.0%) |
Families and Households in Lake Preston
Median Family Size in Lake Preston
The median family size in Lake Preston is 3.30 persons per family, with single female/mother families (1 | 0.8%) accounting for the largest median family size of 79 persons per family. On the other hand, single male/father families (10 | 8.2%) represent the smallest median family size with 2.60 persons per family.
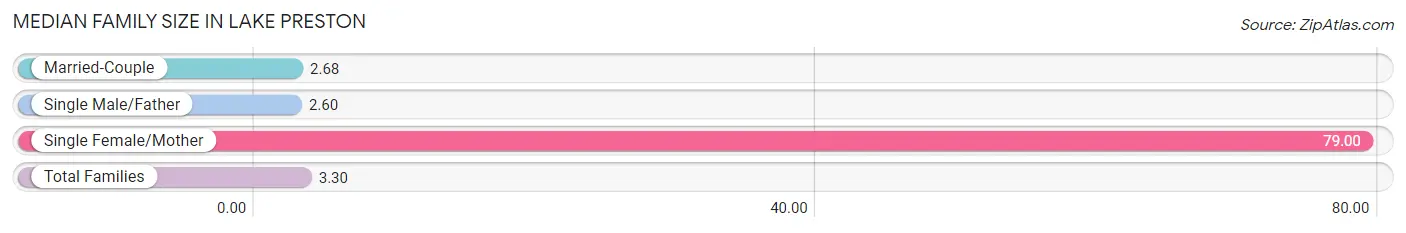
| Family Type | # Families | Family Size |
| Married-Couple | 111 (91.0%) | 2.68 |
| Single Male/Father | 10 (8.2%) | 2.60 |
| Single Female/Mother | 1 (0.8%) | 79.00 |
| Total Families | 122 (100.0%) | 3.30 |
Median Household Size in Lake Preston
The median household size in Lake Preston is 2.24 persons per household, with single female/mother households (1 | 0.4%) accounting for the largest median household size of 79 persons per household. non-family households (123 | 50.2%) represent the smallest median household size with 1.18 persons per household.
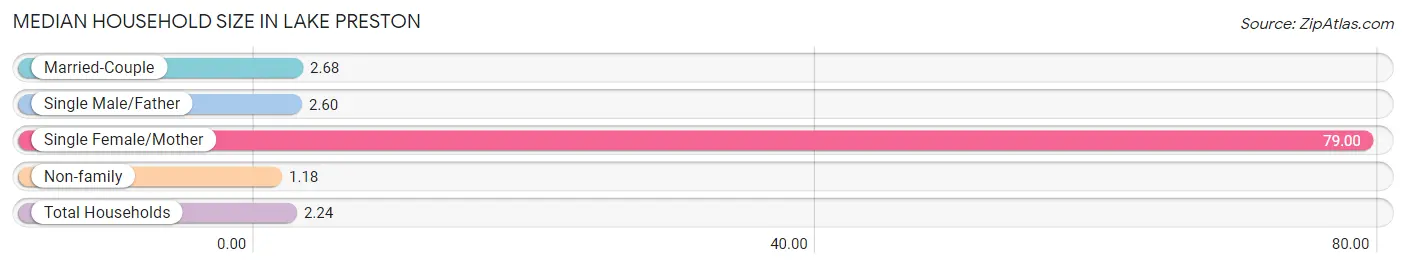
| Household Type | # Households | Household Size |
| Married-Couple | 111 (45.3%) | 2.68 |
| Single Male/Father | 10 (4.1%) | 2.60 |
| Single Female/Mother | 1 (0.4%) | 79.00 |
| Non-family | 123 (50.2%) | 1.18 |
| Total Households | 245 (100.0%) | 2.24 |
Household Size by Marriage Status in Lake Preston
Out of a total of 245 households in Lake Preston, 122 (49.8%) are family households, while 123 (50.2%) are nonfamily households. The most numerous type of family households are 2-person households, comprising 94, and the most common type of nonfamily households are 1-person households, comprising 107.
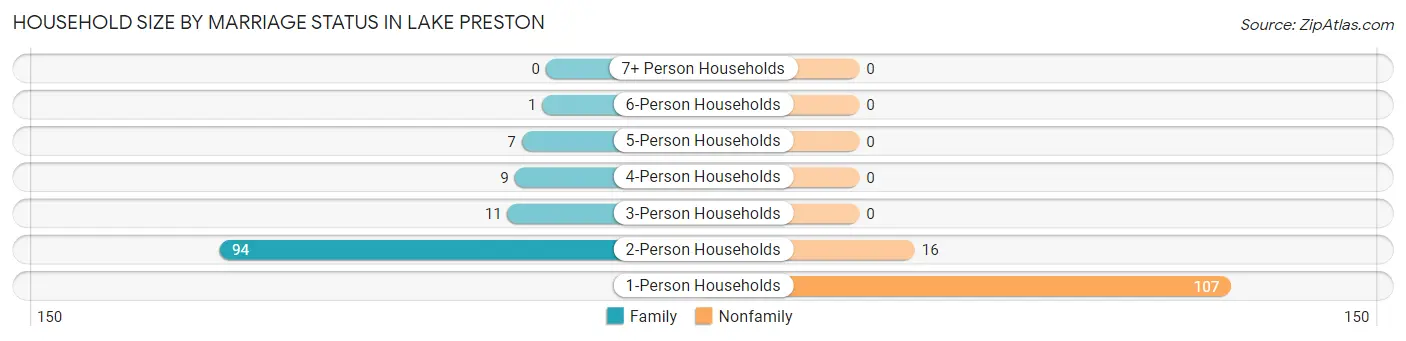
| Household Size | Family Households | Nonfamily Households |
| 1-Person Households | - | 107 (43.7%) |
| 2-Person Households | 94 (38.4%) | 16 (6.5%) |
| 3-Person Households | 11 (4.5%) | 0 (0.0%) |
| 4-Person Households | 9 (3.7%) | 0 (0.0%) |
| 5-Person Households | 7 (2.9%) | 0 (0.0%) |
| 6-Person Households | 1 (0.4%) | 0 (0.0%) |
| 7+ Person Households | 0 (0.0%) | 0 (0.0%) |
| Total | 122 (49.8%) | 123 (50.2%) |
Female Fertility in Lake Preston
Fertility by Age in Lake Preston
| Age Bracket | Women with Births | Births / 1,000 Women |
| 15 to 19 years | 0 (0.0%) | 0.0 |
| 20 to 34 years | 0 (0.0%) | 0.0 |
| 35 to 50 years | 0 (0.0%) | 0.0 |
| Total | 0 (0.0%) | 0.0 |
Fertility by Age by Marriage Status in Lake Preston
| Age Bracket | Married | Unmarried |
| 15 to 19 years | 0 (0.0%) | 0 (0.0%) |
| 20 to 34 years | 0 (0.0%) | 0 (0.0%) |
| 35 to 50 years | 0 (0.0%) | 0 (0.0%) |
| Total | 0 (0.0%) | 0 (0.0%) |
Fertility by Education in Lake Preston
| Educational Attainment | Women with Births | Births / 1,000 Women |
| Less than High School | 0 (0.0%) | 0.0 |
| High School Diploma | 0 (0.0%) | 0.0 |
| College or Associate's Degree | 0 (0.0%) | 0.0 |
| Bachelor's Degree | 0 (0.0%) | 0.0 |
| Graduate Degree | 0 (0.0%) | 0.0 |
| Total | 0 (0.0%) | 0.0 |
Fertility by Education by Marriage Status in Lake Preston
| Educational Attainment | Married | Unmarried |
| Less than High School | 0 (0.0%) | 0 (0.0%) |
| High School Diploma | 0 (0.0%) | 0 (0.0%) |
| College or Associate's Degree | 0 (0.0%) | 0 (0.0%) |
| Bachelor's Degree | 0 (0.0%) | 0 (0.0%) |
| Graduate Degree | 0 (0.0%) | 0 (0.0%) |
| Total | 0 (0.0%) | 0 (0.0%) |
Employment Characteristics in Lake Preston
Employment by Class of Employer in Lake Preston
Among the 253 employed individuals in Lake Preston, private company employees (184 | 72.7%), local government employees (25 | 9.9%), and not-for-profit organizations (15 | 5.9%) make up the most common classes of employment.
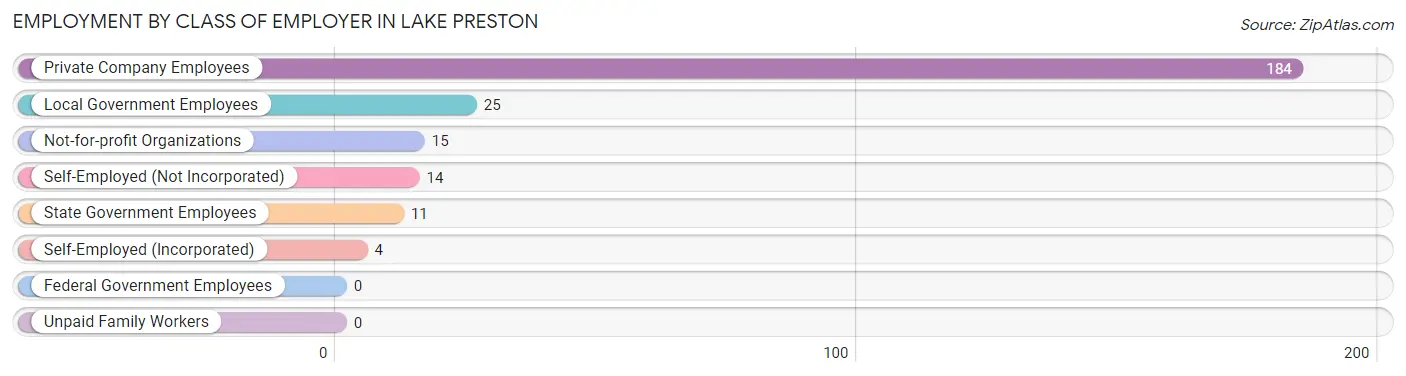
| Employer Class | # Employees | % Employees |
| Private Company Employees | 184 | 72.7% |
| Self-Employed (Incorporated) | 4 | 1.6% |
| Self-Employed (Not Incorporated) | 14 | 5.5% |
| Not-for-profit Organizations | 15 | 5.9% |
| Local Government Employees | 25 | 9.9% |
| State Government Employees | 11 | 4.3% |
| Federal Government Employees | 0 | 0.0% |
| Unpaid Family Workers | 0 | 0.0% |
| Total | 253 | 100.0% |
Employment Status by Age in Lake Preston
According to the labor force statistics for Lake Preston, out of the total population over 16 years of age (466), 54.5% or 254 individuals are in the labor force, with 0.4% or 1 of them unemployed. The age group with the highest labor force participation rate is 30 to 34 years, with 100.0% or 15 individuals in the labor force. Within the labor force, the 45 to 54 years age range has the highest percentage of unemployed individuals, with 2.3% or 1 of them being unemployed.
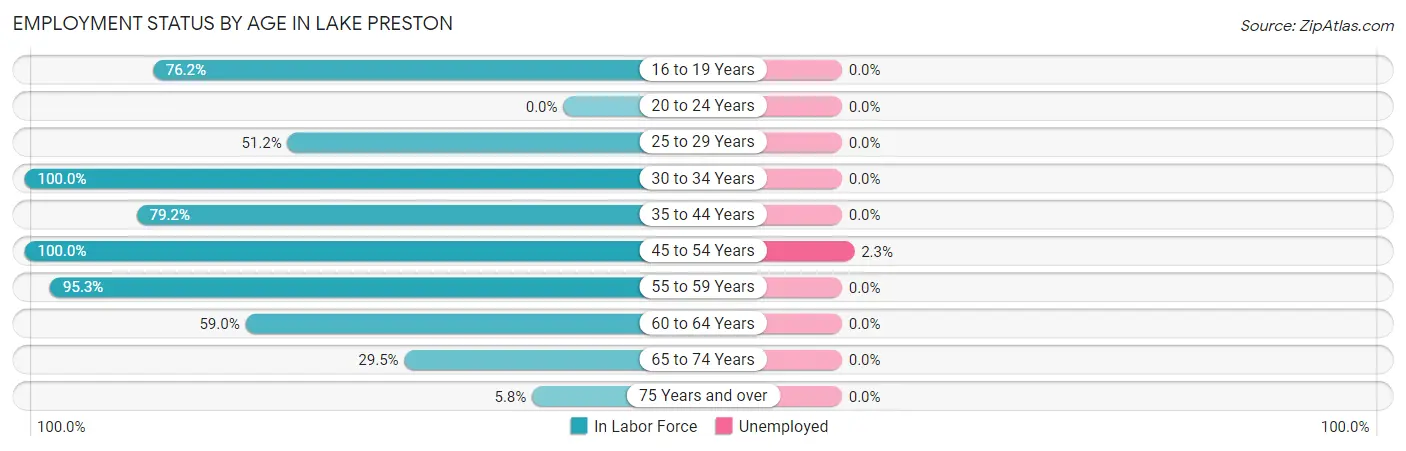
| Age Bracket | In Labor Force | Unemployed |
| 16 to 19 Years | 16 (76.2%) | 0 (0.0%) |
| 20 to 24 Years | 0 (0.0%) | 0 (0.0%) |
| 25 to 29 Years | 42 (51.2%) | 0 (0.0%) |
| 30 to 34 Years | 15 (100.0%) | 0 (0.0%) |
| 35 to 44 Years | 38 (79.2%) | 0 (0.0%) |
| 45 to 54 Years | 44 (100.0%) | 1 (2.3%) |
| 55 to 59 Years | 41 (95.3%) | 0 (0.0%) |
| 60 to 64 Years | 36 (59.0%) | 0 (0.0%) |
| 65 to 74 Years | 18 (29.5%) | 0 (0.0%) |
| 75 Years and over | 4 (5.8%) | 0 (0.0%) |
| Total | 254 (54.5%) | 1 (0.4%) |
Employment Status by Educational Attainment in Lake Preston
According to labor force statistics for Lake Preston, 73.7% of individuals (216) out of the total population between 25 and 64 years of age (293) are in the labor force, with 0.5% or 1 of them being unemployed. The group with the highest labor force participation rate are those with the educational attainment of college / associate degree, with 92.2% or 83 individuals in the labor force. Within the labor force, individuals with high school diploma education have the highest percentage of unemployment, with 1.3% or 1 of them being unemployed.
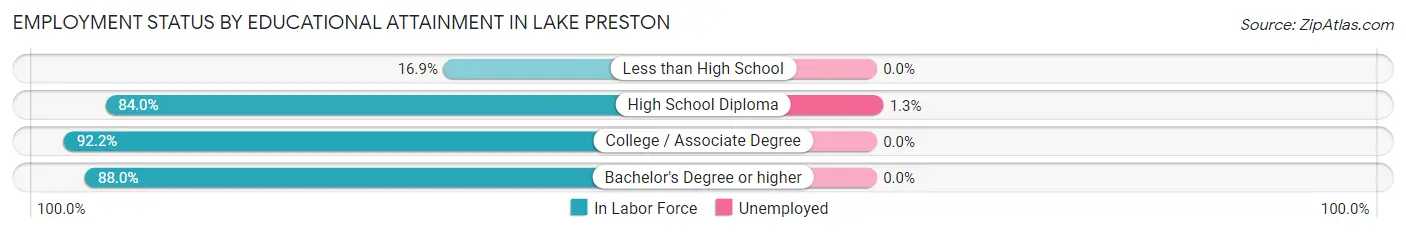
| Educational Attainment | In Labor Force | Unemployed |
| Less than High School | 10 (16.9%) | 0 (0.0%) |
| High School Diploma | 79 (84.0%) | 1 (1.3%) |
| College / Associate Degree | 83 (92.2%) | 0 (0.0%) |
| Bachelor's Degree or higher | 44 (88.0%) | 0 (0.0%) |
| Total | 216 (73.7%) | 1 (0.5%) |
Employment Occupations by Sex in Lake Preston
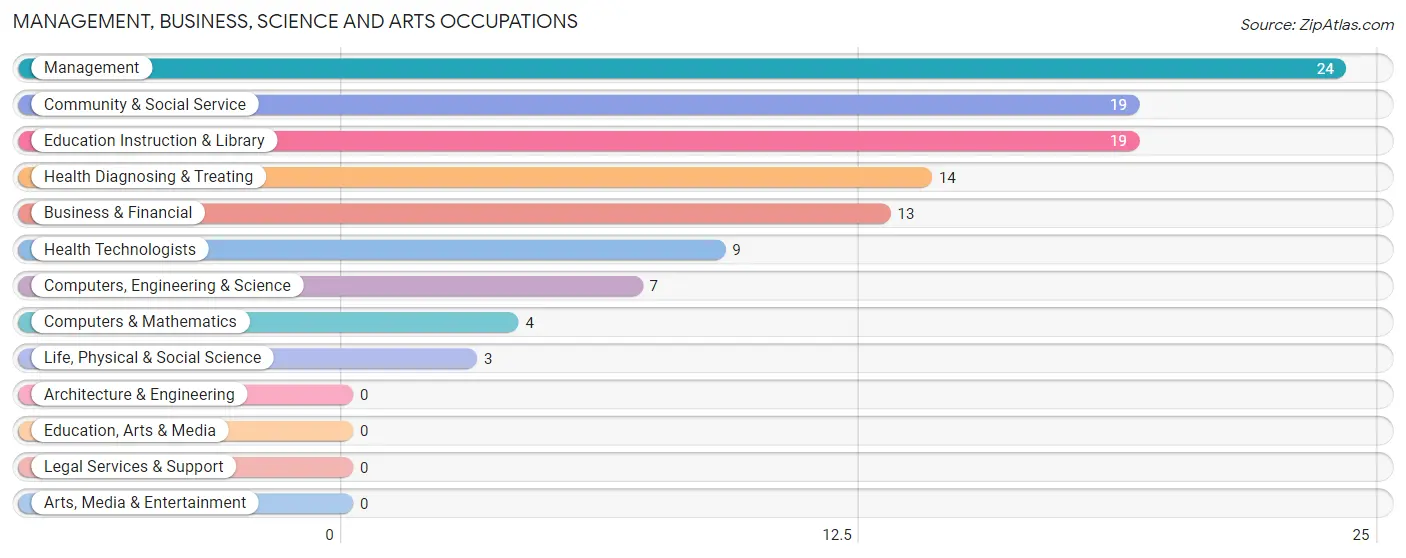
Management, Business, Science and Arts Occupations
The most common Management, Business, Science and Arts occupations in Lake Preston are Management (24 | 9.5%), Community & Social Service (19 | 7.5%), Education Instruction & Library (19 | 7.5%), Health Diagnosing & Treating (14 | 5.5%), and Business & Financial (13 | 5.1%).
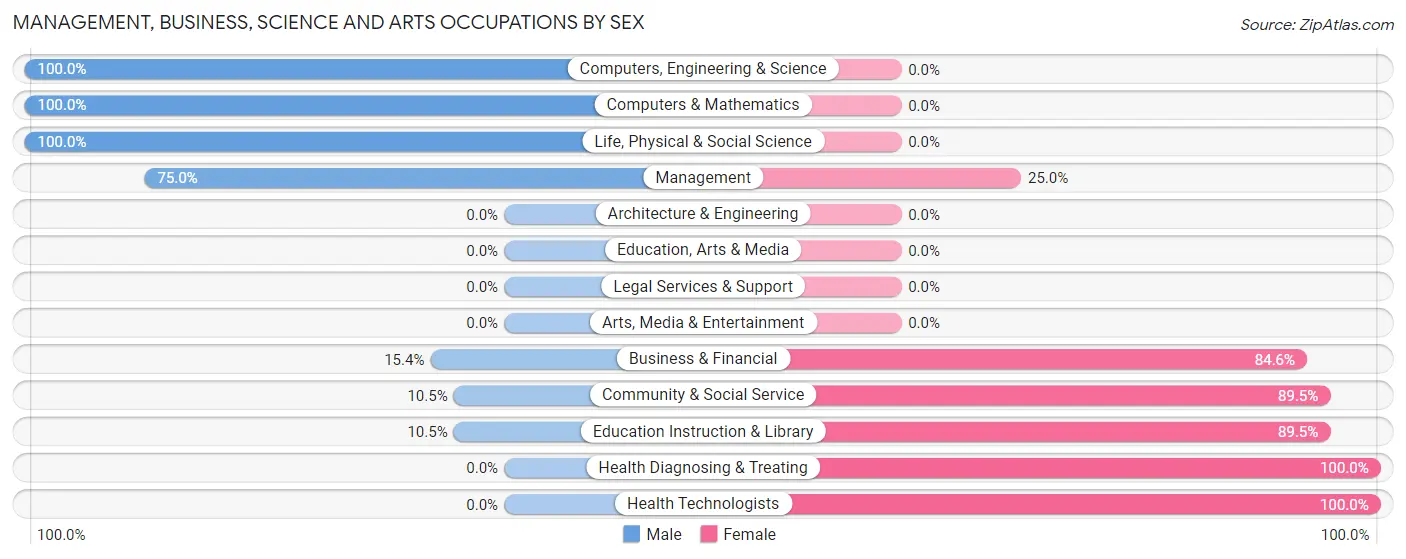
Management, Business, Science and Arts Occupations by Sex
Within the Management, Business, Science and Arts occupations in Lake Preston, the most male-oriented occupations are Computers, Engineering & Science (100.0%), Computers & Mathematics (100.0%), and Life, Physical & Social Science (100.0%), while the most female-oriented occupations are Health Diagnosing & Treating (100.0%), Health Technologists (100.0%), and Community & Social Service (89.5%).
| Occupation | Male | Female |
| Management | 18 (75.0%) | 6 (25.0%) |
| Business & Financial | 2 (15.4%) | 11 (84.6%) |
| Computers, Engineering & Science | 7 (100.0%) | 0 (0.0%) |
| Computers & Mathematics | 4 (100.0%) | 0 (0.0%) |
| Architecture & Engineering | 0 (0.0%) | 0 (0.0%) |
| Life, Physical & Social Science | 3 (100.0%) | 0 (0.0%) |
| Community & Social Service | 2 (10.5%) | 17 (89.5%) |
| Education, Arts & Media | 0 (0.0%) | 0 (0.0%) |
| Legal Services & Support | 0 (0.0%) | 0 (0.0%) |
| Education Instruction & Library | 2 (10.5%) | 17 (89.5%) |
| Arts, Media & Entertainment | 0 (0.0%) | 0 (0.0%) |
| Health Diagnosing & Treating | 0 (0.0%) | 14 (100.0%) |
| Health Technologists | 0 (0.0%) | 9 (100.0%) |
| Total (Category) | 29 (37.7%) | 48 (62.3%) |
| Total (Overall) | 140 (55.3%) | 113 (44.7%) |
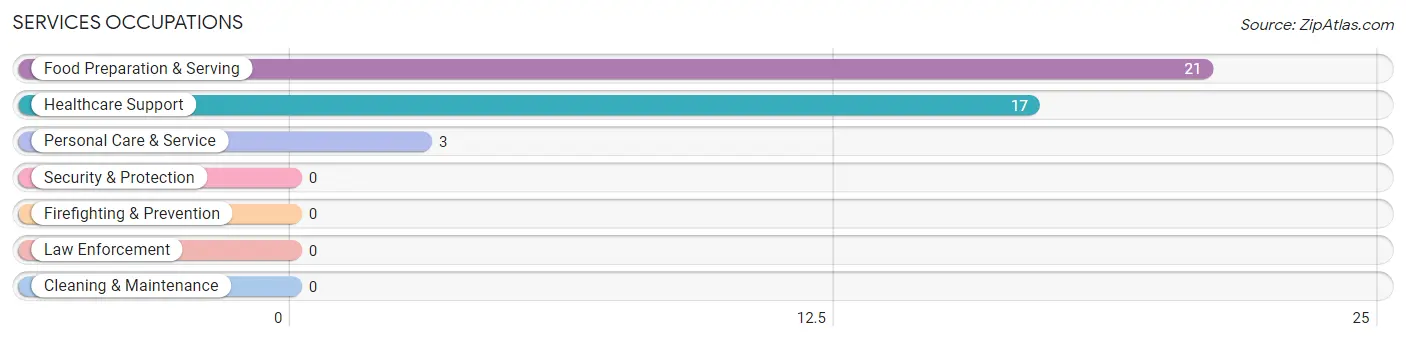
Services Occupations
The most common Services occupations in Lake Preston are Food Preparation & Serving (21 | 8.3%), Healthcare Support (17 | 6.7%), and Personal Care & Service (3 | 1.2%).
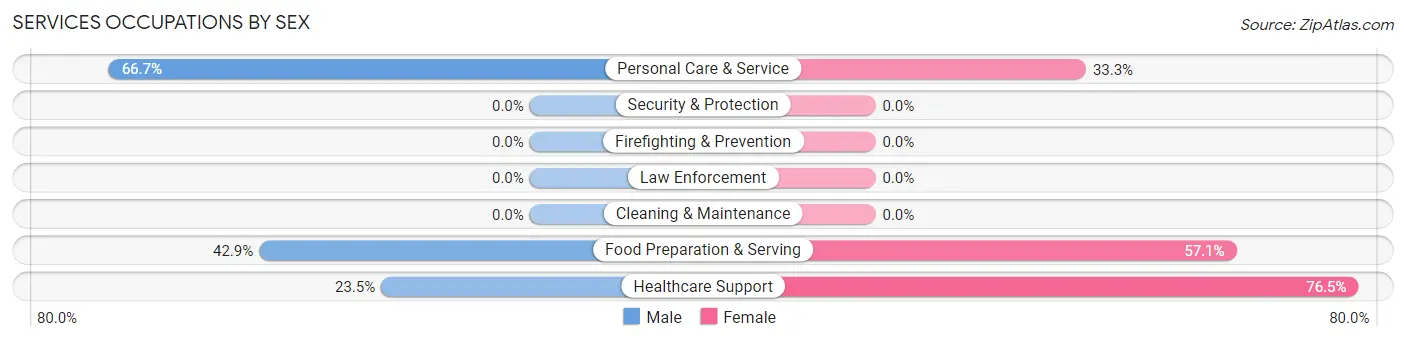
Services Occupations by Sex
Within the Services occupations in Lake Preston, the most male-oriented occupations are Personal Care & Service (66.7%), Food Preparation & Serving (42.9%), and Healthcare Support (23.5%), while the most female-oriented occupations are Healthcare Support (76.5%), Food Preparation & Serving (57.1%), and Personal Care & Service (33.3%).
| Occupation | Male | Female |
| Healthcare Support | 4 (23.5%) | 13 (76.5%) |
| Security & Protection | 0 (0.0%) | 0 (0.0%) |
| Firefighting & Prevention | 0 (0.0%) | 0 (0.0%) |
| Law Enforcement | 0 (0.0%) | 0 (0.0%) |
| Food Preparation & Serving | 9 (42.9%) | 12 (57.1%) |
| Cleaning & Maintenance | 0 (0.0%) | 0 (0.0%) |
| Personal Care & Service | 2 (66.7%) | 1 (33.3%) |
| Total (Category) | 15 (36.6%) | 26 (63.4%) |
| Total (Overall) | 140 (55.3%) | 113 (44.7%) |
Sales and Office Occupations
The most common Sales and Office occupations in Lake Preston are Office & Administration (16 | 6.3%), and Sales & Related (4 | 1.6%).
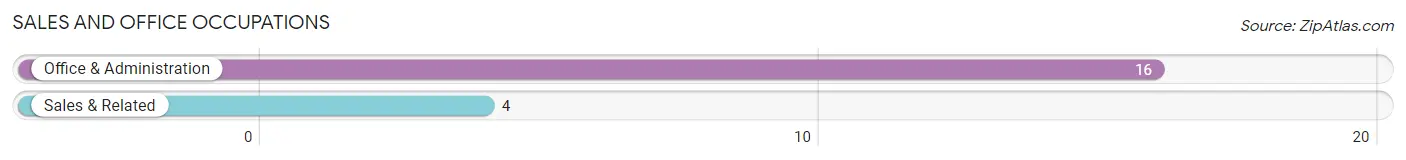
Sales and Office Occupations by Sex
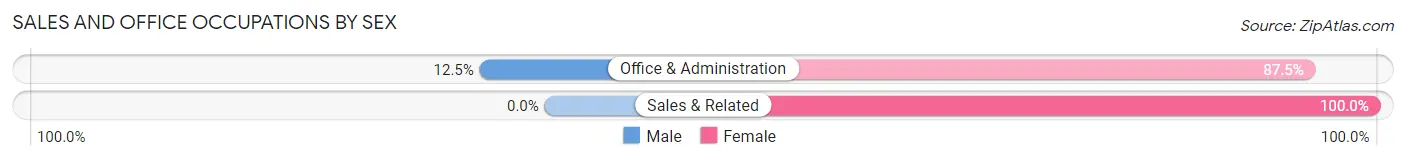
| Occupation | Male | Female |
| Sales & Related | 0 (0.0%) | 4 (100.0%) |
| Office & Administration | 2 (12.5%) | 14 (87.5%) |
| Total (Category) | 2 (10.0%) | 18 (90.0%) |
| Total (Overall) | 140 (55.3%) | 113 (44.7%) |
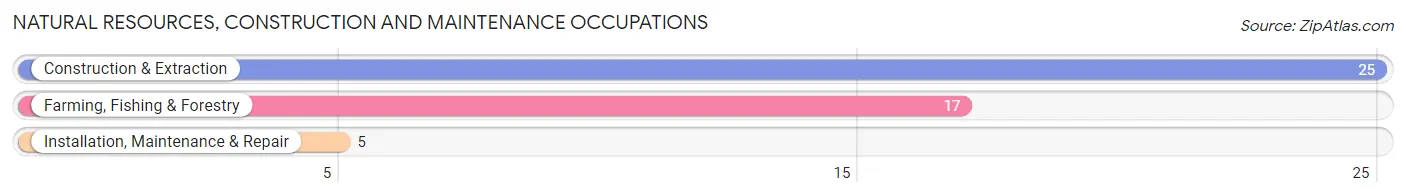
Natural Resources, Construction and Maintenance Occupations
The most common Natural Resources, Construction and Maintenance occupations in Lake Preston are Construction & Extraction (25 | 9.9%), Farming, Fishing & Forestry (17 | 6.7%), and Installation, Maintenance & Repair (5 | 2.0%).
Natural Resources, Construction and Maintenance Occupations by Sex
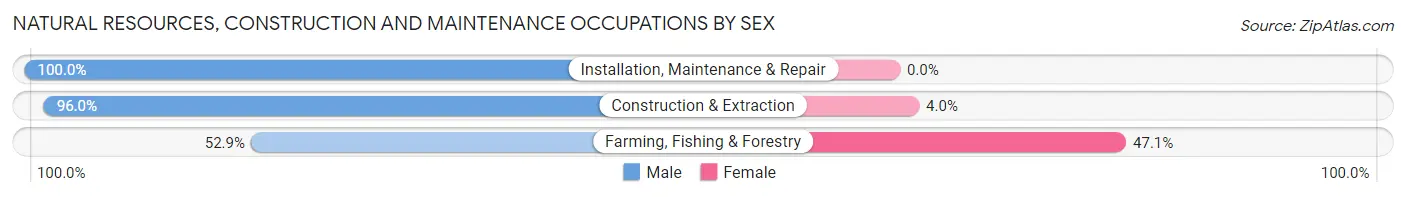
| Occupation | Male | Female |
| Farming, Fishing & Forestry | 9 (52.9%) | 8 (47.1%) |
| Construction & Extraction | 24 (96.0%) | 1 (4.0%) |
| Installation, Maintenance & Repair | 5 (100.0%) | 0 (0.0%) |
| Total (Category) | 38 (80.8%) | 9 (19.2%) |
| Total (Overall) | 140 (55.3%) | 113 (44.7%) |
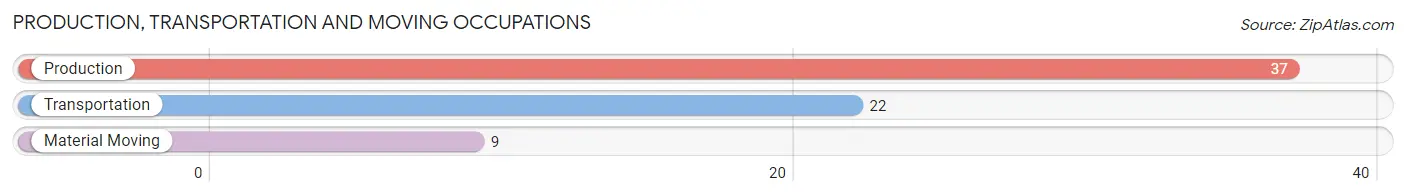
Production, Transportation and Moving Occupations
The most common Production, Transportation and Moving occupations in Lake Preston are Production (37 | 14.6%), Transportation (22 | 8.7%), and Material Moving (9 | 3.6%).
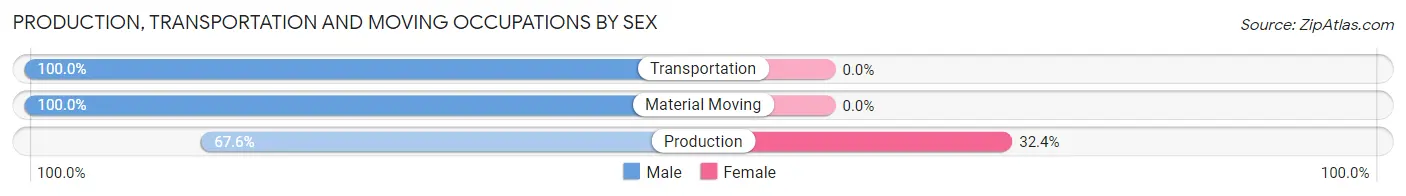
Production, Transportation and Moving Occupations by Sex
| Occupation | Male | Female |
| Production | 25 (67.6%) | 12 (32.4%) |
| Transportation | 22 (100.0%) | 0 (0.0%) |
| Material Moving | 9 (100.0%) | 0 (0.0%) |
| Total (Category) | 56 (82.4%) | 12 (17.6%) |
| Total (Overall) | 140 (55.3%) | 113 (44.7%) |
Employment Industries by Sex in Lake Preston
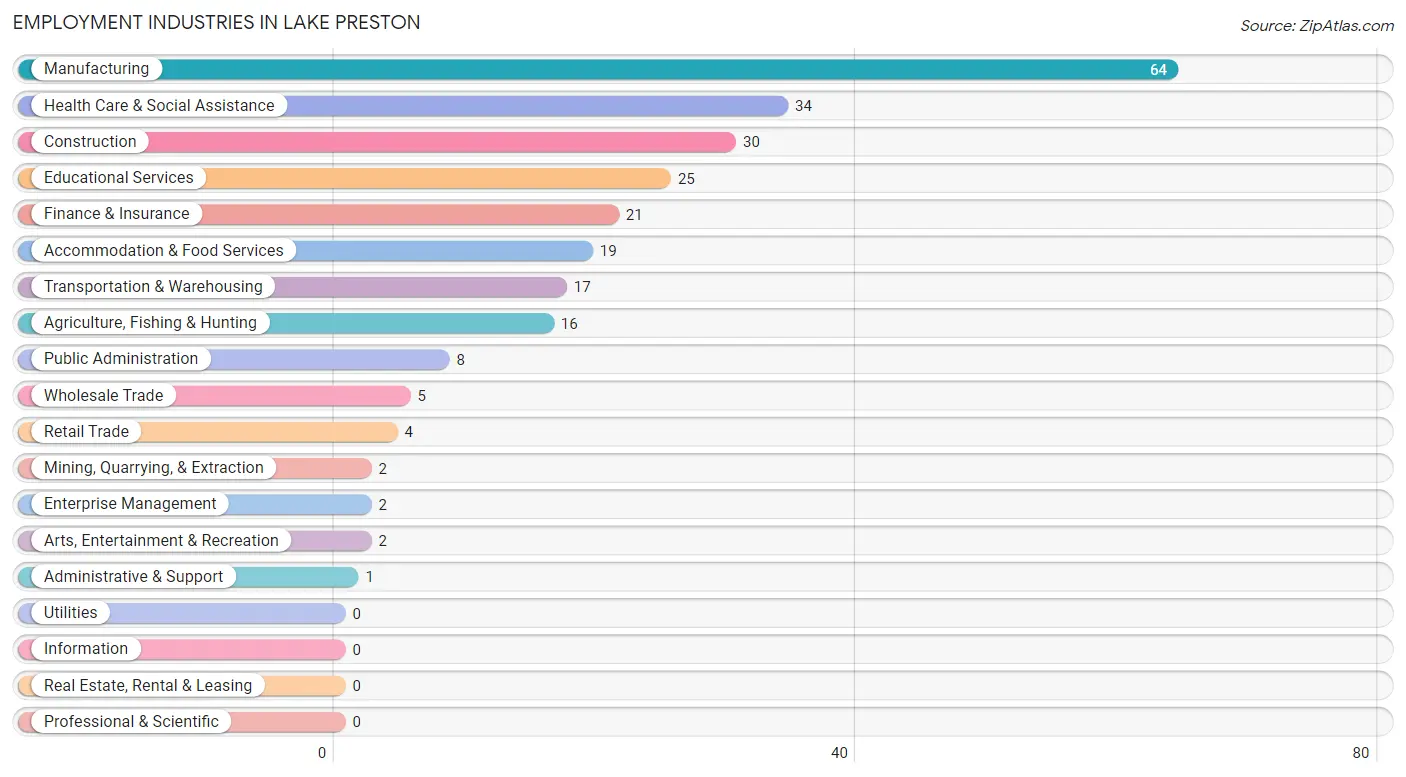
Employment Industries in Lake Preston
The major employment industries in Lake Preston include Manufacturing (64 | 25.3%), Health Care & Social Assistance (34 | 13.4%), Construction (30 | 11.9%), Educational Services (25 | 9.9%), and Finance & Insurance (21 | 8.3%).
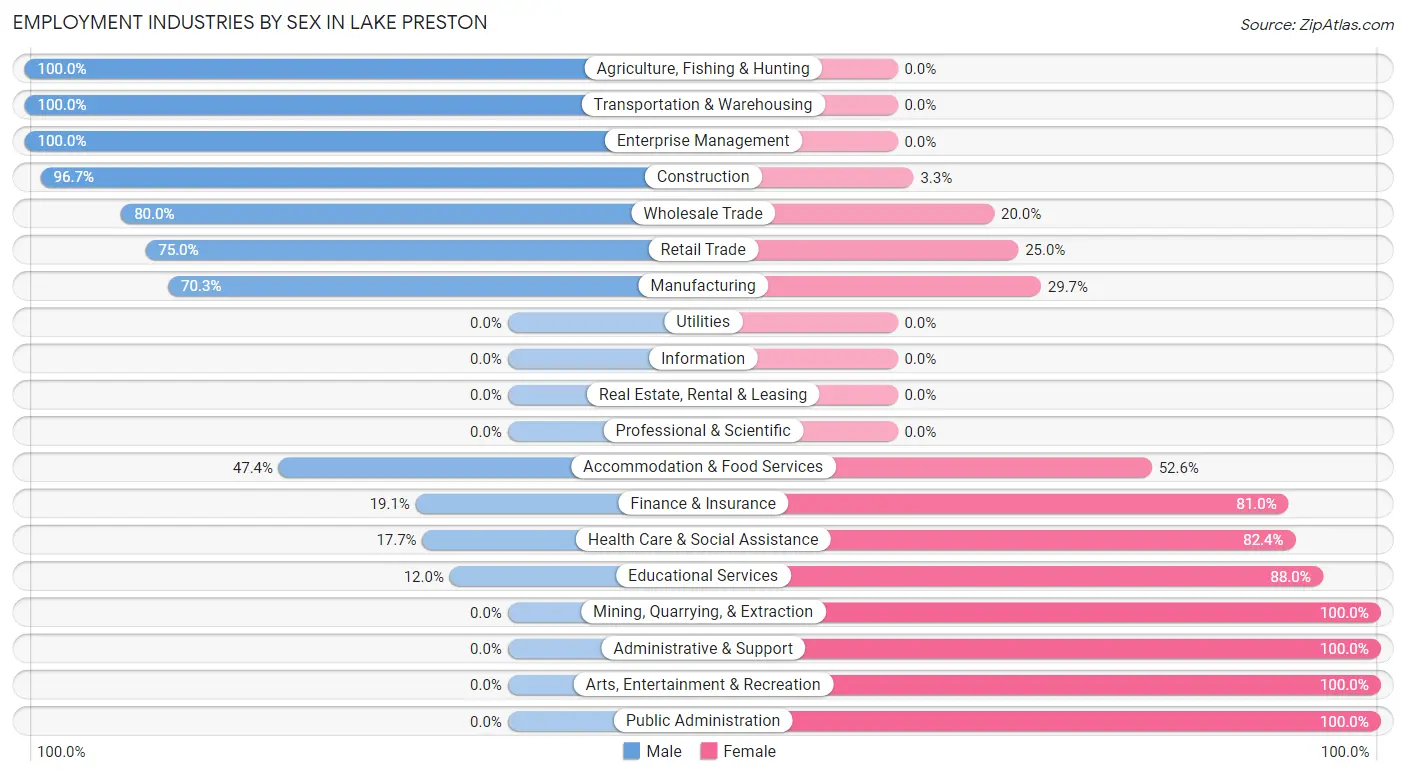
Employment Industries by Sex in Lake Preston
The Lake Preston industries that see more men than women are Agriculture, Fishing & Hunting (100.0%), Transportation & Warehousing (100.0%), and Enterprise Management (100.0%), whereas the industries that tend to have a higher number of women are Mining, Quarrying, & Extraction (100.0%), Administrative & Support (100.0%), and Arts, Entertainment & Recreation (100.0%).
| Industry | Male | Female |
| Agriculture, Fishing & Hunting | 16 (100.0%) | 0 (0.0%) |
| Mining, Quarrying, & Extraction | 0 (0.0%) | 2 (100.0%) |
| Construction | 29 (96.7%) | 1 (3.3%) |
| Manufacturing | 45 (70.3%) | 19 (29.7%) |
| Wholesale Trade | 4 (80.0%) | 1 (20.0%) |
| Retail Trade | 3 (75.0%) | 1 (25.0%) |
| Transportation & Warehousing | 17 (100.0%) | 0 (0.0%) |
| Utilities | 0 (0.0%) | 0 (0.0%) |
| Information | 0 (0.0%) | 0 (0.0%) |
| Finance & Insurance | 4 (19.1%) | 17 (80.9%) |
| Real Estate, Rental & Leasing | 0 (0.0%) | 0 (0.0%) |
| Professional & Scientific | 0 (0.0%) | 0 (0.0%) |
| Enterprise Management | 2 (100.0%) | 0 (0.0%) |
| Administrative & Support | 0 (0.0%) | 1 (100.0%) |
| Educational Services | 3 (12.0%) | 22 (88.0%) |
| Health Care & Social Assistance | 6 (17.6%) | 28 (82.4%) |
| Arts, Entertainment & Recreation | 0 (0.0%) | 2 (100.0%) |
| Accommodation & Food Services | 9 (47.4%) | 10 (52.6%) |
| Public Administration | 0 (0.0%) | 8 (100.0%) |
| Total | 140 (55.3%) | 113 (44.7%) |
Education in Lake Preston
School Enrollment in Lake Preston
The most common levels of schooling among the 92 students in Lake Preston are middle school (43 | 46.7%), elementary school (22 | 23.9%), and high school (15 | 16.3%).
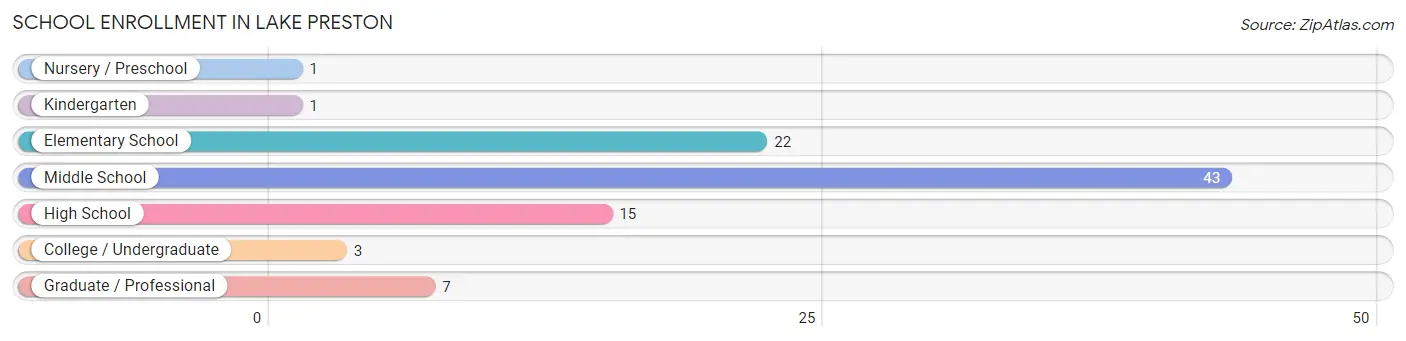
| School Level | # Students | % Students |
| Nursery / Preschool | 1 | 1.1% |
| Kindergarten | 1 | 1.1% |
| Elementary School | 22 | 23.9% |
| Middle School | 43 | 46.7% |
| High School | 15 | 16.3% |
| College / Undergraduate | 3 | 3.3% |
| Graduate / Professional | 7 | 7.6% |
| Total | 92 | 100.0% |
School Enrollment by Age by Funding Source in Lake Preston
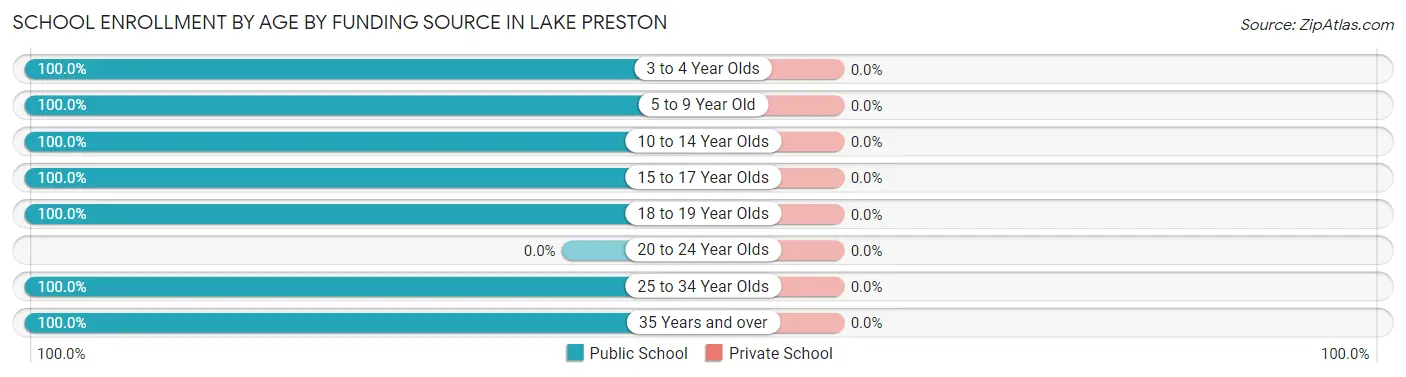
| Age Bracket | Public School | Private School |
| 3 to 4 Year Olds | 1 (100.0%) | 0 (0.0%) |
| 5 to 9 Year Old | 23 (100.0%) | 0 (0.0%) |
| 10 to 14 Year Olds | 41 (100.0%) | 0 (0.0%) |
| 15 to 17 Year Olds | 15 (100.0%) | 0 (0.0%) |
| 18 to 19 Year Olds | 2 (100.0%) | 0 (0.0%) |
| 20 to 24 Year Olds | 0 (0.0%) | 0 (0.0%) |
| 25 to 34 Year Olds | 3 (100.0%) | 0 (0.0%) |
| 35 Years and over | 7 (100.0%) | 0 (0.0%) |
| Total | 92 (100.0%) | 0 (0.0%) |
Educational Attainment by Field of Study in Lake Preston
Bio, nature & agricultural (13 | 19.7%), business (13 | 19.7%), education (13 | 19.7%), science & technology (10 | 15.1%), and arts & humanities (6 | 9.1%) are the most common fields of study among 66 individuals in Lake Preston who have obtained a bachelor's degree or higher.
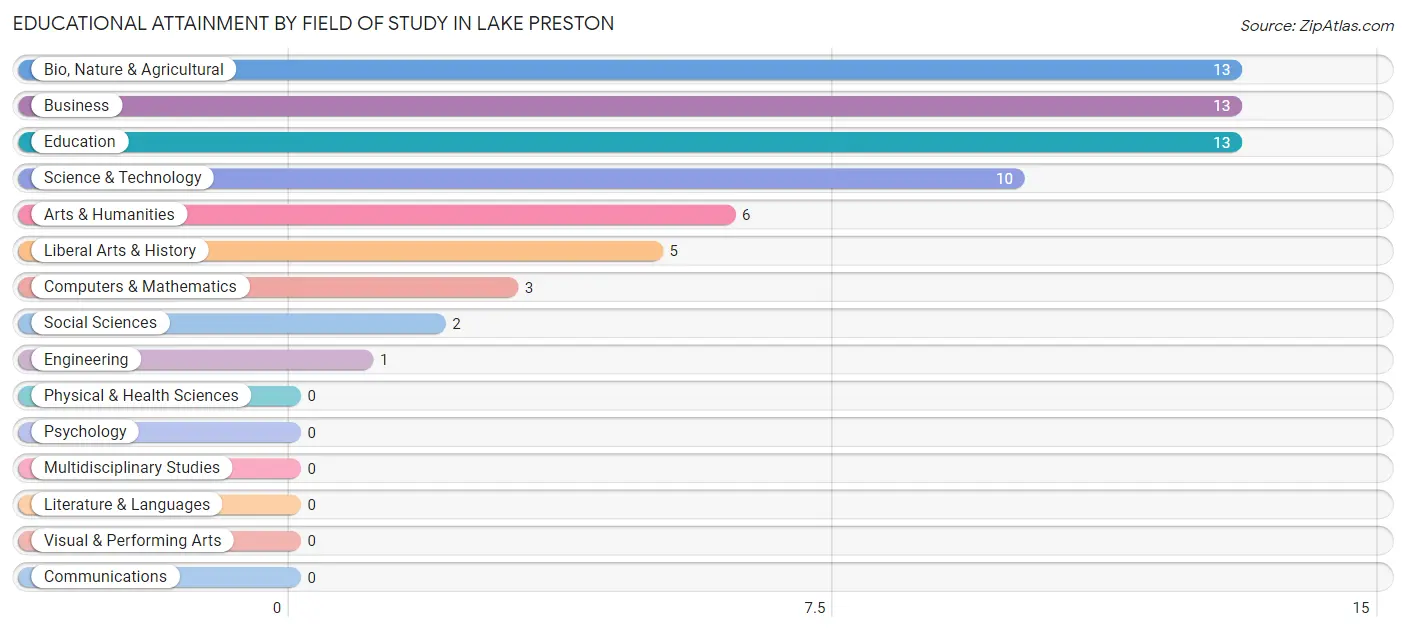
| Field of Study | # Graduates | % Graduates |
| Computers & Mathematics | 3 | 4.5% |
| Bio, Nature & Agricultural | 13 | 19.7% |
| Physical & Health Sciences | 0 | 0.0% |
| Psychology | 0 | 0.0% |
| Social Sciences | 2 | 3.0% |
| Engineering | 1 | 1.5% |
| Multidisciplinary Studies | 0 | 0.0% |
| Science & Technology | 10 | 15.1% |
| Business | 13 | 19.7% |
| Education | 13 | 19.7% |
| Literature & Languages | 0 | 0.0% |
| Liberal Arts & History | 5 | 7.6% |
| Visual & Performing Arts | 0 | 0.0% |
| Communications | 0 | 0.0% |
| Arts & Humanities | 6 | 9.1% |
| Total | 66 | 100.0% |
Transportation & Commute in Lake Preston
Vehicle Availability by Sex in Lake Preston
The most prevalent vehicle ownership categories in Lake Preston are males with 2 vehicles (46, accounting for 32.9%) and females with 2 vehicles (47, making up 40.7%).
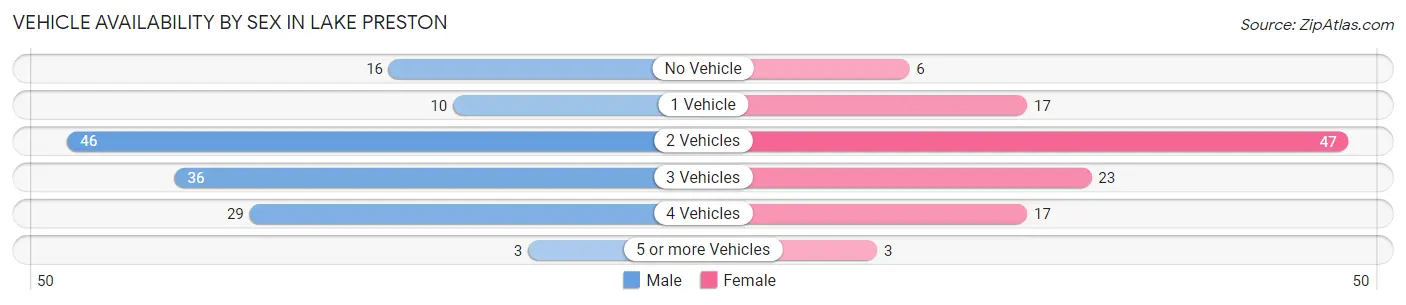
| Vehicles Available | Male | Female |
| No Vehicle | 16 (11.4%) | 6 (5.3%) |
| 1 Vehicle | 10 (7.1%) | 17 (15.0%) |
| 2 Vehicles | 46 (32.9%) | 47 (41.6%) |
| 3 Vehicles | 36 (25.7%) | 23 (20.3%) |
| 4 Vehicles | 29 (20.7%) | 17 (15.0%) |
| 5 or more Vehicles | 3 (2.1%) | 3 (2.6%) |
| Total | 140 (100.0%) | 113 (100.0%) |
Commute Time in Lake Preston
The most frequently occuring commute durations in Lake Preston are 10 to 14 minutes (52 commuters, 21.8%), less than 5 minutes (47 commuters, 19.7%), and 30 to 34 minutes (30 commuters, 12.6%).
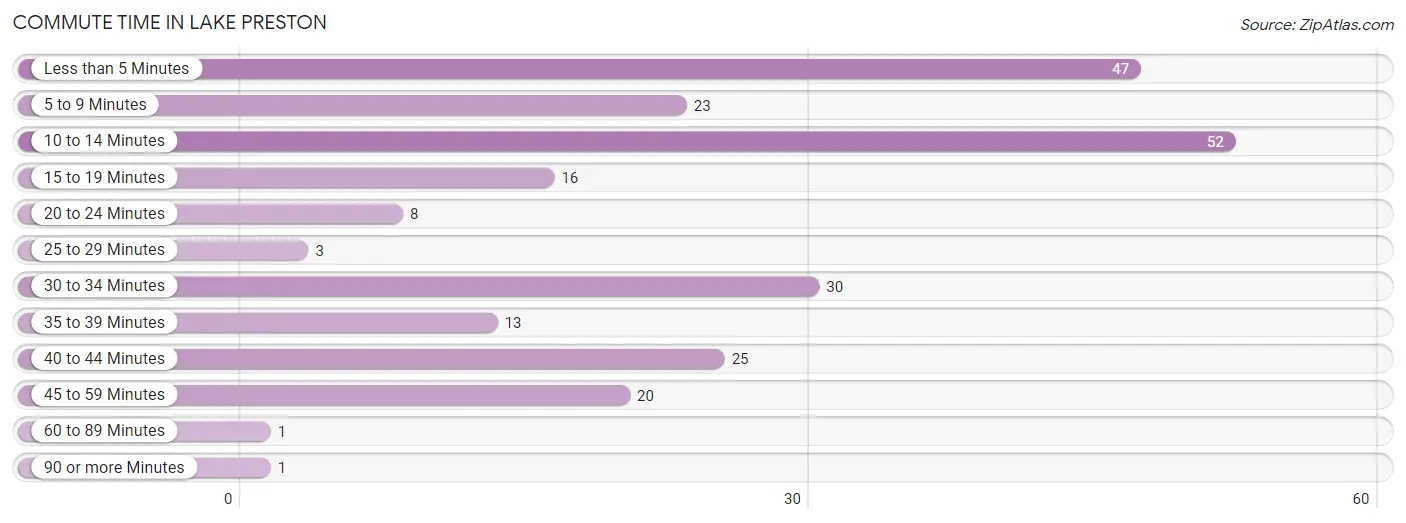
| Commute Time | # Commuters | % Commuters |
| Less than 5 Minutes | 47 | 19.7% |
| 5 to 9 Minutes | 23 | 9.6% |
| 10 to 14 Minutes | 52 | 21.8% |
| 15 to 19 Minutes | 16 | 6.7% |
| 20 to 24 Minutes | 8 | 3.4% |
| 25 to 29 Minutes | 3 | 1.3% |
| 30 to 34 Minutes | 30 | 12.6% |
| 35 to 39 Minutes | 13 | 5.4% |
| 40 to 44 Minutes | 25 | 10.5% |
| 45 to 59 Minutes | 20 | 8.4% |
| 60 to 89 Minutes | 1 | 0.4% |
| 90 or more Minutes | 1 | 0.4% |
Commute Time by Sex in Lake Preston
The most common commute times in Lake Preston are 30 to 34 minutes (29 commuters, 21.8%) for males and 10 to 14 minutes (36 commuters, 34.0%) for females.
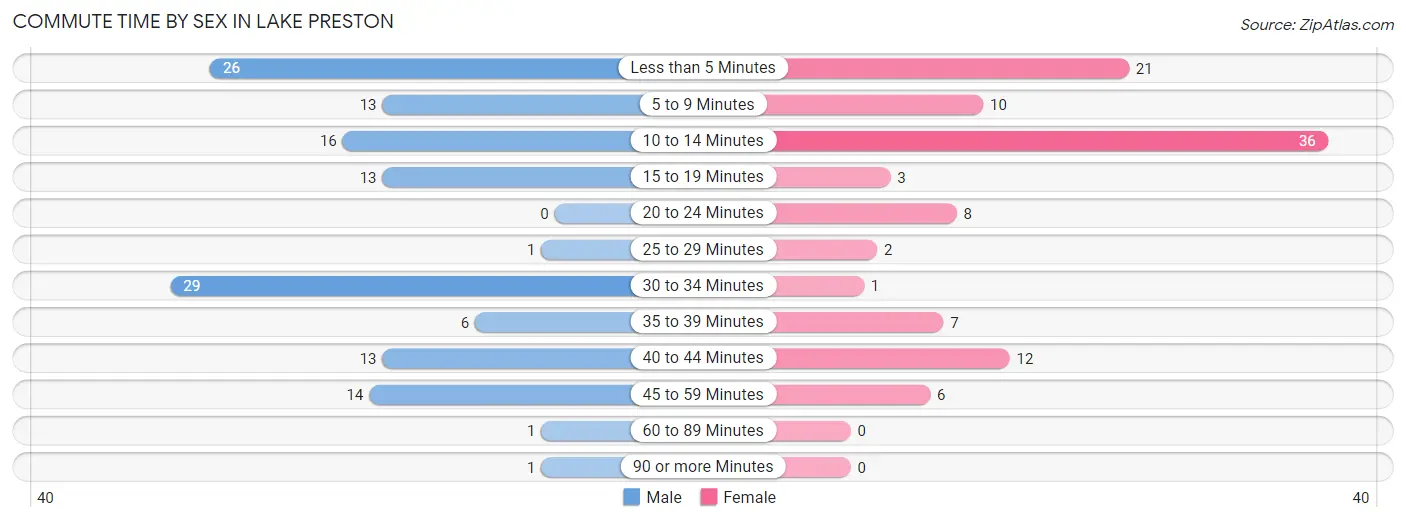
| Commute Time | Male | Female |
| Less than 5 Minutes | 26 (19.6%) | 21 (19.8%) |
| 5 to 9 Minutes | 13 (9.8%) | 10 (9.4%) |
| 10 to 14 Minutes | 16 (12.0%) | 36 (34.0%) |
| 15 to 19 Minutes | 13 (9.8%) | 3 (2.8%) |
| 20 to 24 Minutes | 0 (0.0%) | 8 (7.5%) |
| 25 to 29 Minutes | 1 (0.7%) | 2 (1.9%) |
| 30 to 34 Minutes | 29 (21.8%) | 1 (0.9%) |
| 35 to 39 Minutes | 6 (4.5%) | 7 (6.6%) |
| 40 to 44 Minutes | 13 (9.8%) | 12 (11.3%) |
| 45 to 59 Minutes | 14 (10.5%) | 6 (5.7%) |
| 60 to 89 Minutes | 1 (0.7%) | 0 (0.0%) |
| 90 or more Minutes | 1 (0.7%) | 0 (0.0%) |
Time of Departure to Work by Sex in Lake Preston
The most frequent times of departure to work in Lake Preston are 6:00 AM to 6:29 AM (35, 26.3%) for males and 7:00 AM to 7:29 AM (29, 27.4%) for females.
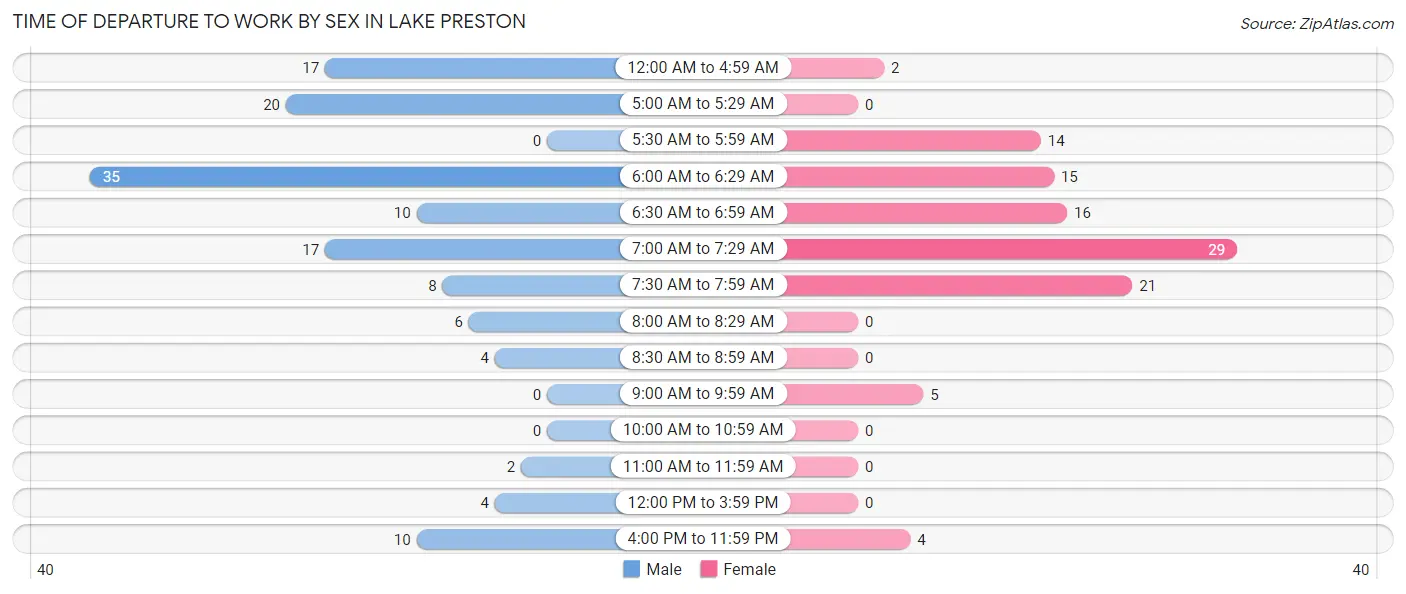
| Time of Departure | Male | Female |
| 12:00 AM to 4:59 AM | 17 (12.8%) | 2 (1.9%) |
| 5:00 AM to 5:29 AM | 20 (15.0%) | 0 (0.0%) |
| 5:30 AM to 5:59 AM | 0 (0.0%) | 14 (13.2%) |
| 6:00 AM to 6:29 AM | 35 (26.3%) | 15 (14.1%) |
| 6:30 AM to 6:59 AM | 10 (7.5%) | 16 (15.1%) |
| 7:00 AM to 7:29 AM | 17 (12.8%) | 29 (27.4%) |
| 7:30 AM to 7:59 AM | 8 (6.0%) | 21 (19.8%) |
| 8:00 AM to 8:29 AM | 6 (4.5%) | 0 (0.0%) |
| 8:30 AM to 8:59 AM | 4 (3.0%) | 0 (0.0%) |
| 9:00 AM to 9:59 AM | 0 (0.0%) | 5 (4.7%) |
| 10:00 AM to 10:59 AM | 0 (0.0%) | 0 (0.0%) |
| 11:00 AM to 11:59 AM | 2 (1.5%) | 0 (0.0%) |
| 12:00 PM to 3:59 PM | 4 (3.0%) | 0 (0.0%) |
| 4:00 PM to 11:59 PM | 10 (7.5%) | 4 (3.8%) |
| Total | 133 (100.0%) | 106 (100.0%) |
Housing Occupancy in Lake Preston
Occupancy by Ownership in Lake Preston
Of the total 245 dwellings in Lake Preston, owner-occupied units account for 162 (66.1%), while renter-occupied units make up 83 (33.9%).
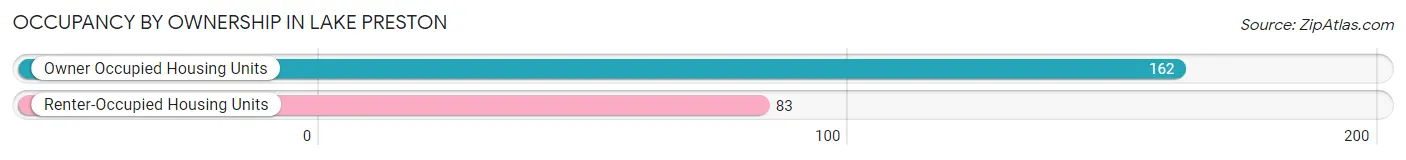
| Occupancy | # Housing Units | % Housing Units |
| Owner Occupied Housing Units | 162 | 66.1% |
| Renter-Occupied Housing Units | 83 | 33.9% |
| Total Occupied Housing Units | 245 | 100.0% |
Occupancy by Household Size in Lake Preston
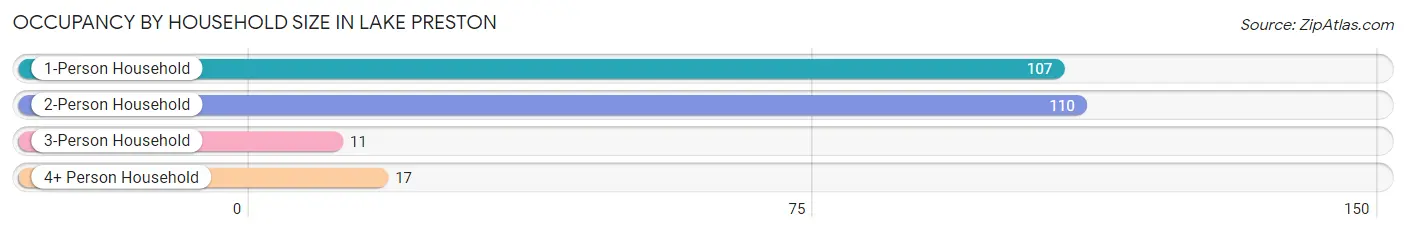
| Household Size | # Housing Units | % Housing Units |
| 1-Person Household | 107 | 43.7% |
| 2-Person Household | 110 | 44.9% |
| 3-Person Household | 11 | 4.5% |
| 4+ Person Household | 17 | 6.9% |
| Total Housing Units | 245 | 100.0% |
Occupancy by Ownership by Household Size in Lake Preston
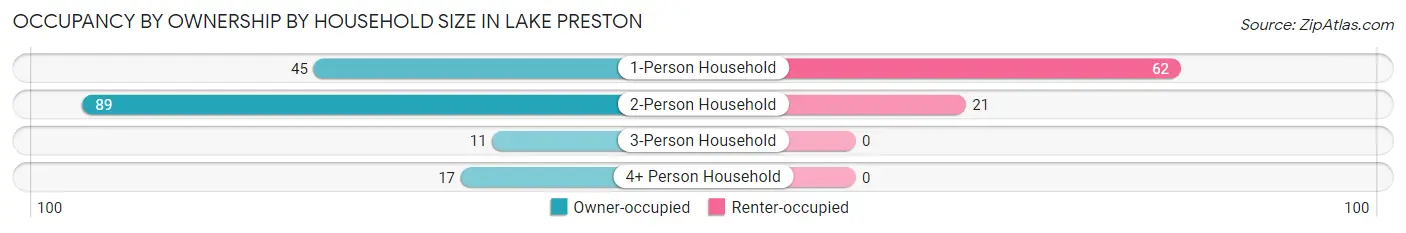
| Household Size | Owner-occupied | Renter-occupied |
| 1-Person Household | 45 (42.1%) | 62 (57.9%) |
| 2-Person Household | 89 (80.9%) | 21 (19.1%) |
| 3-Person Household | 11 (100.0%) | 0 (0.0%) |
| 4+ Person Household | 17 (100.0%) | 0 (0.0%) |
| Total Housing Units | 162 (66.1%) | 83 (33.9%) |
Occupancy by Educational Attainment in Lake Preston
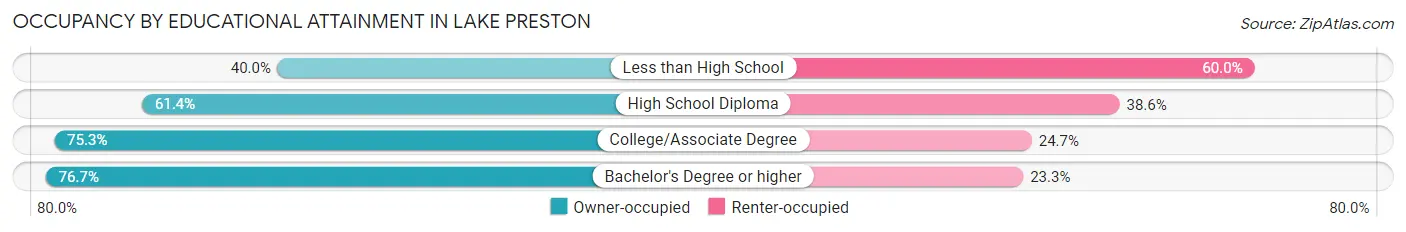
| Household Size | Owner-occupied | Renter-occupied |
| Less than High School | 8 (40.0%) | 12 (60.0%) |
| High School Diploma | 70 (61.4%) | 44 (38.6%) |
| College/Associate Degree | 61 (75.3%) | 20 (24.7%) |
| Bachelor's Degree or higher | 23 (76.7%) | 7 (23.3%) |
Occupancy by Age of Householder in Lake Preston
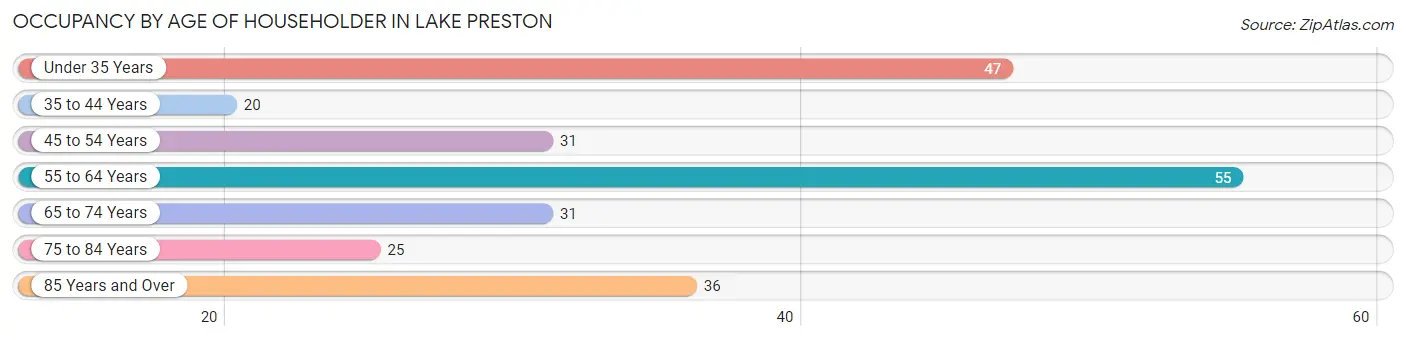
| Age Bracket | # Households | % Households |
| Under 35 Years | 47 | 19.2% |
| 35 to 44 Years | 20 | 8.2% |
| 45 to 54 Years | 31 | 12.7% |
| 55 to 64 Years | 55 | 22.5% |
| 65 to 74 Years | 31 | 12.7% |
| 75 to 84 Years | 25 | 10.2% |
| 85 Years and Over | 36 | 14.7% |
| Total | 245 | 100.0% |
Housing Finances in Lake Preston
Median Income by Occupancy in Lake Preston
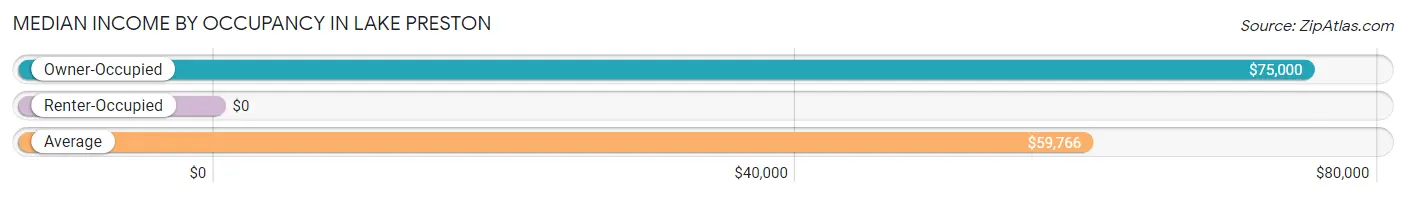
| Occupancy Type | # Households | Median Income |
| Owner-Occupied | 162 (66.1%) | $75,000 |
| Renter-Occupied | 83 (33.9%) | $0 |
| Average | 245 (100.0%) | $59,766 |
Occupancy by Householder Income Bracket in Lake Preston
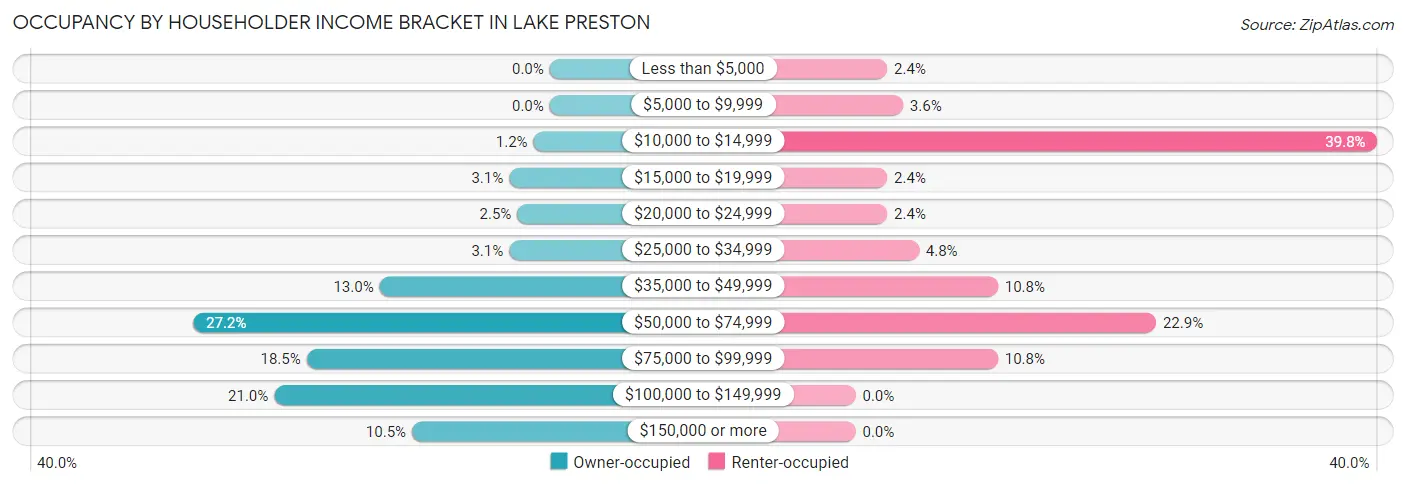
| Income Bracket | Owner-occupied | Renter-occupied |
| Less than $5,000 | 0 (0.0%) | 2 (2.4%) |
| $5,000 to $9,999 | 0 (0.0%) | 3 (3.6%) |
| $10,000 to $14,999 | 2 (1.2%) | 33 (39.8%) |
| $15,000 to $19,999 | 5 (3.1%) | 2 (2.4%) |
| $20,000 to $24,999 | 4 (2.5%) | 2 (2.4%) |
| $25,000 to $34,999 | 5 (3.1%) | 4 (4.8%) |
| $35,000 to $49,999 | 21 (13.0%) | 9 (10.8%) |
| $50,000 to $74,999 | 44 (27.2%) | 19 (22.9%) |
| $75,000 to $99,999 | 30 (18.5%) | 9 (10.8%) |
| $100,000 to $149,999 | 34 (21.0%) | 0 (0.0%) |
| $150,000 or more | 17 (10.5%) | 0 (0.0%) |
| Total | 162 (100.0%) | 83 (100.0%) |
Monthly Housing Cost Tiers in Lake Preston
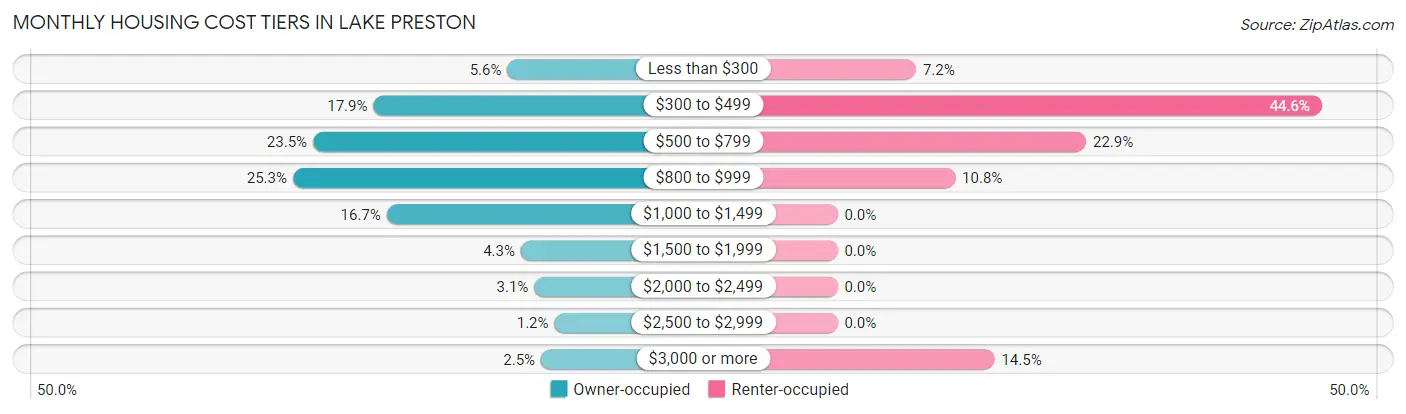
| Monthly Cost | Owner-occupied | Renter-occupied |
| Less than $300 | 9 (5.6%) | 6 (7.2%) |
| $300 to $499 | 29 (17.9%) | 37 (44.6%) |
| $500 to $799 | 38 (23.5%) | 19 (22.9%) |
| $800 to $999 | 41 (25.3%) | 9 (10.8%) |
| $1,000 to $1,499 | 27 (16.7%) | 0 (0.0%) |
| $1,500 to $1,999 | 7 (4.3%) | 0 (0.0%) |
| $2,000 to $2,499 | 5 (3.1%) | 0 (0.0%) |
| $2,500 to $2,999 | 2 (1.2%) | 0 (0.0%) |
| $3,000 or more | 4 (2.5%) | 12 (14.5%) |
| Total | 162 (100.0%) | 83 (100.0%) |
Physical Housing Characteristics in Lake Preston
Housing Structures in Lake Preston
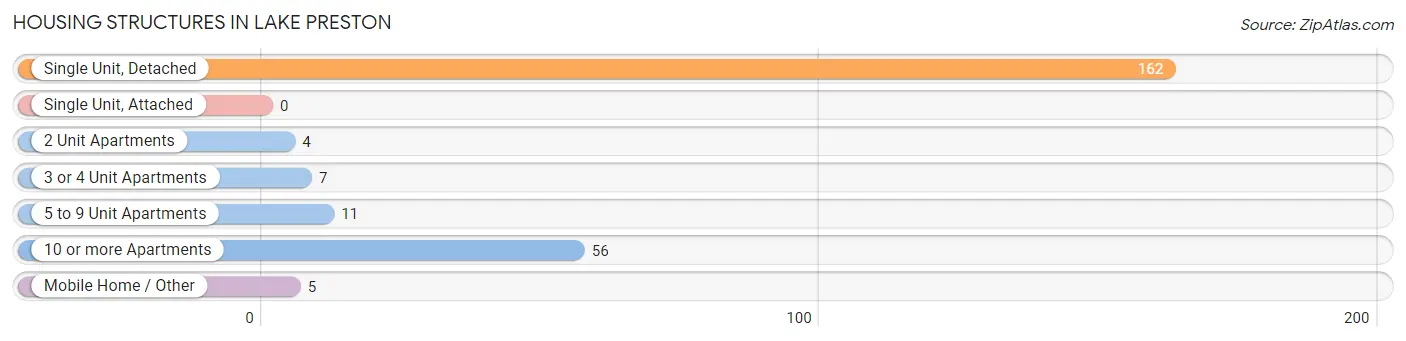
| Structure Type | # Housing Units | % Housing Units |
| Single Unit, Detached | 162 | 66.1% |
| Single Unit, Attached | 0 | 0.0% |
| 2 Unit Apartments | 4 | 1.6% |
| 3 or 4 Unit Apartments | 7 | 2.9% |
| 5 to 9 Unit Apartments | 11 | 4.5% |
| 10 or more Apartments | 56 | 22.9% |
| Mobile Home / Other | 5 | 2.0% |
| Total | 245 | 100.0% |
Housing Structures by Occupancy in Lake Preston
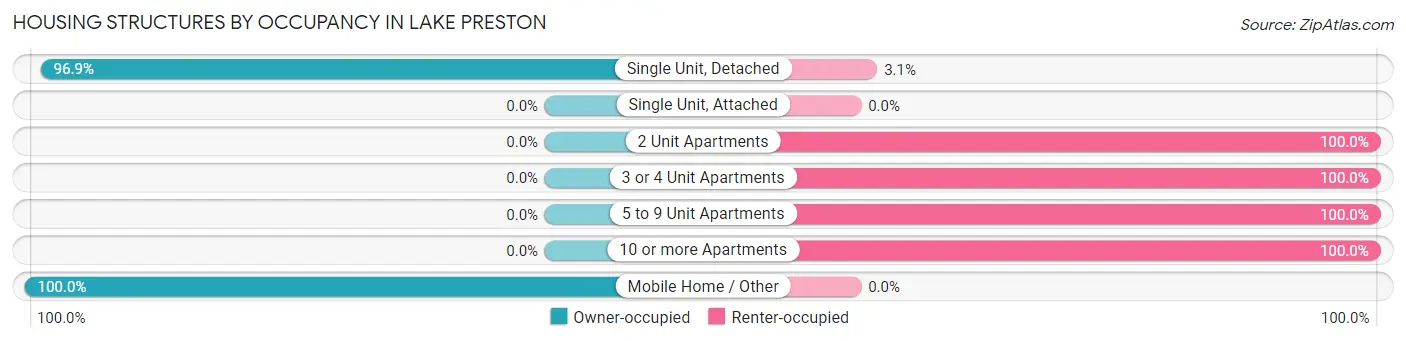
| Structure Type | Owner-occupied | Renter-occupied |
| Single Unit, Detached | 157 (96.9%) | 5 (3.1%) |
| Single Unit, Attached | 0 (0.0%) | 0 (0.0%) |
| 2 Unit Apartments | 0 (0.0%) | 4 (100.0%) |
| 3 or 4 Unit Apartments | 0 (0.0%) | 7 (100.0%) |
| 5 to 9 Unit Apartments | 0 (0.0%) | 11 (100.0%) |
| 10 or more Apartments | 0 (0.0%) | 56 (100.0%) |
| Mobile Home / Other | 5 (100.0%) | 0 (0.0%) |
| Total | 162 (66.1%) | 83 (33.9%) |
Housing Structures by Number of Rooms in Lake Preston
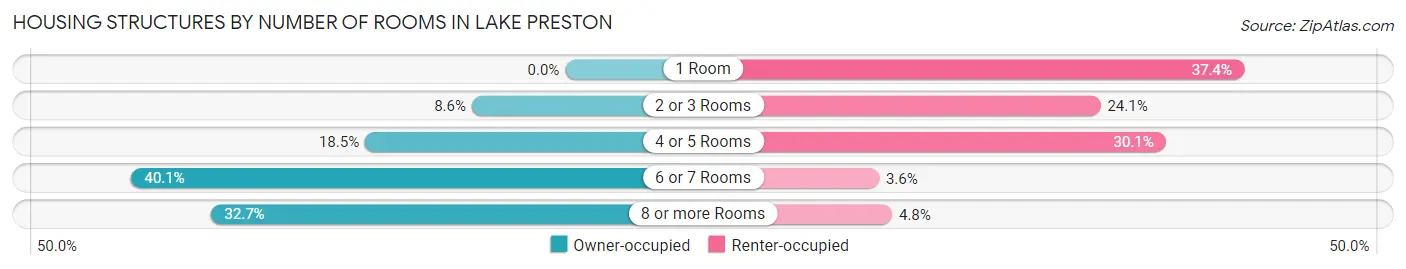
| Number of Rooms | Owner-occupied | Renter-occupied |
| 1 Room | 0 (0.0%) | 31 (37.3%) |
| 2 or 3 Rooms | 14 (8.6%) | 20 (24.1%) |
| 4 or 5 Rooms | 30 (18.5%) | 25 (30.1%) |
| 6 or 7 Rooms | 65 (40.1%) | 3 (3.6%) |
| 8 or more Rooms | 53 (32.7%) | 4 (4.8%) |
| Total | 162 (100.0%) | 83 (100.0%) |
Housing Structure by Heating Type in Lake Preston
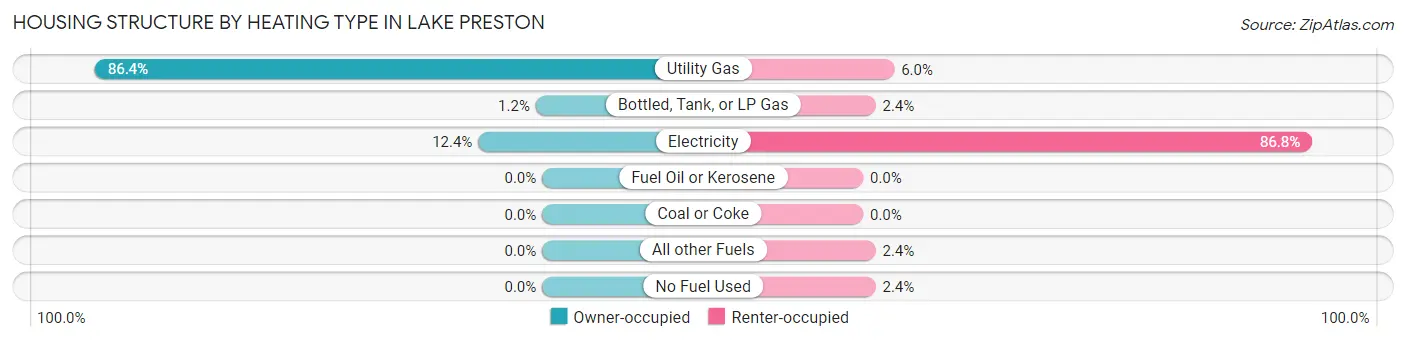
| Heating Type | Owner-occupied | Renter-occupied |
| Utility Gas | 140 (86.4%) | 5 (6.0%) |
| Bottled, Tank, or LP Gas | 2 (1.2%) | 2 (2.4%) |
| Electricity | 20 (12.3%) | 72 (86.8%) |
| Fuel Oil or Kerosene | 0 (0.0%) | 0 (0.0%) |
| Coal or Coke | 0 (0.0%) | 0 (0.0%) |
| All other Fuels | 0 (0.0%) | 2 (2.4%) |
| No Fuel Used | 0 (0.0%) | 2 (2.4%) |
| Total | 162 (100.0%) | 83 (100.0%) |
Household Vehicle Usage in Lake Preston
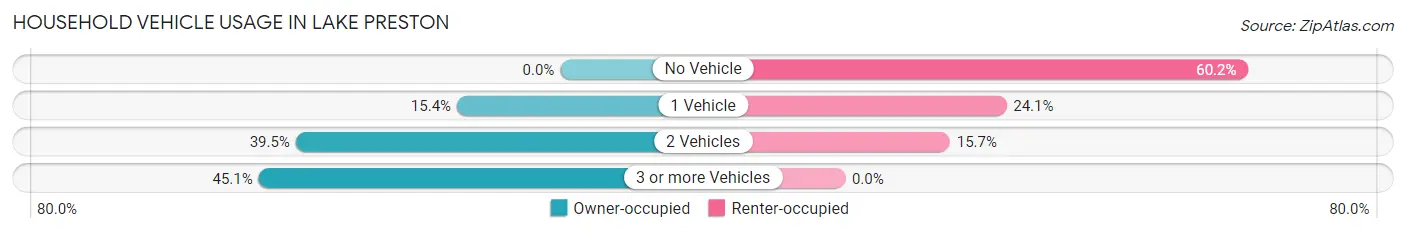
| Vehicles per Household | Owner-occupied | Renter-occupied |
| No Vehicle | 0 (0.0%) | 50 (60.2%) |
| 1 Vehicle | 25 (15.4%) | 20 (24.1%) |
| 2 Vehicles | 64 (39.5%) | 13 (15.7%) |
| 3 or more Vehicles | 73 (45.1%) | 0 (0.0%) |
| Total | 162 (100.0%) | 83 (100.0%) |
Real Estate & Mortgages in Lake Preston
Real Estate and Mortgage Overview in Lake Preston
| Characteristic | Without Mortgage | With Mortgage |
| Housing Units | 78 | 84 |
| Median Property Value | $90,000 | $126,700 |
| Median Household Income | $59,167 | $11 |
| Monthly Housing Costs | $505 | $4 |
| Real Estate Taxes | $1,525 | $4 |
Property Value by Mortgage Status in Lake Preston
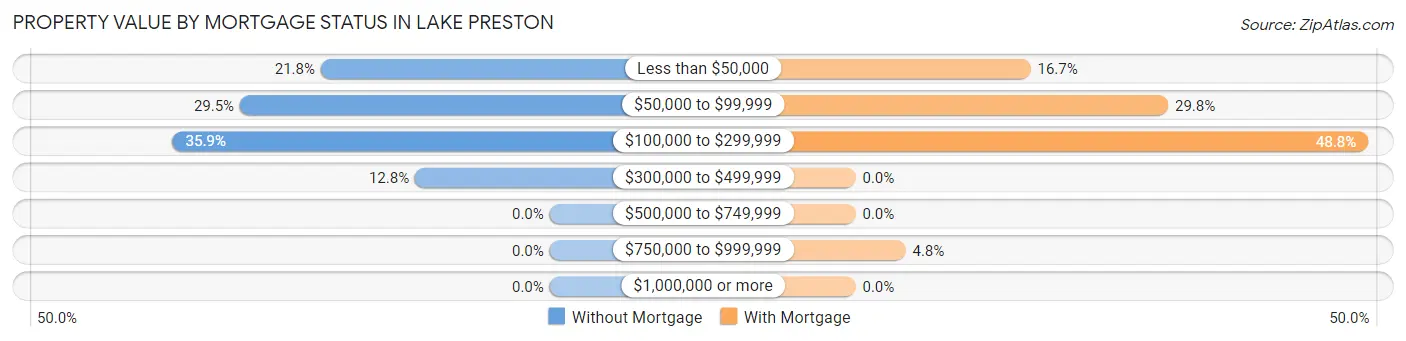
| Property Value | Without Mortgage | With Mortgage |
| Less than $50,000 | 17 (21.8%) | 14 (16.7%) |
| $50,000 to $99,999 | 23 (29.5%) | 25 (29.8%) |
| $100,000 to $299,999 | 28 (35.9%) | 41 (48.8%) |
| $300,000 to $499,999 | 10 (12.8%) | 0 (0.0%) |
| $500,000 to $749,999 | 0 (0.0%) | 0 (0.0%) |
| $750,000 to $999,999 | 0 (0.0%) | 4 (4.8%) |
| $1,000,000 or more | 0 (0.0%) | 0 (0.0%) |
| Total | 78 (100.0%) | 84 (100.0%) |
Household Income by Mortgage Status in Lake Preston
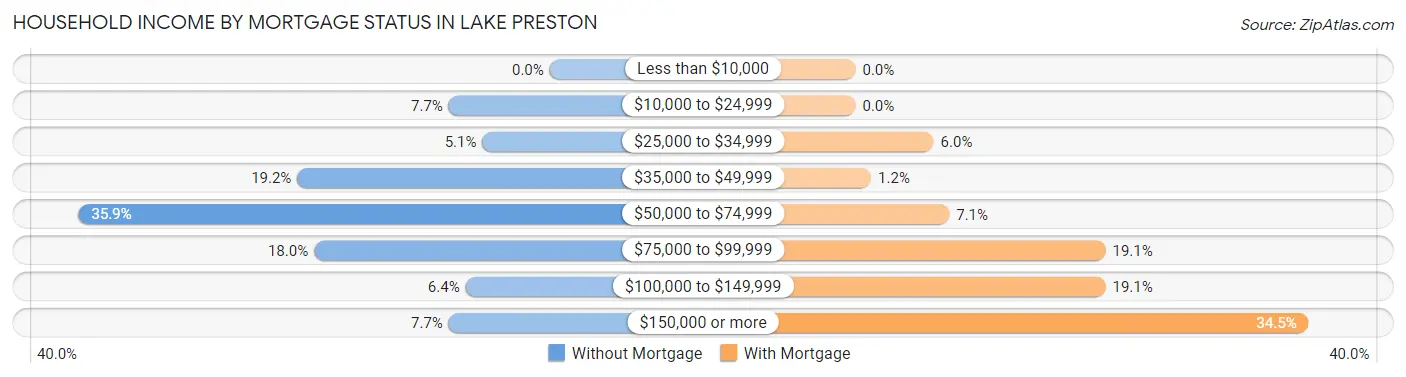
| Household Income | Without Mortgage | With Mortgage |
| Less than $10,000 | 0 (0.0%) | 0 (0.0%) |
| $10,000 to $24,999 | 6 (7.7%) | 0 (0.0%) |
| $25,000 to $34,999 | 4 (5.1%) | 5 (5.9%) |
| $35,000 to $49,999 | 15 (19.2%) | 1 (1.2%) |
| $50,000 to $74,999 | 28 (35.9%) | 6 (7.1%) |
| $75,000 to $99,999 | 14 (17.9%) | 16 (19.1%) |
| $100,000 to $149,999 | 5 (6.4%) | 16 (19.1%) |
| $150,000 or more | 6 (7.7%) | 29 (34.5%) |
| Total | 78 (100.0%) | 84 (100.0%) |
Property Value to Household Income Ratio in Lake Preston
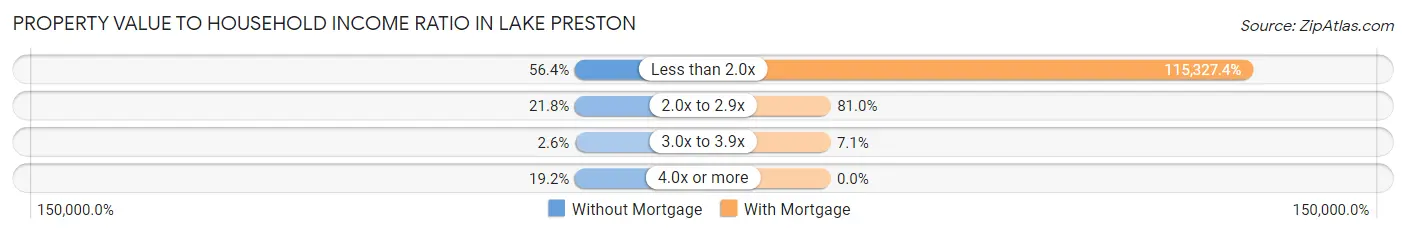
| Value-to-Income Ratio | Without Mortgage | With Mortgage |
| Less than 2.0x | 44 (56.4%) | 96,875 (115,327.4%) |
| 2.0x to 2.9x | 17 (21.8%) | 68 (80.9%) |
| 3.0x to 3.9x | 2 (2.6%) | 6 (7.1%) |
| 4.0x or more | 15 (19.2%) | 0 (0.0%) |
| Total | 78 (100.0%) | 84 (100.0%) |
Real Estate Taxes by Mortgage Status in Lake Preston
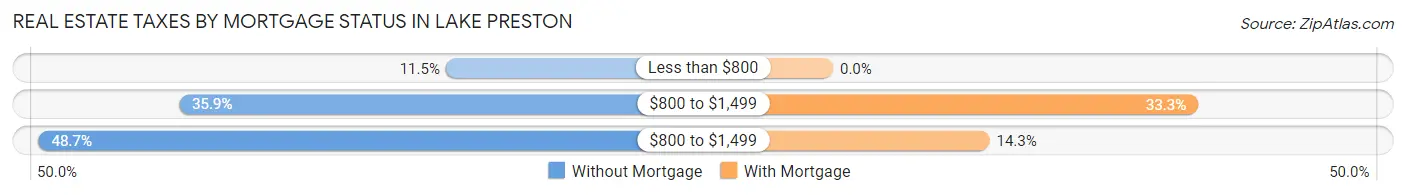
| Property Taxes | Without Mortgage | With Mortgage |
| Less than $800 | 9 (11.5%) | 0 (0.0%) |
| $800 to $1,499 | 28 (35.9%) | 28 (33.3%) |
| $800 to $1,499 | 38 (48.7%) | 12 (14.3%) |
| Total | 78 (100.0%) | 84 (100.0%) |
Health & Disability in Lake Preston
Health Insurance Coverage by Age in Lake Preston
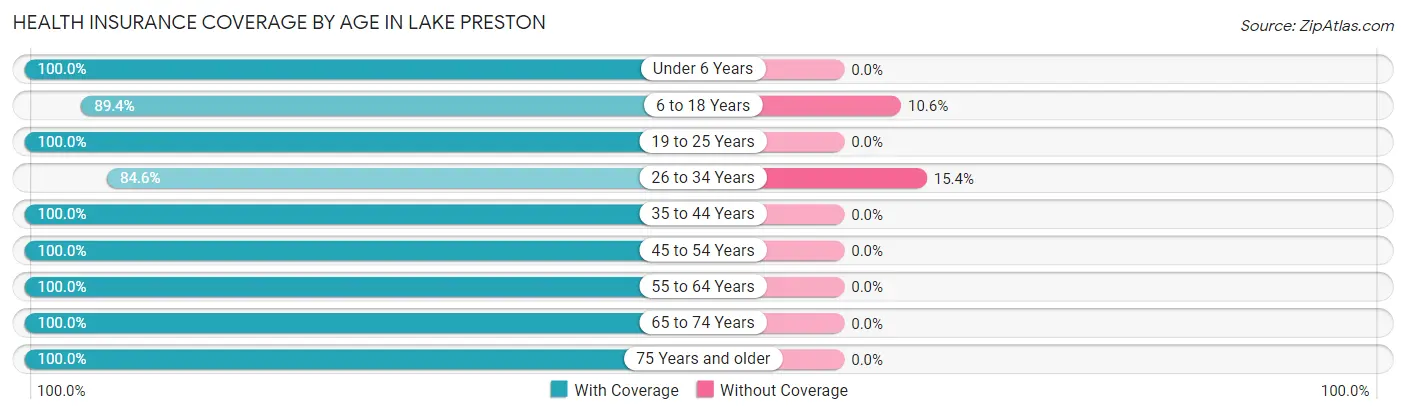
| Age Bracket | With Coverage | Without Coverage |
| Under 6 Years | 9 (100.0%) | 0 (0.0%) |
| 6 to 18 Years | 76 (89.4%) | 9 (10.6%) |
| 19 to 25 Years | 37 (100.0%) | 0 (0.0%) |
| 26 to 34 Years | 77 (84.6%) | 14 (15.4%) |
| 35 to 44 Years | 48 (100.0%) | 0 (0.0%) |
| 45 to 54 Years | 44 (100.0%) | 0 (0.0%) |
| 55 to 64 Years | 104 (100.0%) | 0 (0.0%) |
| 65 to 74 Years | 61 (100.0%) | 0 (0.0%) |
| 75 Years and older | 69 (100.0%) | 0 (0.0%) |
| Total | 525 (95.8%) | 23 (4.2%) |
Health Insurance Coverage by Citizenship Status in Lake Preston
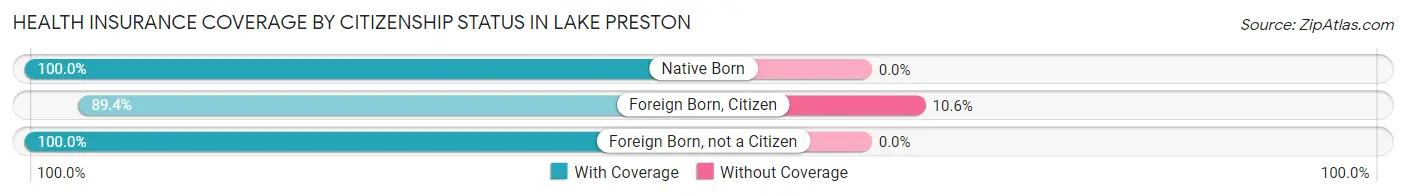
| Citizenship Status | With Coverage | Without Coverage |
| Native Born | 9 (100.0%) | 0 (0.0%) |
| Foreign Born, Citizen | 76 (89.4%) | 9 (10.6%) |
| Foreign Born, not a Citizen | 37 (100.0%) | 0 (0.0%) |
Health Insurance Coverage by Household Income in Lake Preston
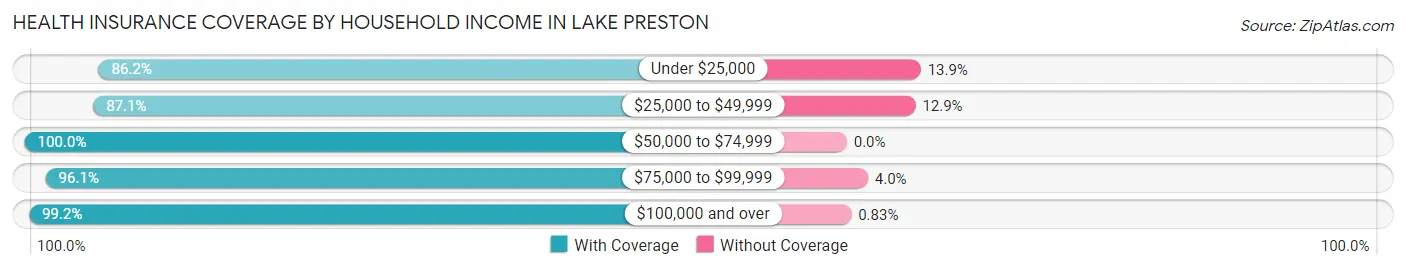
| Household Income | With Coverage | Without Coverage |
| Under $25,000 | 56 (86.2%) | 9 (13.9%) |
| $25,000 to $49,999 | 61 (87.1%) | 9 (12.9%) |
| $50,000 to $74,999 | 95 (100.0%) | 0 (0.0%) |
| $75,000 to $99,999 | 73 (96.1%) | 3 (4.0%) |
| $100,000 and over | 240 (99.2%) | 2 (0.8%) |
Public vs Private Health Insurance Coverage by Age in Lake Preston
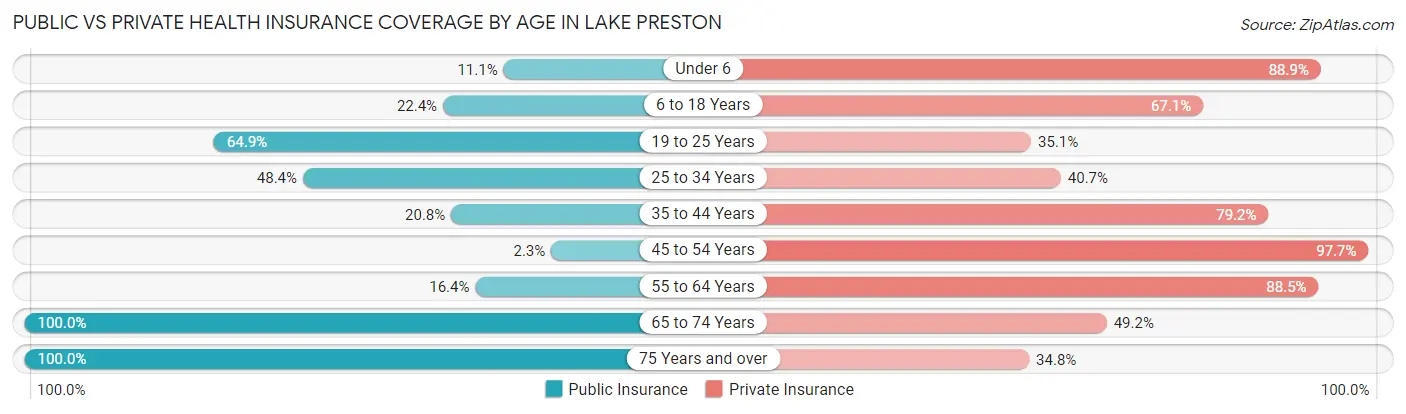
| Age Bracket | Public Insurance | Private Insurance |
| Under 6 | 1 (11.1%) | 8 (88.9%) |
| 6 to 18 Years | 19 (22.4%) | 57 (67.1%) |
| 19 to 25 Years | 24 (64.9%) | 13 (35.1%) |
| 25 to 34 Years | 44 (48.3%) | 37 (40.7%) |
| 35 to 44 Years | 10 (20.8%) | 38 (79.2%) |
| 45 to 54 Years | 1 (2.3%) | 43 (97.7%) |
| 55 to 64 Years | 17 (16.4%) | 92 (88.5%) |
| 65 to 74 Years | 61 (100.0%) | 30 (49.2%) |
| 75 Years and over | 69 (100.0%) | 24 (34.8%) |
| Total | 246 (44.9%) | 342 (62.4%) |
Disability Status by Sex by Age in Lake Preston
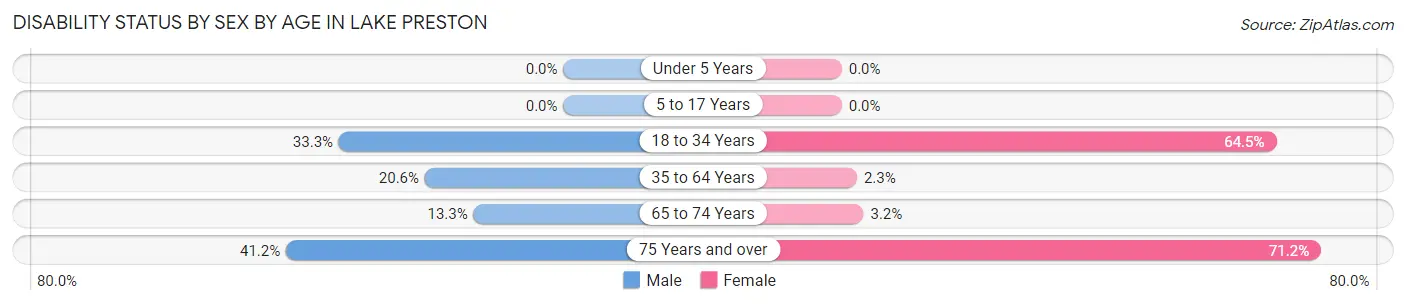
| Age Bracket | Male | Female |
| Under 5 Years | 0 (0.0%) | 0 (0.0%) |
| 5 to 17 Years | 0 (0.0%) | 0 (0.0%) |
| 18 to 34 Years | 24 (33.3%) | 40 (64.5%) |
| 35 to 64 Years | 22 (20.6%) | 2 (2.2%) |
| 65 to 74 Years | 4 (13.3%) | 1 (3.2%) |
| 75 Years and over | 7 (41.2%) | 37 (71.2%) |
Disability Class by Sex by Age in Lake Preston
Disability Class: Hearing Difficulty
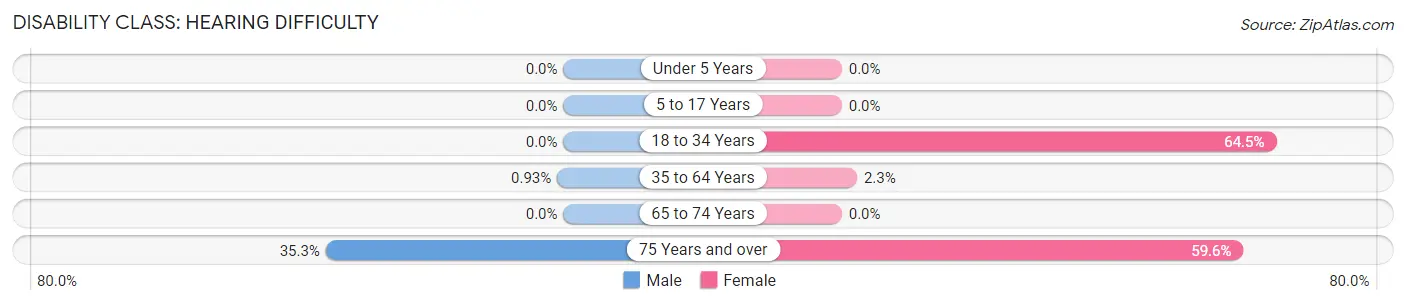
| Age Bracket | Male | Female |
| Under 5 Years | 0 (0.0%) | 0 (0.0%) |
| 5 to 17 Years | 0 (0.0%) | 0 (0.0%) |
| 18 to 34 Years | 0 (0.0%) | 40 (64.5%) |
| 35 to 64 Years | 1 (0.9%) | 2 (2.2%) |
| 65 to 74 Years | 0 (0.0%) | 0 (0.0%) |
| 75 Years and over | 6 (35.3%) | 31 (59.6%) |
Disability Class: Vision Difficulty
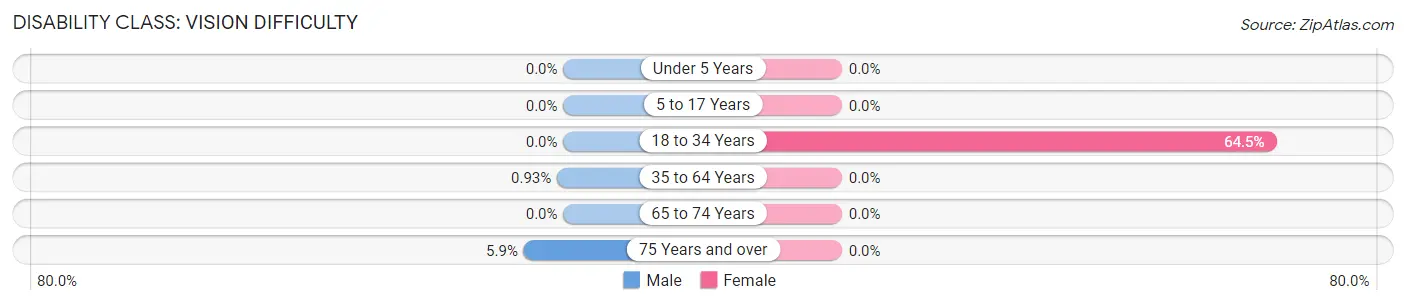
| Age Bracket | Male | Female |
| Under 5 Years | 0 (0.0%) | 0 (0.0%) |
| 5 to 17 Years | 0 (0.0%) | 0 (0.0%) |
| 18 to 34 Years | 0 (0.0%) | 40 (64.5%) |
| 35 to 64 Years | 1 (0.9%) | 0 (0.0%) |
| 65 to 74 Years | 0 (0.0%) | 0 (0.0%) |
| 75 Years and over | 1 (5.9%) | 0 (0.0%) |
Disability Class: Cognitive Difficulty
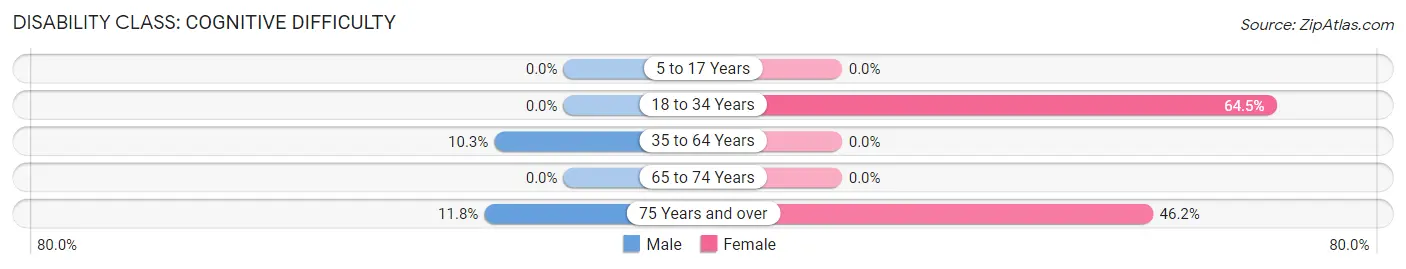
| Age Bracket | Male | Female |
| 5 to 17 Years | 0 (0.0%) | 0 (0.0%) |
| 18 to 34 Years | 0 (0.0%) | 40 (64.5%) |
| 35 to 64 Years | 11 (10.3%) | 0 (0.0%) |
| 65 to 74 Years | 0 (0.0%) | 0 (0.0%) |
| 75 Years and over | 2 (11.8%) | 24 (46.2%) |
Disability Class: Ambulatory Difficulty
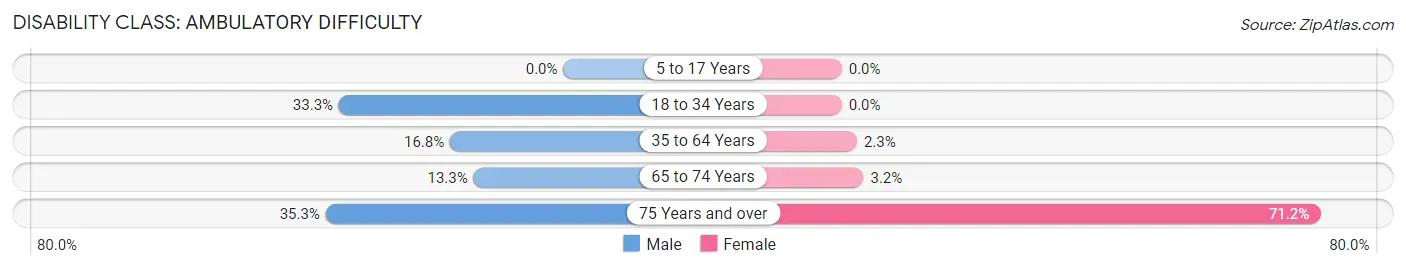
| Age Bracket | Male | Female |
| 5 to 17 Years | 0 (0.0%) | 0 (0.0%) |
| 18 to 34 Years | 24 (33.3%) | 0 (0.0%) |
| 35 to 64 Years | 18 (16.8%) | 2 (2.2%) |
| 65 to 74 Years | 4 (13.3%) | 1 (3.2%) |
| 75 Years and over | 6 (35.3%) | 37 (71.2%) |
Disability Class: Self-Care Difficulty
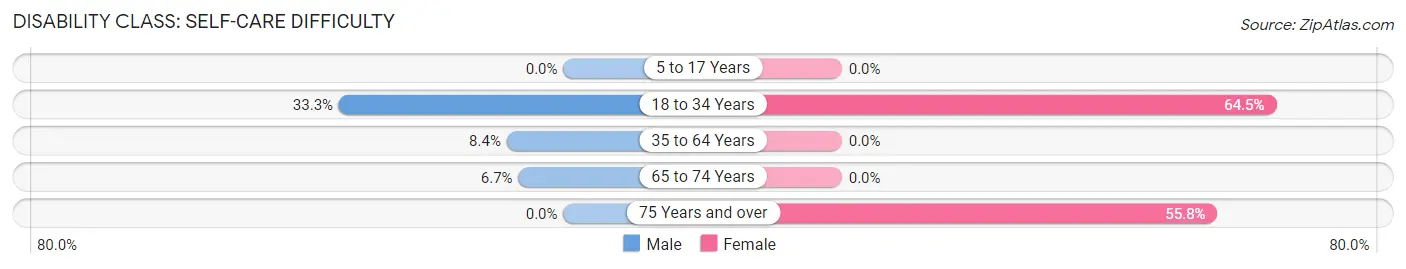
| Age Bracket | Male | Female |
| 5 to 17 Years | 0 (0.0%) | 0 (0.0%) |
| 18 to 34 Years | 24 (33.3%) | 40 (64.5%) |
| 35 to 64 Years | 9 (8.4%) | 0 (0.0%) |
| 65 to 74 Years | 2 (6.7%) | 0 (0.0%) |
| 75 Years and over | 0 (0.0%) | 29 (55.8%) |
Technology Access in Lake Preston
Computing Device Access in Lake Preston
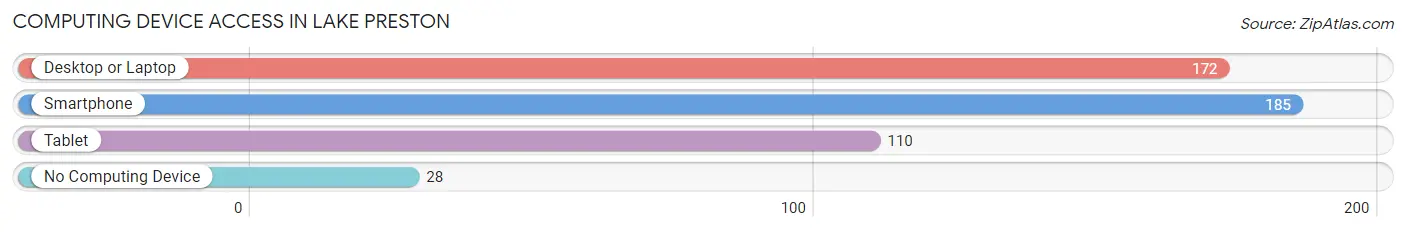
| Device Type | # Households | % Households |
| Desktop or Laptop | 172 | 70.2% |
| Smartphone | 185 | 75.5% |
| Tablet | 110 | 44.9% |
| No Computing Device | 28 | 11.4% |
| Total | 245 | 100.0% |
Internet Access in Lake Preston
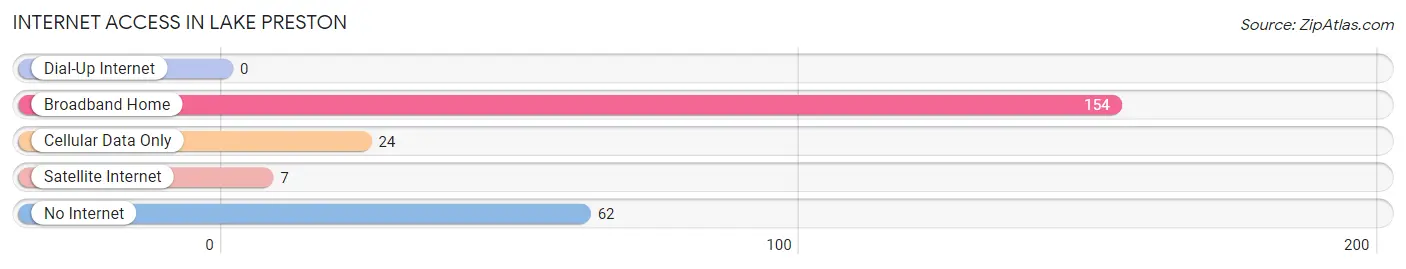
| Internet Type | # Households | % Households |
| Dial-Up Internet | 0 | 0.0% |
| Broadband Home | 154 | 62.9% |
| Cellular Data Only | 24 | 9.8% |
| Satellite Internet | 7 | 2.9% |
| No Internet | 62 | 25.3% |
| Total | 245 | 100.0% |
Lake Preston Summary
History
Lake Preston is a small town located in Kingsbury County, South Dakota. It is situated on the eastern shore of Lake Preston, a natural lake that was formed by glacial activity. The town was founded in 1881 by a group of settlers from Wisconsin. The settlers were attracted to the area by the abundance of natural resources, including timber, fish, and game. The town was named after the lake, which was named after a local settler, William Preston.
The town grew slowly but steadily over the years, and by the early 1900s, it had become a thriving community. The town was home to a variety of businesses, including a general store, a blacksmith shop, a hotel, and a sawmill. The town also had a school, a post office, and a church.
In the early 1900s, the town was a popular destination for tourists, who came to enjoy the lake and the surrounding countryside. The town was also a popular spot for fishing, and the lake was stocked with a variety of fish, including bass, walleye, and northern pike.
In the 1950s, the town began to decline as the population shifted to larger cities. The town’s businesses began to close, and the population dwindled. In the late 1970s, the town was revitalized when a group of local residents formed the Lake Preston Development Corporation. The group worked to attract new businesses and residents to the town, and by the early 2000s, the town had experienced a resurgence.
Geography
Lake Preston is located in Kingsbury County, South Dakota. It is situated on the eastern shore of Lake Preston, a natural lake that was formed by glacial activity. The lake is approximately 1,500 acres in size and is a popular spot for fishing, swimming, and boating. The town is surrounded by rolling hills and farmland, and is located approximately 30 miles from the city of Brookings.
The town has a total area of 0.6 square miles, all of which is land. The town is located at an elevation of 1,541 feet above sea level. The climate in the area is characterized by hot, humid summers and cold, snowy winters.
Economy
The economy of Lake Preston is largely based on agriculture and tourism. The town is home to a variety of businesses, including a general store, a hardware store, a restaurant, and a gas station. The town is also home to a number of small farms, which produce a variety of crops, including corn, soybeans, and wheat.
The town is also a popular destination for tourists, who come to enjoy the lake and the surrounding countryside. The town is home to a number of recreational activities, including fishing, boating, and swimming. The town also hosts a number of festivals and events throughout the year, including the Lake Preston Summer Festival and the Lake Preston Fall Festival.
Demographics
As of the 2010 census, the population of Lake Preston was 545. The population is largely white (96.2%), with a small percentage of African Americans (1.3%) and Native Americans (1.3%). The median household income in the town is $41,250, and the median age is 44. The town has a high rate of homeownership (83.3%), and the average home value is $117,000. The town has a low unemployment rate (3.3%), and the poverty rate is 8.3%.
Common Questions
What is Per Capita Income in Lake Preston?
Per Capita income in Lake Preston is $35,450.
What is the Median Family Income in Lake Preston?
Median Family Income in Lake Preston is $83,571.
What is the Median Household income in Lake Preston?
Median Household Income in Lake Preston is $59,766.
What is Income or Wage Gap in Lake Preston?
Income or Wage Gap in Lake Preston is 6.1%.
Women in Lake Preston earn 93.9 cents for every dollar earned by a man.
What is Inequality or Gini Index in Lake Preston?
Inequality or Gini Index in Lake Preston is 0.40.
What is the Total Population of Lake Preston?
Total Population of Lake Preston is 548.
What is the Total Male Population of Lake Preston?
Total Male Population of Lake Preston is 267.
What is the Total Female Population of Lake Preston?
Total Female Population of Lake Preston is 281.
What is the Ratio of Males per 100 Females in Lake Preston?
There are 95.02 Males per 100 Females in Lake Preston.
What is the Ratio of Females per 100 Males in Lake Preston?
There are 105.24 Females per 100 Males in Lake Preston.
What is the Median Population Age in Lake Preston?
Median Population Age in Lake Preston is 46.2 Years.
What is the Average Family Size in Lake Preston
Average Family Size in Lake Preston is 3.3 People.
What is the Average Household Size in Lake Preston
Average Household Size in Lake Preston is 2.2 People.
How Large is the Labor Force in Lake Preston?
There are 254 People in the Labor Forcein in Lake Preston.
What is the Percentage of People in the Labor Force in Lake Preston?
54.5% of People are in the Labor Force in Lake Preston.
What is the Unemployment Rate in Lake Preston?
Unemployment Rate in Lake Preston is 0.4%.