Trent, SD Map & Demographics
Trent Map
Trent Overview
$32,354
PER CAPITA INCOME
$73,750
AVG FAMILY INCOME
$55,208
AVG HOUSEHOLD INCOME
37.2%
WAGE / INCOME GAP [ % ]
62.8¢/ $1
WAGE / INCOME GAP [ $ ]
0.34
INEQUALITY / GINI INDEX
332
TOTAL POPULATION
190
MALE POPULATION
142
FEMALE POPULATION
133.80
MALES / 100 FEMALES
74.74
FEMALES / 100 MALES
41.7
MEDIAN AGE
2.8
AVG FAMILY SIZE
2.2
AVG HOUSEHOLD SIZE
169
LABOR FORCE [ PEOPLE ]
61.7%
PERCENT IN LABOR FORCE
1.8%
UNEMPLOYMENT RATE
Trent Zip Codes
Trent Area Codes
Income in Trent
Income Overview in Trent
Per Capita Income in Trent is $32,354, while median incomes of families and households are $73,750 and $55,208 respectively.
| Characteristic | Number | Measure |
| Per Capita Income | 332 | $32,354 |
| Median Family Income | 76 | $73,750 |
| Mean Family Income | 76 | $78,797 |
| Median Household Income | 139 | $55,208 |
| Mean Household Income | 139 | $67,419 |
| Income Deficit | 76 | $0 |
| Wage / Income Gap (%) | 332 | 37.18% |
| Wage / Income Gap ($) | 332 | 62.82¢ per $1 |
| Gini / Inequality Index | 332 | 0.34 |
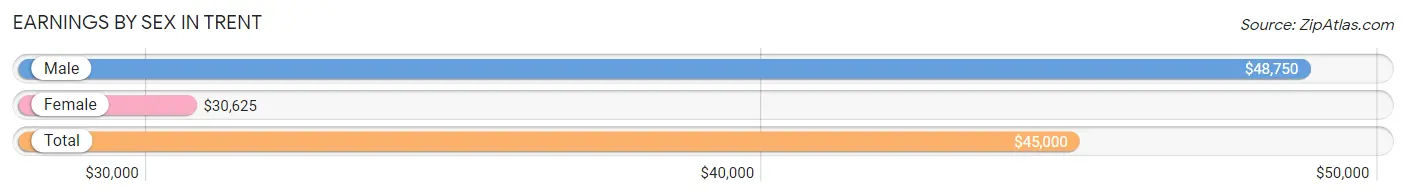
Earnings by Sex in Trent
Average Earnings in Trent are $45,000, $48,750 for men and $30,625 for women, a difference of 37.2%.
| Sex | Number | Average Earnings |
| Male | 99 (55.6%) | $48,750 |
| Female | 79 (44.4%) | $30,625 |
| Total | 178 (100.0%) | $45,000 |
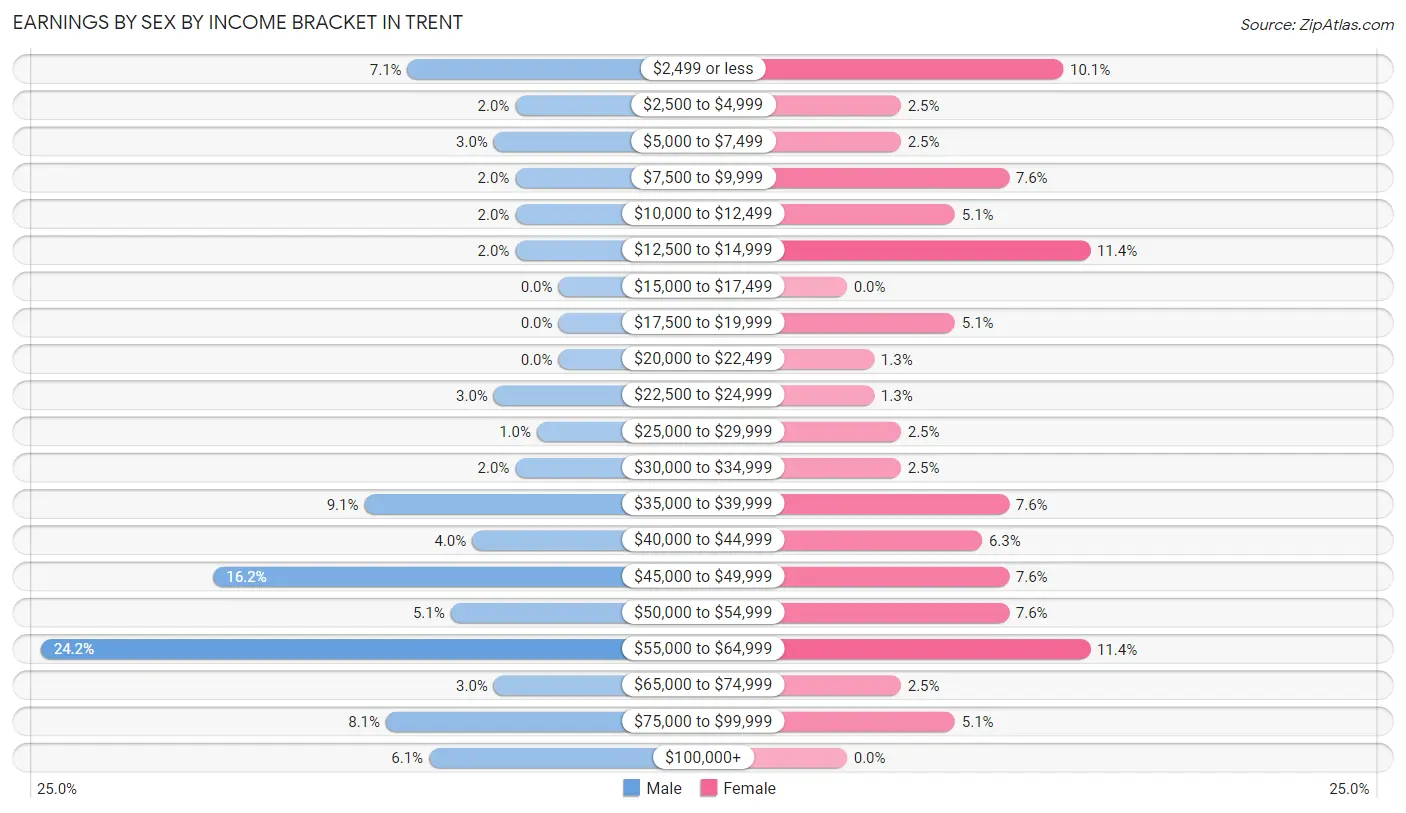
Earnings by Sex by Income Bracket in Trent
The most common earnings brackets in Trent are $55,000 to $64,999 for men (24 | 24.2%) and $12,500 to $14,999 for women (9 | 11.4%).
| Income | Male | Female |
| $2,499 or less | 7 (7.1%) | 8 (10.1%) |
| $2,500 to $4,999 | 2 (2.0%) | 2 (2.5%) |
| $5,000 to $7,499 | 3 (3.0%) | 2 (2.5%) |
| $7,500 to $9,999 | 2 (2.0%) | 6 (7.6%) |
| $10,000 to $12,499 | 2 (2.0%) | 4 (5.1%) |
| $12,500 to $14,999 | 2 (2.0%) | 9 (11.4%) |
| $15,000 to $17,499 | 0 (0.0%) | 0 (0.0%) |
| $17,500 to $19,999 | 0 (0.0%) | 4 (5.1%) |
| $20,000 to $22,499 | 0 (0.0%) | 1 (1.3%) |
| $22,500 to $24,999 | 3 (3.0%) | 1 (1.3%) |
| $25,000 to $29,999 | 1 (1.0%) | 2 (2.5%) |
| $30,000 to $34,999 | 2 (2.0%) | 2 (2.5%) |
| $35,000 to $39,999 | 9 (9.1%) | 6 (7.6%) |
| $40,000 to $44,999 | 4 (4.0%) | 5 (6.3%) |
| $45,000 to $49,999 | 16 (16.2%) | 6 (7.6%) |
| $50,000 to $54,999 | 5 (5.1%) | 6 (7.6%) |
| $55,000 to $64,999 | 24 (24.2%) | 9 (11.4%) |
| $65,000 to $74,999 | 3 (3.0%) | 2 (2.5%) |
| $75,000 to $99,999 | 8 (8.1%) | 4 (5.1%) |
| $100,000+ | 6 (6.1%) | 0 (0.0%) |
| Total | 99 (100.0%) | 79 (100.0%) |
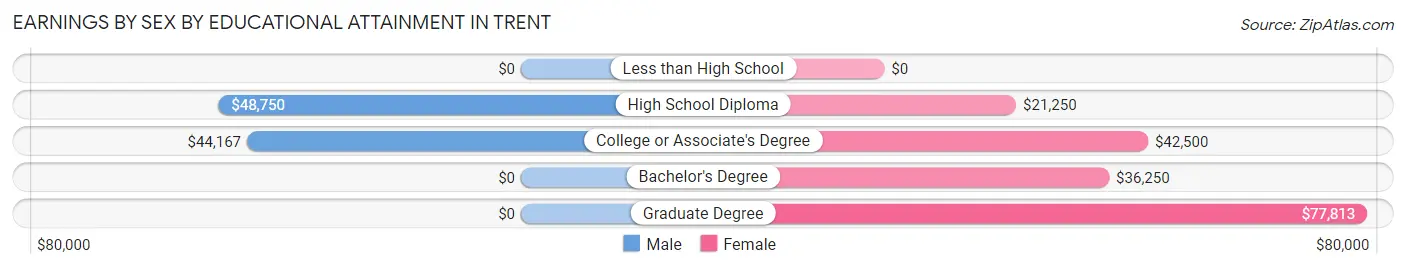
Earnings by Sex by Educational Attainment in Trent
Average earnings in Trent are $47,083 for men and $38,750 for women, a difference of 17.7%. Men with an educational attainment of high school diploma enjoy the highest average annual earnings of $48,750, while those with college or associate's degree education earn the least with $44,167. Women with an educational attainment of graduate degree earn the most with the average annual earnings of $77,813, while those with high school diploma education have the smallest earnings of $21,250.
| Educational Attainment | Male Income | Female Income |
| Less than High School | - | - |
| High School Diploma | $48,750 | $21,250 |
| College or Associate's Degree | $44,167 | $42,500 |
| Bachelor's Degree | - | - |
| Graduate Degree | - | - |
| Total | $47,083 | $38,750 |
Family Income in Trent
Family Income Brackets in Trent
According to the Trent family income data, there are 21 families falling into the $75,000 to $99,999 income range, which is the most common income bracket and makes up 27.6% of all families.
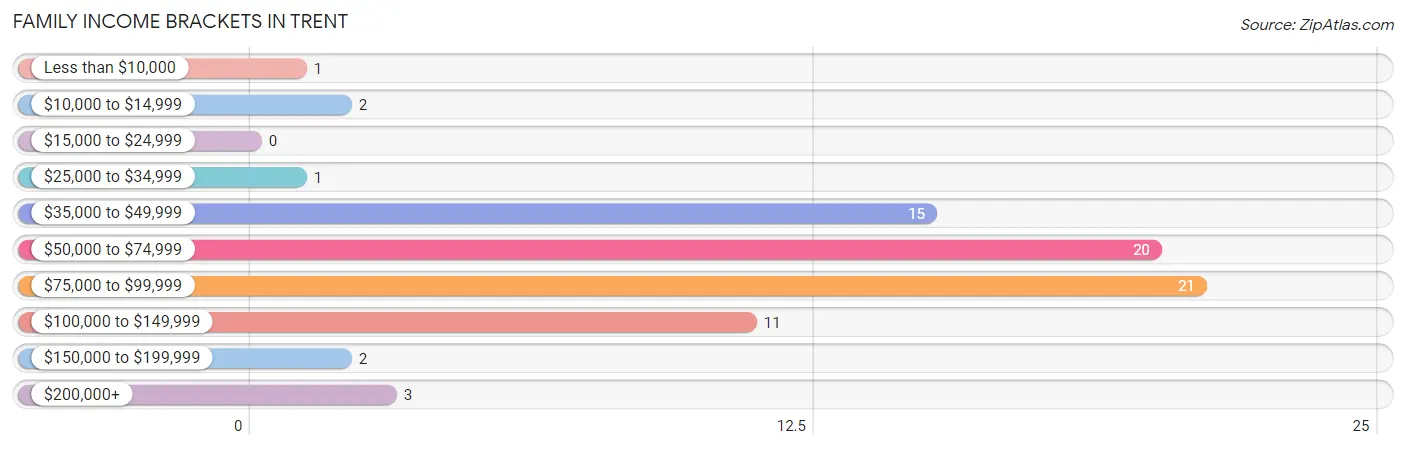
| Income Bracket | # Families | % Families |
| Less than $10,000 | 1 | 1.3% |
| $10,000 to $14,999 | 2 | 2.6% |
| $15,000 to $24,999 | 0 | 0.0% |
| $25,000 to $34,999 | 1 | 1.3% |
| $35,000 to $49,999 | 15 | 19.7% |
| $50,000 to $74,999 | 20 | 26.3% |
| $75,000 to $99,999 | 21 | 27.6% |
| $100,000 to $149,999 | 11 | 14.5% |
| $150,000 to $199,999 | 2 | 2.6% |
| $200,000+ | 3 | 3.9% |
Family Income by Famaliy Size in Trent
5-person families (9 | 11.8%) account for the highest median family income in Trent with $81,042 per family, while 2-person families (47 | 61.8%) have the highest median income of $30,469 per family member.
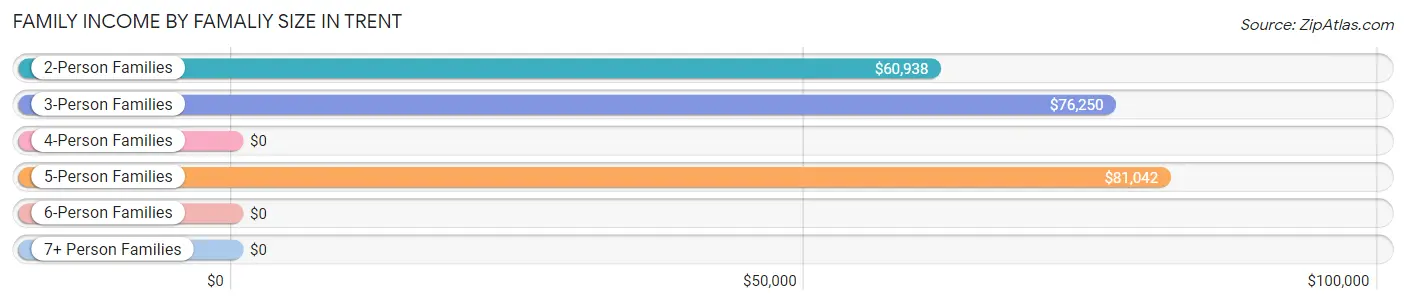
| Income Bracket | # Families | Median Income |
| 2-Person Families | 47 (61.8%) | $60,938 |
| 3-Person Families | 14 (18.4%) | $76,250 |
| 4-Person Families | 4 (5.3%) | $0 |
| 5-Person Families | 9 (11.8%) | $81,042 |
| 6-Person Families | 0 (0.0%) | $0 |
| 7+ Person Families | 2 (2.6%) | $0 |
| Total | 76 (100.0%) | $73,750 |
Family Income by Number of Earners in Trent
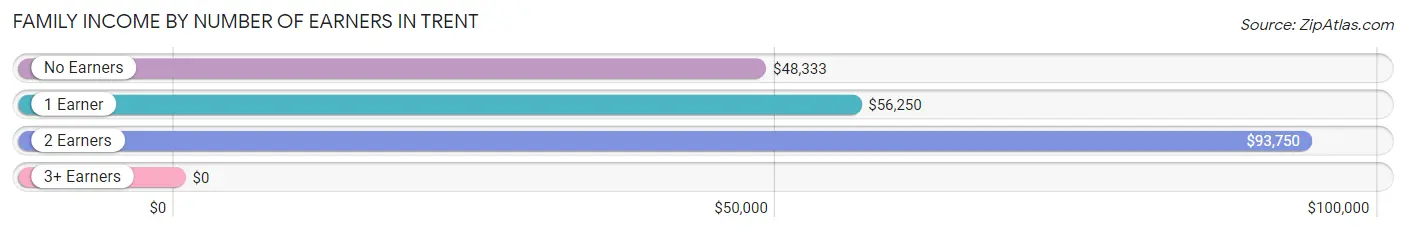
| Number of Earners | # Families | Median Income |
| No Earners | 8 (10.5%) | $48,333 |
| 1 Earner | 34 (44.7%) | $56,250 |
| 2 Earners | 33 (43.4%) | $93,750 |
| 3+ Earners | 1 (1.3%) | $0 |
| Total | 76 (100.0%) | $73,750 |
Household Income in Trent
Household Income Brackets in Trent
With 34 households falling in the category, the $35,000 to $49,999 income range is the most frequent in Trent, accounting for 24.5% of all households. In contrast, only 2 households (1.4%) fall into the $150,000 to $199,999 income bracket, making it the least populous group.
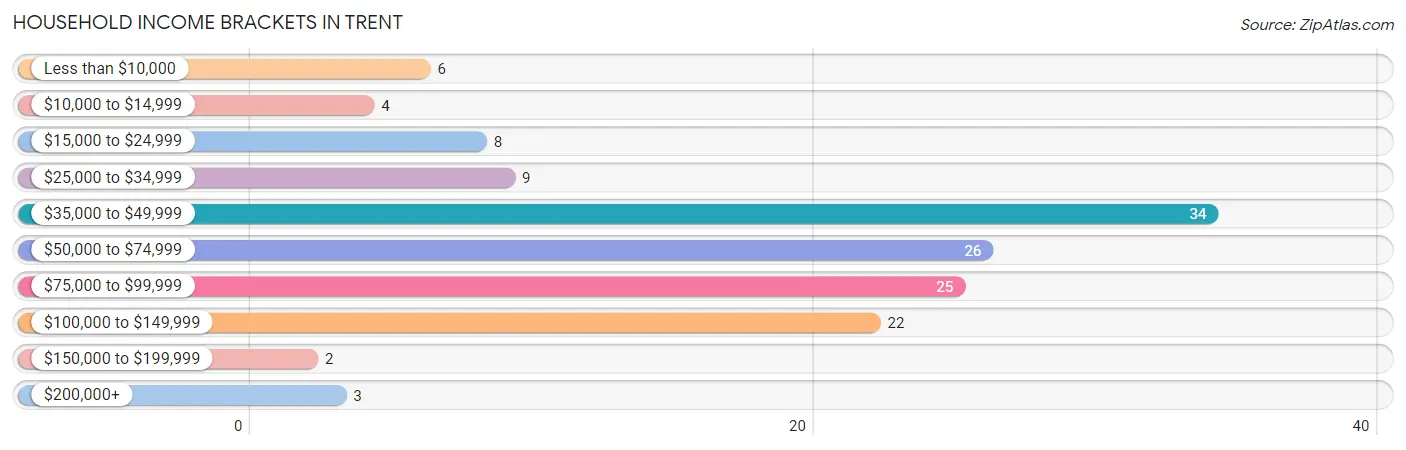
| Income Bracket | # Households | % Households |
| Less than $10,000 | 6 | 4.3% |
| $10,000 to $14,999 | 4 | 2.9% |
| $15,000 to $24,999 | 8 | 5.8% |
| $25,000 to $34,999 | 9 | 6.5% |
| $35,000 to $49,999 | 34 | 24.5% |
| $50,000 to $74,999 | 26 | 18.7% |
| $75,000 to $99,999 | 25 | 18.0% |
| $100,000 to $149,999 | 22 | 15.8% |
| $150,000 to $199,999 | 2 | 1.4% |
| $200,000+ | 3 | 2.2% |
Household Income by Householder Age in Trent
The median household income in Trent is $55,208, with the highest median household income of $76,250 found in the 25 to 44 years age bracket for the primary householder. A total of 42 households (30.2%) fall into this category. Meanwhile, the 15 to 24 years age bracket for the primary householder has the lowest median household income of $0, with 7 households (5.0%) in this group.
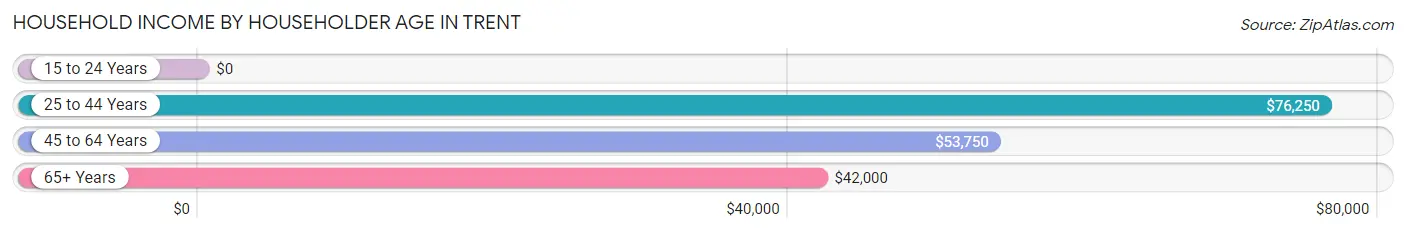
| Income Bracket | # Households | Median Income |
| 15 to 24 Years | 7 (5.0%) | $0 |
| 25 to 44 Years | 42 (30.2%) | $76,250 |
| 45 to 64 Years | 36 (25.9%) | $53,750 |
| 65+ Years | 54 (38.9%) | $42,000 |
| Total | 139 (100.0%) | $55,208 |
Poverty in Trent
Income Below Poverty by Sex and Age in Trent
With 9.1% poverty level for males and 18.3% for females among the residents of Trent, 18 to 24 year old males and 18 to 24 year old females are the most vulnerable to poverty, with 13 males (41.9%) and 5 females (41.7%) in their respective age groups living below the poverty level.
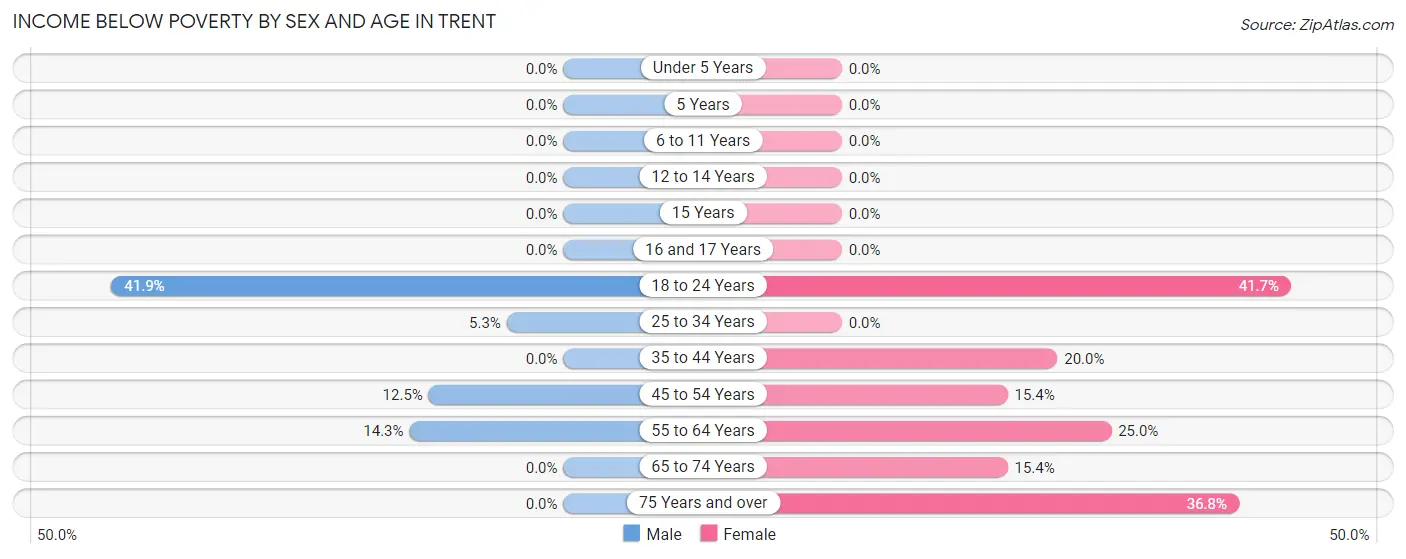
| Age Bracket | Male | Female |
| Under 5 Years | 0 (0.0%) | 0 (0.0%) |
| 5 Years | 0 (0.0%) | 0 (0.0%) |
| 6 to 11 Years | 0 (0.0%) | 0 (0.0%) |
| 12 to 14 Years | 0 (0.0%) | 0 (0.0%) |
| 15 Years | 0 (0.0%) | 0 (0.0%) |
| 16 and 17 Years | 0 (0.0%) | 0 (0.0%) |
| 18 to 24 Years | 13 (41.9%) | 5 (41.7%) |
| 25 to 34 Years | 1 (5.3%) | 0 (0.0%) |
| 35 to 44 Years | 0 (0.0%) | 3 (20.0%) |
| 45 to 54 Years | 1 (12.5%) | 2 (15.4%) |
| 55 to 64 Years | 2 (14.3%) | 7 (25.0%) |
| 65 to 74 Years | 0 (0.0%) | 2 (15.4%) |
| 75 Years and over | 0 (0.0%) | 7 (36.8%) |
| Total | 17 (9.1%) | 26 (18.3%) |
Income Above Poverty by Sex and Age in Trent
According to the poverty statistics in Trent, males aged under 5 years and females aged under 5 years are the age groups that are most secure financially, with 100.0% of males and 100.0% of females in these age groups living above the poverty line.
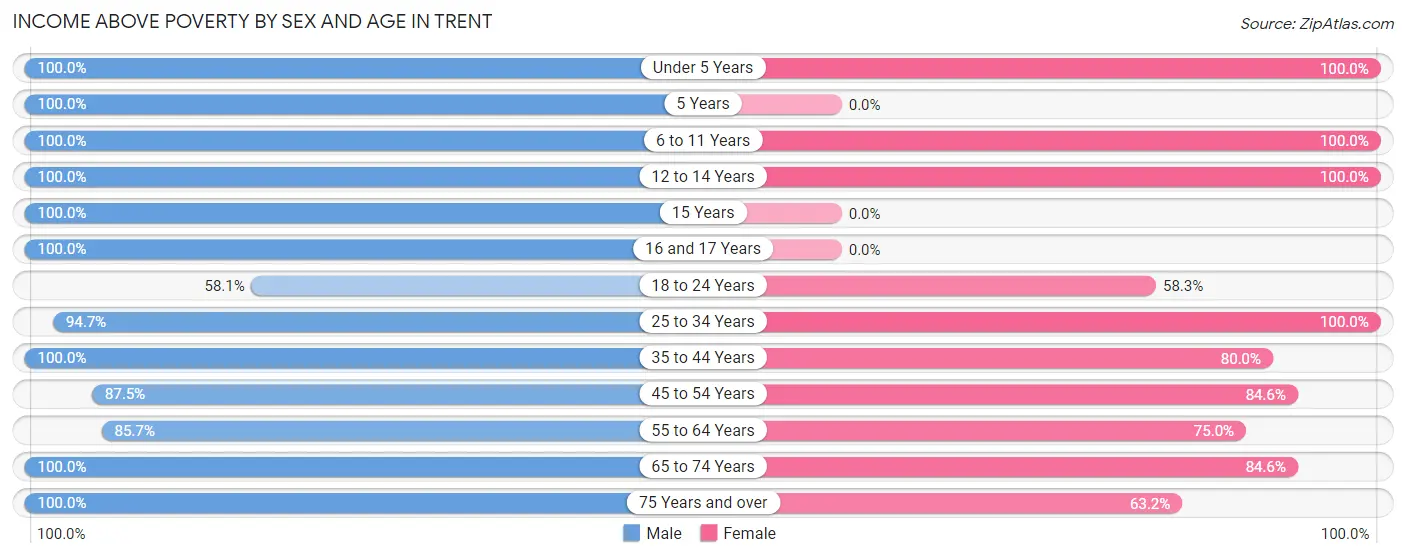
| Age Bracket | Male | Female |
| Under 5 Years | 14 (100.0%) | 7 (100.0%) |
| 5 Years | 4 (100.0%) | 0 (0.0%) |
| 6 to 11 Years | 5 (100.0%) | 11 (100.0%) |
| 12 to 14 Years | 4 (100.0%) | 8 (100.0%) |
| 15 Years | 2 (100.0%) | 0 (0.0%) |
| 16 and 17 Years | 1 (100.0%) | 0 (0.0%) |
| 18 to 24 Years | 18 (58.1%) | 7 (58.3%) |
| 25 to 34 Years | 18 (94.7%) | 16 (100.0%) |
| 35 to 44 Years | 21 (100.0%) | 12 (80.0%) |
| 45 to 54 Years | 7 (87.5%) | 11 (84.6%) |
| 55 to 64 Years | 12 (85.7%) | 21 (75.0%) |
| 65 to 74 Years | 51 (100.0%) | 11 (84.6%) |
| 75 Years and over | 13 (100.0%) | 12 (63.2%) |
| Total | 170 (90.9%) | 116 (81.7%) |
Income Below Poverty Among Married-Couple Families in Trent
The poverty statistics for married-couple families in Trent show that 1.6% or 1 of the total 62 families live below the poverty line. Families with no children have the highest poverty rate of 2.5%, comprising of 1 families. On the other hand, families with 1 or 2 children have the lowest poverty rate of 0.0%, which includes 0 families.
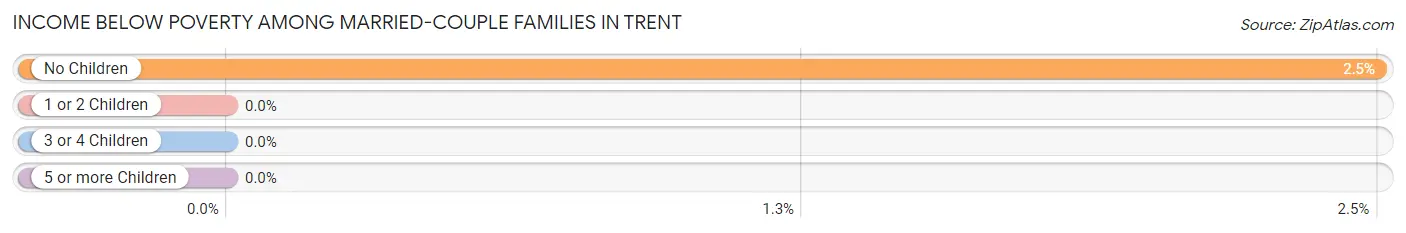
| Children | Above Poverty | Below Poverty |
| No Children | 39 (97.5%) | 1 (2.5%) |
| 1 or 2 Children | 11 (100.0%) | 0 (0.0%) |
| 3 or 4 Children | 9 (100.0%) | 0 (0.0%) |
| 5 or more Children | 2 (100.0%) | 0 (0.0%) |
| Total | 61 (98.4%) | 1 (1.6%) |
Income Below Poverty Among Single-Parent Households in Trent
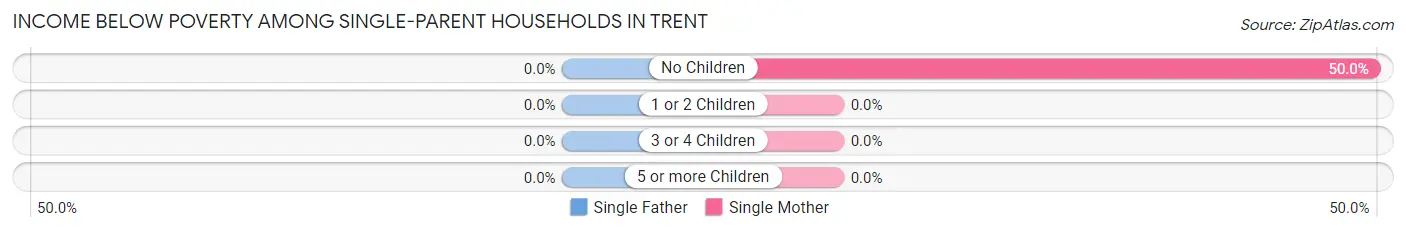
| Children | Single Father | Single Mother |
| No Children | 0 (0.0%) | 2 (50.0%) |
| 1 or 2 Children | 0 (0.0%) | 0 (0.0%) |
| 3 or 4 Children | 0 (0.0%) | 0 (0.0%) |
| 5 or more Children | 0 (0.0%) | 0 (0.0%) |
| Total | 0 (0.0%) | 2 (22.2%) |
Income Below Poverty Among Married-Couple vs Single-Parent Households in Trent
The poverty data for Trent shows that 1 of the married-couple family households (1.6%) and 2 of the single-parent households (14.3%) are living below the poverty level. Within the married-couple family households, those with no children have the highest poverty rate, with 1 households (2.5%) falling below the poverty line. Among the single-parent households, those with no children have the highest poverty rate, with 2 household (50.0%) living below poverty.
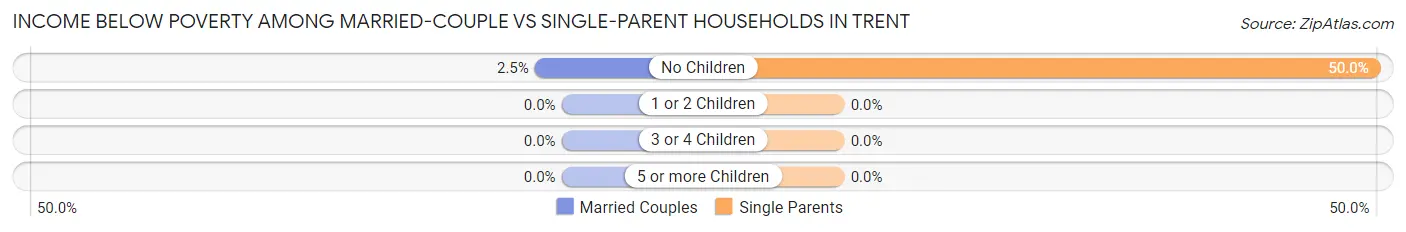
| Children | Married-Couple Families | Single-Parent Households |
| No Children | 1 (2.5%) | 2 (50.0%) |
| 1 or 2 Children | 0 (0.0%) | 0 (0.0%) |
| 3 or 4 Children | 0 (0.0%) | 0 (0.0%) |
| 5 or more Children | 0 (0.0%) | 0 (0.0%) |
| Total | 1 (1.6%) | 2 (14.3%) |
Race in Trent
The most populous races in Trent are White / Caucasian (291 | 87.6%), Two or more Races (32 | 9.6%), and Asian (3 | 0.9%).
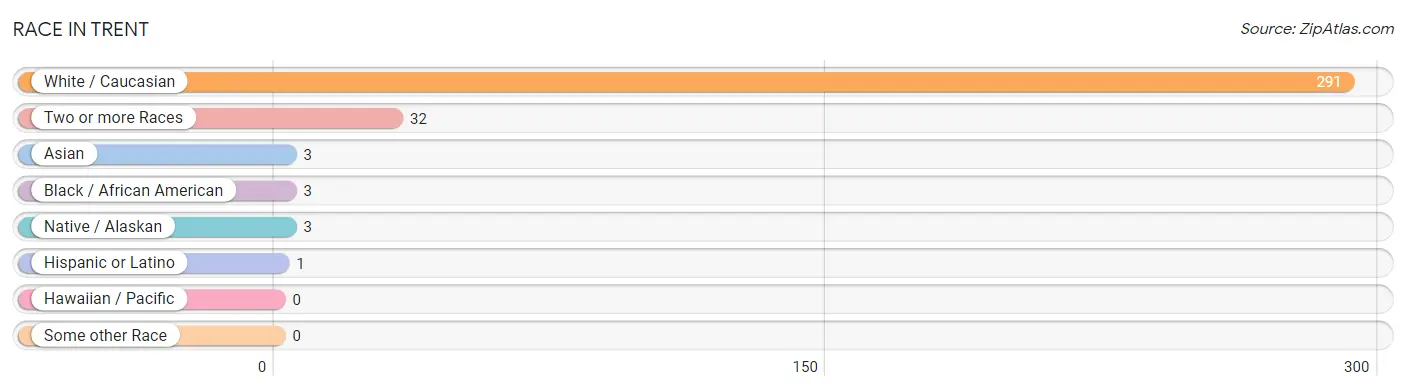
| Race | # Population | % Population |
| Asian | 3 | 0.9% |
| Black / African American | 3 | 0.9% |
| Hawaiian / Pacific | 0 | 0.0% |
| Hispanic or Latino | 1 | 0.3% |
| Native / Alaskan | 3 | 0.9% |
| White / Caucasian | 291 | 87.6% |
| Two or more Races | 32 | 9.6% |
| Some other Race | 0 | 0.0% |
| Total | 332 | 100.0% |
Ancestry in Trent
The most populous ancestries reported in Trent are German (94 | 28.3%), Norwegian (48 | 14.5%), American (46 | 13.9%), Irish (22 | 6.6%), and Dutch (21 | 6.3%), together accounting for 69.6% of all Trent residents.
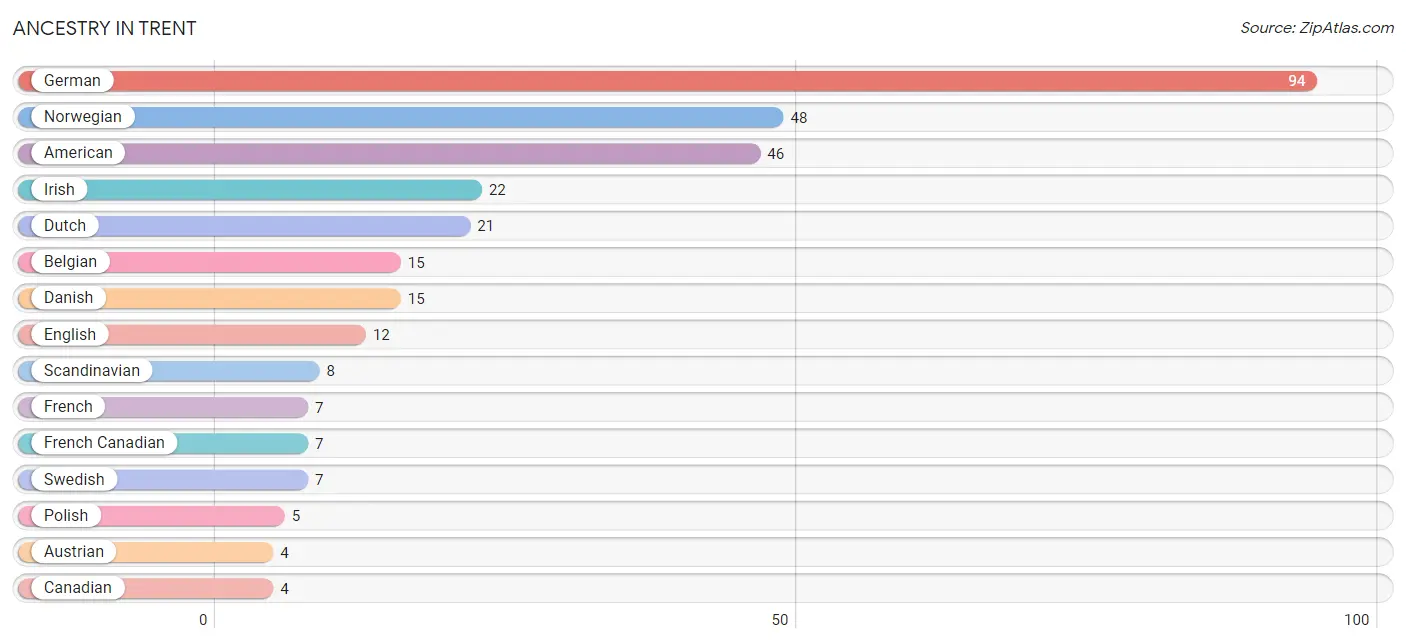
| Ancestry | # Population | % Population |
| American | 46 | 13.9% |
| Austrian | 4 | 1.2% |
| Belgian | 15 | 4.5% |
| Bhutanese | 3 | 0.9% |
| Burmese | 3 | 0.9% |
| Canadian | 4 | 1.2% |
| Danish | 15 | 4.5% |
| Dutch | 21 | 6.3% |
| English | 12 | 3.6% |
| Ethiopian | 3 | 0.9% |
| French | 7 | 2.1% |
| French Canadian | 7 | 2.1% |
| German | 94 | 28.3% |
| Irish | 22 | 6.6% |
| Italian | 3 | 0.9% |
| Korean | 3 | 0.9% |
| Latvian | 1 | 0.3% |
| Mexican | 1 | 0.3% |
| Norwegian | 48 | 14.5% |
| Polish | 5 | 1.5% |
| Scandinavian | 8 | 2.4% |
| Scotch-Irish | 1 | 0.3% |
| Sioux | 3 | 0.9% |
| Subsaharan African | 3 | 0.9% |
| Swedish | 7 | 2.1% |
| Ukrainian | 3 | 0.9% | View All 26 Rows |
Immigrants in Trent
The most numerous immigrant groups reported in Trent came from Africa (3 | 0.9%), Asia (3 | 0.9%), Eastern Africa (3 | 0.9%), Ethiopia (3 | 0.9%), and Philippines (3 | 0.9%), together accounting for 4.5% of all Trent residents.
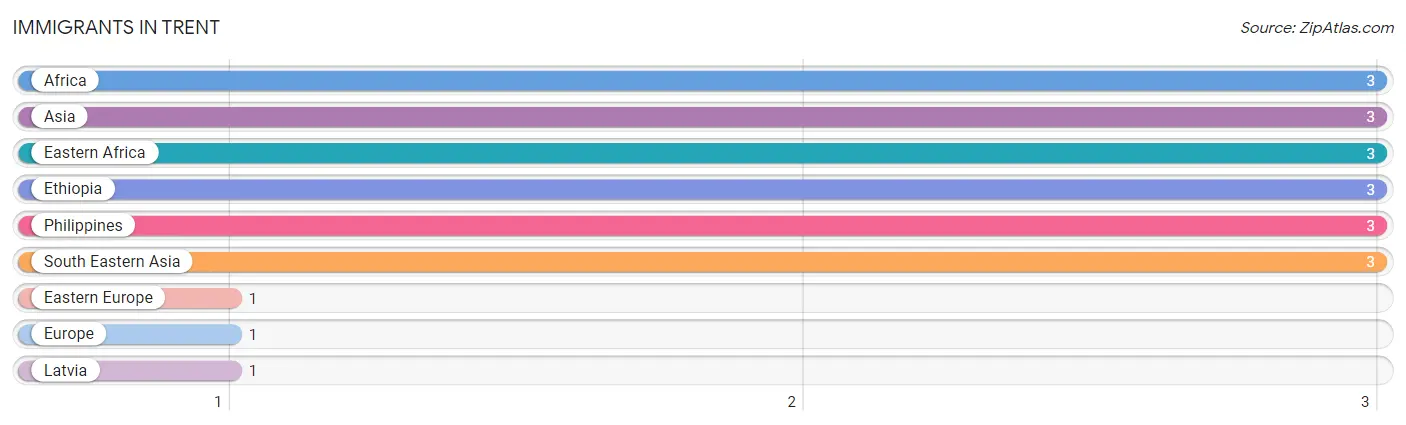
| Immigration Origin | # Population | % Population |
| Africa | 3 | 0.9% |
| Asia | 3 | 0.9% |
| Eastern Africa | 3 | 0.9% |
| Eastern Europe | 1 | 0.3% |
| Ethiopia | 3 | 0.9% |
| Europe | 1 | 0.3% |
| Latvia | 1 | 0.3% |
| Philippines | 3 | 0.9% |
| South Eastern Asia | 3 | 0.9% | View All 9 Rows |
Sex and Age in Trent
Sex and Age in Trent
The most populous age groups in Trent are 70 to 74 Years (43 | 22.6%) for men and 25 to 29 Years (15 | 10.6%) for women.
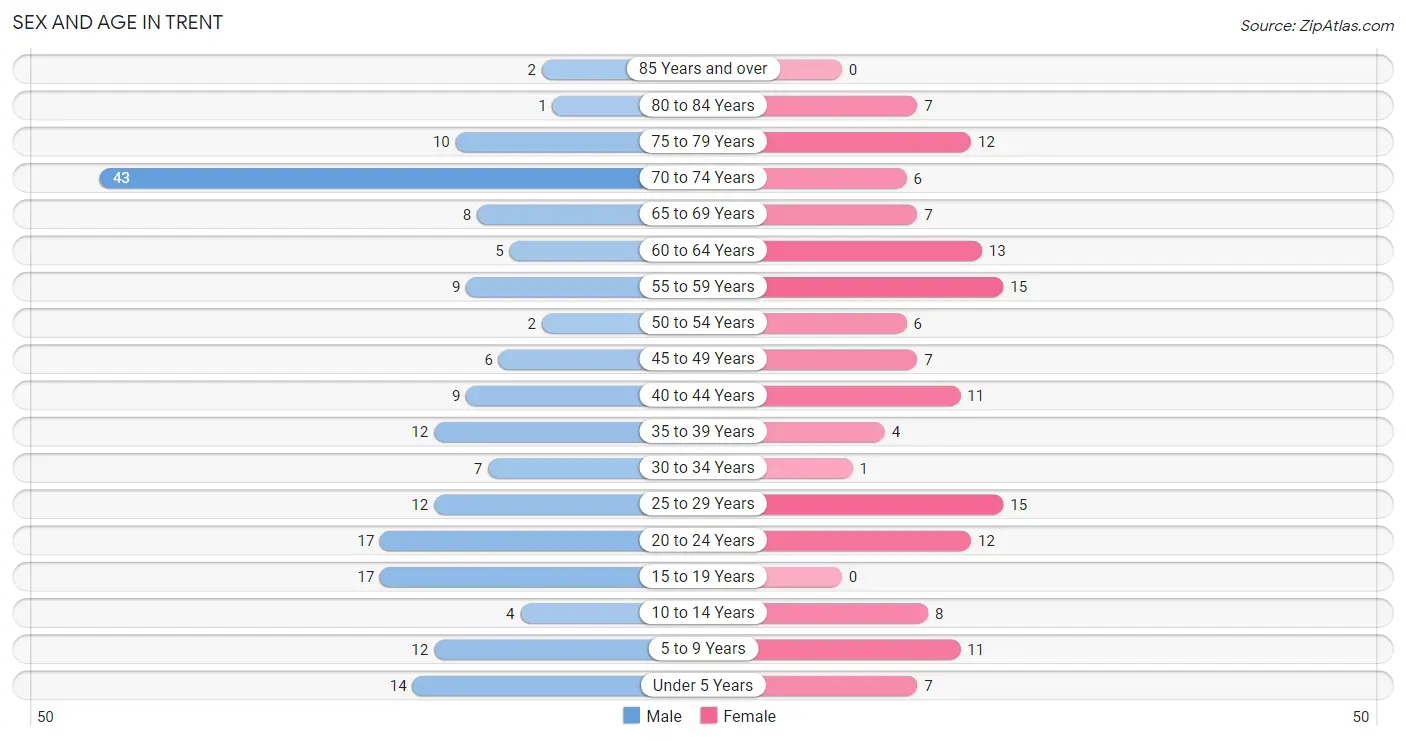
| Age Bracket | Male | Female |
| Under 5 Years | 14 (7.4%) | 7 (4.9%) |
| 5 to 9 Years | 12 (6.3%) | 11 (7.7%) |
| 10 to 14 Years | 4 (2.1%) | 8 (5.6%) |
| 15 to 19 Years | 17 (8.9%) | 0 (0.0%) |
| 20 to 24 Years | 17 (8.9%) | 12 (8.5%) |
| 25 to 29 Years | 12 (6.3%) | 15 (10.6%) |
| 30 to 34 Years | 7 (3.7%) | 1 (0.7%) |
| 35 to 39 Years | 12 (6.3%) | 4 (2.8%) |
| 40 to 44 Years | 9 (4.7%) | 11 (7.7%) |
| 45 to 49 Years | 6 (3.2%) | 7 (4.9%) |
| 50 to 54 Years | 2 (1.1%) | 6 (4.2%) |
| 55 to 59 Years | 9 (4.7%) | 15 (10.6%) |
| 60 to 64 Years | 5 (2.6%) | 13 (9.1%) |
| 65 to 69 Years | 8 (4.2%) | 7 (4.9%) |
| 70 to 74 Years | 43 (22.6%) | 6 (4.2%) |
| 75 to 79 Years | 10 (5.3%) | 12 (8.5%) |
| 80 to 84 Years | 1 (0.5%) | 7 (4.9%) |
| 85 Years and over | 2 (1.1%) | 0 (0.0%) |
| Total | 190 (100.0%) | 142 (100.0%) |
Families and Households in Trent
Median Family Size in Trent
The median family size in Trent is 2.80 persons per family, with married-couple families (62 | 81.6%) accounting for the largest median family size of 2.9 persons per family. On the other hand, single male/father families (5 | 6.6%) represent the smallest median family size with 2.00 persons per family.
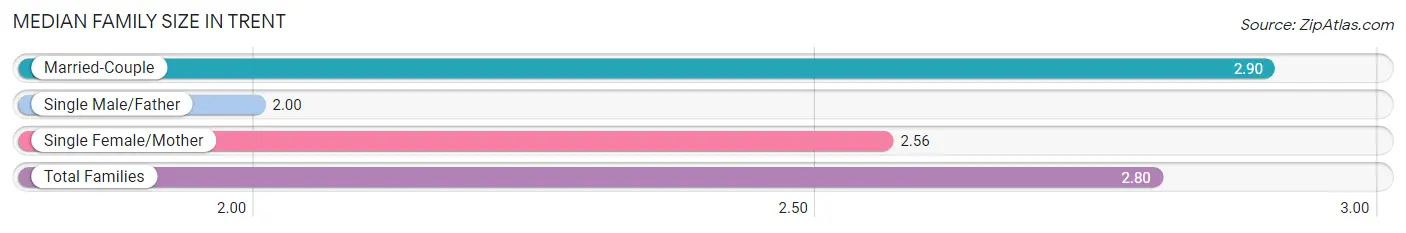
| Family Type | # Families | Family Size |
| Married-Couple | 62 (81.6%) | 2.90 |
| Single Male/Father | 5 (6.6%) | 2.00 |
| Single Female/Mother | 9 (11.8%) | 2.56 |
| Total Families | 76 (100.0%) | 2.80 |
Median Household Size in Trent
The median household size in Trent is 2.16 persons per household, with single male/father households (5 | 3.6%) accounting for the largest median household size of 3 persons per household. non-family households (63 | 45.3%) represent the smallest median household size with 1.29 persons per household.
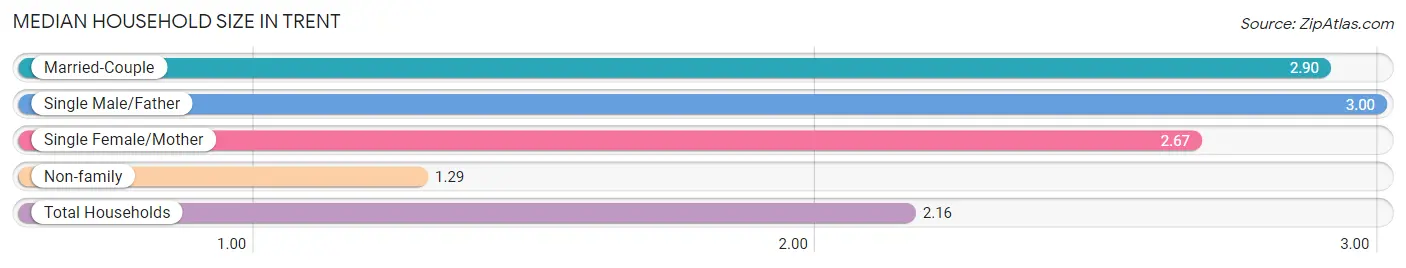
| Household Type | # Households | Household Size |
| Married-Couple | 62 (44.6%) | 2.90 |
| Single Male/Father | 5 (3.6%) | 3.00 |
| Single Female/Mother | 9 (6.5%) | 2.67 |
| Non-family | 63 (45.3%) | 1.29 |
| Total Households | 139 (100.0%) | 2.16 |
Household Size by Marriage Status in Trent
Out of a total of 139 households in Trent, 76 (54.7%) are family households, while 63 (45.3%) are nonfamily households. The most numerous type of family households are 2-person households, comprising 43, and the most common type of nonfamily households are 1-person households, comprising 49.
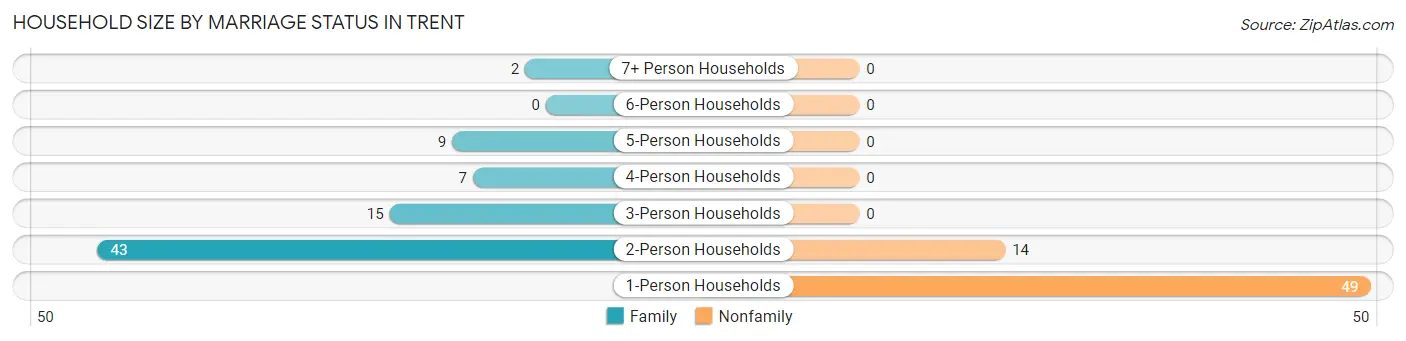
| Household Size | Family Households | Nonfamily Households |
| 1-Person Households | - | 49 (35.2%) |
| 2-Person Households | 43 (30.9%) | 14 (10.1%) |
| 3-Person Households | 15 (10.8%) | 0 (0.0%) |
| 4-Person Households | 7 (5.0%) | 0 (0.0%) |
| 5-Person Households | 9 (6.5%) | 0 (0.0%) |
| 6-Person Households | 0 (0.0%) | 0 (0.0%) |
| 7+ Person Households | 2 (1.4%) | 0 (0.0%) |
| Total | 76 (54.7%) | 63 (45.3%) |
Female Fertility in Trent
Fertility by Age in Trent
Average fertility rate in Trent is 77.0 births per 1,000 women. Women in the age bracket of 20 to 34 years have the highest fertility rate with 143.0 births per 1,000 women. Women in the age bracket of 20 to 34 years acount for 100.0% of all women with births.
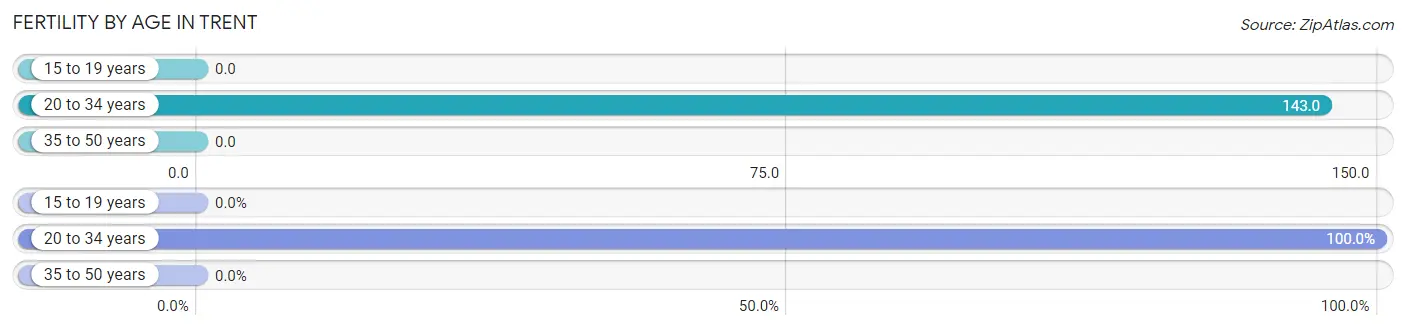
| Age Bracket | Women with Births | Births / 1,000 Women |
| 15 to 19 years | 0 (0.0%) | 0.0 |
| 20 to 34 years | 4 (100.0%) | 143.0 |
| 35 to 50 years | 0 (0.0%) | 0.0 |
| Total | 4 (100.0%) | 77.0 |
Fertility by Age by Marriage Status in Trent
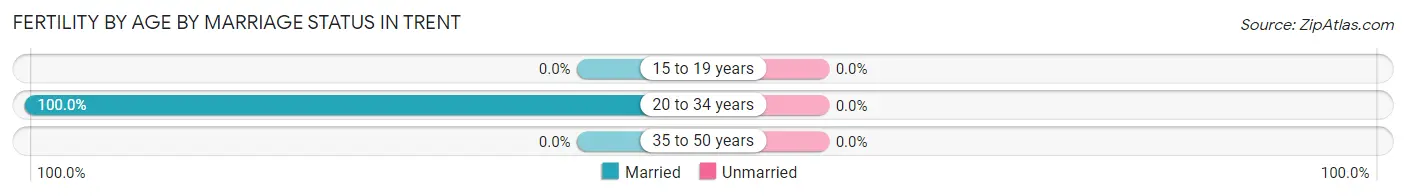
| Age Bracket | Married | Unmarried |
| 15 to 19 years | 0 (0.0%) | 0 (0.0%) |
| 20 to 34 years | 4 (100.0%) | 0 (0.0%) |
| 35 to 50 years | 0 (0.0%) | 0 (0.0%) |
| Total | 4 (100.0%) | 0 (0.0%) |
Fertility by Education in Trent
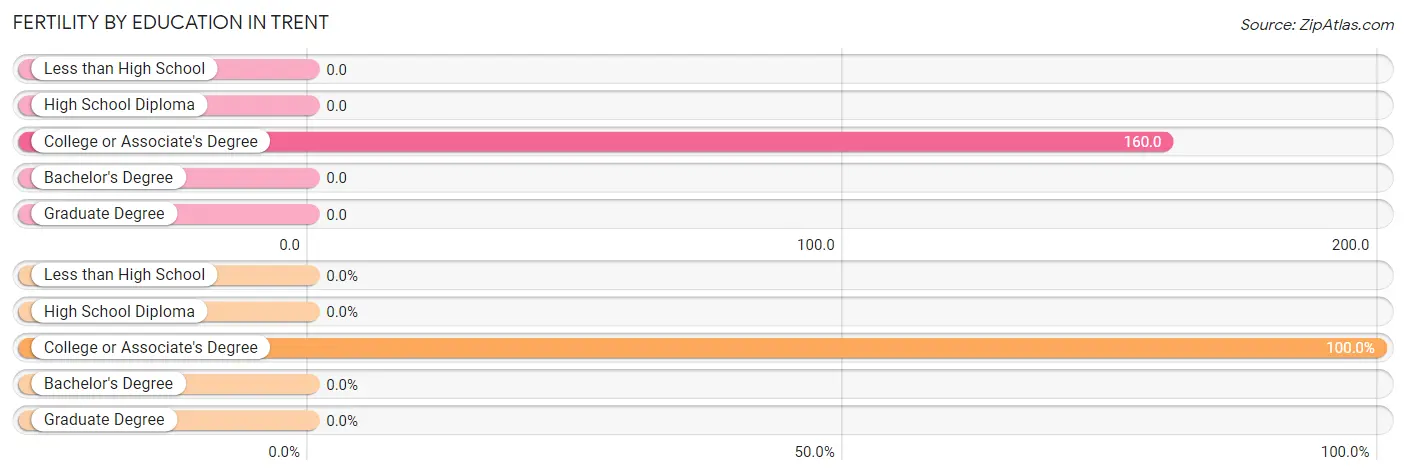
| Educational Attainment | Women with Births | Births / 1,000 Women |
| Less than High School | 0 (0.0%) | 0.0 |
| High School Diploma | 0 (0.0%) | 0.0 |
| College or Associate's Degree | 4 (100.0%) | 160.0 |
| Bachelor's Degree | 0 (0.0%) | 0.0 |
| Graduate Degree | 0 (0.0%) | 0.0 |
| Total | 4 (100.0%) | 77.0 |
Fertility by Education by Marriage Status in Trent
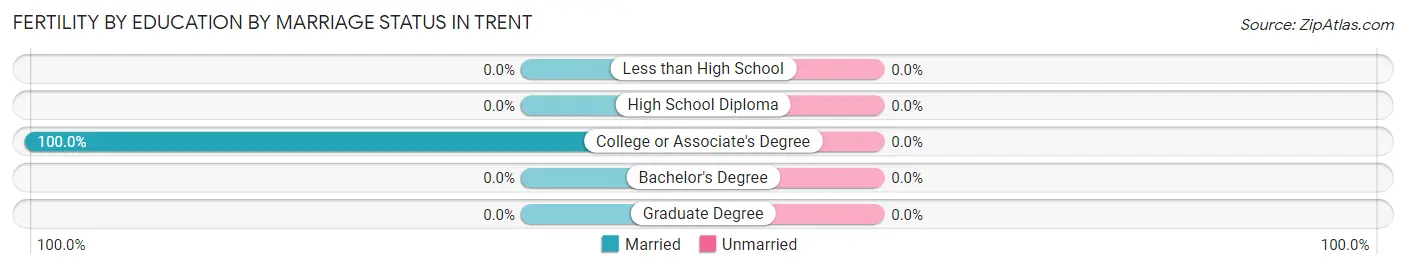
| Educational Attainment | Married | Unmarried |
| Less than High School | 0 (0.0%) | 0 (0.0%) |
| High School Diploma | 0 (0.0%) | 0 (0.0%) |
| College or Associate's Degree | 4 (100.0%) | 0 (0.0%) |
| Bachelor's Degree | 0 (0.0%) | 0 (0.0%) |
| Graduate Degree | 0 (0.0%) | 0 (0.0%) |
| Total | 4 (100.0%) | 0 (0.0%) |
Employment Characteristics in Trent
Employment by Class of Employer in Trent
Among the 162 employed individuals in Trent, private company employees (111 | 68.5%), not-for-profit organizations (20 | 12.3%), and self-employed (incorporated) (17 | 10.5%) make up the most common classes of employment.
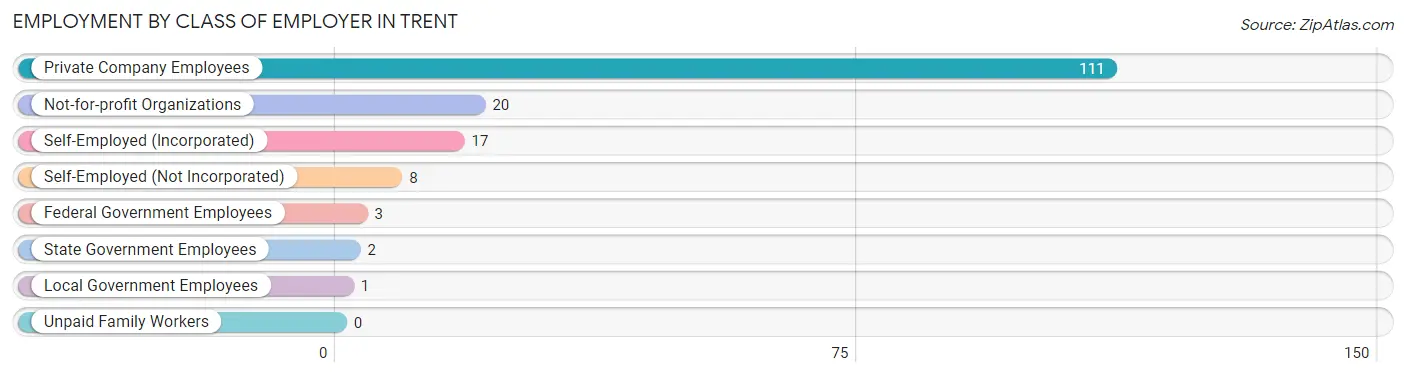
| Employer Class | # Employees | % Employees |
| Private Company Employees | 111 | 68.5% |
| Self-Employed (Incorporated) | 17 | 10.5% |
| Self-Employed (Not Incorporated) | 8 | 4.9% |
| Not-for-profit Organizations | 20 | 12.3% |
| Local Government Employees | 1 | 0.6% |
| State Government Employees | 2 | 1.2% |
| Federal Government Employees | 3 | 1.8% |
| Unpaid Family Workers | 0 | 0.0% |
| Total | 162 | 100.0% |
Employment Status by Age in Trent
According to the labor force statistics for Trent, out of the total population over 16 years of age (274), 61.7% or 169 individuals are in the labor force, with 1.8% or 3 of them unemployed. The age group with the highest labor force participation rate is 35 to 44 years, with 94.4% or 34 individuals in the labor force. Within the labor force, the 65 to 74 years age range has the highest percentage of unemployed individuals, with 20.0% or 3 of them being unemployed.
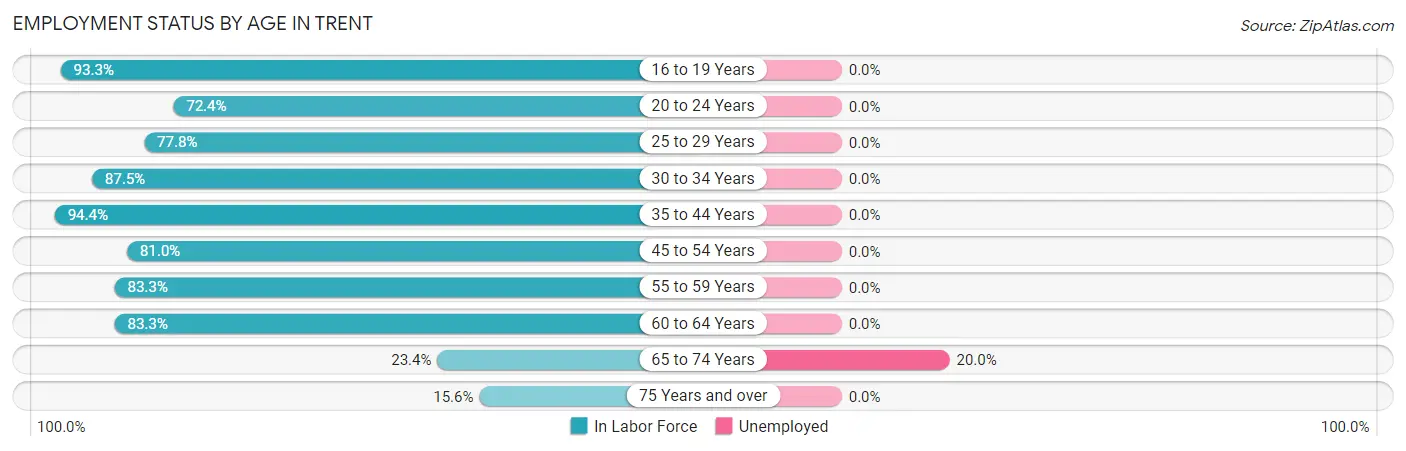
| Age Bracket | In Labor Force | Unemployed |
| 16 to 19 Years | 14 (93.3%) | 0 (0.0%) |
| 20 to 24 Years | 21 (72.4%) | 0 (0.0%) |
| 25 to 29 Years | 21 (77.8%) | 0 (0.0%) |
| 30 to 34 Years | 7 (87.5%) | 0 (0.0%) |
| 35 to 44 Years | 34 (94.4%) | 0 (0.0%) |
| 45 to 54 Years | 17 (81.0%) | 0 (0.0%) |
| 55 to 59 Years | 20 (83.3%) | 0 (0.0%) |
| 60 to 64 Years | 15 (83.3%) | 0 (0.0%) |
| 65 to 74 Years | 15 (23.4%) | 3 (20.0%) |
| 75 Years and over | 5 (15.6%) | 0 (0.0%) |
| Total | 169 (61.7%) | 3 (1.8%) |
Employment Status by Educational Attainment in Trent
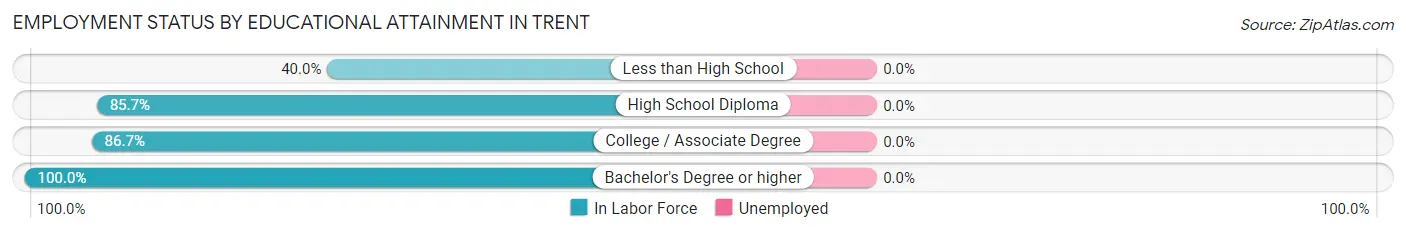
| Educational Attainment | In Labor Force | Unemployed |
| Less than High School | 4 (40.0%) | 0 (0.0%) |
| High School Diploma | 36 (85.7%) | 0 (0.0%) |
| College / Associate Degree | 52 (86.7%) | 0 (0.0%) |
| Bachelor's Degree or higher | 22 (100.0%) | 0 (0.0%) |
| Total | 114 (85.1%) | 0 (0.0%) |
Employment Occupations by Sex in Trent
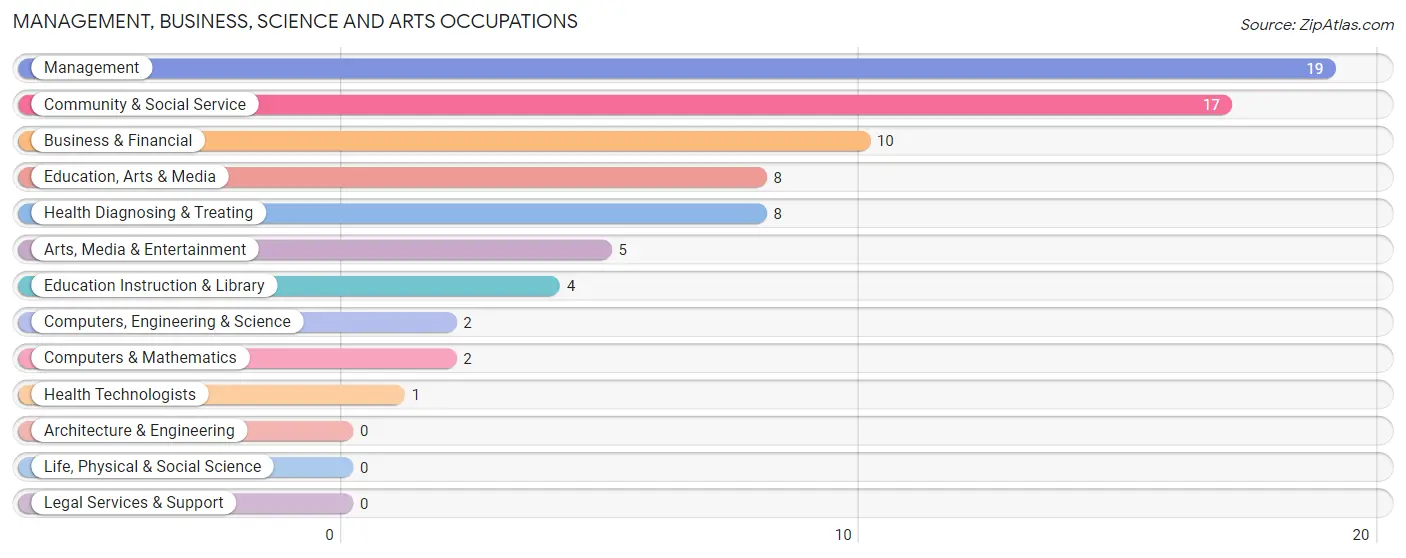
Management, Business, Science and Arts Occupations
The most common Management, Business, Science and Arts occupations in Trent are Management (19 | 11.5%), Community & Social Service (17 | 10.2%), Business & Financial (10 | 6.0%), Education, Arts & Media (8 | 4.8%), and Health Diagnosing & Treating (8 | 4.8%).
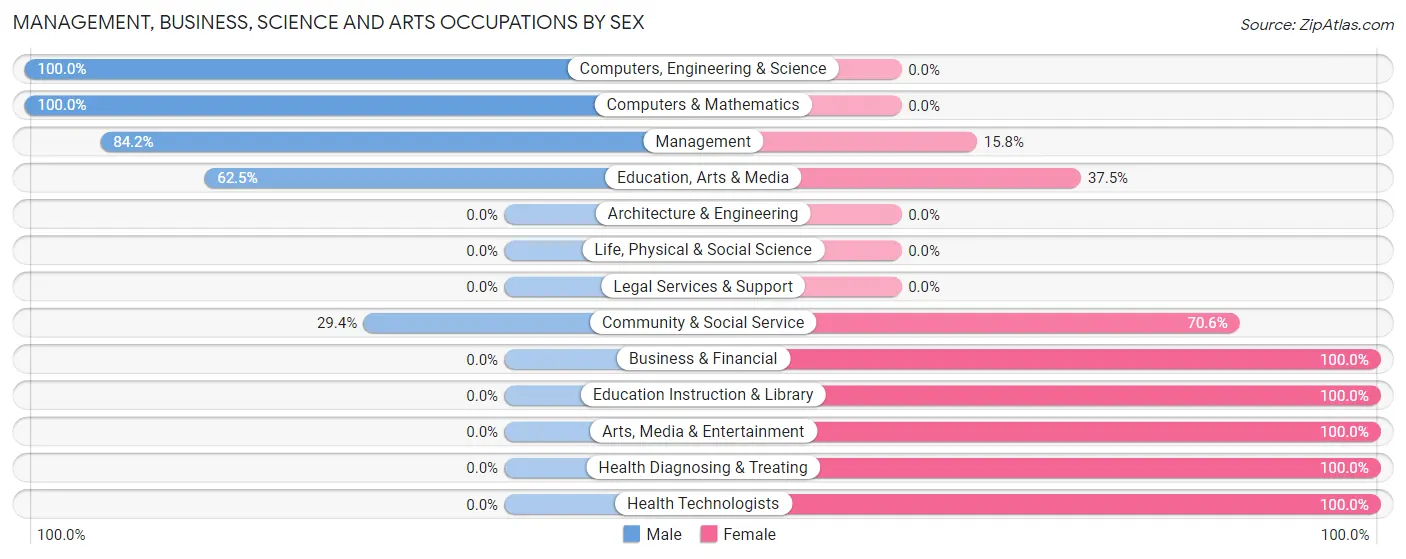
Management, Business, Science and Arts Occupations by Sex
Within the Management, Business, Science and Arts occupations in Trent, the most male-oriented occupations are Computers, Engineering & Science (100.0%), Computers & Mathematics (100.0%), and Management (84.2%), while the most female-oriented occupations are Business & Financial (100.0%), Education Instruction & Library (100.0%), and Arts, Media & Entertainment (100.0%).
| Occupation | Male | Female |
| Management | 16 (84.2%) | 3 (15.8%) |
| Business & Financial | 0 (0.0%) | 10 (100.0%) |
| Computers, Engineering & Science | 2 (100.0%) | 0 (0.0%) |
| Computers & Mathematics | 2 (100.0%) | 0 (0.0%) |
| Architecture & Engineering | 0 (0.0%) | 0 (0.0%) |
| Life, Physical & Social Science | 0 (0.0%) | 0 (0.0%) |
| Community & Social Service | 5 (29.4%) | 12 (70.6%) |
| Education, Arts & Media | 5 (62.5%) | 3 (37.5%) |
| Legal Services & Support | 0 (0.0%) | 0 (0.0%) |
| Education Instruction & Library | 0 (0.0%) | 4 (100.0%) |
| Arts, Media & Entertainment | 0 (0.0%) | 5 (100.0%) |
| Health Diagnosing & Treating | 0 (0.0%) | 8 (100.0%) |
| Health Technologists | 0 (0.0%) | 1 (100.0%) |
| Total (Category) | 23 (41.1%) | 33 (58.9%) |
| Total (Overall) | 94 (56.6%) | 72 (43.4%) |
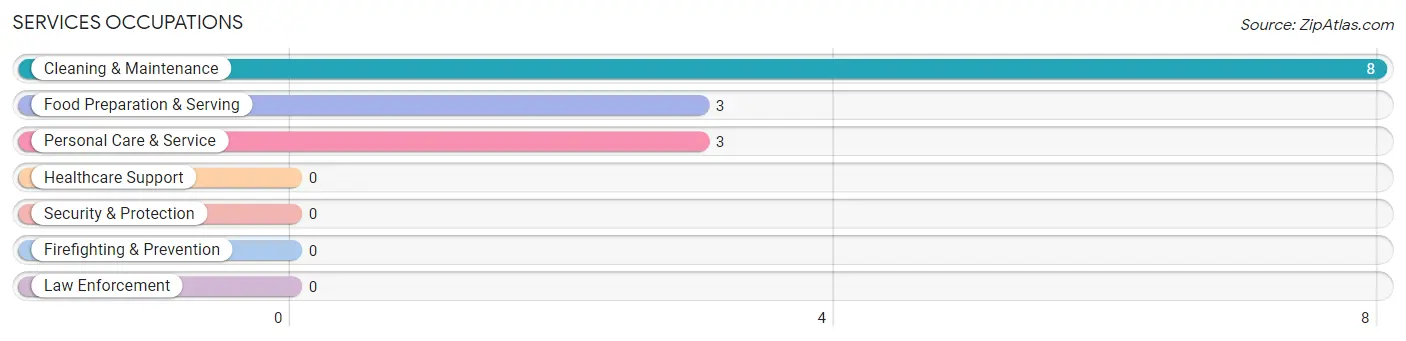
Services Occupations
The most common Services occupations in Trent are Cleaning & Maintenance (8 | 4.8%), Food Preparation & Serving (3 | 1.8%), and Personal Care & Service (3 | 1.8%).
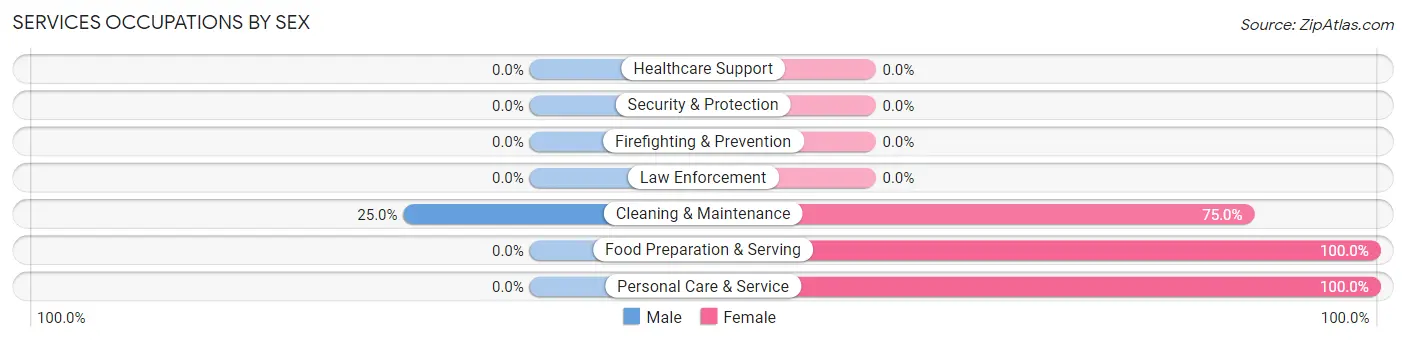
Services Occupations by Sex
| Occupation | Male | Female |
| Healthcare Support | 0 (0.0%) | 0 (0.0%) |
| Security & Protection | 0 (0.0%) | 0 (0.0%) |
| Firefighting & Prevention | 0 (0.0%) | 0 (0.0%) |
| Law Enforcement | 0 (0.0%) | 0 (0.0%) |
| Food Preparation & Serving | 0 (0.0%) | 3 (100.0%) |
| Cleaning & Maintenance | 2 (25.0%) | 6 (75.0%) |
| Personal Care & Service | 0 (0.0%) | 3 (100.0%) |
| Total (Category) | 2 (14.3%) | 12 (85.7%) |
| Total (Overall) | 94 (56.6%) | 72 (43.4%) |
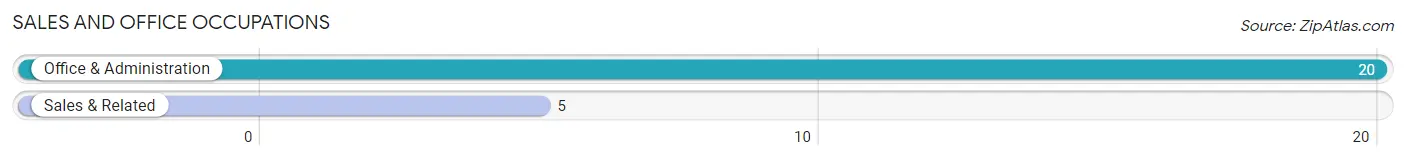
Sales and Office Occupations
The most common Sales and Office occupations in Trent are Office & Administration (20 | 12.0%), and Sales & Related (5 | 3.0%).
Sales and Office Occupations by Sex
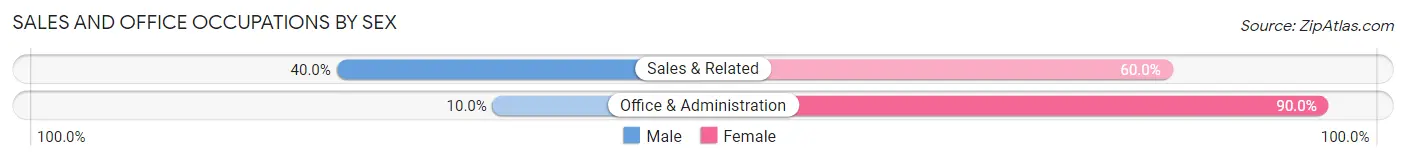
| Occupation | Male | Female |
| Sales & Related | 2 (40.0%) | 3 (60.0%) |
| Office & Administration | 2 (10.0%) | 18 (90.0%) |
| Total (Category) | 4 (16.0%) | 21 (84.0%) |
| Total (Overall) | 94 (56.6%) | 72 (43.4%) |
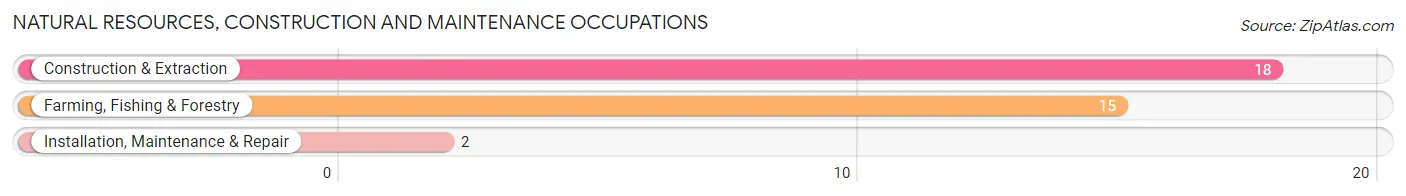
Natural Resources, Construction and Maintenance Occupations
The most common Natural Resources, Construction and Maintenance occupations in Trent are Construction & Extraction (18 | 10.8%), Farming, Fishing & Forestry (15 | 9.0%), and Installation, Maintenance & Repair (2 | 1.2%).
Natural Resources, Construction and Maintenance Occupations by Sex
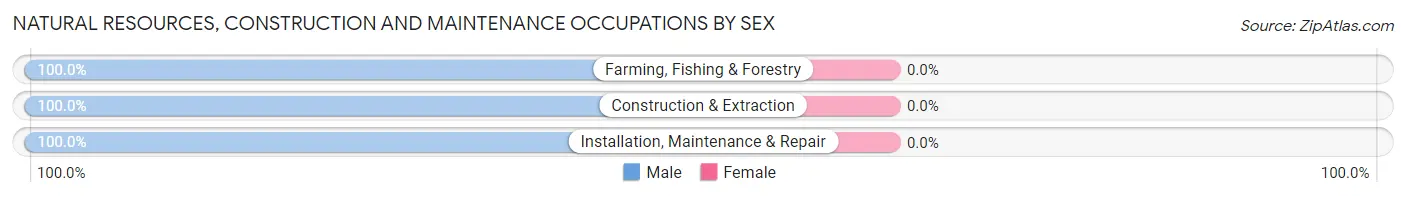
| Occupation | Male | Female |
| Farming, Fishing & Forestry | 15 (100.0%) | 0 (0.0%) |
| Construction & Extraction | 18 (100.0%) | 0 (0.0%) |
| Installation, Maintenance & Repair | 2 (100.0%) | 0 (0.0%) |
| Total (Category) | 35 (100.0%) | 0 (0.0%) |
| Total (Overall) | 94 (56.6%) | 72 (43.4%) |
Production, Transportation and Moving Occupations
The most common Production, Transportation and Moving occupations in Trent are Transportation (13 | 7.8%), Production (12 | 7.2%), and Material Moving (11 | 6.6%).
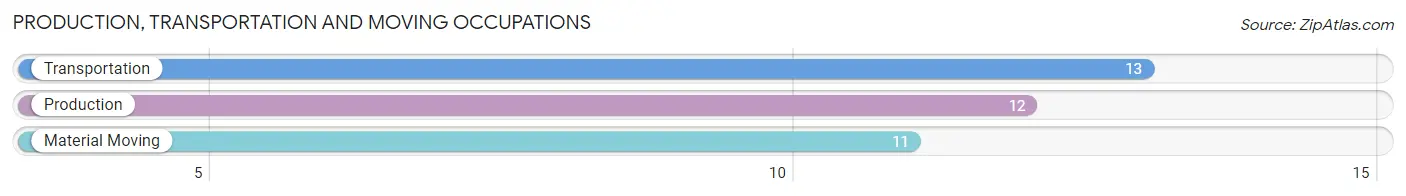
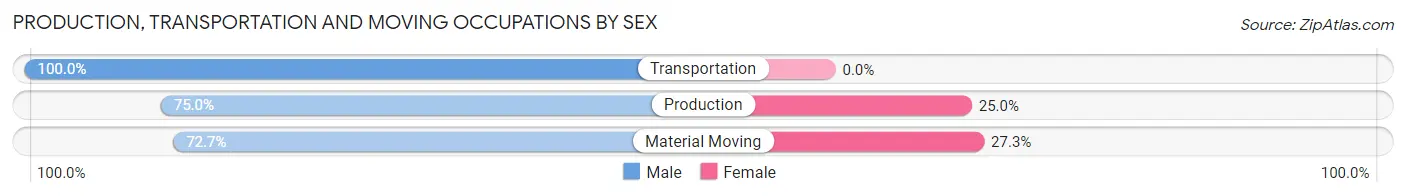
Production, Transportation and Moving Occupations by Sex
| Occupation | Male | Female |
| Production | 9 (75.0%) | 3 (25.0%) |
| Transportation | 13 (100.0%) | 0 (0.0%) |
| Material Moving | 8 (72.7%) | 3 (27.3%) |
| Total (Category) | 30 (83.3%) | 6 (16.7%) |
| Total (Overall) | 94 (56.6%) | 72 (43.4%) |
Employment Industries by Sex in Trent
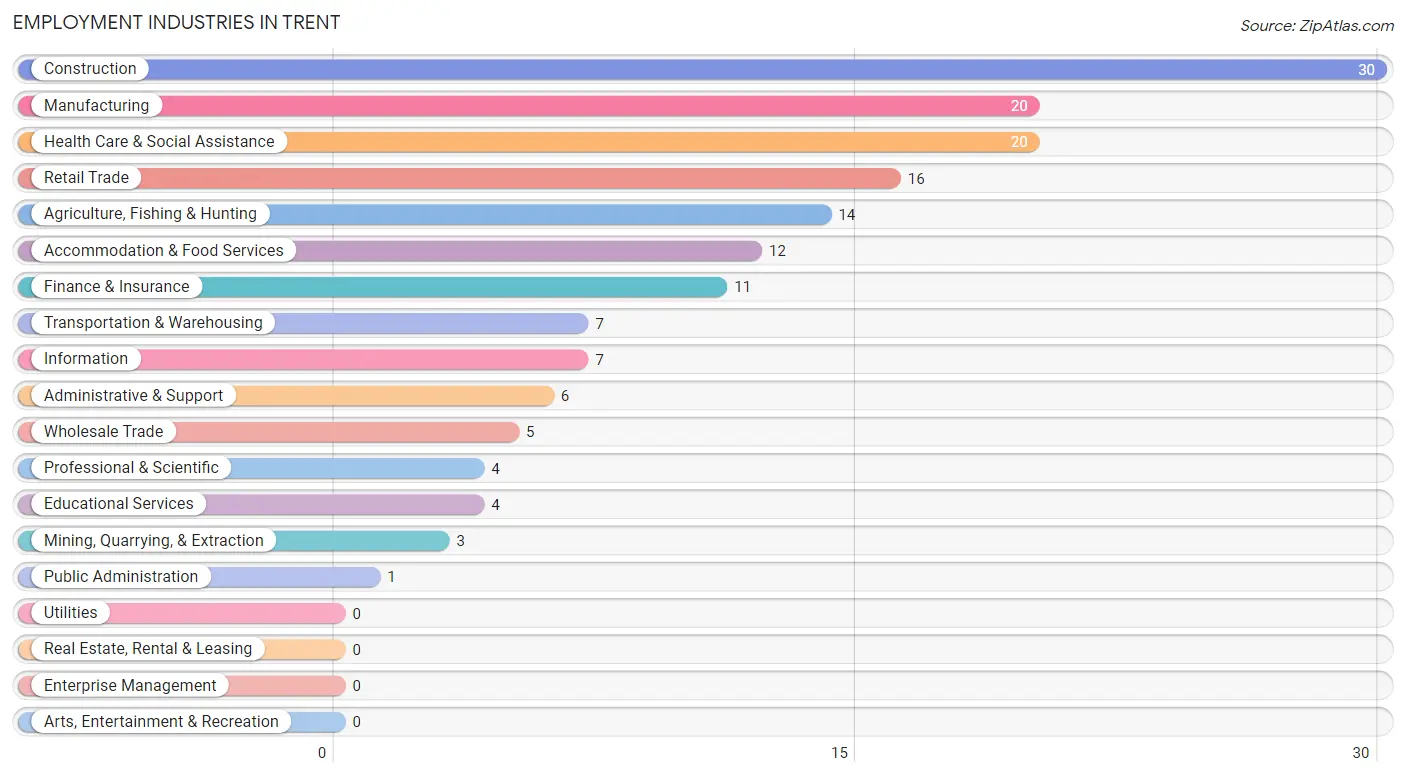
Employment Industries in Trent
The major employment industries in Trent include Construction (30 | 18.1%), Manufacturing (20 | 12.0%), Health Care & Social Assistance (20 | 12.0%), Retail Trade (16 | 9.6%), and Agriculture, Fishing & Hunting (14 | 8.4%).
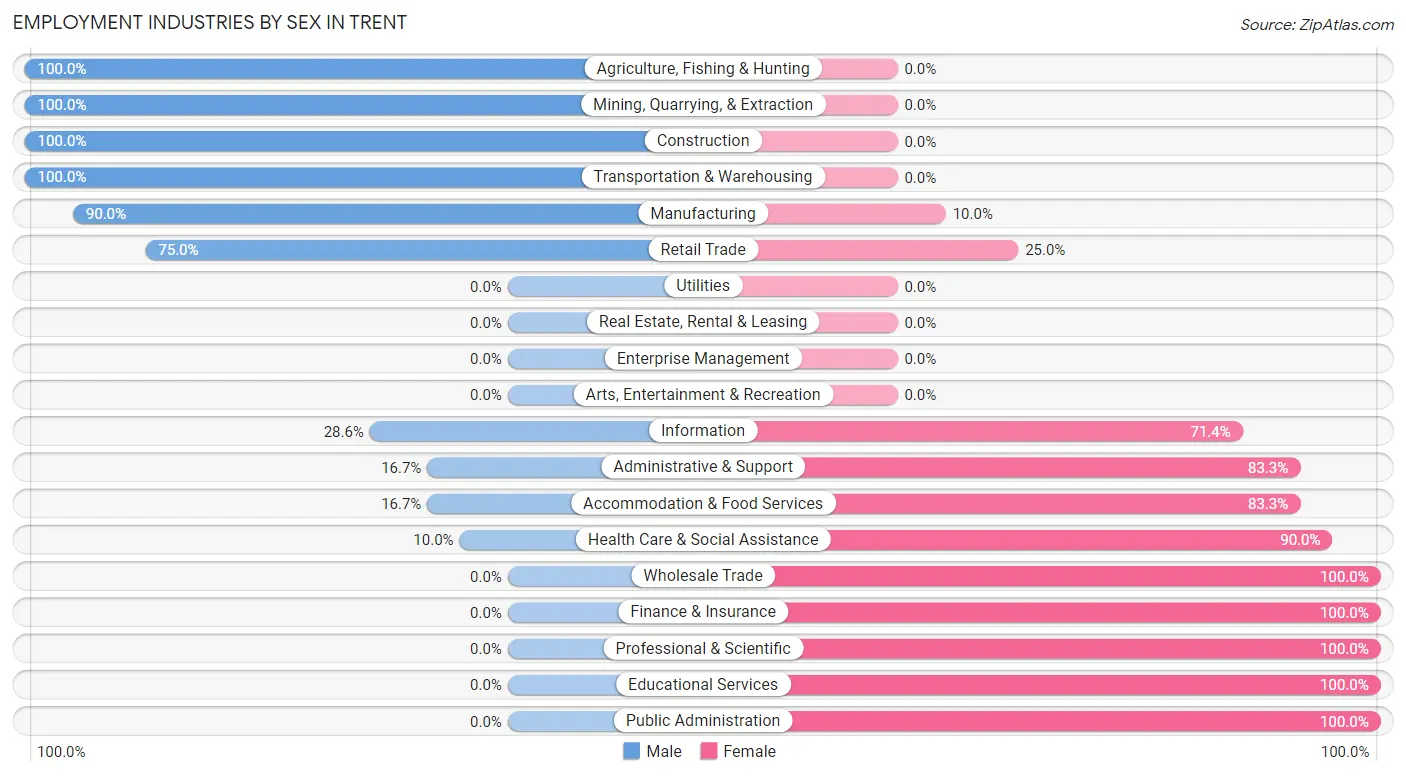
Employment Industries by Sex in Trent
The Trent industries that see more men than women are Agriculture, Fishing & Hunting (100.0%), Mining, Quarrying, & Extraction (100.0%), and Construction (100.0%), whereas the industries that tend to have a higher number of women are Wholesale Trade (100.0%), Finance & Insurance (100.0%), and Professional & Scientific (100.0%).
| Industry | Male | Female |
| Agriculture, Fishing & Hunting | 14 (100.0%) | 0 (0.0%) |
| Mining, Quarrying, & Extraction | 3 (100.0%) | 0 (0.0%) |
| Construction | 30 (100.0%) | 0 (0.0%) |
| Manufacturing | 18 (90.0%) | 2 (10.0%) |
| Wholesale Trade | 0 (0.0%) | 5 (100.0%) |
| Retail Trade | 12 (75.0%) | 4 (25.0%) |
| Transportation & Warehousing | 7 (100.0%) | 0 (0.0%) |
| Utilities | 0 (0.0%) | 0 (0.0%) |
| Information | 2 (28.6%) | 5 (71.4%) |
| Finance & Insurance | 0 (0.0%) | 11 (100.0%) |
| Real Estate, Rental & Leasing | 0 (0.0%) | 0 (0.0%) |
| Professional & Scientific | 0 (0.0%) | 4 (100.0%) |
| Enterprise Management | 0 (0.0%) | 0 (0.0%) |
| Administrative & Support | 1 (16.7%) | 5 (83.3%) |
| Educational Services | 0 (0.0%) | 4 (100.0%) |
| Health Care & Social Assistance | 2 (10.0%) | 18 (90.0%) |
| Arts, Entertainment & Recreation | 0 (0.0%) | 0 (0.0%) |
| Accommodation & Food Services | 2 (16.7%) | 10 (83.3%) |
| Public Administration | 0 (0.0%) | 1 (100.0%) |
| Total | 94 (56.6%) | 72 (43.4%) |
Education in Trent
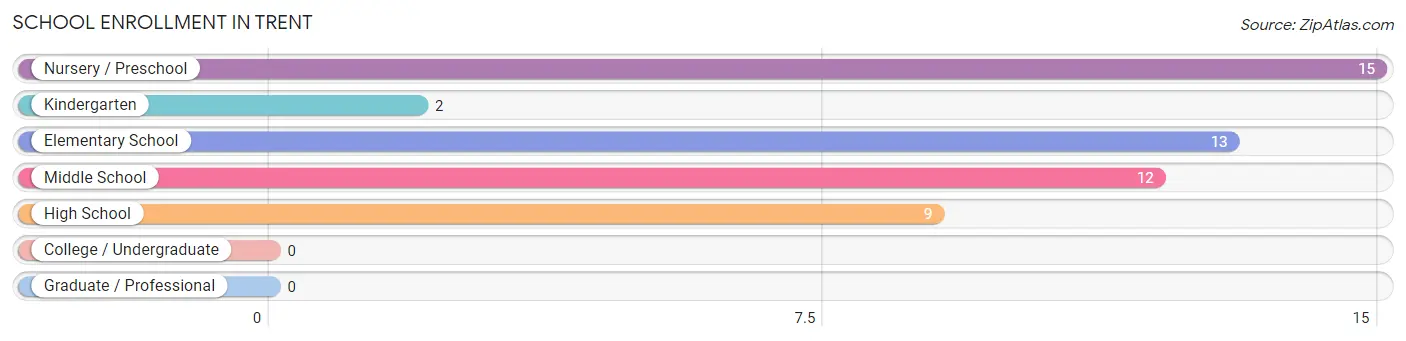
School Enrollment in Trent
The most common levels of schooling among the 51 students in Trent are nursery / preschool (15 | 29.4%), elementary school (13 | 25.5%), and middle school (12 | 23.5%).
| School Level | # Students | % Students |
| Nursery / Preschool | 15 | 29.4% |
| Kindergarten | 2 | 3.9% |
| Elementary School | 13 | 25.5% |
| Middle School | 12 | 23.5% |
| High School | 9 | 17.6% |
| College / Undergraduate | 0 | 0.0% |
| Graduate / Professional | 0 | 0.0% |
| Total | 51 | 100.0% |
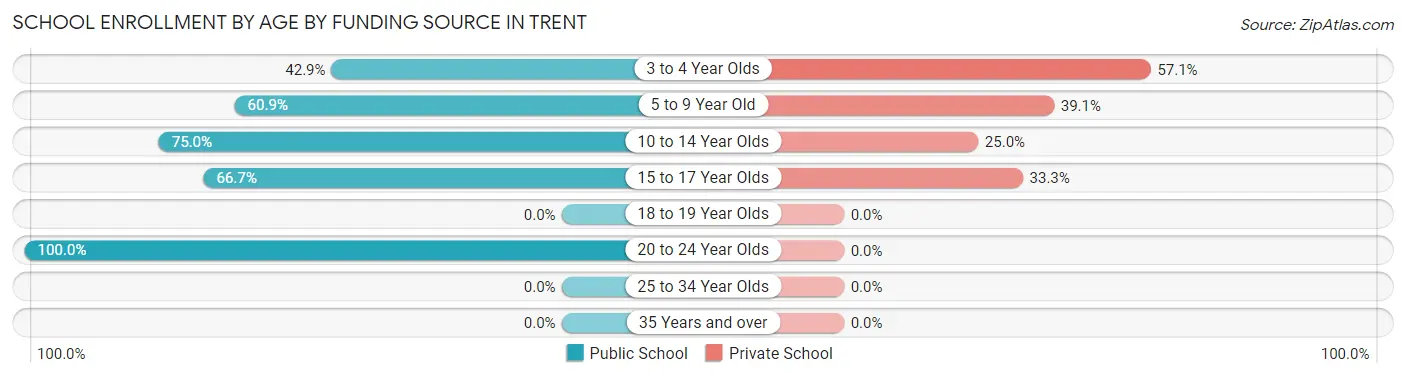
School Enrollment by Age by Funding Source in Trent
Out of a total of 51 students who are enrolled in schools in Trent, 17 (33.3%) attend a private institution, while the remaining 34 (66.7%) are enrolled in public schools. The age group of 3 to 4 year olds has the highest likelihood of being enrolled in private schools, with 4 (57.1% in the age bracket) enrolled. Conversely, the age group of 20 to 24 year olds has the lowest likelihood of being enrolled in a private school, with 6 (100.0% in the age bracket) attending a public institution.
| Age Bracket | Public School | Private School |
| 3 to 4 Year Olds | 3 (42.9%) | 4 (57.1%) |
| 5 to 9 Year Old | 14 (60.9%) | 9 (39.1%) |
| 10 to 14 Year Olds | 9 (75.0%) | 3 (25.0%) |
| 15 to 17 Year Olds | 2 (66.7%) | 1 (33.3%) |
| 18 to 19 Year Olds | 0 (0.0%) | 0 (0.0%) |
| 20 to 24 Year Olds | 6 (100.0%) | 0 (0.0%) |
| 25 to 34 Year Olds | 0 (0.0%) | 0 (0.0%) |
| 35 Years and over | 0 (0.0%) | 0 (0.0%) |
| Total | 34 (66.7%) | 17 (33.3%) |
Educational Attainment by Field of Study in Trent
Education (13 | 36.1%), bio, nature & agricultural (6 | 16.7%), business (5 | 13.9%), psychology (4 | 11.1%), and arts & humanities (3 | 8.3%) are the most common fields of study among 36 individuals in Trent who have obtained a bachelor's degree or higher.
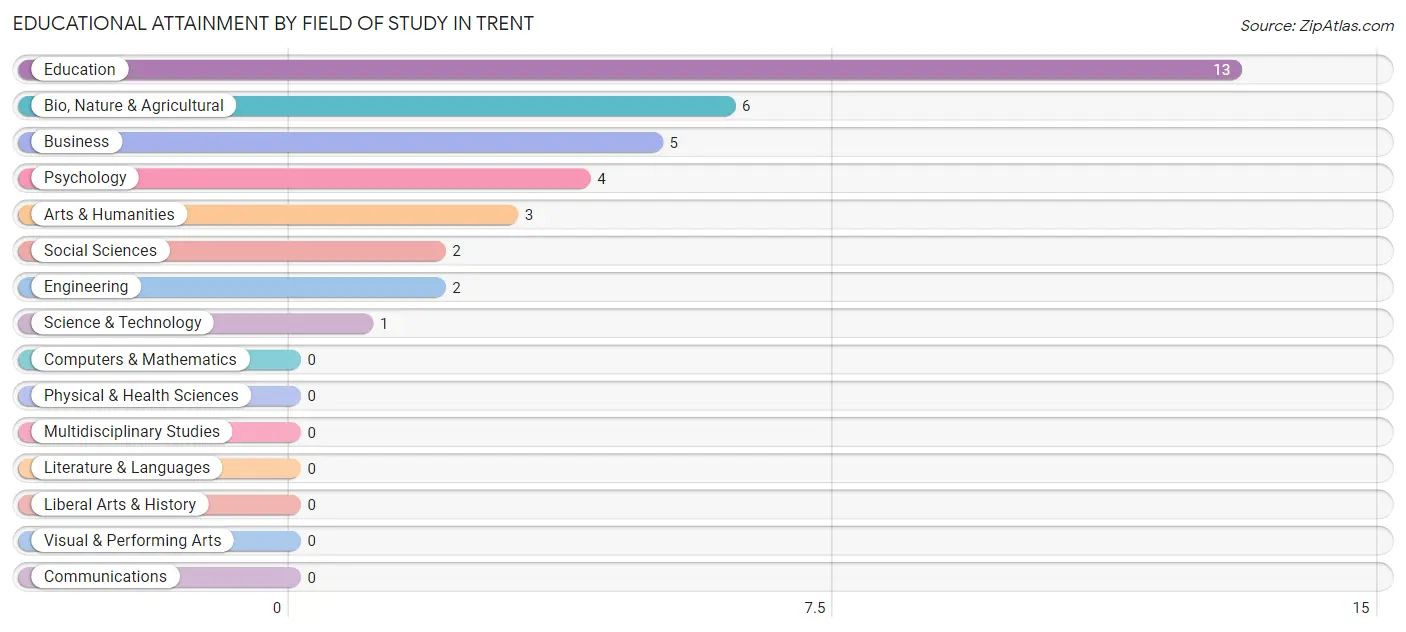
| Field of Study | # Graduates | % Graduates |
| Computers & Mathematics | 0 | 0.0% |
| Bio, Nature & Agricultural | 6 | 16.7% |
| Physical & Health Sciences | 0 | 0.0% |
| Psychology | 4 | 11.1% |
| Social Sciences | 2 | 5.6% |
| Engineering | 2 | 5.6% |
| Multidisciplinary Studies | 0 | 0.0% |
| Science & Technology | 1 | 2.8% |
| Business | 5 | 13.9% |
| Education | 13 | 36.1% |
| Literature & Languages | 0 | 0.0% |
| Liberal Arts & History | 0 | 0.0% |
| Visual & Performing Arts | 0 | 0.0% |
| Communications | 0 | 0.0% |
| Arts & Humanities | 3 | 8.3% |
| Total | 36 | 100.0% |
Transportation & Commute in Trent
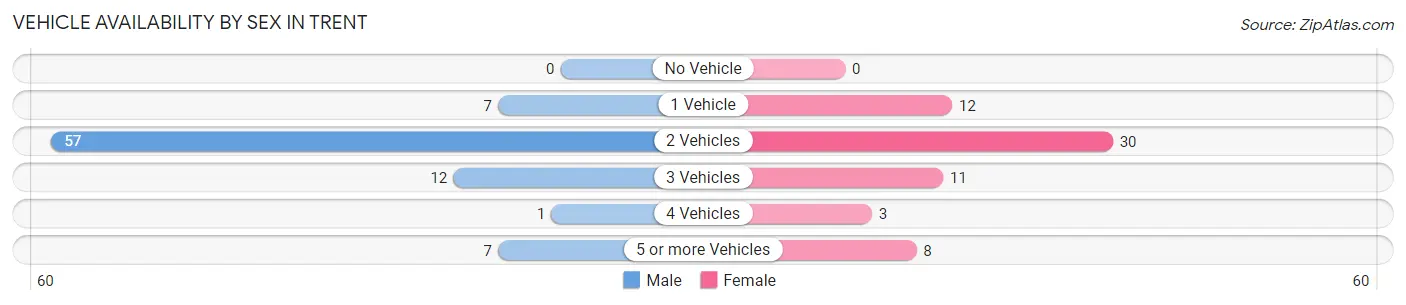
Vehicle Availability by Sex in Trent
The most prevalent vehicle ownership categories in Trent are males with 2 vehicles (57, accounting for 67.9%) and females with 2 vehicles (30, making up 89.1%).
| Vehicles Available | Male | Female |
| No Vehicle | 0 (0.0%) | 0 (0.0%) |
| 1 Vehicle | 7 (8.3%) | 12 (18.8%) |
| 2 Vehicles | 57 (67.9%) | 30 (46.9%) |
| 3 Vehicles | 12 (14.3%) | 11 (17.2%) |
| 4 Vehicles | 1 (1.2%) | 3 (4.7%) |
| 5 or more Vehicles | 7 (8.3%) | 8 (12.5%) |
| Total | 84 (100.0%) | 64 (100.0%) |
Commute Time in Trent
The most frequently occuring commute durations in Trent are 30 to 34 minutes (30 commuters, 21.4%), 20 to 24 minutes (21 commuters, 15.0%), and less than 5 minutes (19 commuters, 13.6%).
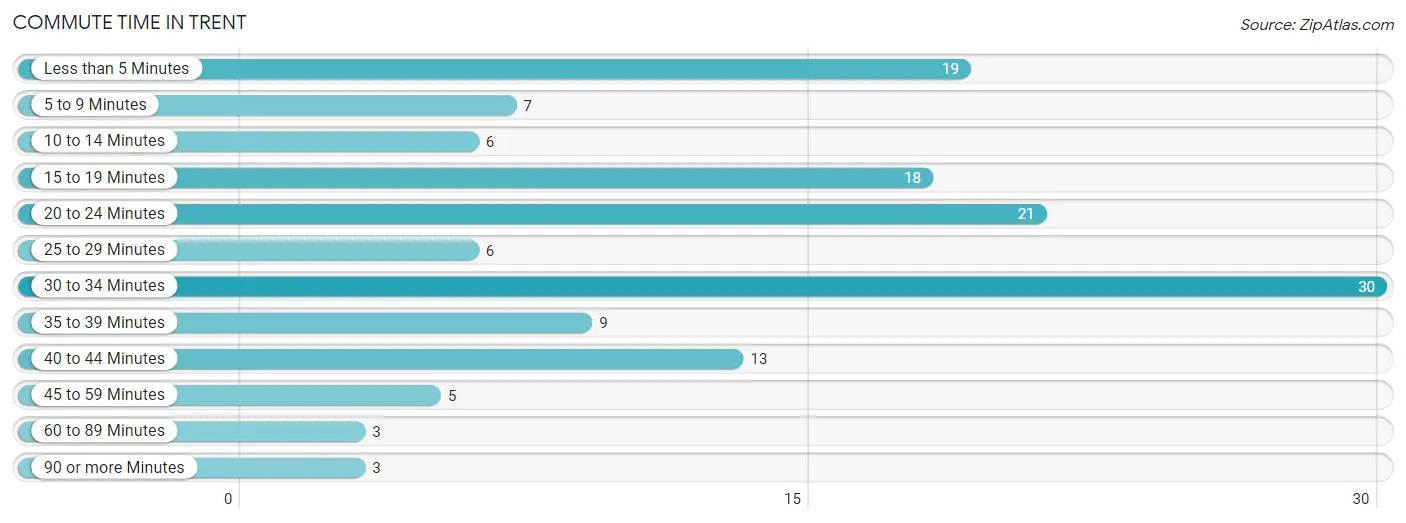
| Commute Time | # Commuters | % Commuters |
| Less than 5 Minutes | 19 | 13.6% |
| 5 to 9 Minutes | 7 | 5.0% |
| 10 to 14 Minutes | 6 | 4.3% |
| 15 to 19 Minutes | 18 | 12.9% |
| 20 to 24 Minutes | 21 | 15.0% |
| 25 to 29 Minutes | 6 | 4.3% |
| 30 to 34 Minutes | 30 | 21.4% |
| 35 to 39 Minutes | 9 | 6.4% |
| 40 to 44 Minutes | 13 | 9.3% |
| 45 to 59 Minutes | 5 | 3.6% |
| 60 to 89 Minutes | 3 | 2.1% |
| 90 or more Minutes | 3 | 2.1% |
Commute Time by Sex in Trent
The most common commute times in Trent are 30 to 34 minutes (22 commuters, 29.3%) for males and less than 5 minutes (12 commuters, 18.5%) for females.
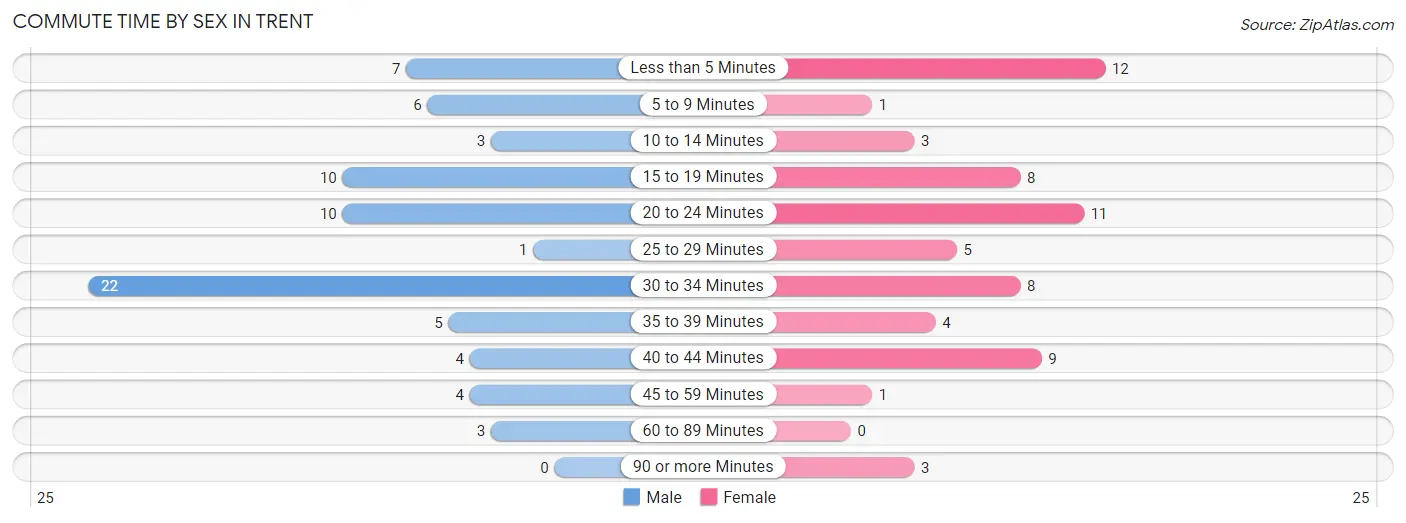
| Commute Time | Male | Female |
| Less than 5 Minutes | 7 (9.3%) | 12 (18.5%) |
| 5 to 9 Minutes | 6 (8.0%) | 1 (1.5%) |
| 10 to 14 Minutes | 3 (4.0%) | 3 (4.6%) |
| 15 to 19 Minutes | 10 (13.3%) | 8 (12.3%) |
| 20 to 24 Minutes | 10 (13.3%) | 11 (16.9%) |
| 25 to 29 Minutes | 1 (1.3%) | 5 (7.7%) |
| 30 to 34 Minutes | 22 (29.3%) | 8 (12.3%) |
| 35 to 39 Minutes | 5 (6.7%) | 4 (6.1%) |
| 40 to 44 Minutes | 4 (5.3%) | 9 (13.9%) |
| 45 to 59 Minutes | 4 (5.3%) | 1 (1.5%) |
| 60 to 89 Minutes | 3 (4.0%) | 0 (0.0%) |
| 90 or more Minutes | 0 (0.0%) | 3 (4.6%) |
Time of Departure to Work by Sex in Trent
The most frequent times of departure to work in Trent are 5:30 AM to 5:59 AM (17, 22.7%) for males and 7:00 AM to 7:29 AM (21, 32.3%) for females.
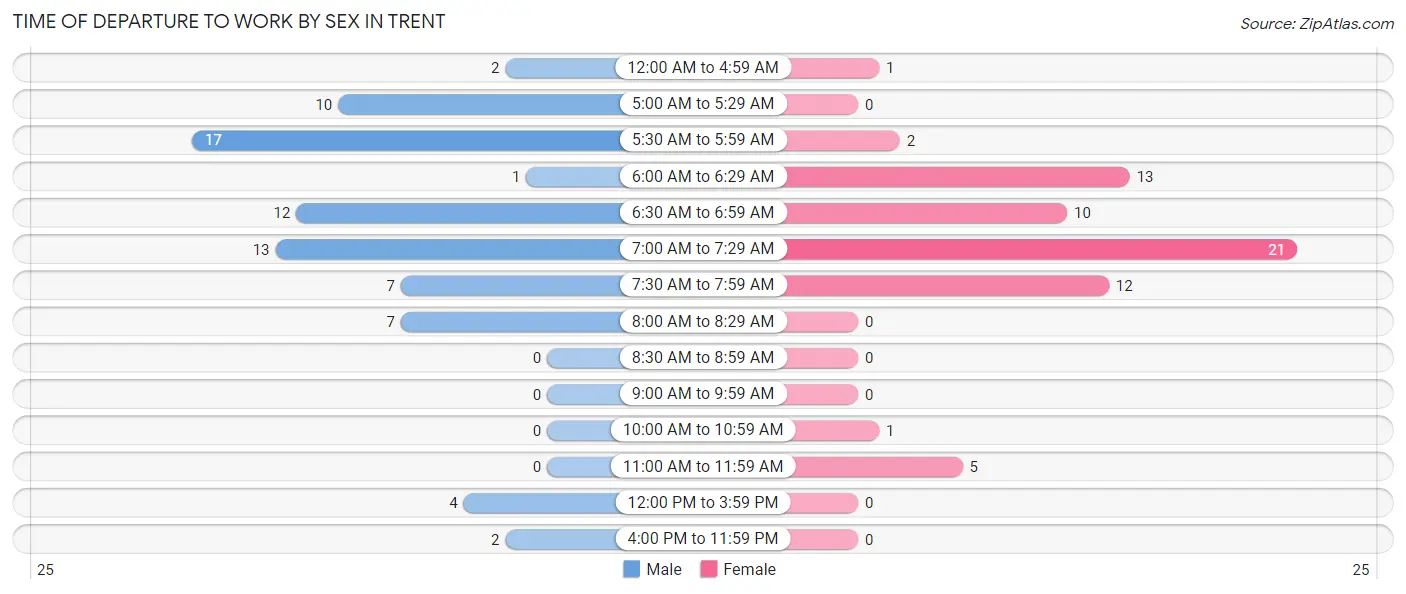
| Time of Departure | Male | Female |
| 12:00 AM to 4:59 AM | 2 (2.7%) | 1 (1.5%) |
| 5:00 AM to 5:29 AM | 10 (13.3%) | 0 (0.0%) |
| 5:30 AM to 5:59 AM | 17 (22.7%) | 2 (3.1%) |
| 6:00 AM to 6:29 AM | 1 (1.3%) | 13 (20.0%) |
| 6:30 AM to 6:59 AM | 12 (16.0%) | 10 (15.4%) |
| 7:00 AM to 7:29 AM | 13 (17.3%) | 21 (32.3%) |
| 7:30 AM to 7:59 AM | 7 (9.3%) | 12 (18.5%) |
| 8:00 AM to 8:29 AM | 7 (9.3%) | 0 (0.0%) |
| 8:30 AM to 8:59 AM | 0 (0.0%) | 0 (0.0%) |
| 9:00 AM to 9:59 AM | 0 (0.0%) | 0 (0.0%) |
| 10:00 AM to 10:59 AM | 0 (0.0%) | 1 (1.5%) |
| 11:00 AM to 11:59 AM | 0 (0.0%) | 5 (7.7%) |
| 12:00 PM to 3:59 PM | 4 (5.3%) | 0 (0.0%) |
| 4:00 PM to 11:59 PM | 2 (2.7%) | 0 (0.0%) |
| Total | 75 (100.0%) | 65 (100.0%) |
Housing Occupancy in Trent
Occupancy by Ownership in Trent
Of the total 139 dwellings in Trent, owner-occupied units account for 96 (69.1%), while renter-occupied units make up 43 (30.9%).

| Occupancy | # Housing Units | % Housing Units |
| Owner Occupied Housing Units | 96 | 69.1% |
| Renter-Occupied Housing Units | 43 | 30.9% |
| Total Occupied Housing Units | 139 | 100.0% |
Occupancy by Household Size in Trent
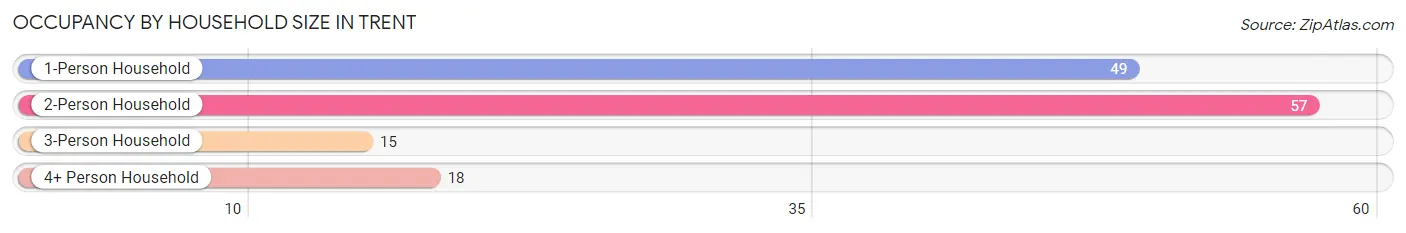
| Household Size | # Housing Units | % Housing Units |
| 1-Person Household | 49 | 35.2% |
| 2-Person Household | 57 | 41.0% |
| 3-Person Household | 15 | 10.8% |
| 4+ Person Household | 18 | 13.0% |
| Total Housing Units | 139 | 100.0% |
Occupancy by Ownership by Household Size in Trent
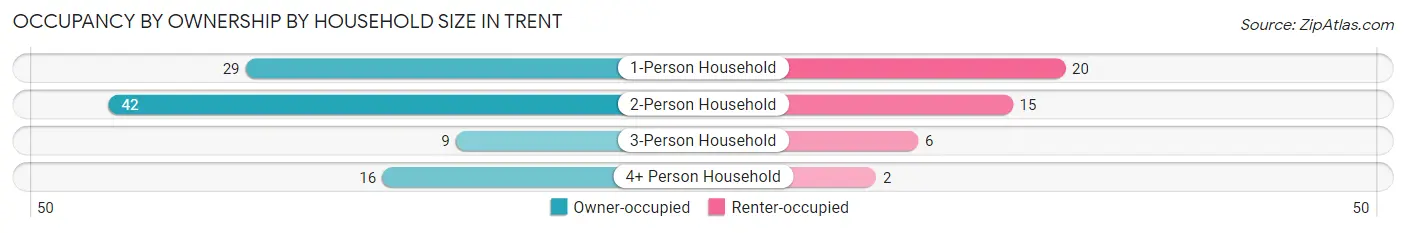
| Household Size | Owner-occupied | Renter-occupied |
| 1-Person Household | 29 (59.2%) | 20 (40.8%) |
| 2-Person Household | 42 (73.7%) | 15 (26.3%) |
| 3-Person Household | 9 (60.0%) | 6 (40.0%) |
| 4+ Person Household | 16 (88.9%) | 2 (11.1%) |
| Total Housing Units | 96 (69.1%) | 43 (30.9%) |
Occupancy by Educational Attainment in Trent
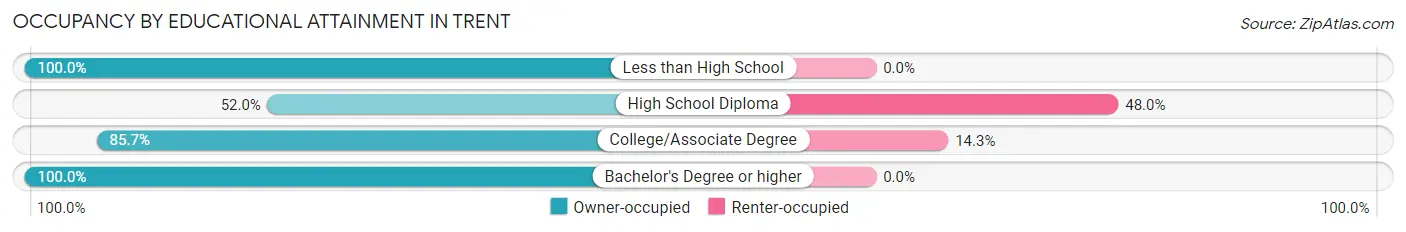
| Household Size | Owner-occupied | Renter-occupied |
| Less than High School | 4 (100.0%) | 0 (0.0%) |
| High School Diploma | 39 (52.0%) | 36 (48.0%) |
| College/Associate Degree | 42 (85.7%) | 7 (14.3%) |
| Bachelor's Degree or higher | 11 (100.0%) | 0 (0.0%) |
Occupancy by Age of Householder in Trent
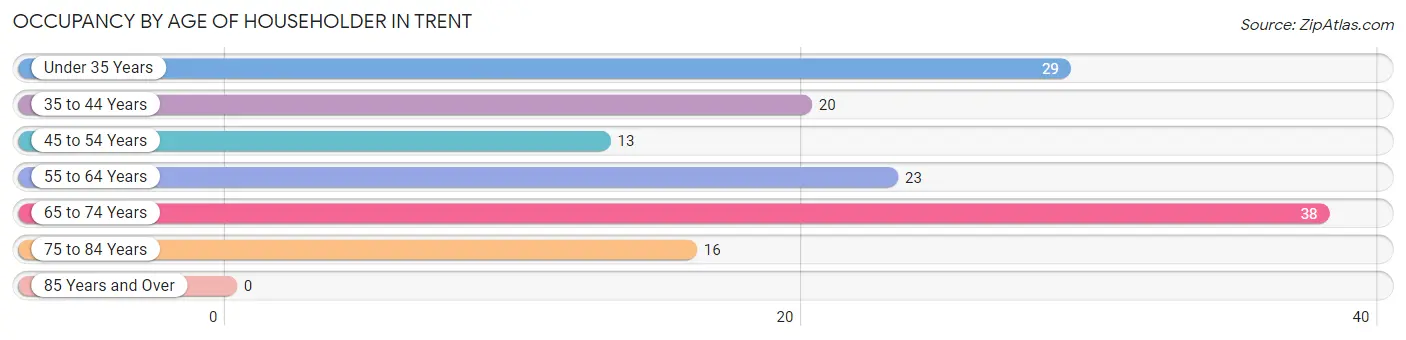
| Age Bracket | # Households | % Households |
| Under 35 Years | 29 | 20.9% |
| 35 to 44 Years | 20 | 14.4% |
| 45 to 54 Years | 13 | 9.3% |
| 55 to 64 Years | 23 | 16.6% |
| 65 to 74 Years | 38 | 27.3% |
| 75 to 84 Years | 16 | 11.5% |
| 85 Years and Over | 0 | 0.0% |
| Total | 139 | 100.0% |
Housing Finances in Trent
Median Income by Occupancy in Trent
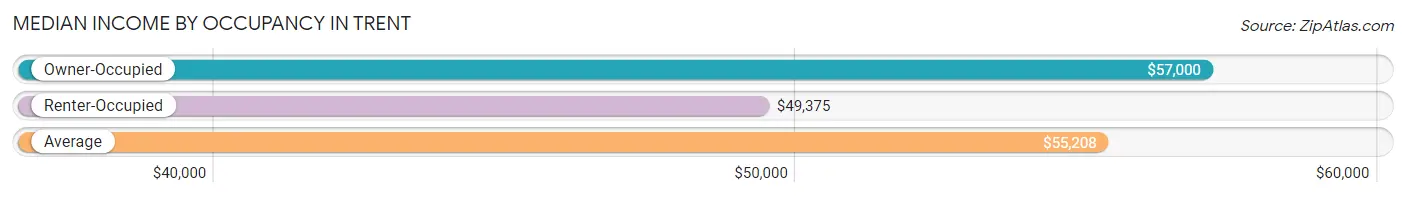
| Occupancy Type | # Households | Median Income |
| Owner-Occupied | 96 (69.1%) | $57,000 |
| Renter-Occupied | 43 (30.9%) | $49,375 |
| Average | 139 (100.0%) | $55,208 |
Occupancy by Householder Income Bracket in Trent
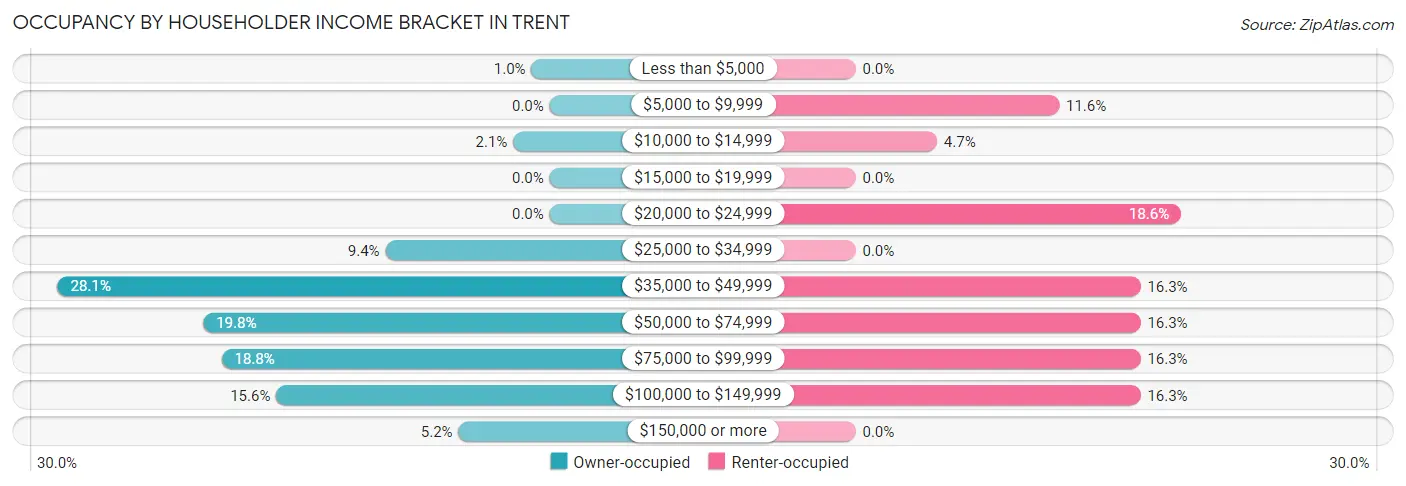
| Income Bracket | Owner-occupied | Renter-occupied |
| Less than $5,000 | 1 (1.0%) | 0 (0.0%) |
| $5,000 to $9,999 | 0 (0.0%) | 5 (11.6%) |
| $10,000 to $14,999 | 2 (2.1%) | 2 (4.6%) |
| $15,000 to $19,999 | 0 (0.0%) | 0 (0.0%) |
| $20,000 to $24,999 | 0 (0.0%) | 8 (18.6%) |
| $25,000 to $34,999 | 9 (9.4%) | 0 (0.0%) |
| $35,000 to $49,999 | 27 (28.1%) | 7 (16.3%) |
| $50,000 to $74,999 | 19 (19.8%) | 7 (16.3%) |
| $75,000 to $99,999 | 18 (18.8%) | 7 (16.3%) |
| $100,000 to $149,999 | 15 (15.6%) | 7 (16.3%) |
| $150,000 or more | 5 (5.2%) | 0 (0.0%) |
| Total | 96 (100.0%) | 43 (100.0%) |
Monthly Housing Cost Tiers in Trent
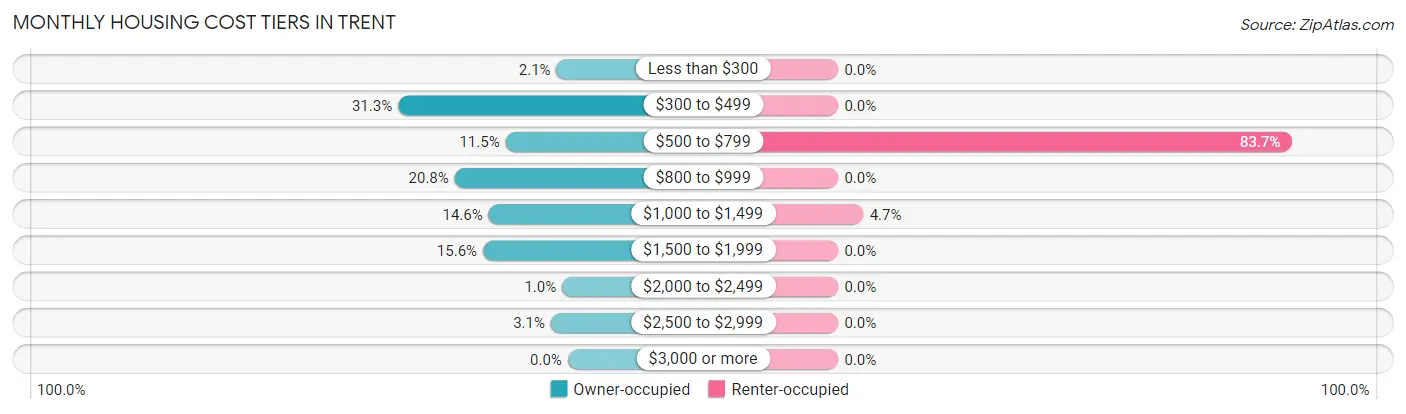
| Monthly Cost | Owner-occupied | Renter-occupied |
| Less than $300 | 2 (2.1%) | 0 (0.0%) |
| $300 to $499 | 30 (31.2%) | 0 (0.0%) |
| $500 to $799 | 11 (11.5%) | 36 (83.7%) |
| $800 to $999 | 20 (20.8%) | 0 (0.0%) |
| $1,000 to $1,499 | 14 (14.6%) | 2 (4.6%) |
| $1,500 to $1,999 | 15 (15.6%) | 0 (0.0%) |
| $2,000 to $2,499 | 1 (1.0%) | 0 (0.0%) |
| $2,500 to $2,999 | 3 (3.1%) | 0 (0.0%) |
| $3,000 or more | 0 (0.0%) | 0 (0.0%) |
| Total | 96 (100.0%) | 43 (100.0%) |
Physical Housing Characteristics in Trent
Housing Structures in Trent
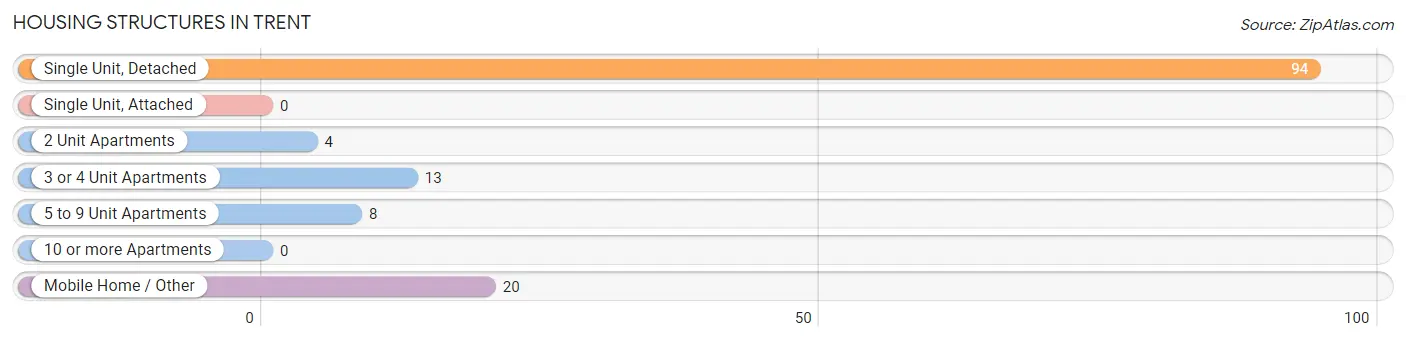
| Structure Type | # Housing Units | % Housing Units |
| Single Unit, Detached | 94 | 67.6% |
| Single Unit, Attached | 0 | 0.0% |
| 2 Unit Apartments | 4 | 2.9% |
| 3 or 4 Unit Apartments | 13 | 9.3% |
| 5 to 9 Unit Apartments | 8 | 5.8% |
| 10 or more Apartments | 0 | 0.0% |
| Mobile Home / Other | 20 | 14.4% |
| Total | 139 | 100.0% |
Housing Structures by Occupancy in Trent
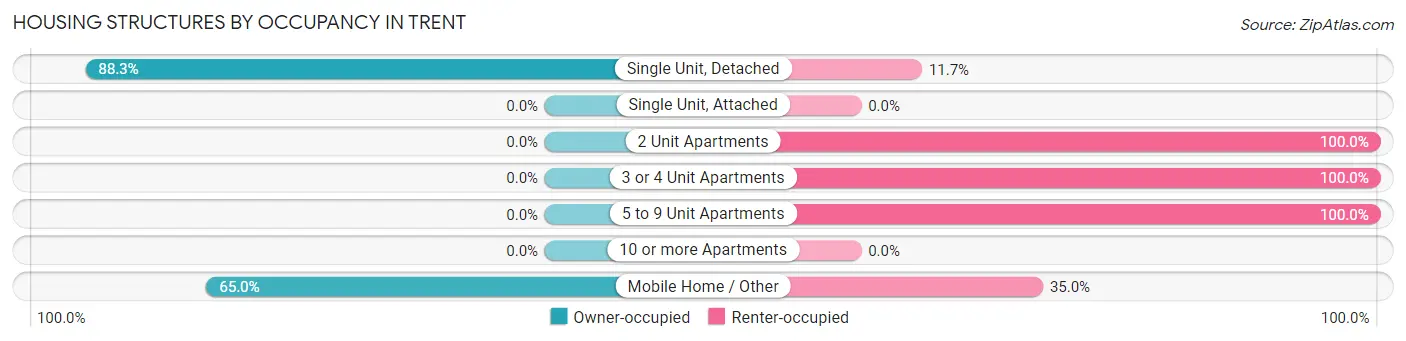
| Structure Type | Owner-occupied | Renter-occupied |
| Single Unit, Detached | 83 (88.3%) | 11 (11.7%) |
| Single Unit, Attached | 0 (0.0%) | 0 (0.0%) |
| 2 Unit Apartments | 0 (0.0%) | 4 (100.0%) |
| 3 or 4 Unit Apartments | 0 (0.0%) | 13 (100.0%) |
| 5 to 9 Unit Apartments | 0 (0.0%) | 8 (100.0%) |
| 10 or more Apartments | 0 (0.0%) | 0 (0.0%) |
| Mobile Home / Other | 13 (65.0%) | 7 (35.0%) |
| Total | 96 (69.1%) | 43 (30.9%) |
Housing Structures by Number of Rooms in Trent
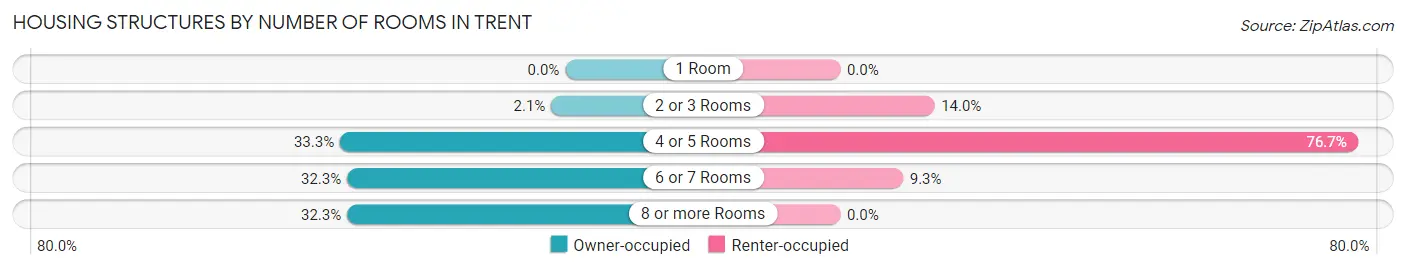
| Number of Rooms | Owner-occupied | Renter-occupied |
| 1 Room | 0 (0.0%) | 0 (0.0%) |
| 2 or 3 Rooms | 2 (2.1%) | 6 (14.0%) |
| 4 or 5 Rooms | 32 (33.3%) | 33 (76.7%) |
| 6 or 7 Rooms | 31 (32.3%) | 4 (9.3%) |
| 8 or more Rooms | 31 (32.3%) | 0 (0.0%) |
| Total | 96 (100.0%) | 43 (100.0%) |
Housing Structure by Heating Type in Trent
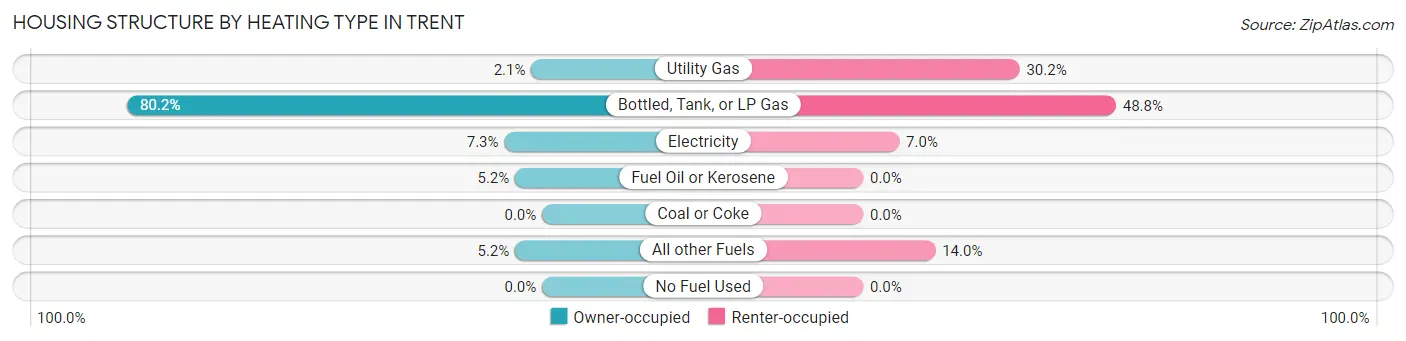
| Heating Type | Owner-occupied | Renter-occupied |
| Utility Gas | 2 (2.1%) | 13 (30.2%) |
| Bottled, Tank, or LP Gas | 77 (80.2%) | 21 (48.8%) |
| Electricity | 7 (7.3%) | 3 (7.0%) |
| Fuel Oil or Kerosene | 5 (5.2%) | 0 (0.0%) |
| Coal or Coke | 0 (0.0%) | 0 (0.0%) |
| All other Fuels | 5 (5.2%) | 6 (14.0%) |
| No Fuel Used | 0 (0.0%) | 0 (0.0%) |
| Total | 96 (100.0%) | 43 (100.0%) |
Household Vehicle Usage in Trent
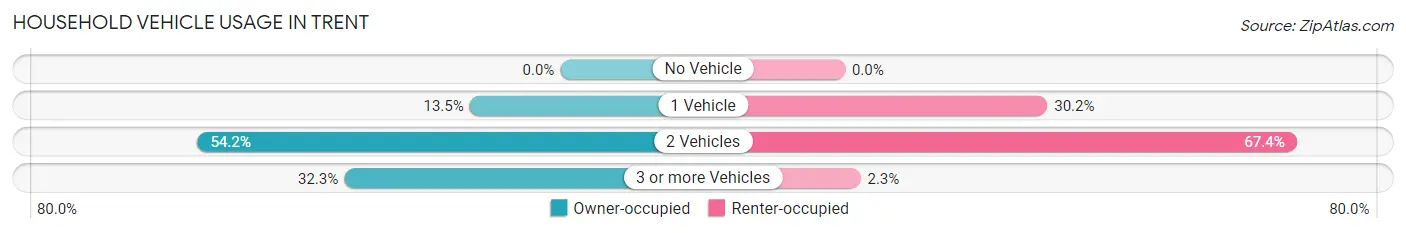
| Vehicles per Household | Owner-occupied | Renter-occupied |
| No Vehicle | 0 (0.0%) | 0 (0.0%) |
| 1 Vehicle | 13 (13.5%) | 13 (30.2%) |
| 2 Vehicles | 52 (54.2%) | 29 (67.4%) |
| 3 or more Vehicles | 31 (32.3%) | 1 (2.3%) |
| Total | 96 (100.0%) | 43 (100.0%) |
Real Estate & Mortgages in Trent
Real Estate and Mortgage Overview in Trent
| Characteristic | Without Mortgage | With Mortgage |
| Housing Units | 42 | 54 |
| Median Property Value | $110,700 | $133,300 |
| Median Household Income | $48,500 | $0 |
| Monthly Housing Costs | $442 | $0 |
| Real Estate Taxes | $1,429 | $0 |
Property Value by Mortgage Status in Trent
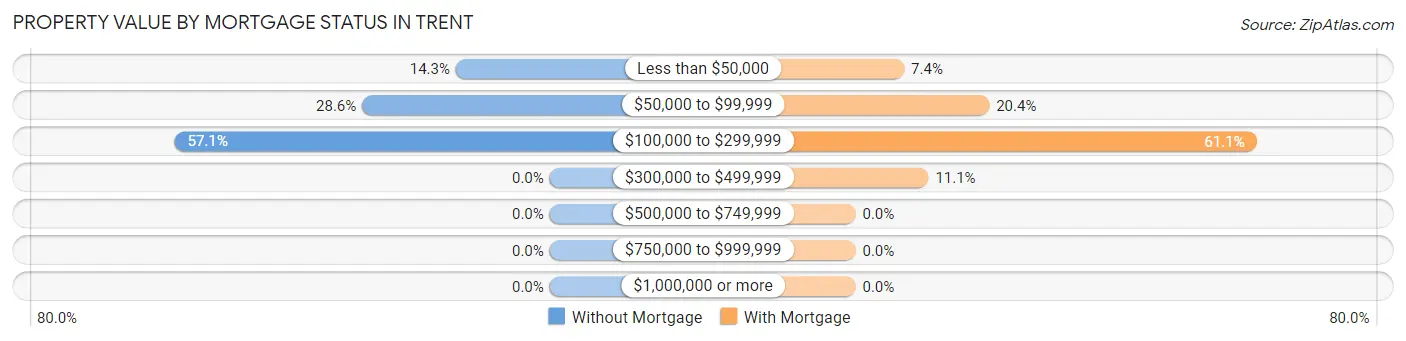
| Property Value | Without Mortgage | With Mortgage |
| Less than $50,000 | 6 (14.3%) | 4 (7.4%) |
| $50,000 to $99,999 | 12 (28.6%) | 11 (20.4%) |
| $100,000 to $299,999 | 24 (57.1%) | 33 (61.1%) |
| $300,000 to $499,999 | 0 (0.0%) | 6 (11.1%) |
| $500,000 to $749,999 | 0 (0.0%) | 0 (0.0%) |
| $750,000 to $999,999 | 0 (0.0%) | 0 (0.0%) |
| $1,000,000 or more | 0 (0.0%) | 0 (0.0%) |
| Total | 42 (100.0%) | 54 (100.0%) |
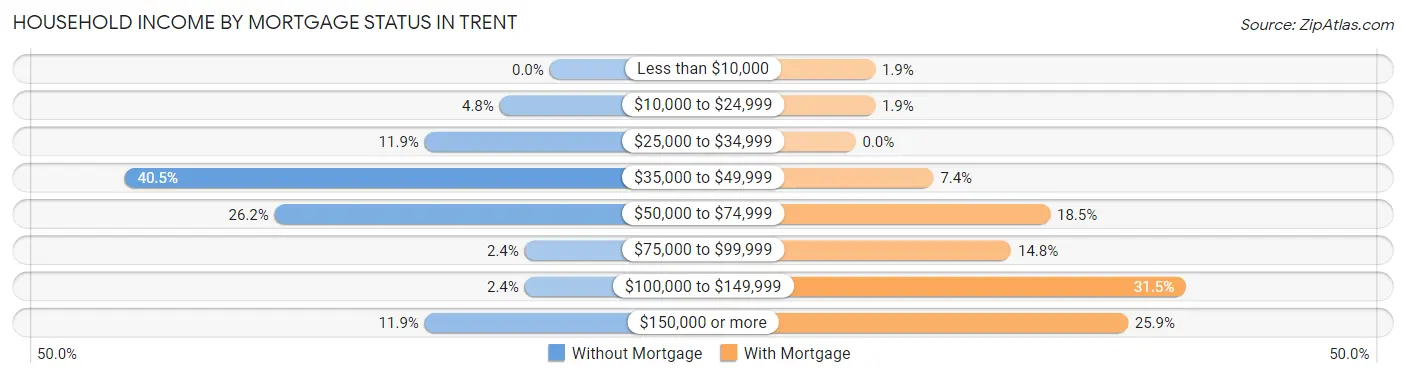
Household Income by Mortgage Status in Trent
| Household Income | Without Mortgage | With Mortgage |
| Less than $10,000 | 0 (0.0%) | 1 (1.8%) |
| $10,000 to $24,999 | 2 (4.8%) | 1 (1.8%) |
| $25,000 to $34,999 | 5 (11.9%) | 0 (0.0%) |
| $35,000 to $49,999 | 17 (40.5%) | 4 (7.4%) |
| $50,000 to $74,999 | 11 (26.2%) | 10 (18.5%) |
| $75,000 to $99,999 | 1 (2.4%) | 8 (14.8%) |
| $100,000 to $149,999 | 1 (2.4%) | 17 (31.5%) |
| $150,000 or more | 5 (11.9%) | 14 (25.9%) |
| Total | 42 (100.0%) | 54 (100.0%) |
Property Value to Household Income Ratio in Trent
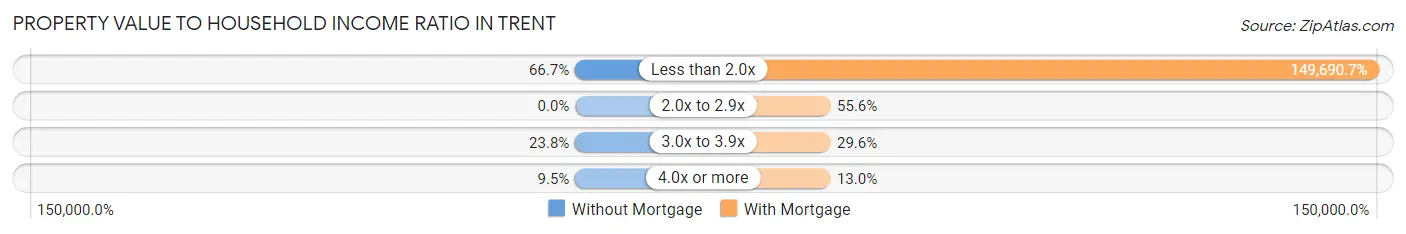
| Value-to-Income Ratio | Without Mortgage | With Mortgage |
| Less than 2.0x | 28 (66.7%) | 80,833 (149,690.7%) |
| 2.0x to 2.9x | 0 (0.0%) | 30 (55.6%) |
| 3.0x to 3.9x | 10 (23.8%) | 16 (29.6%) |
| 4.0x or more | 4 (9.5%) | 7 (13.0%) |
| Total | 42 (100.0%) | 54 (100.0%) |
Real Estate Taxes by Mortgage Status in Trent
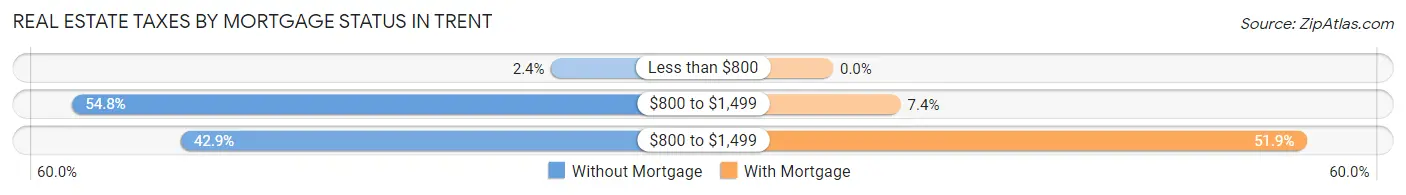
| Property Taxes | Without Mortgage | With Mortgage |
| Less than $800 | 1 (2.4%) | 0 (0.0%) |
| $800 to $1,499 | 23 (54.8%) | 4 (7.4%) |
| $800 to $1,499 | 18 (42.9%) | 28 (51.8%) |
| Total | 42 (100.0%) | 54 (100.0%) |
Health & Disability in Trent
Health Insurance Coverage by Age in Trent
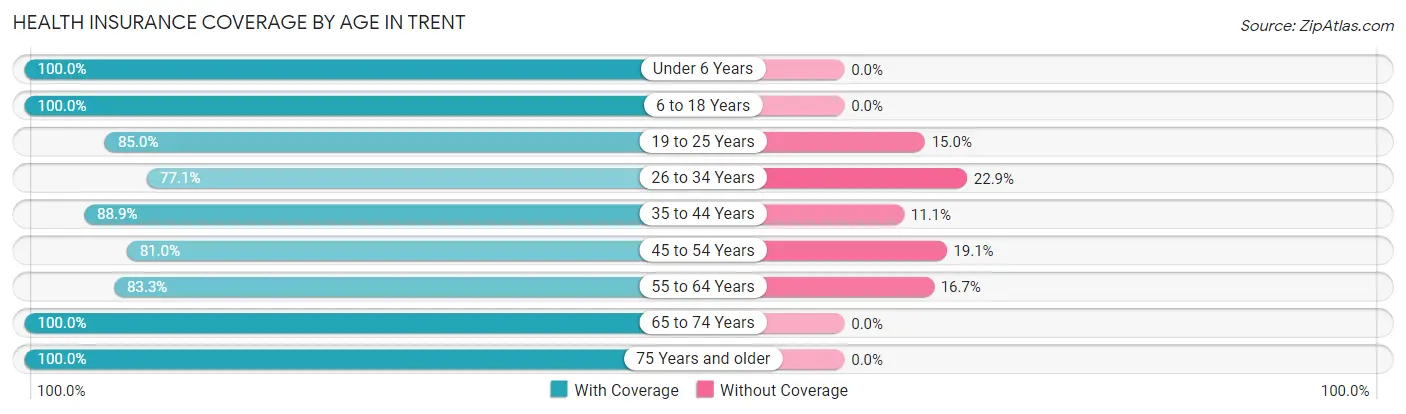
| Age Bracket | With Coverage | Without Coverage |
| Under 6 Years | 28 (100.0%) | 0 (0.0%) |
| 6 to 18 Years | 34 (100.0%) | 0 (0.0%) |
| 19 to 25 Years | 34 (85.0%) | 6 (15.0%) |
| 26 to 34 Years | 27 (77.1%) | 8 (22.9%) |
| 35 to 44 Years | 32 (88.9%) | 4 (11.1%) |
| 45 to 54 Years | 17 (80.9%) | 4 (19.1%) |
| 55 to 64 Years | 35 (83.3%) | 7 (16.7%) |
| 65 to 74 Years | 64 (100.0%) | 0 (0.0%) |
| 75 Years and older | 32 (100.0%) | 0 (0.0%) |
| Total | 303 (91.3%) | 29 (8.7%) |
Health Insurance Coverage by Citizenship Status in Trent
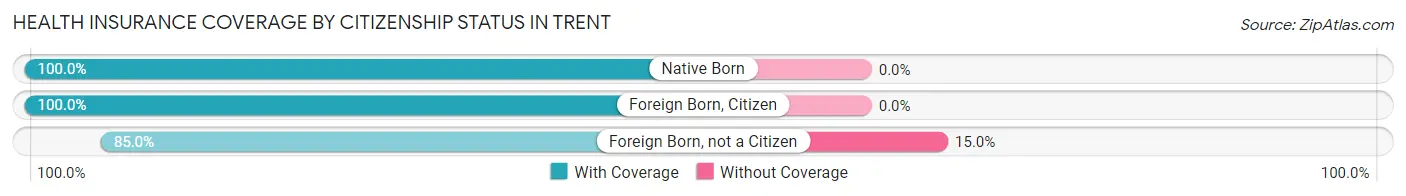
| Citizenship Status | With Coverage | Without Coverage |
| Native Born | 28 (100.0%) | 0 (0.0%) |
| Foreign Born, Citizen | 34 (100.0%) | 0 (0.0%) |
| Foreign Born, not a Citizen | 34 (85.0%) | 6 (15.0%) |
Health Insurance Coverage by Household Income in Trent
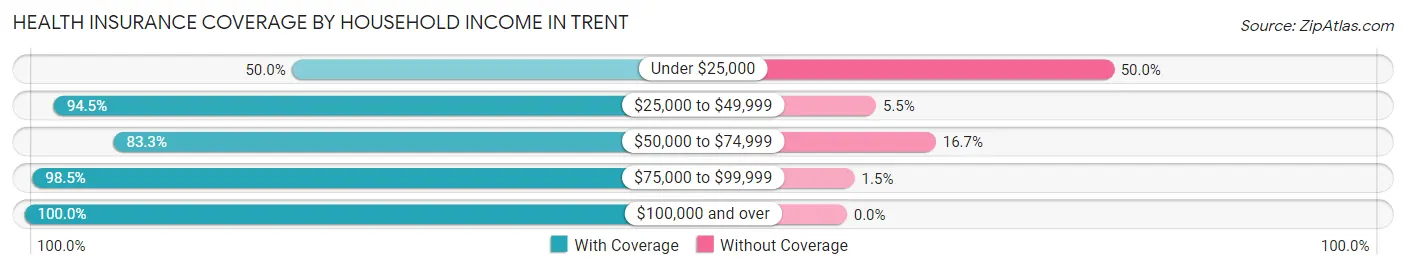
| Household Income | With Coverage | Without Coverage |
| Under $25,000 | 10 (50.0%) | 10 (50.0%) |
| $25,000 to $49,999 | 69 (94.5%) | 4 (5.5%) |
| $50,000 to $74,999 | 40 (83.3%) | 8 (16.7%) |
| $75,000 to $99,999 | 67 (98.5%) | 1 (1.5%) |
| $100,000 and over | 91 (100.0%) | 0 (0.0%) |
Public vs Private Health Insurance Coverage by Age in Trent
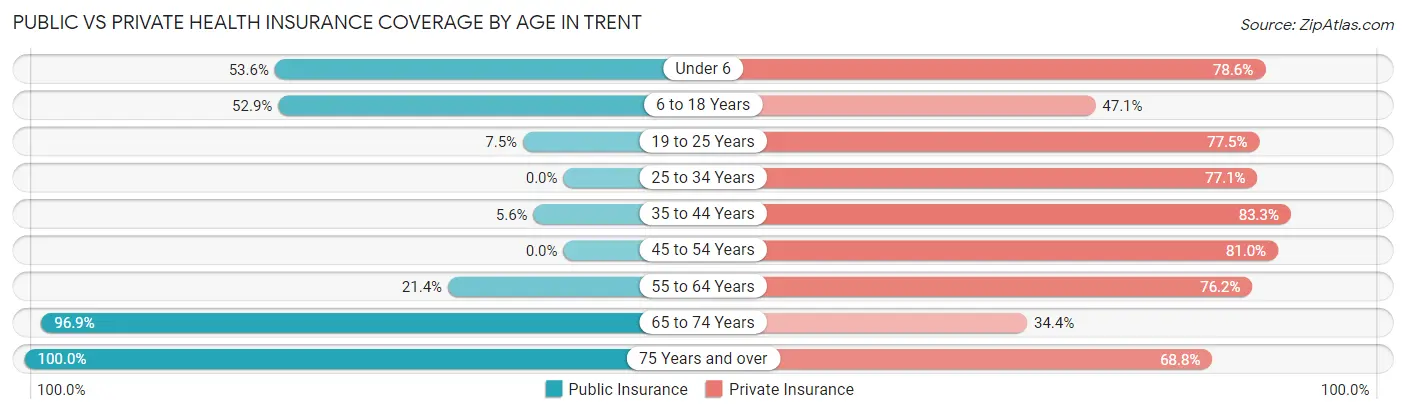
| Age Bracket | Public Insurance | Private Insurance |
| Under 6 | 15 (53.6%) | 22 (78.6%) |
| 6 to 18 Years | 18 (52.9%) | 16 (47.1%) |
| 19 to 25 Years | 3 (7.5%) | 31 (77.5%) |
| 25 to 34 Years | 0 (0.0%) | 27 (77.1%) |
| 35 to 44 Years | 2 (5.6%) | 30 (83.3%) |
| 45 to 54 Years | 0 (0.0%) | 17 (80.9%) |
| 55 to 64 Years | 9 (21.4%) | 32 (76.2%) |
| 65 to 74 Years | 62 (96.9%) | 22 (34.4%) |
| 75 Years and over | 32 (100.0%) | 22 (68.8%) |
| Total | 141 (42.5%) | 219 (66.0%) |
Disability Status by Sex by Age in Trent
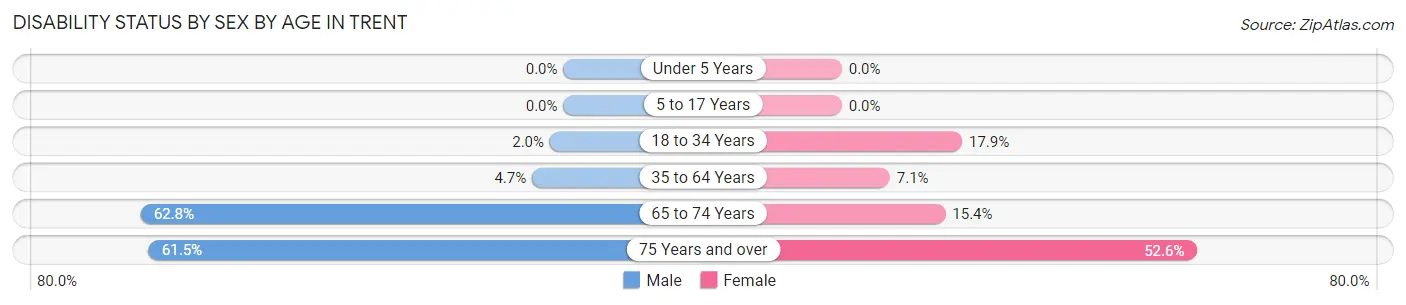
| Age Bracket | Male | Female |
| Under 5 Years | 0 (0.0%) | 0 (0.0%) |
| 5 to 17 Years | 0 (0.0%) | 0 (0.0%) |
| 18 to 34 Years | 1 (2.0%) | 5 (17.9%) |
| 35 to 64 Years | 2 (4.6%) | 4 (7.1%) |
| 65 to 74 Years | 32 (62.7%) | 2 (15.4%) |
| 75 Years and over | 8 (61.5%) | 10 (52.6%) |
Disability Class by Sex by Age in Trent
Disability Class: Hearing Difficulty
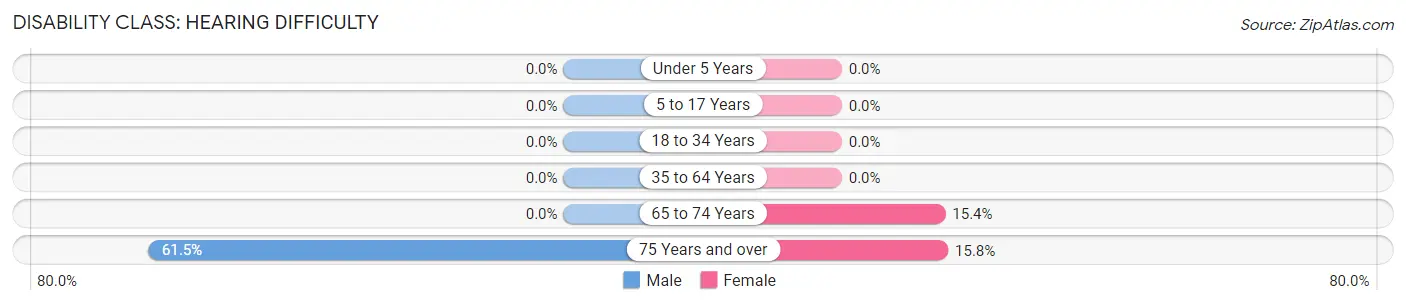
| Age Bracket | Male | Female |
| Under 5 Years | 0 (0.0%) | 0 (0.0%) |
| 5 to 17 Years | 0 (0.0%) | 0 (0.0%) |
| 18 to 34 Years | 0 (0.0%) | 0 (0.0%) |
| 35 to 64 Years | 0 (0.0%) | 0 (0.0%) |
| 65 to 74 Years | 0 (0.0%) | 2 (15.4%) |
| 75 Years and over | 8 (61.5%) | 3 (15.8%) |
Disability Class: Vision Difficulty
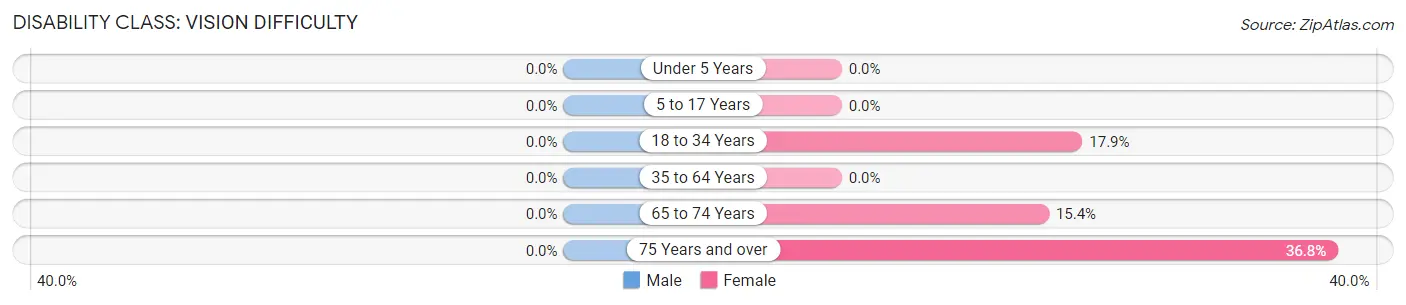
| Age Bracket | Male | Female |
| Under 5 Years | 0 (0.0%) | 0 (0.0%) |
| 5 to 17 Years | 0 (0.0%) | 0 (0.0%) |
| 18 to 34 Years | 0 (0.0%) | 5 (17.9%) |
| 35 to 64 Years | 0 (0.0%) | 0 (0.0%) |
| 65 to 74 Years | 0 (0.0%) | 2 (15.4%) |
| 75 Years and over | 0 (0.0%) | 7 (36.8%) |
Disability Class: Cognitive Difficulty
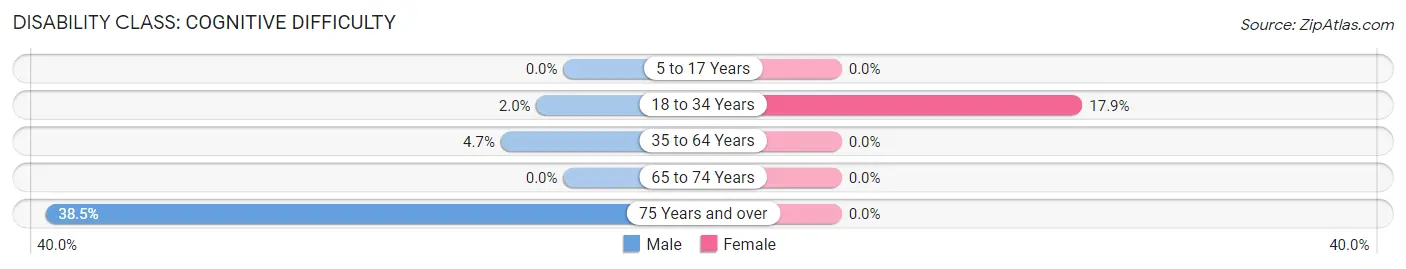
| Age Bracket | Male | Female |
| 5 to 17 Years | 0 (0.0%) | 0 (0.0%) |
| 18 to 34 Years | 1 (2.0%) | 5 (17.9%) |
| 35 to 64 Years | 2 (4.6%) | 0 (0.0%) |
| 65 to 74 Years | 0 (0.0%) | 0 (0.0%) |
| 75 Years and over | 5 (38.5%) | 0 (0.0%) |
Disability Class: Ambulatory Difficulty
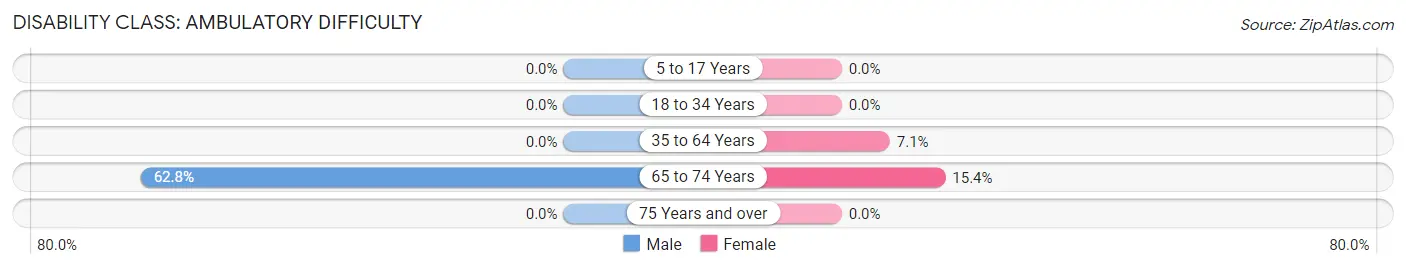
| Age Bracket | Male | Female |
| 5 to 17 Years | 0 (0.0%) | 0 (0.0%) |
| 18 to 34 Years | 0 (0.0%) | 0 (0.0%) |
| 35 to 64 Years | 0 (0.0%) | 4 (7.1%) |
| 65 to 74 Years | 32 (62.7%) | 2 (15.4%) |
| 75 Years and over | 0 (0.0%) | 0 (0.0%) |
Disability Class: Self-Care Difficulty
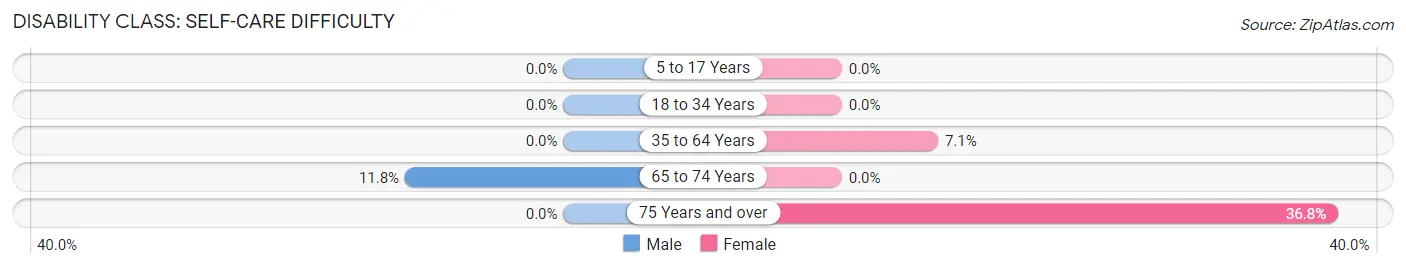
| Age Bracket | Male | Female |
| 5 to 17 Years | 0 (0.0%) | 0 (0.0%) |
| 18 to 34 Years | 0 (0.0%) | 0 (0.0%) |
| 35 to 64 Years | 0 (0.0%) | 4 (7.1%) |
| 65 to 74 Years | 6 (11.8%) | 0 (0.0%) |
| 75 Years and over | 0 (0.0%) | 7 (36.8%) |
Technology Access in Trent
Computing Device Access in Trent
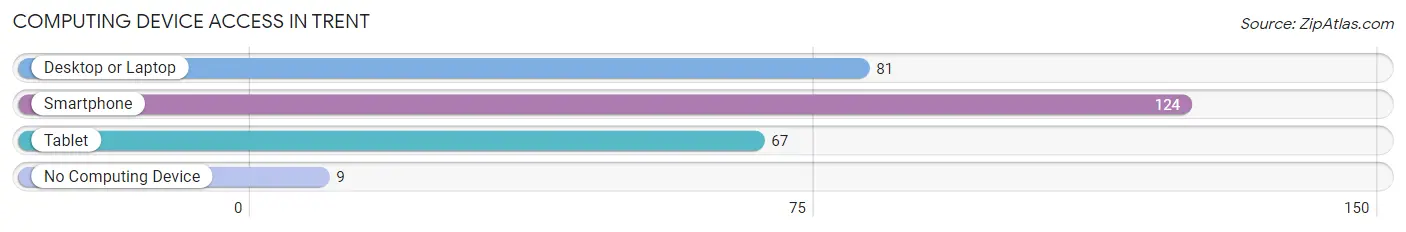
| Device Type | # Households | % Households |
| Desktop or Laptop | 81 | 58.3% |
| Smartphone | 124 | 89.2% |
| Tablet | 67 | 48.2% |
| No Computing Device | 9 | 6.5% |
| Total | 139 | 100.0% |
Internet Access in Trent
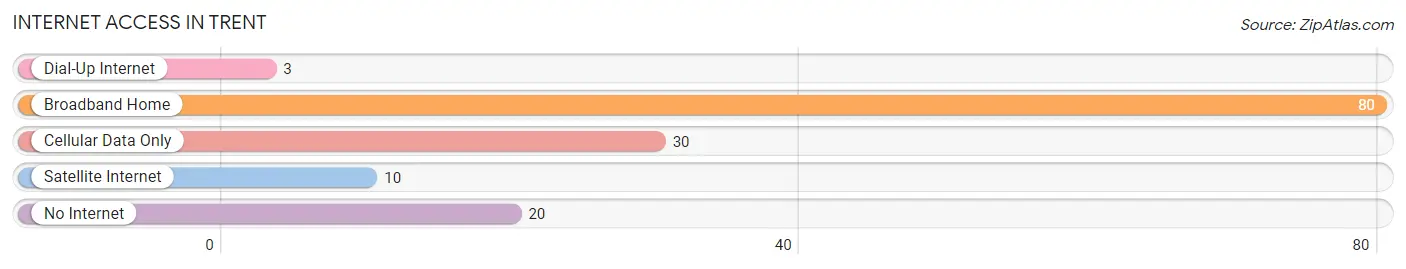
| Internet Type | # Households | % Households |
| Dial-Up Internet | 3 | 2.2% |
| Broadband Home | 80 | 57.6% |
| Cellular Data Only | 30 | 21.6% |
| Satellite Internet | 10 | 7.2% |
| No Internet | 20 | 14.4% |
| Total | 139 | 100.0% |
Trent Summary
Trent is a small town located in the southeastern corner of South Dakota. It is situated in the rolling hills of the Missouri River Valley, and is surrounded by the vast prairies of the Great Plains. The town has a population of just over 500 people, and is the county seat of Hutchinson County.
History
Trent was founded in 1883 by a group of settlers from Wisconsin. The town was named after the nearby Trent Creek, which was named after a local Native American chief. The town was originally a farming community, and the settlers quickly established a post office, a school, and a church.
In the early 1900s, Trent began to experience a period of growth. The town was connected to the railroad in 1906, and the population began to increase. The town also became a center for the local agricultural industry, and several businesses were established.
In the 1950s, Trent began to experience a decline in population. Many of the town’s businesses closed, and the population dropped to just over 400 people. However, in recent years, the town has seen a resurgence in population and economic activity.
Geography
Trent is located in the southeastern corner of South Dakota, in the rolling hills of the Missouri River Valley. The town is situated at an elevation of 1,845 feet above sea level. The town is surrounded by the vast prairies of the Great Plains, and is located approximately 50 miles from the state capital of Pierre.
The climate in Trent is generally mild, with hot summers and cold winters. The average annual temperature is around 50 degrees Fahrenheit, and the average annual precipitation is around 20 inches.
Economy
Trent’s economy is largely based on agriculture. The town is home to several farms, and the surrounding area is used for growing corn, wheat, and soybeans. The town is also home to several small businesses, including a grocery store, a hardware store, and a restaurant.
The town is also home to a small manufacturing plant, which produces agricultural equipment. The plant employs around 50 people, and is one of the town’s largest employers.
Demographics
As of the 2010 census, Trent had a population of 514 people. The town is predominantly white, with around 95% of the population identifying as such. The median household income is around $40,000, and the median home value is around $90,000.
The town is served by the Trent School District, which consists of one elementary school, one middle school, and one high school. The town is also home to a small library, and several churches.
Trent is a small town with a rich history and a bright future. The town is surrounded by the vast prairies of the Great Plains, and is home to a diverse population and a thriving economy. The town is a great place to live, work, and raise a family.
Common Questions
What is Per Capita Income in Trent?
Per Capita income in Trent is $32,354.
What is the Median Family Income in Trent?
Median Family Income in Trent is $73,750.
What is the Median Household income in Trent?
Median Household Income in Trent is $55,208.
What is Income or Wage Gap in Trent?
Income or Wage Gap in Trent is 37.2%.
Women in Trent earn 62.8 cents for every dollar earned by a man.
What is Inequality or Gini Index in Trent?
Inequality or Gini Index in Trent is 0.34.
What is the Total Population of Trent?
Total Population of Trent is 332.
What is the Total Male Population of Trent?
Total Male Population of Trent is 190.
What is the Total Female Population of Trent?
Total Female Population of Trent is 142.
What is the Ratio of Males per 100 Females in Trent?
There are 133.80 Males per 100 Females in Trent.
What is the Ratio of Females per 100 Males in Trent?
There are 74.74 Females per 100 Males in Trent.
What is the Median Population Age in Trent?
Median Population Age in Trent is 41.7 Years.
What is the Average Family Size in Trent
Average Family Size in Trent is 2.8 People.
What is the Average Household Size in Trent
Average Household Size in Trent is 2.2 People.
How Large is the Labor Force in Trent?
There are 169 People in the Labor Forcein in Trent.
What is the Percentage of People in the Labor Force in Trent?
61.7% of People are in the Labor Force in Trent.
What is the Unemployment Rate in Trent?
Unemployment Rate in Trent is 1.8%.