Beresford, SD Map & Demographics
Beresford Map
Beresford Overview
$33,094
PER CAPITA INCOME
$81,667
AVG FAMILY INCOME
$71,343
AVG HOUSEHOLD INCOME
28.4%
WAGE / INCOME GAP [ % ]
71.6¢/ $1
WAGE / INCOME GAP [ $ ]
0.33
INEQUALITY / GINI INDEX
2,419
TOTAL POPULATION
1,225
MALE POPULATION
1,194
FEMALE POPULATION
102.60
MALES / 100 FEMALES
97.47
FEMALES / 100 MALES
37.6
MEDIAN AGE
3.0
AVG FAMILY SIZE
2.5
AVG HOUSEHOLD SIZE
1,313
LABOR FORCE [ PEOPLE ]
72.8%
PERCENT IN LABOR FORCE
4.9%
UNEMPLOYMENT RATE
Beresford Zip Codes
Beresford Area Codes
Income in Beresford
Income Overview in Beresford
Per Capita Income in Beresford is $33,094, while median incomes of families and households are $81,667 and $71,343 respectively.
| Characteristic | Number | Measure |
| Per Capita Income | 2,419 | $33,094 |
| Median Family Income | 654 | $81,667 |
| Mean Family Income | 654 | $91,822 |
| Median Household Income | 962 | $71,343 |
| Mean Household Income | 962 | $82,647 |
| Income Deficit | 654 | $0 |
| Wage / Income Gap (%) | 2,419 | 28.40% |
| Wage / Income Gap ($) | 2,419 | 71.60¢ per $1 |
| Gini / Inequality Index | 2,419 | 0.33 |
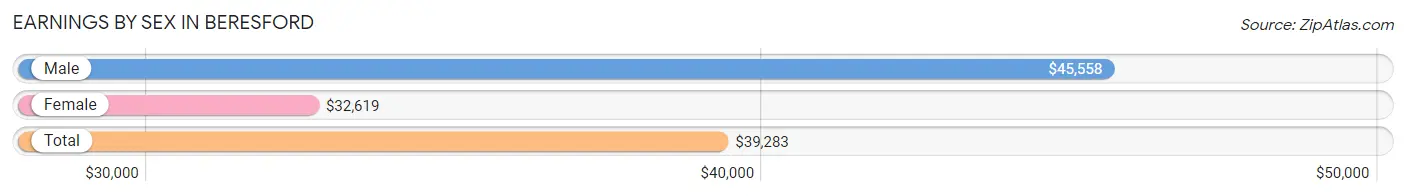
Earnings by Sex in Beresford
Average Earnings in Beresford are $39,283, $45,558 for men and $32,619 for women, a difference of 28.4%.
| Sex | Number | Average Earnings |
| Male | 721 (53.7%) | $45,558 |
| Female | 622 (46.3%) | $32,619 |
| Total | 1,343 (100.0%) | $39,283 |
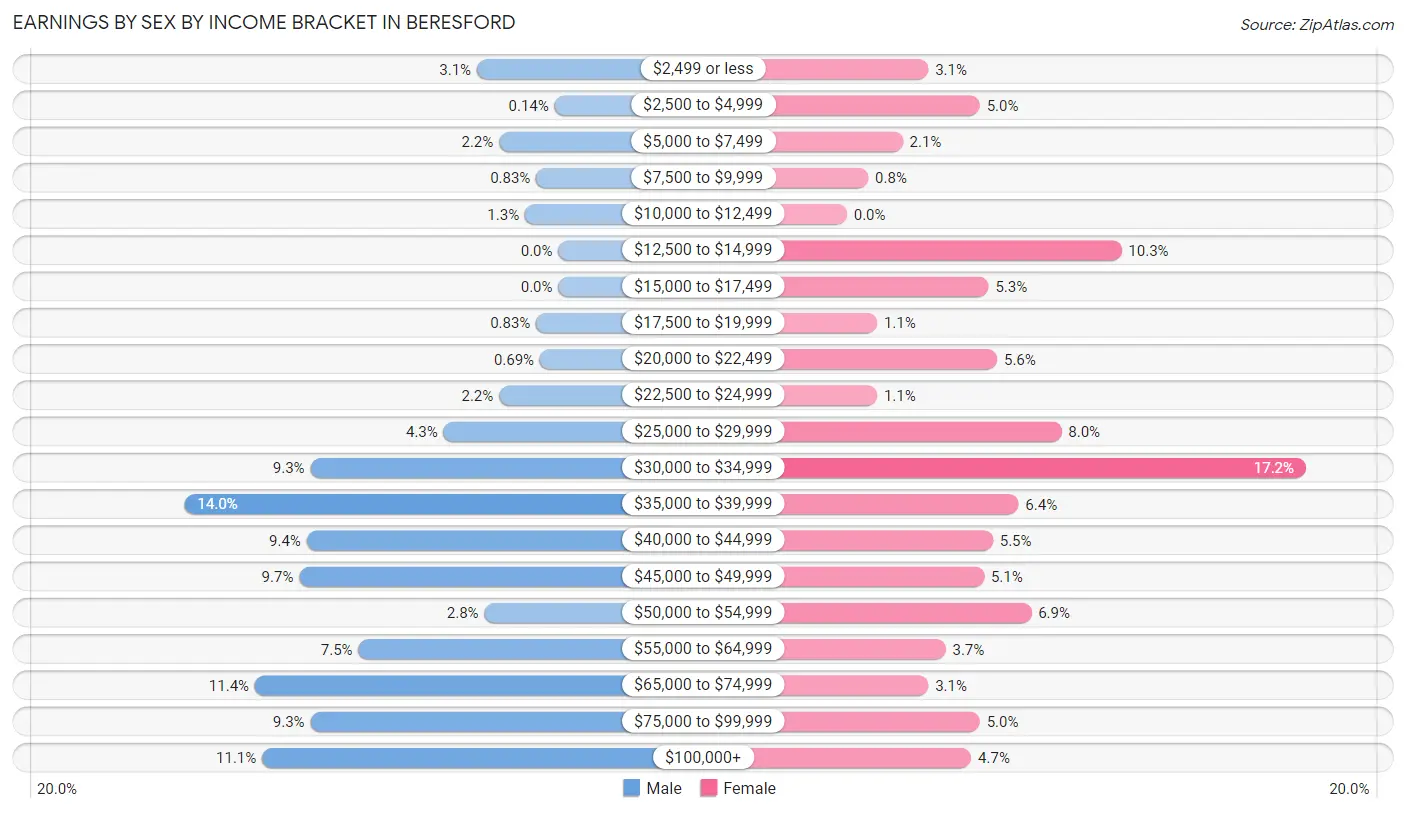
Earnings by Sex by Income Bracket in Beresford
The most common earnings brackets in Beresford are $35,000 to $39,999 for men (101 | 14.0%) and $30,000 to $34,999 for women (107 | 17.2%).
| Income | Male | Female |
| $2,499 or less | 22 (3.0%) | 19 (3.0%) |
| $2,500 to $4,999 | 1 (0.1%) | 31 (5.0%) |
| $5,000 to $7,499 | 16 (2.2%) | 13 (2.1%) |
| $7,500 to $9,999 | 6 (0.8%) | 5 (0.8%) |
| $10,000 to $12,499 | 9 (1.3%) | 0 (0.0%) |
| $12,500 to $14,999 | 0 (0.0%) | 64 (10.3%) |
| $15,000 to $17,499 | 0 (0.0%) | 33 (5.3%) |
| $17,500 to $19,999 | 6 (0.8%) | 7 (1.1%) |
| $20,000 to $22,499 | 5 (0.7%) | 35 (5.6%) |
| $22,500 to $24,999 | 16 (2.2%) | 7 (1.1%) |
| $25,000 to $29,999 | 31 (4.3%) | 50 (8.0%) |
| $30,000 to $34,999 | 67 (9.3%) | 107 (17.2%) |
| $35,000 to $39,999 | 101 (14.0%) | 40 (6.4%) |
| $40,000 to $44,999 | 68 (9.4%) | 34 (5.5%) |
| $45,000 to $49,999 | 70 (9.7%) | 32 (5.1%) |
| $50,000 to $54,999 | 20 (2.8%) | 43 (6.9%) |
| $55,000 to $64,999 | 54 (7.5%) | 23 (3.7%) |
| $65,000 to $74,999 | 82 (11.4%) | 19 (3.0%) |
| $75,000 to $99,999 | 67 (9.3%) | 31 (5.0%) |
| $100,000+ | 80 (11.1%) | 29 (4.7%) |
| Total | 721 (100.0%) | 622 (100.0%) |
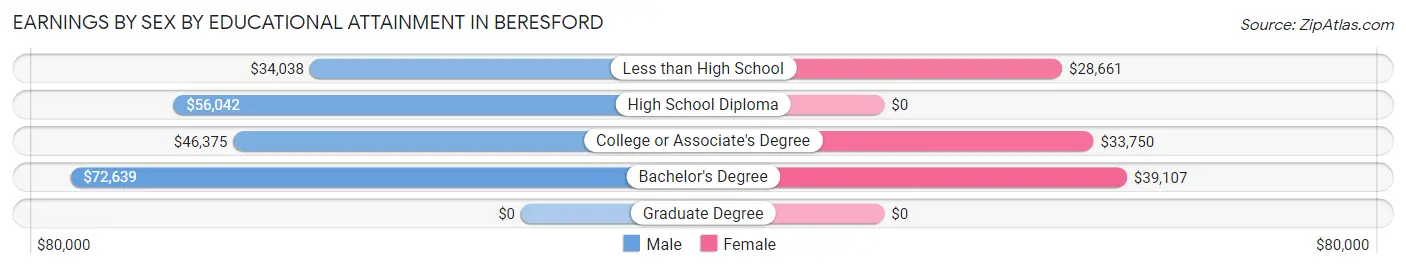
Earnings by Sex by Educational Attainment in Beresford
Average earnings in Beresford are $46,719 for men and $33,083 for women, a difference of 29.2%. Men with an educational attainment of bachelor's degree enjoy the highest average annual earnings of $72,639, while those with less than high school education earn the least with $34,038. Women with an educational attainment of bachelor's degree earn the most with the average annual earnings of $39,107, while those with less than high school education have the smallest earnings of $28,661.
| Educational Attainment | Male Income | Female Income |
| Less than High School | $34,038 | $28,661 |
| High School Diploma | $56,042 | $0 |
| College or Associate's Degree | $46,375 | $33,750 |
| Bachelor's Degree | $72,639 | $39,107 |
| Graduate Degree | - | - |
| Total | $46,719 | $33,083 |
Family Income in Beresford
Family Income Brackets in Beresford
According to the Beresford family income data, there are 156 families falling into the $100,000 to $149,999 income range, which is the most common income bracket and makes up 23.8% of all families.
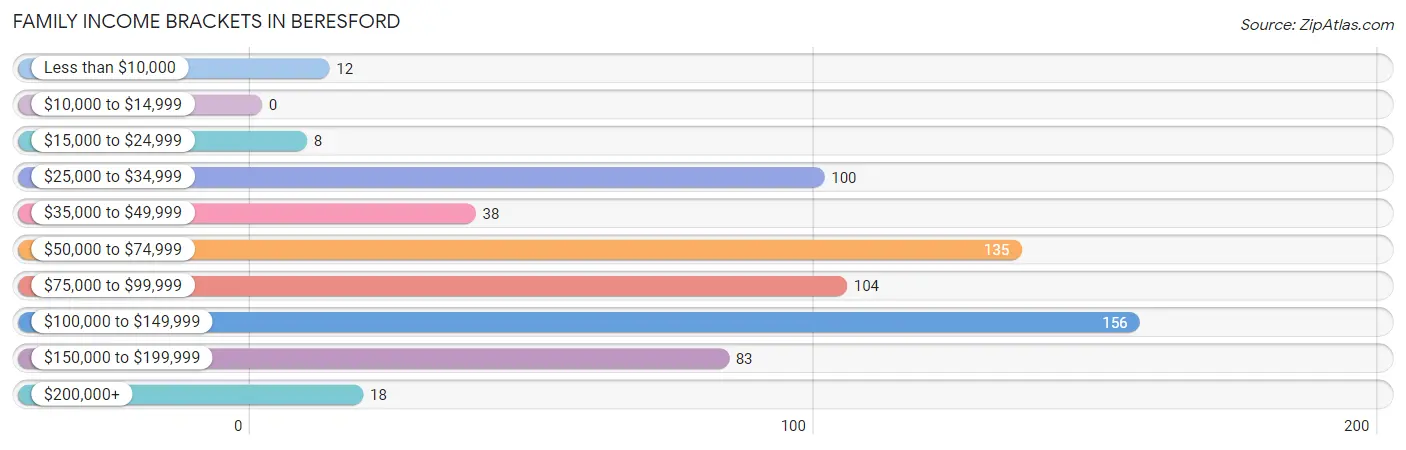
| Income Bracket | # Families | % Families |
| Less than $10,000 | 12 | 1.8% |
| $10,000 to $14,999 | 0 | 0.0% |
| $15,000 to $24,999 | 8 | 1.2% |
| $25,000 to $34,999 | 100 | 15.3% |
| $35,000 to $49,999 | 38 | 5.8% |
| $50,000 to $74,999 | 135 | 20.6% |
| $75,000 to $99,999 | 104 | 15.9% |
| $100,000 to $149,999 | 156 | 23.9% |
| $150,000 to $199,999 | 83 | 12.7% |
| $200,000+ | 18 | 2.8% |
Family Income by Famaliy Size in Beresford
5-person families (42 | 6.4%) account for the highest median family income in Beresford with $130,000 per family, while 2-person families (349 | 53.4%) have the highest median income of $34,245 per family member.
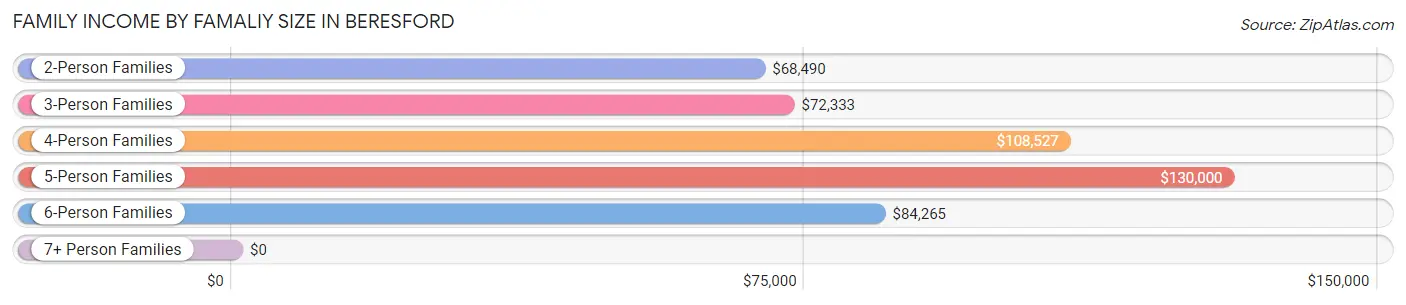
| Income Bracket | # Families | Median Income |
| 2-Person Families | 349 (53.4%) | $68,490 |
| 3-Person Families | 98 (15.0%) | $72,333 |
| 4-Person Families | 123 (18.8%) | $108,527 |
| 5-Person Families | 42 (6.4%) | $130,000 |
| 6-Person Families | 42 (6.4%) | $84,265 |
| 7+ Person Families | 0 (0.0%) | $0 |
| Total | 654 (100.0%) | $81,667 |
Family Income by Number of Earners in Beresford
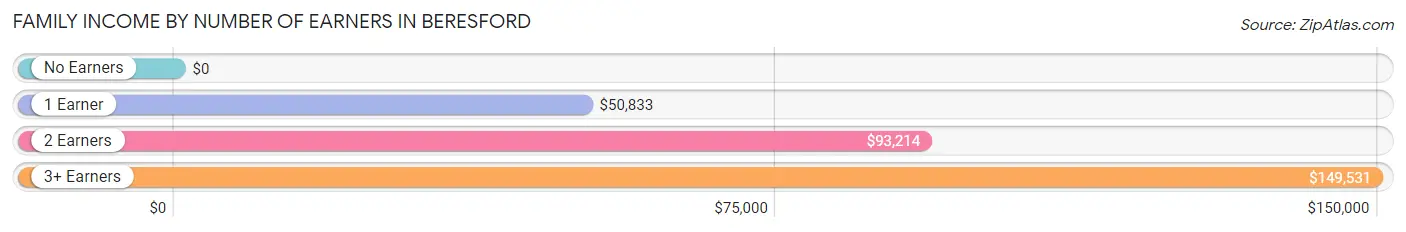
| Number of Earners | # Families | Median Income |
| No Earners | 99 (15.1%) | $0 |
| 1 Earner | 170 (26.0%) | $50,833 |
| 2 Earners | 350 (53.5%) | $93,214 |
| 3+ Earners | 35 (5.3%) | $149,531 |
| Total | 654 (100.0%) | $81,667 |
Household Income in Beresford
Household Income Brackets in Beresford
With 239 households falling in the category, the $50,000 to $74,999 income range is the most frequent in Beresford, accounting for 24.8% of all households. In contrast, only 11 households (1.1%) fall into the $10,000 to $14,999 income bracket, making it the least populous group.
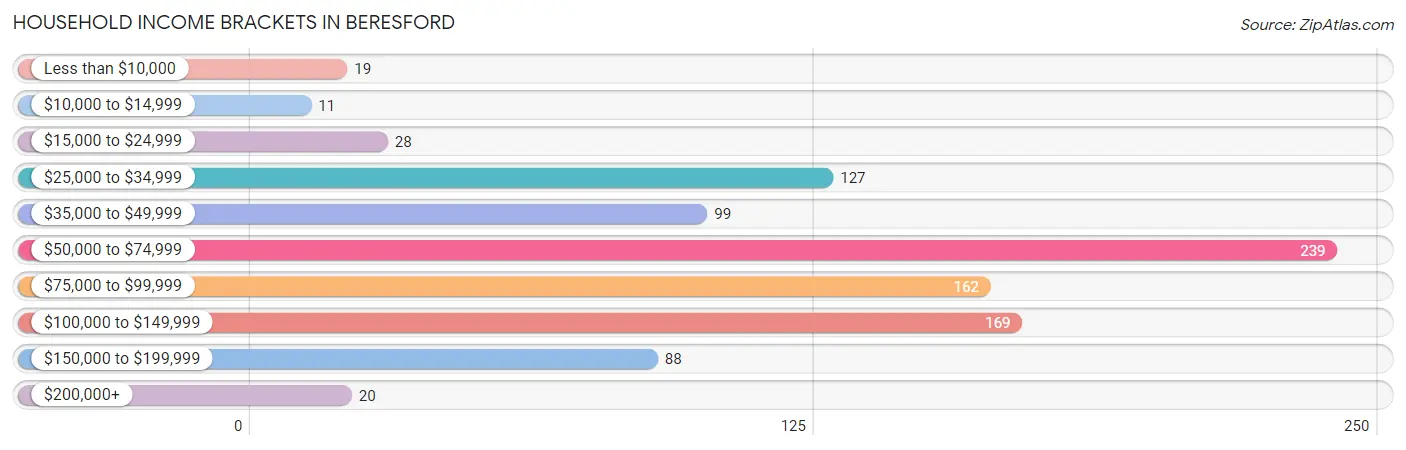
| Income Bracket | # Households | % Households |
| Less than $10,000 | 19 | 2.0% |
| $10,000 to $14,999 | 11 | 1.1% |
| $15,000 to $24,999 | 28 | 2.9% |
| $25,000 to $34,999 | 127 | 13.2% |
| $35,000 to $49,999 | 99 | 10.3% |
| $50,000 to $74,999 | 239 | 24.8% |
| $75,000 to $99,999 | 162 | 16.8% |
| $100,000 to $149,999 | 169 | 17.6% |
| $150,000 to $199,999 | 88 | 9.1% |
| $200,000+ | 20 | 2.1% |
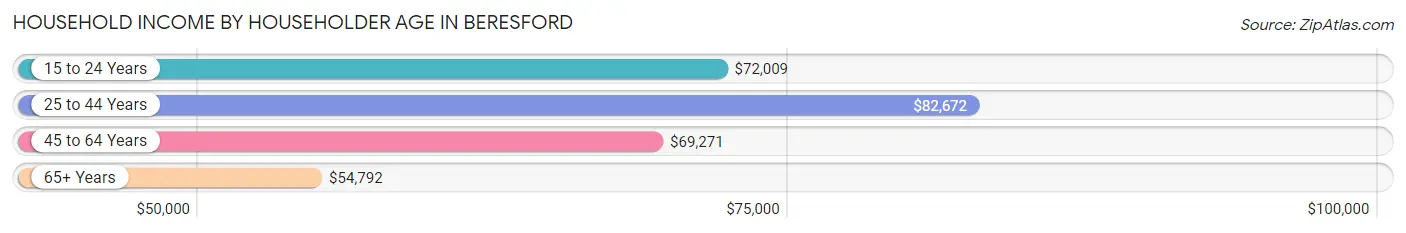
Household Income by Householder Age in Beresford
The median household income in Beresford is $71,343, with the highest median household income of $82,672 found in the 25 to 44 years age bracket for the primary householder. A total of 376 households (39.1%) fall into this category. Meanwhile, the 65+ years age bracket for the primary householder has the lowest median household income of $54,792, with 283 households (29.4%) in this group.
| Income Bracket | # Households | Median Income |
| 15 to 24 Years | 87 (9.0%) | $72,009 |
| 25 to 44 Years | 376 (39.1%) | $82,672 |
| 45 to 64 Years | 216 (22.5%) | $69,271 |
| 65+ Years | 283 (29.4%) | $54,792 |
| Total | 962 (100.0%) | $71,343 |
Poverty in Beresford
Income Below Poverty by Sex and Age in Beresford
With 3.0% poverty level for males and 5.9% for females among the residents of Beresford, 18 to 24 year old males and 75 year old and over females are the most vulnerable to poverty, with 5 males (10.4%) and 11 females (11.8%) in their respective age groups living below the poverty level.
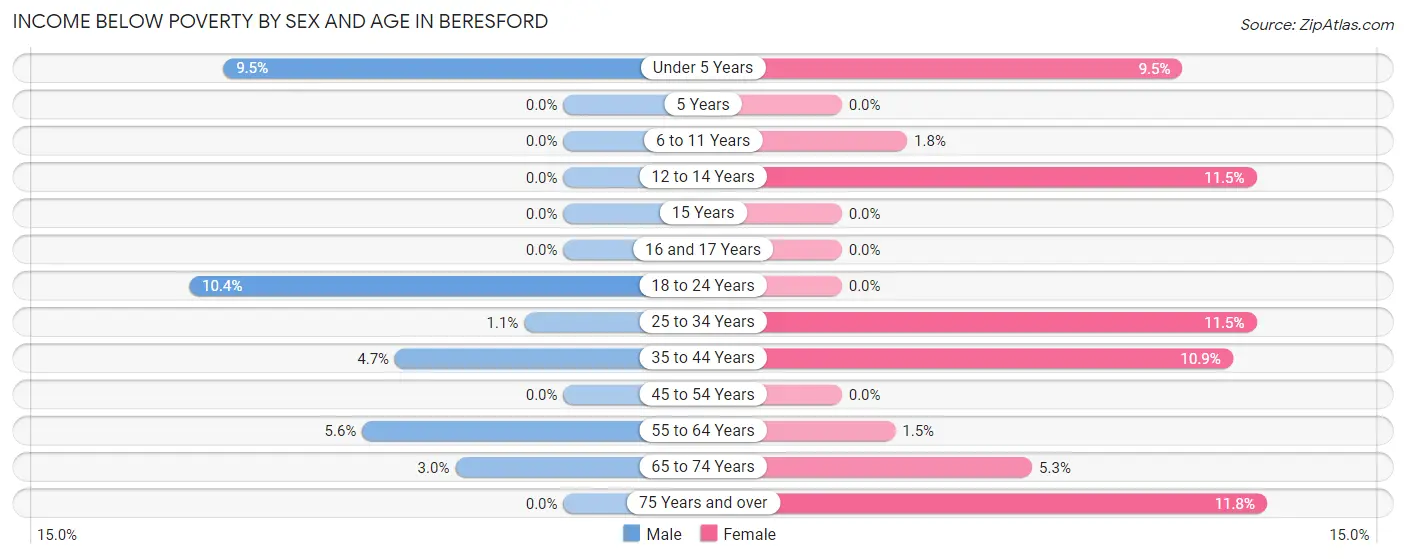
| Age Bracket | Male | Female |
| Under 5 Years | 9 (9.5%) | 11 (9.5%) |
| 5 Years | 0 (0.0%) | 0 (0.0%) |
| 6 to 11 Years | 0 (0.0%) | 3 (1.8%) |
| 12 to 14 Years | 0 (0.0%) | 3 (11.5%) |
| 15 Years | 0 (0.0%) | 0 (0.0%) |
| 16 and 17 Years | 0 (0.0%) | 0 (0.0%) |
| 18 to 24 Years | 5 (10.4%) | 0 (0.0%) |
| 25 to 34 Years | 2 (1.1%) | 18 (11.5%) |
| 35 to 44 Years | 10 (4.7%) | 16 (10.9%) |
| 45 to 54 Years | 0 (0.0%) | 0 (0.0%) |
| 55 to 64 Years | 7 (5.6%) | 2 (1.5%) |
| 65 to 74 Years | 4 (3.0%) | 7 (5.3%) |
| 75 Years and over | 0 (0.0%) | 11 (11.8%) |
| Total | 37 (3.0%) | 71 (5.9%) |
Income Above Poverty by Sex and Age in Beresford
According to the poverty statistics in Beresford, males aged 5 years and females aged 5 years are the age groups that are most secure financially, with 100.0% of males and 100.0% of females in these age groups living above the poverty line.
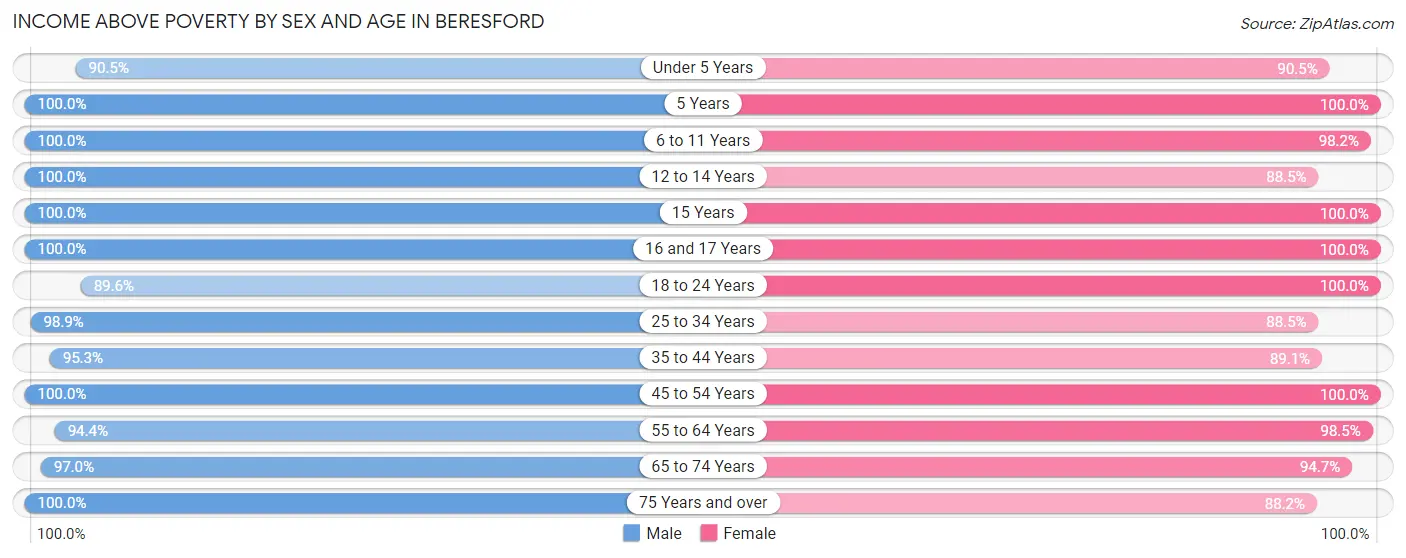
| Age Bracket | Male | Female |
| Under 5 Years | 86 (90.5%) | 105 (90.5%) |
| 5 Years | 6 (100.0%) | 11 (100.0%) |
| 6 to 11 Years | 124 (100.0%) | 162 (98.2%) |
| 12 to 14 Years | 47 (100.0%) | 23 (88.5%) |
| 15 Years | 5 (100.0%) | 17 (100.0%) |
| 16 and 17 Years | 78 (100.0%) | 10 (100.0%) |
| 18 to 24 Years | 43 (89.6%) | 99 (100.0%) |
| 25 to 34 Years | 181 (98.9%) | 138 (88.5%) |
| 35 to 44 Years | 203 (95.3%) | 131 (89.1%) |
| 45 to 54 Years | 71 (100.0%) | 88 (100.0%) |
| 55 to 64 Years | 118 (94.4%) | 132 (98.5%) |
| 65 to 74 Years | 129 (97.0%) | 125 (94.7%) |
| 75 Years and over | 93 (100.0%) | 82 (88.2%) |
| Total | 1,184 (97.0%) | 1,123 (94.1%) |
Income Below Poverty Among Married-Couple Families in Beresford
The poverty statistics for married-couple families in Beresford show that 1.9% or 11 of the total 573 families live below the poverty line. Families with 3 or 4 children have the highest poverty rate of 4.8%, comprising of 4 families. On the other hand, families with 1 or 2 children have the lowest poverty rate of 0.0%, which includes 0 families.
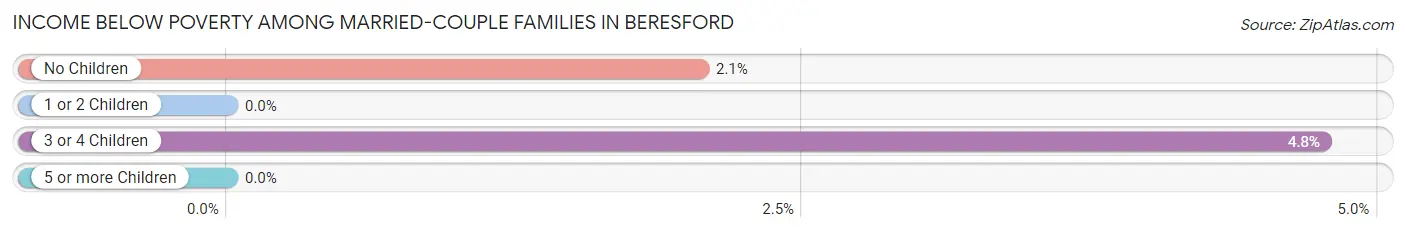
| Children | Above Poverty | Below Poverty |
| No Children | 334 (98.0%) | 7 (2.1%) |
| 1 or 2 Children | 148 (100.0%) | 0 (0.0%) |
| 3 or 4 Children | 80 (95.2%) | 4 (4.8%) |
| 5 or more Children | 0 (0.0%) | 0 (0.0%) |
| Total | 562 (98.1%) | 11 (1.9%) |
Income Below Poverty Among Single-Parent Households in Beresford
According to the poverty data in Beresford, 8.9% or 5 single-father households and 32.0% or 8 single-mother households are living below the poverty line. Among single-father households, those with 1 or 2 children have the highest poverty rate, with 5 households (10.2%) experiencing poverty. Likewise, among single-mother households, those with 1 or 2 children have the highest poverty rate, with 8 households (42.1%) falling below the poverty line.
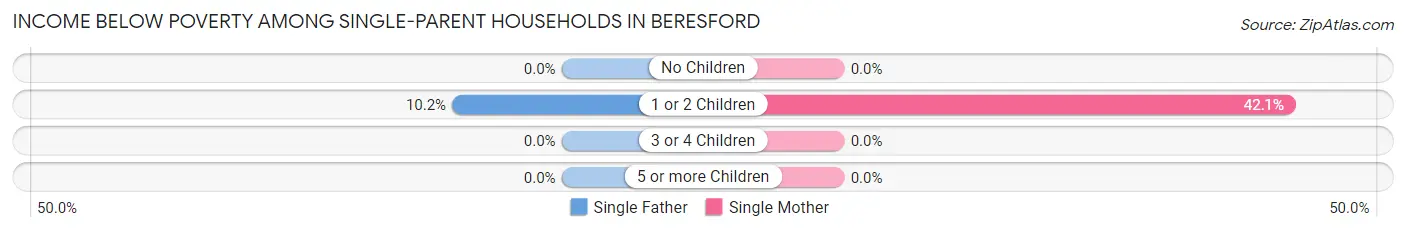
| Children | Single Father | Single Mother |
| No Children | 0 (0.0%) | 0 (0.0%) |
| 1 or 2 Children | 5 (10.2%) | 8 (42.1%) |
| 3 or 4 Children | 0 (0.0%) | 0 (0.0%) |
| 5 or more Children | 0 (0.0%) | 0 (0.0%) |
| Total | 5 (8.9%) | 8 (32.0%) |
Income Below Poverty Among Married-Couple vs Single-Parent Households in Beresford
The poverty data for Beresford shows that 11 of the married-couple family households (1.9%) and 13 of the single-parent households (16.1%) are living below the poverty level. Within the married-couple family households, those with 3 or 4 children have the highest poverty rate, with 4 households (4.8%) falling below the poverty line. Among the single-parent households, those with 1 or 2 children have the highest poverty rate, with 13 household (19.1%) living below poverty.
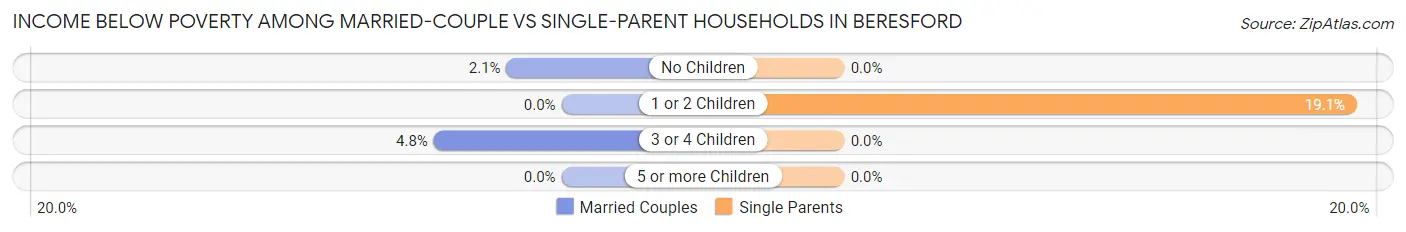
| Children | Married-Couple Families | Single-Parent Households |
| No Children | 7 (2.1%) | 0 (0.0%) |
| 1 or 2 Children | 0 (0.0%) | 13 (19.1%) |
| 3 or 4 Children | 4 (4.8%) | 0 (0.0%) |
| 5 or more Children | 0 (0.0%) | 0 (0.0%) |
| Total | 11 (1.9%) | 13 (16.1%) |
Race in Beresford
The most populous races in Beresford are White / Caucasian (2,288 | 94.6%), Hispanic or Latino (218 | 9.0%), and Two or more Races (79 | 3.3%).
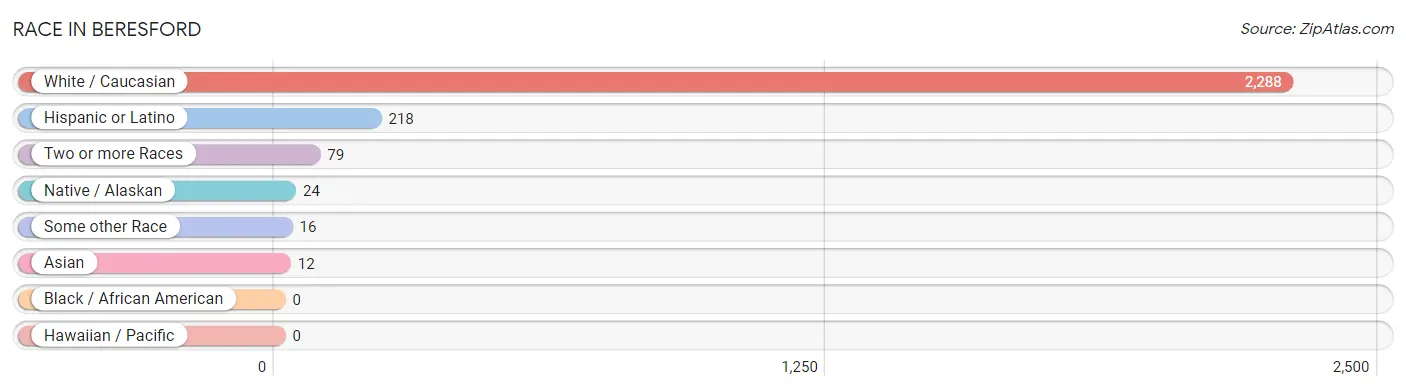
| Race | # Population | % Population |
| Asian | 12 | 0.5% |
| Black / African American | 0 | 0.0% |
| Hawaiian / Pacific | 0 | 0.0% |
| Hispanic or Latino | 218 | 9.0% |
| Native / Alaskan | 24 | 1.0% |
| White / Caucasian | 2,288 | 94.6% |
| Two or more Races | 79 | 3.3% |
| Some other Race | 16 | 0.7% |
| Total | 2,419 | 100.0% |
Ancestry in Beresford
The most populous ancestries reported in Beresford are German (685 | 28.3%), Norwegian (523 | 21.6%), Irish (180 | 7.4%), American (165 | 6.8%), and Swedish (161 | 6.7%), together accounting for 70.9% of all Beresford residents.
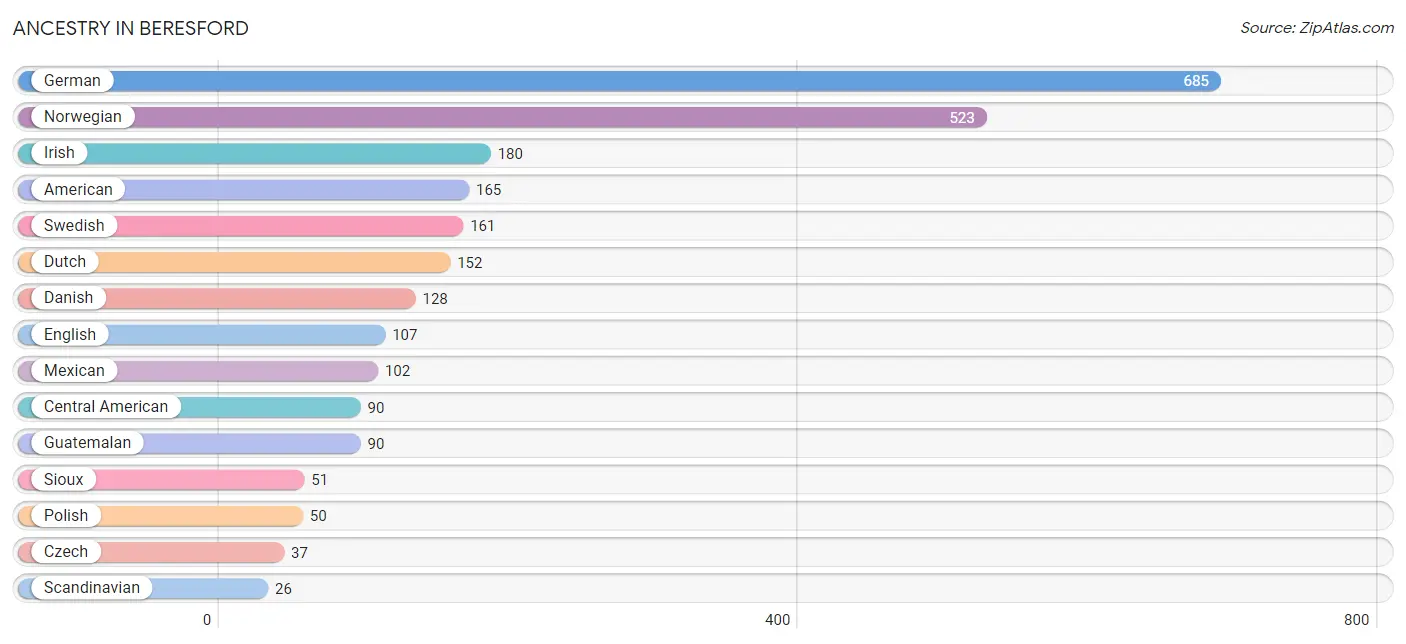
| Ancestry | # Population | % Population |
| American | 165 | 6.8% |
| British | 13 | 0.5% |
| Burmese | 3 | 0.1% |
| Central American | 90 | 3.7% |
| Czech | 37 | 1.5% |
| Czechoslovakian | 11 | 0.4% |
| Danish | 128 | 5.3% |
| Dutch | 152 | 6.3% |
| English | 107 | 4.4% |
| European | 7 | 0.3% |
| French | 22 | 0.9% |
| French Canadian | 1 | 0.0% |
| German | 685 | 28.3% |
| Guatemalan | 90 | 3.7% |
| Hungarian | 10 | 0.4% |
| Irish | 180 | 7.4% |
| Italian | 25 | 1.0% |
| Mexican | 102 | 4.2% |
| Mexican American Indian | 3 | 0.1% |
| Norwegian | 523 | 21.6% |
| Polish | 50 | 2.1% |
| Portuguese | 3 | 0.1% |
| Puerto Rican | 8 | 0.3% |
| Romanian | 10 | 0.4% |
| Scandinavian | 26 | 1.1% |
| Scottish | 6 | 0.3% |
| Sioux | 51 | 2.1% |
| Slovak | 7 | 0.3% |
| Swedish | 161 | 6.7% |
| Swiss | 13 | 0.5% |
| Thai | 12 | 0.5% |
| Welsh | 9 | 0.4% | View All 32 Rows |
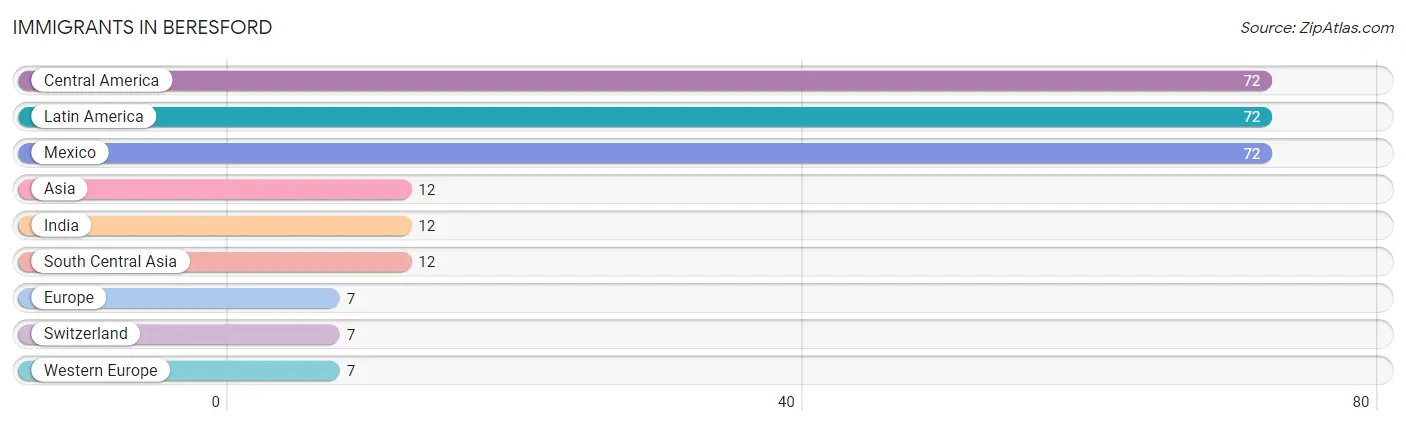
Immigrants in Beresford
The most numerous immigrant groups reported in Beresford came from Central America (72 | 3.0%), Latin America (72 | 3.0%), Mexico (72 | 3.0%), Asia (12 | 0.5%), and India (12 | 0.5%), together accounting for 9.9% of all Beresford residents.
| Immigration Origin | # Population | % Population |
| Asia | 12 | 0.5% |
| Central America | 72 | 3.0% |
| Europe | 7 | 0.3% |
| India | 12 | 0.5% |
| Latin America | 72 | 3.0% |
| Mexico | 72 | 3.0% |
| South Central Asia | 12 | 0.5% |
| Switzerland | 7 | 0.3% |
| Western Europe | 7 | 0.3% | View All 9 Rows |
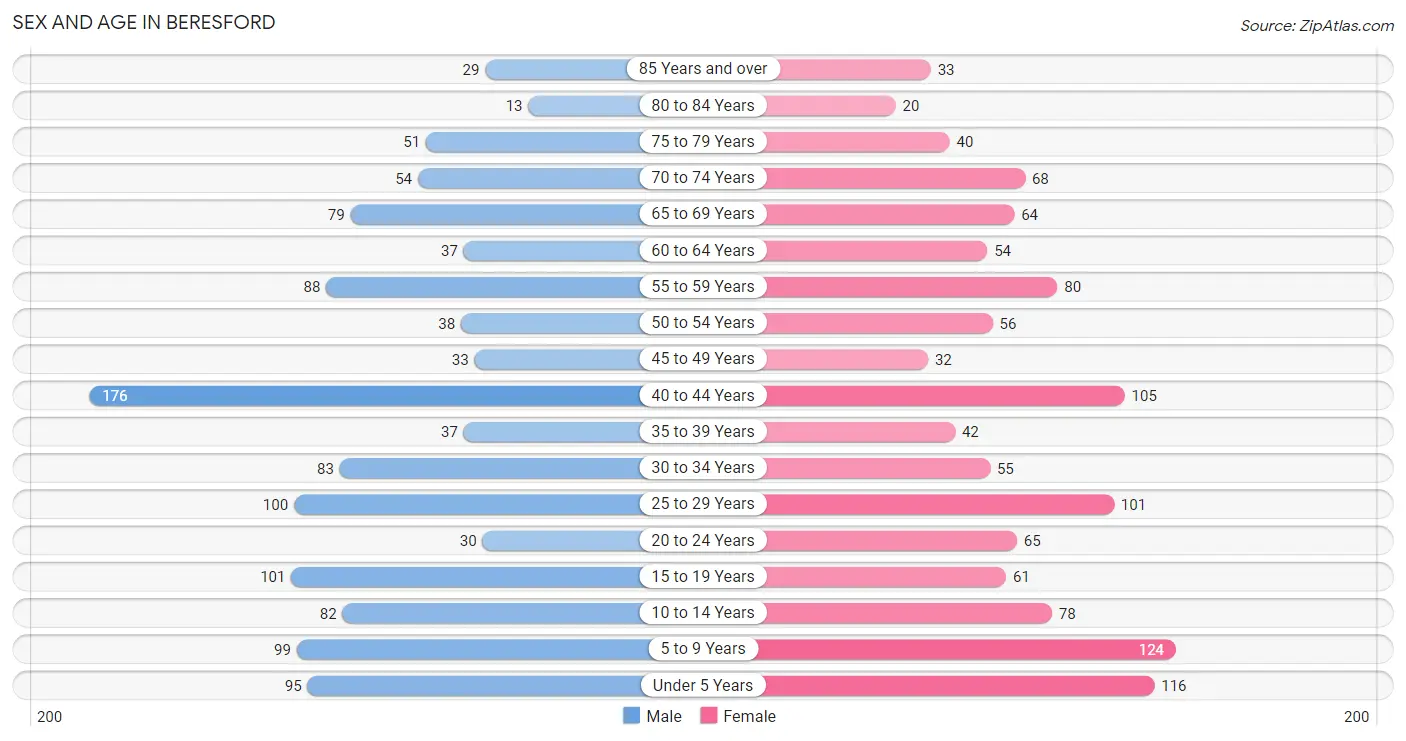
Sex and Age in Beresford
Sex and Age in Beresford
The most populous age groups in Beresford are 40 to 44 Years (176 | 14.4%) for men and 5 to 9 Years (124 | 10.4%) for women.
| Age Bracket | Male | Female |
| Under 5 Years | 95 (7.8%) | 116 (9.7%) |
| 5 to 9 Years | 99 (8.1%) | 124 (10.4%) |
| 10 to 14 Years | 82 (6.7%) | 78 (6.5%) |
| 15 to 19 Years | 101 (8.2%) | 61 (5.1%) |
| 20 to 24 Years | 30 (2.5%) | 65 (5.4%) |
| 25 to 29 Years | 100 (8.2%) | 101 (8.5%) |
| 30 to 34 Years | 83 (6.8%) | 55 (4.6%) |
| 35 to 39 Years | 37 (3.0%) | 42 (3.5%) |
| 40 to 44 Years | 176 (14.4%) | 105 (8.8%) |
| 45 to 49 Years | 33 (2.7%) | 32 (2.7%) |
| 50 to 54 Years | 38 (3.1%) | 56 (4.7%) |
| 55 to 59 Years | 88 (7.2%) | 80 (6.7%) |
| 60 to 64 Years | 37 (3.0%) | 54 (4.5%) |
| 65 to 69 Years | 79 (6.5%) | 64 (5.4%) |
| 70 to 74 Years | 54 (4.4%) | 68 (5.7%) |
| 75 to 79 Years | 51 (4.2%) | 40 (3.4%) |
| 80 to 84 Years | 13 (1.1%) | 20 (1.7%) |
| 85 Years and over | 29 (2.4%) | 33 (2.8%) |
| Total | 1,225 (100.0%) | 1,194 (100.0%) |
Families and Households in Beresford
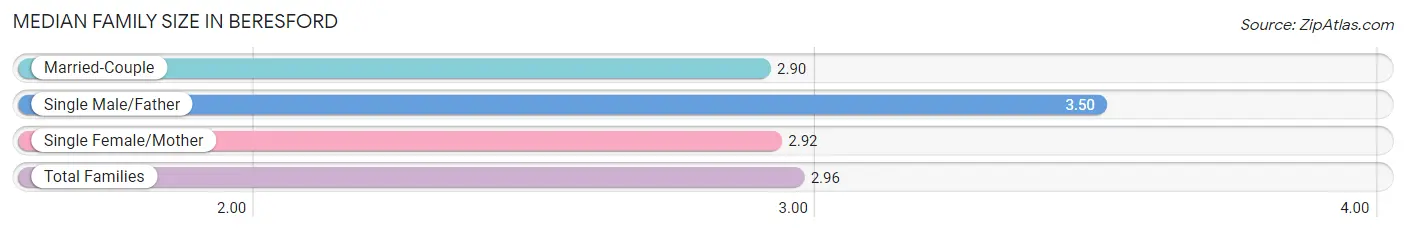
Median Family Size in Beresford
The median family size in Beresford is 2.96 persons per family, with single male/father families (56 | 8.6%) accounting for the largest median family size of 3.5 persons per family. On the other hand, married-couple families (573 | 87.6%) represent the smallest median family size with 2.90 persons per family.
| Family Type | # Families | Family Size |
| Married-Couple | 573 (87.6%) | 2.90 |
| Single Male/Father | 56 (8.6%) | 3.50 |
| Single Female/Mother | 25 (3.8%) | 2.92 |
| Total Families | 654 (100.0%) | 2.96 |
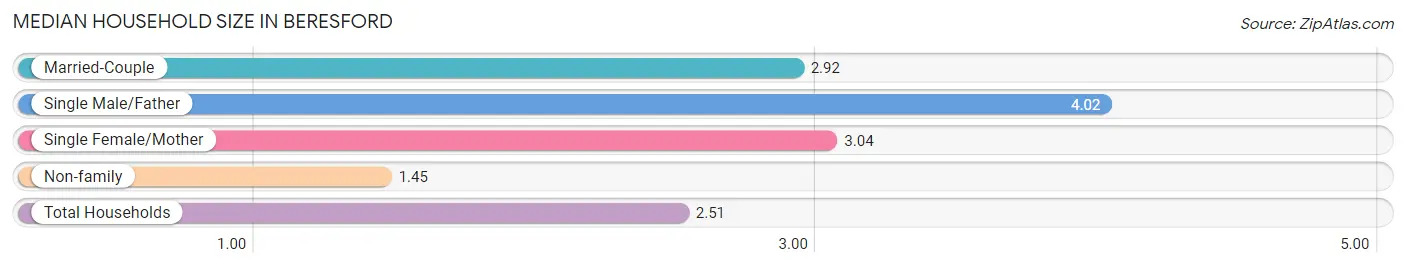
Median Household Size in Beresford
The median household size in Beresford is 2.51 persons per household, with single male/father households (56 | 5.8%) accounting for the largest median household size of 4.02 persons per household. non-family households (308 | 32.0%) represent the smallest median household size with 1.45 persons per household.
| Household Type | # Households | Household Size |
| Married-Couple | 573 (59.6%) | 2.92 |
| Single Male/Father | 56 (5.8%) | 4.02 |
| Single Female/Mother | 25 (2.6%) | 3.04 |
| Non-family | 308 (32.0%) | 1.45 |
| Total Households | 962 (100.0%) | 2.51 |
Household Size by Marriage Status in Beresford
Out of a total of 962 households in Beresford, 654 (68.0%) are family households, while 308 (32.0%) are nonfamily households. The most numerous type of family households are 2-person households, comprising 344, and the most common type of nonfamily households are 1-person households, comprising 186.
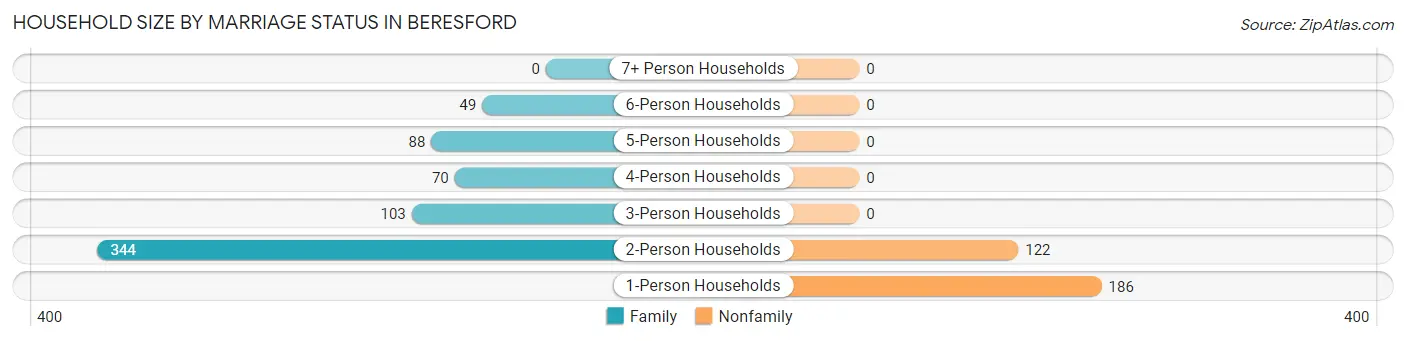
| Household Size | Family Households | Nonfamily Households |
| 1-Person Households | - | 186 (19.3%) |
| 2-Person Households | 344 (35.8%) | 122 (12.7%) |
| 3-Person Households | 103 (10.7%) | 0 (0.0%) |
| 4-Person Households | 70 (7.3%) | 0 (0.0%) |
| 5-Person Households | 88 (9.1%) | 0 (0.0%) |
| 6-Person Households | 49 (5.1%) | 0 (0.0%) |
| 7+ Person Households | 0 (0.0%) | 0 (0.0%) |
| Total | 654 (68.0%) | 308 (32.0%) |
Female Fertility in Beresford
Fertility by Age in Beresford
Average fertility rate in Beresford is 87.0 births per 1,000 women. Women in the age bracket of 15 to 19 years have the highest fertility rate with 131.0 births per 1,000 women. Women in the age bracket of 20 to 34 years acount for 58.5% of all women with births.
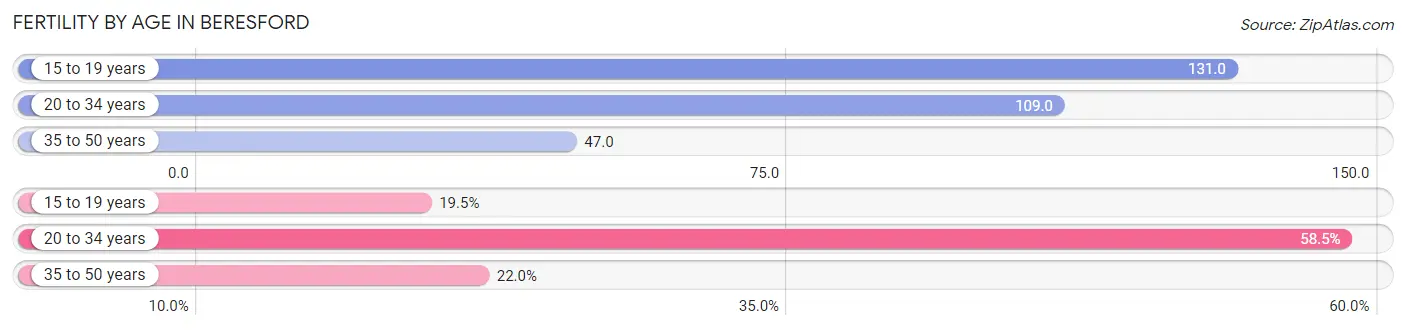
| Age Bracket | Women with Births | Births / 1,000 Women |
| 15 to 19 years | 8 (19.5%) | 131.0 |
| 20 to 34 years | 24 (58.5%) | 109.0 |
| 35 to 50 years | 9 (22.0%) | 47.0 |
| Total | 41 (100.0%) | 87.0 |
Fertility by Age by Marriage Status in Beresford
43.9% of women with births (41) in Beresford are married. The highest percentage of unmarried women with births falls into 15 to 19 years age bracket with 100.0% of them unmarried at the time of birth, while the lowest percentage of unmarried women with births belong to 35 to 50 years age bracket with 0.0% of them unmarried.
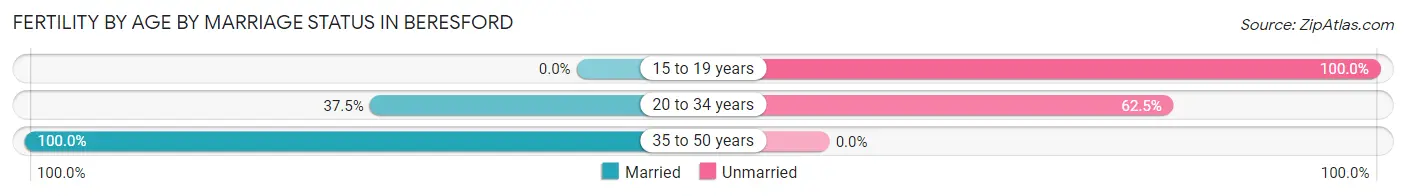
| Age Bracket | Married | Unmarried |
| 15 to 19 years | 0 (0.0%) | 8 (100.0%) |
| 20 to 34 years | 9 (37.5%) | 15 (62.5%) |
| 35 to 50 years | 9 (100.0%) | 0 (0.0%) |
| Total | 18 (43.9%) | 23 (56.1%) |
Fertility by Education in Beresford
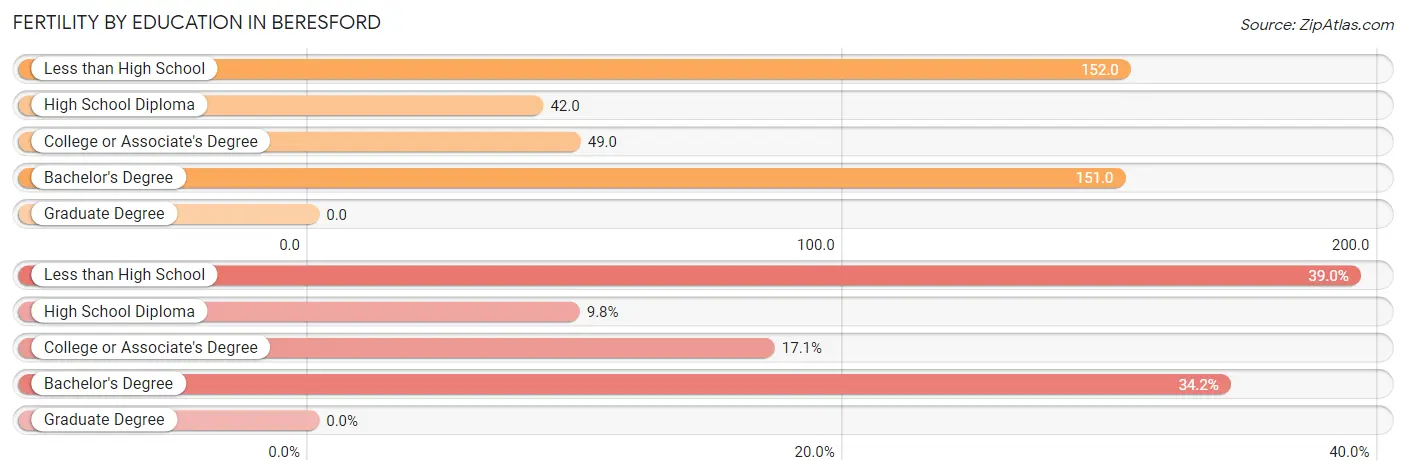
| Educational Attainment | Women with Births | Births / 1,000 Women |
| Less than High School | 16 (39.0%) | 152.0 |
| High School Diploma | 4 (9.8%) | 42.0 |
| College or Associate's Degree | 7 (17.1%) | 49.0 |
| Bachelor's Degree | 14 (34.2%) | 151.0 |
| Graduate Degree | 0 (0.0%) | 0.0 |
| Total | 41 (100.0%) | 87.0 |
Fertility by Education by Marriage Status in Beresford
56.1% of women with births in Beresford are unmarried. Women with the educational attainment of high school diploma are most likely to be married with 100.0% of them married at childbirth, while women with the educational attainment of less than high school are least likely to be married with 100.0% of them unmarried at childbirth.
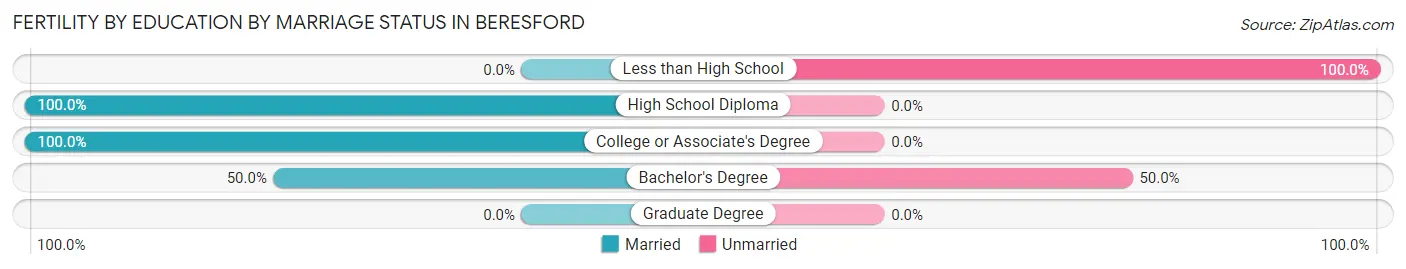
| Educational Attainment | Married | Unmarried |
| Less than High School | 0 (0.0%) | 16 (100.0%) |
| High School Diploma | 4 (100.0%) | 0 (0.0%) |
| College or Associate's Degree | 7 (100.0%) | 0 (0.0%) |
| Bachelor's Degree | 7 (50.0%) | 7 (50.0%) |
| Graduate Degree | 0 (0.0%) | 0 (0.0%) |
| Total | 18 (43.9%) | 23 (56.1%) |
Employment Characteristics in Beresford
Employment by Class of Employer in Beresford
Among the 1,233 employed individuals in Beresford, private company employees (825 | 66.9%), self-employed (not incorporated) (158 | 12.8%), and not-for-profit organizations (116 | 9.4%) make up the most common classes of employment.
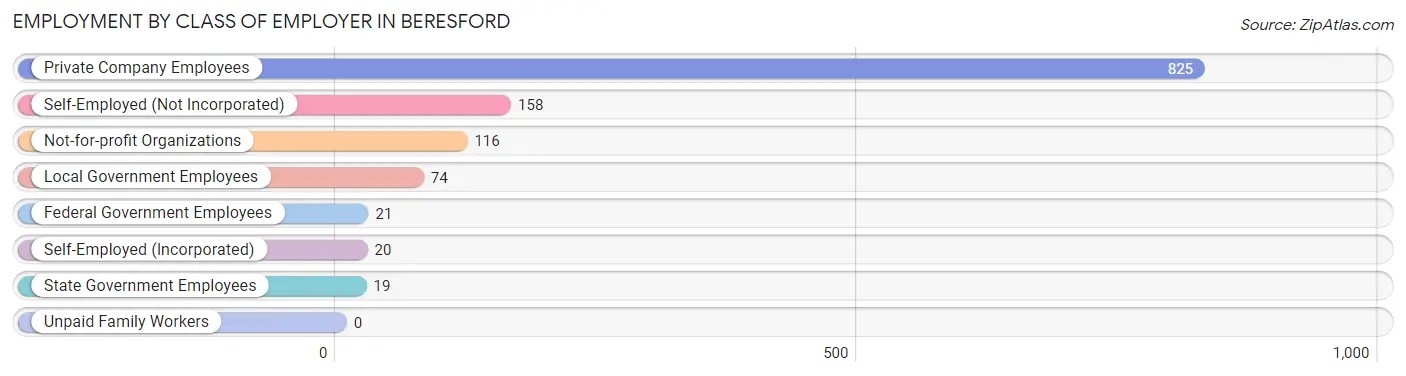
| Employer Class | # Employees | % Employees |
| Private Company Employees | 825 | 66.9% |
| Self-Employed (Incorporated) | 20 | 1.6% |
| Self-Employed (Not Incorporated) | 158 | 12.8% |
| Not-for-profit Organizations | 116 | 9.4% |
| Local Government Employees | 74 | 6.0% |
| State Government Employees | 19 | 1.5% |
| Federal Government Employees | 21 | 1.7% |
| Unpaid Family Workers | 0 | 0.0% |
| Total | 1,233 | 100.0% |
Employment Status by Age in Beresford
According to the labor force statistics for Beresford, out of the total population over 16 years of age (1,803), 72.8% or 1,313 individuals are in the labor force, with 4.9% or 64 of them unemployed. The age group with the highest labor force participation rate is 20 to 24 years, with 96.8% or 92 individuals in the labor force. Within the labor force, the 25 to 29 years age range has the highest percentage of unemployed individuals, with 14.6% or 28 of them being unemployed.
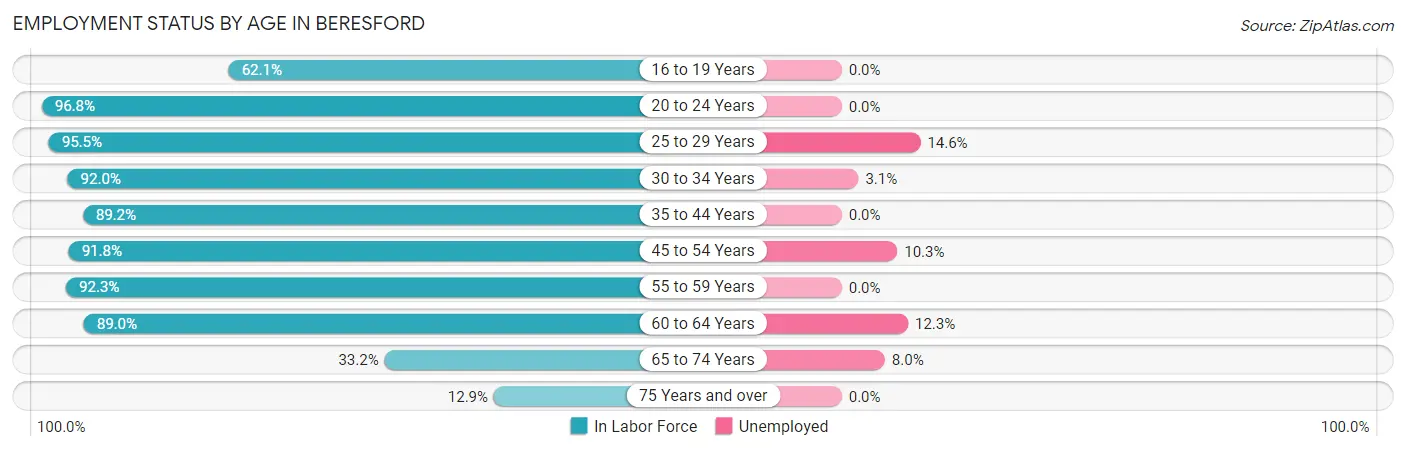
| Age Bracket | In Labor Force | Unemployed |
| 16 to 19 Years | 87 (62.1%) | 0 (0.0%) |
| 20 to 24 Years | 92 (96.8%) | 0 (0.0%) |
| 25 to 29 Years | 192 (95.5%) | 28 (14.6%) |
| 30 to 34 Years | 127 (92.0%) | 4 (3.1%) |
| 35 to 44 Years | 321 (89.2%) | 0 (0.0%) |
| 45 to 54 Years | 146 (91.8%) | 15 (10.3%) |
| 55 to 59 Years | 155 (92.3%) | 0 (0.0%) |
| 60 to 64 Years | 81 (89.0%) | 10 (12.3%) |
| 65 to 74 Years | 88 (33.2%) | 7 (8.0%) |
| 75 Years and over | 24 (12.9%) | 0 (0.0%) |
| Total | 1,313 (72.8%) | 64 (4.9%) |
Employment Status by Educational Attainment in Beresford
According to labor force statistics for Beresford, 91.5% of individuals (1,022) out of the total population between 25 and 64 years of age (1,117) are in the labor force, with 5.6% or 57 of them being unemployed. The group with the highest labor force participation rate are those with the educational attainment of high school diploma, with 97.8% or 314 individuals in the labor force. Within the labor force, individuals with high school diploma education have the highest percentage of unemployment, with 11.1% or 35 of them being unemployed.
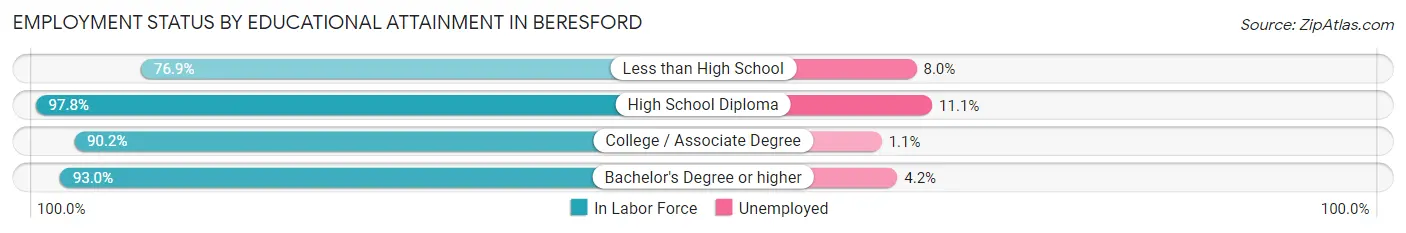
| Educational Attainment | In Labor Force | Unemployed |
| Less than High School | 100 (76.9%) | 10 (8.0%) |
| High School Diploma | 314 (97.8%) | 36 (11.1%) |
| College / Associate Degree | 370 (90.2%) | 5 (1.1%) |
| Bachelor's Degree or higher | 238 (93.0%) | 11 (4.2%) |
| Total | 1,022 (91.5%) | 63 (5.6%) |
Employment Occupations by Sex in Beresford
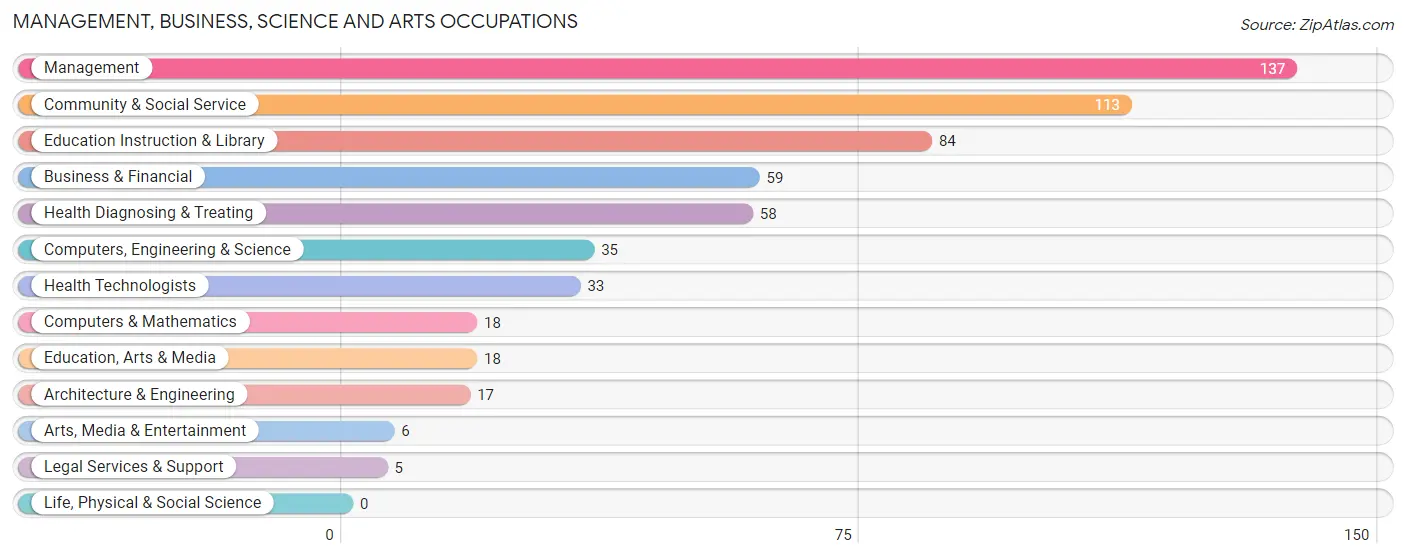
Management, Business, Science and Arts Occupations
The most common Management, Business, Science and Arts occupations in Beresford are Management (137 | 11.0%), Community & Social Service (113 | 9.0%), Education Instruction & Library (84 | 6.7%), Business & Financial (59 | 4.7%), and Health Diagnosing & Treating (58 | 4.6%).
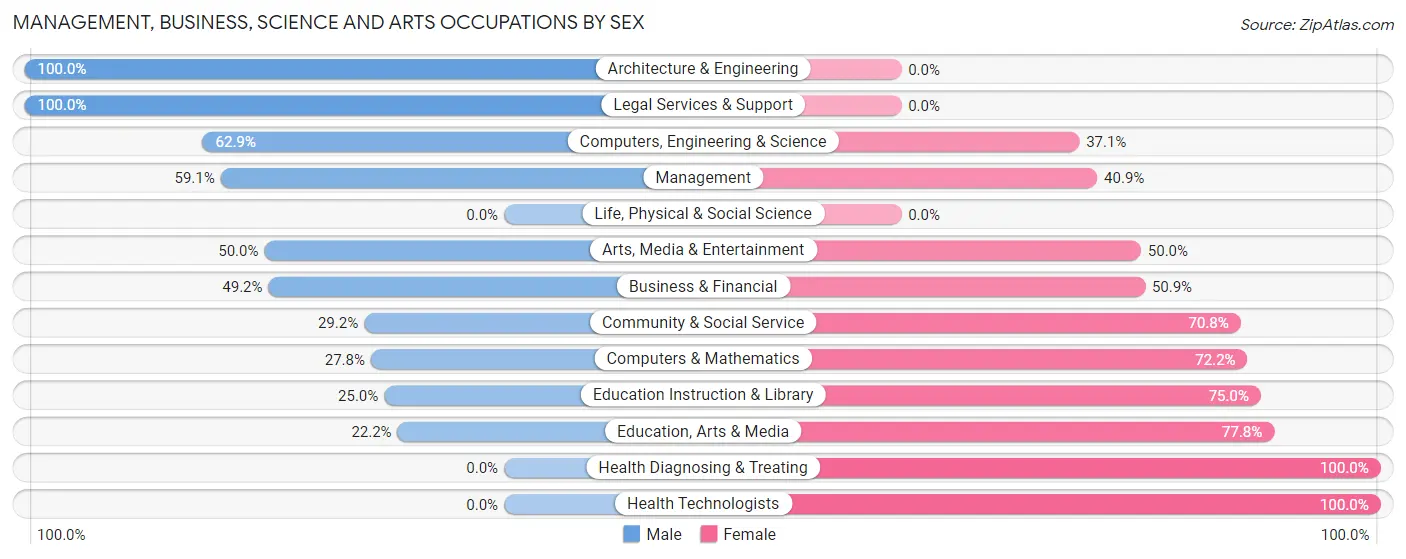
Management, Business, Science and Arts Occupations by Sex
Within the Management, Business, Science and Arts occupations in Beresford, the most male-oriented occupations are Architecture & Engineering (100.0%), Legal Services & Support (100.0%), and Computers, Engineering & Science (62.9%), while the most female-oriented occupations are Health Diagnosing & Treating (100.0%), Health Technologists (100.0%), and Education, Arts & Media (77.8%).
| Occupation | Male | Female |
| Management | 81 (59.1%) | 56 (40.9%) |
| Business & Financial | 29 (49.1%) | 30 (50.8%) |
| Computers, Engineering & Science | 22 (62.9%) | 13 (37.1%) |
| Computers & Mathematics | 5 (27.8%) | 13 (72.2%) |
| Architecture & Engineering | 17 (100.0%) | 0 (0.0%) |
| Life, Physical & Social Science | 0 (0.0%) | 0 (0.0%) |
| Community & Social Service | 33 (29.2%) | 80 (70.8%) |
| Education, Arts & Media | 4 (22.2%) | 14 (77.8%) |
| Legal Services & Support | 5 (100.0%) | 0 (0.0%) |
| Education Instruction & Library | 21 (25.0%) | 63 (75.0%) |
| Arts, Media & Entertainment | 3 (50.0%) | 3 (50.0%) |
| Health Diagnosing & Treating | 0 (0.0%) | 58 (100.0%) |
| Health Technologists | 0 (0.0%) | 33 (100.0%) |
| Total (Category) | 165 (41.0%) | 237 (59.0%) |
| Total (Overall) | 688 (55.1%) | 561 (44.9%) |
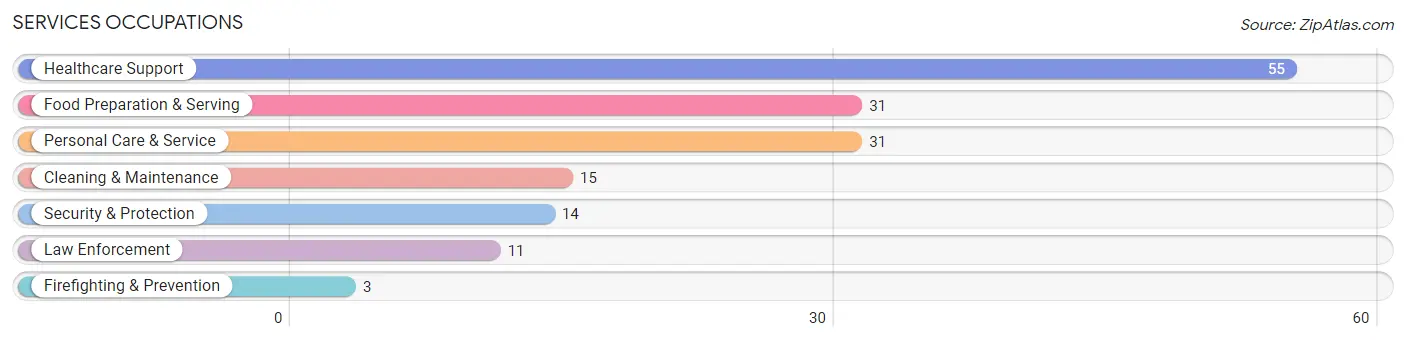
Services Occupations
The most common Services occupations in Beresford are Healthcare Support (55 | 4.4%), Food Preparation & Serving (31 | 2.5%), Personal Care & Service (31 | 2.5%), Cleaning & Maintenance (15 | 1.2%), and Security & Protection (14 | 1.1%).
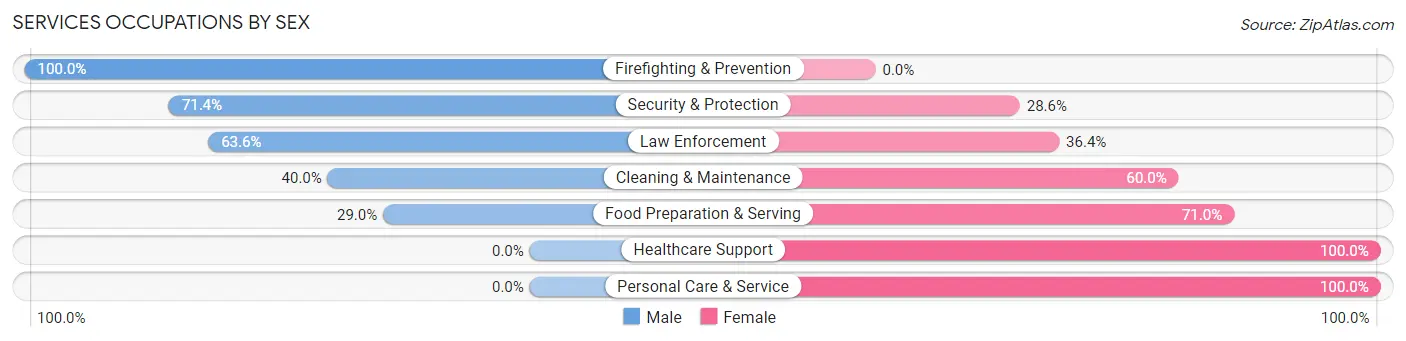
Services Occupations by Sex
Within the Services occupations in Beresford, the most male-oriented occupations are Firefighting & Prevention (100.0%), Security & Protection (71.4%), and Law Enforcement (63.6%), while the most female-oriented occupations are Healthcare Support (100.0%), Personal Care & Service (100.0%), and Food Preparation & Serving (71.0%).
| Occupation | Male | Female |
| Healthcare Support | 0 (0.0%) | 55 (100.0%) |
| Security & Protection | 10 (71.4%) | 4 (28.6%) |
| Firefighting & Prevention | 3 (100.0%) | 0 (0.0%) |
| Law Enforcement | 7 (63.6%) | 4 (36.4%) |
| Food Preparation & Serving | 9 (29.0%) | 22 (71.0%) |
| Cleaning & Maintenance | 6 (40.0%) | 9 (60.0%) |
| Personal Care & Service | 0 (0.0%) | 31 (100.0%) |
| Total (Category) | 25 (17.1%) | 121 (82.9%) |
| Total (Overall) | 688 (55.1%) | 561 (44.9%) |
Sales and Office Occupations
The most common Sales and Office occupations in Beresford are Sales & Related (159 | 12.7%), and Office & Administration (80 | 6.4%).
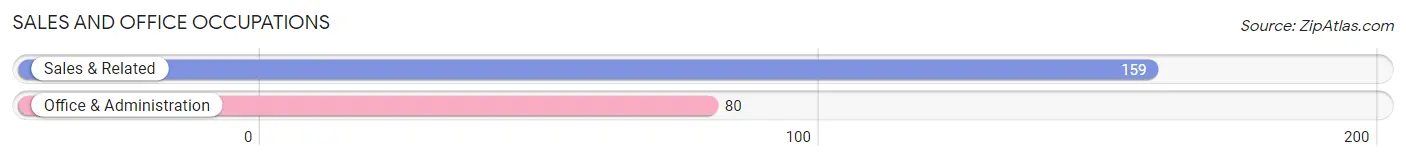
Sales and Office Occupations by Sex
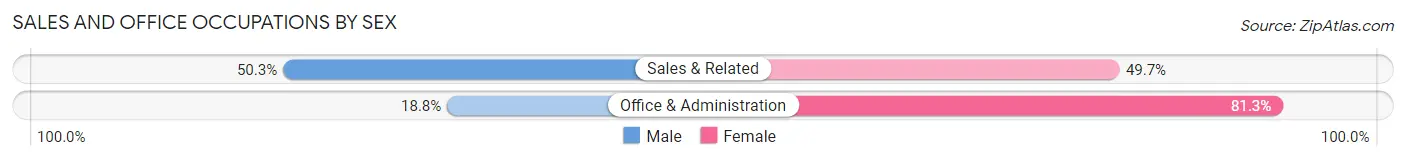
| Occupation | Male | Female |
| Sales & Related | 80 (50.3%) | 79 (49.7%) |
| Office & Administration | 15 (18.8%) | 65 (81.2%) |
| Total (Category) | 95 (39.8%) | 144 (60.3%) |
| Total (Overall) | 688 (55.1%) | 561 (44.9%) |
Natural Resources, Construction and Maintenance Occupations
The most common Natural Resources, Construction and Maintenance occupations in Beresford are Construction & Extraction (117 | 9.4%), Farming, Fishing & Forestry (51 | 4.1%), and Installation, Maintenance & Repair (42 | 3.4%).
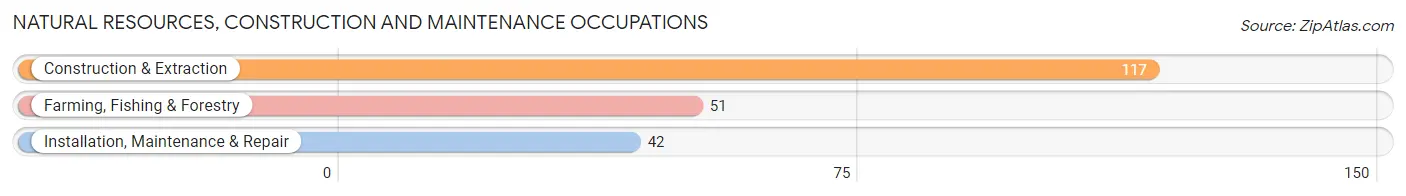
Natural Resources, Construction and Maintenance Occupations by Sex
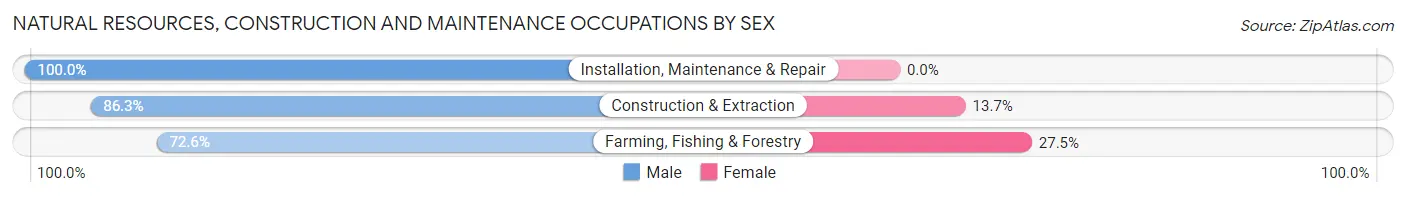
| Occupation | Male | Female |
| Farming, Fishing & Forestry | 37 (72.6%) | 14 (27.5%) |
| Construction & Extraction | 101 (86.3%) | 16 (13.7%) |
| Installation, Maintenance & Repair | 42 (100.0%) | 0 (0.0%) |
| Total (Category) | 180 (85.7%) | 30 (14.3%) |
| Total (Overall) | 688 (55.1%) | 561 (44.9%) |
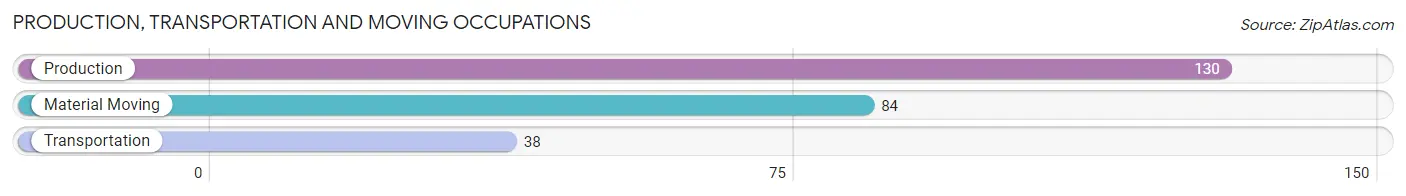
Production, Transportation and Moving Occupations
The most common Production, Transportation and Moving occupations in Beresford are Production (130 | 10.4%), Material Moving (84 | 6.7%), and Transportation (38 | 3.0%).
Production, Transportation and Moving Occupations by Sex
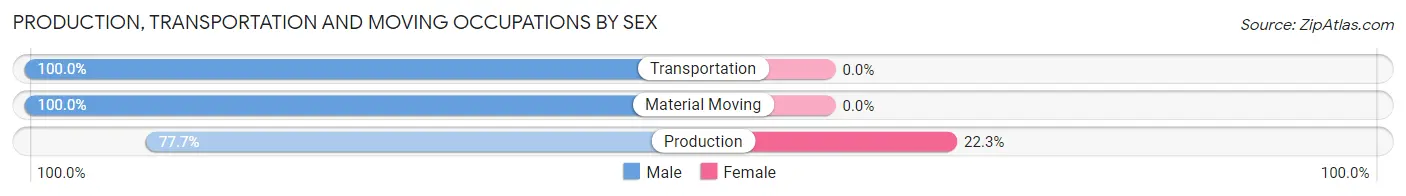
| Occupation | Male | Female |
| Production | 101 (77.7%) | 29 (22.3%) |
| Transportation | 38 (100.0%) | 0 (0.0%) |
| Material Moving | 84 (100.0%) | 0 (0.0%) |
| Total (Category) | 223 (88.5%) | 29 (11.5%) |
| Total (Overall) | 688 (55.1%) | 561 (44.9%) |
Employment Industries by Sex in Beresford
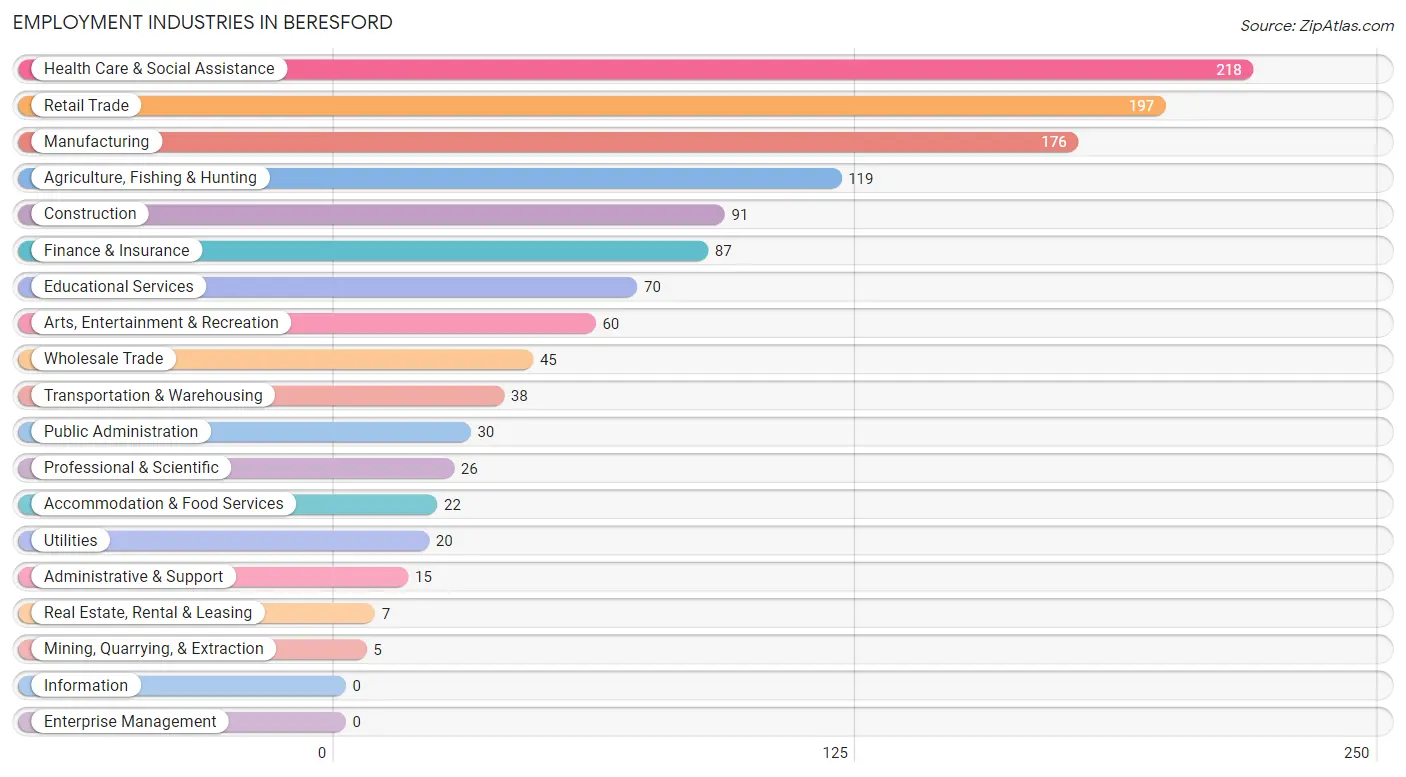
Employment Industries in Beresford
The major employment industries in Beresford include Health Care & Social Assistance (218 | 17.4%), Retail Trade (197 | 15.8%), Manufacturing (176 | 14.1%), Agriculture, Fishing & Hunting (119 | 9.5%), and Construction (91 | 7.3%).
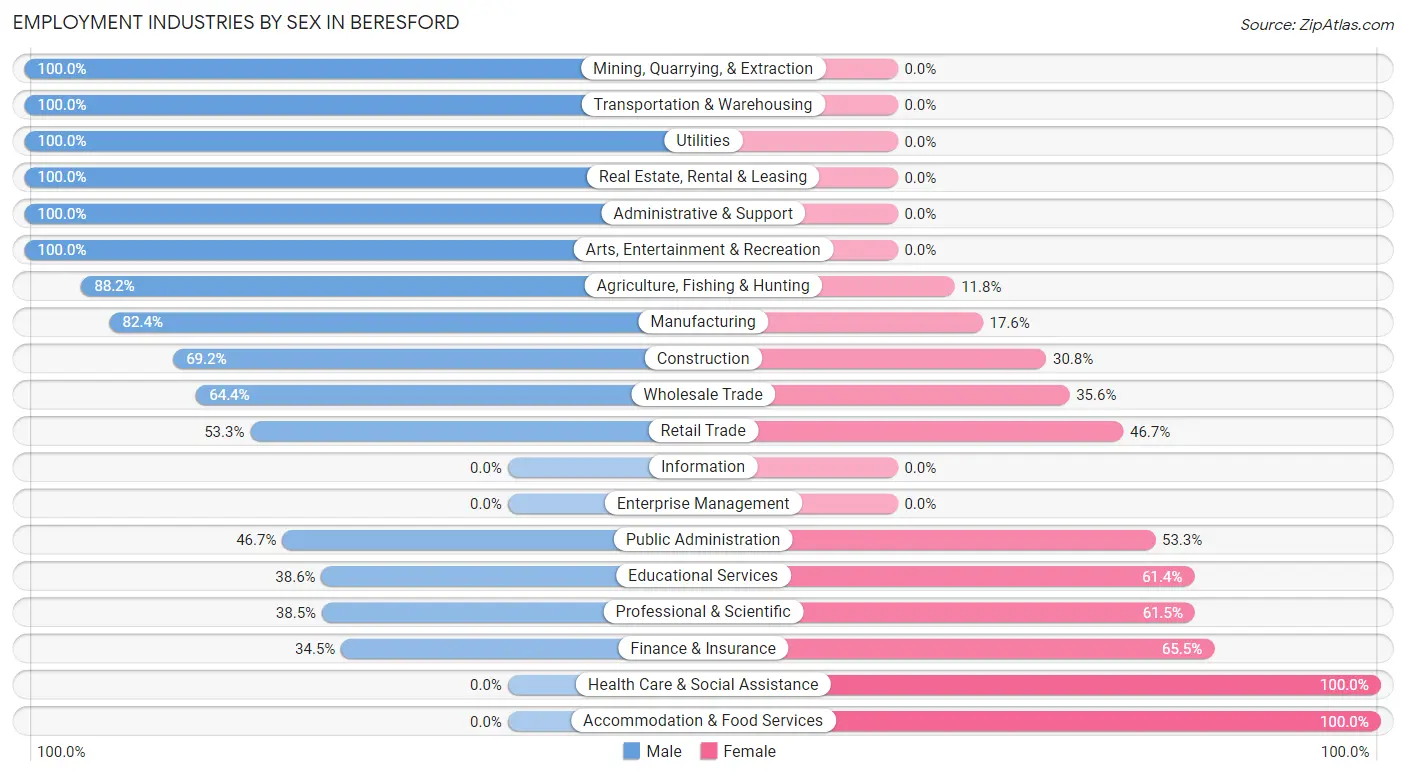
Employment Industries by Sex in Beresford
The Beresford industries that see more men than women are Mining, Quarrying, & Extraction (100.0%), Transportation & Warehousing (100.0%), and Utilities (100.0%), whereas the industries that tend to have a higher number of women are Health Care & Social Assistance (100.0%), Accommodation & Food Services (100.0%), and Finance & Insurance (65.5%).
| Industry | Male | Female |
| Agriculture, Fishing & Hunting | 105 (88.2%) | 14 (11.8%) |
| Mining, Quarrying, & Extraction | 5 (100.0%) | 0 (0.0%) |
| Construction | 63 (69.2%) | 28 (30.8%) |
| Manufacturing | 145 (82.4%) | 31 (17.6%) |
| Wholesale Trade | 29 (64.4%) | 16 (35.6%) |
| Retail Trade | 105 (53.3%) | 92 (46.7%) |
| Transportation & Warehousing | 38 (100.0%) | 0 (0.0%) |
| Utilities | 20 (100.0%) | 0 (0.0%) |
| Information | 0 (0.0%) | 0 (0.0%) |
| Finance & Insurance | 30 (34.5%) | 57 (65.5%) |
| Real Estate, Rental & Leasing | 7 (100.0%) | 0 (0.0%) |
| Professional & Scientific | 10 (38.5%) | 16 (61.5%) |
| Enterprise Management | 0 (0.0%) | 0 (0.0%) |
| Administrative & Support | 15 (100.0%) | 0 (0.0%) |
| Educational Services | 27 (38.6%) | 43 (61.4%) |
| Health Care & Social Assistance | 0 (0.0%) | 218 (100.0%) |
| Arts, Entertainment & Recreation | 60 (100.0%) | 0 (0.0%) |
| Accommodation & Food Services | 0 (0.0%) | 22 (100.0%) |
| Public Administration | 14 (46.7%) | 16 (53.3%) |
| Total | 688 (55.1%) | 561 (44.9%) |
Education in Beresford
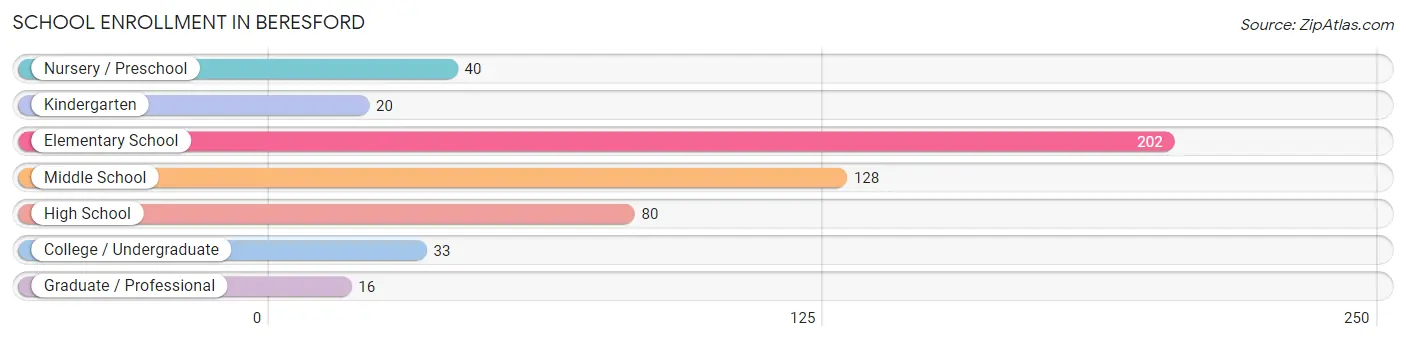
School Enrollment in Beresford
The most common levels of schooling among the 519 students in Beresford are elementary school (202 | 38.9%), middle school (128 | 24.7%), and high school (80 | 15.4%).
| School Level | # Students | % Students |
| Nursery / Preschool | 40 | 7.7% |
| Kindergarten | 20 | 3.8% |
| Elementary School | 202 | 38.9% |
| Middle School | 128 | 24.7% |
| High School | 80 | 15.4% |
| College / Undergraduate | 33 | 6.4% |
| Graduate / Professional | 16 | 3.1% |
| Total | 519 | 100.0% |
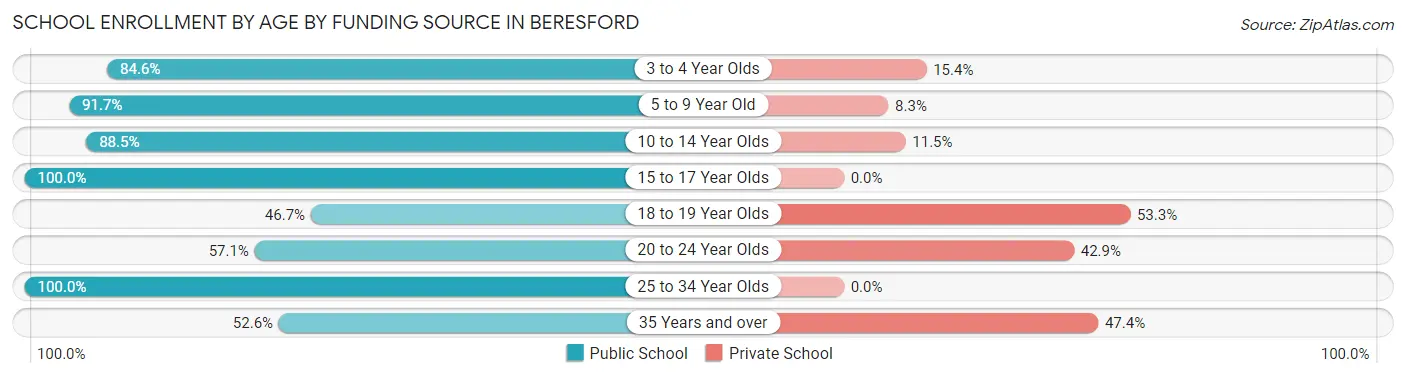
School Enrollment by Age by Funding Source in Beresford
Out of a total of 519 students who are enrolled in schools in Beresford, 61 (11.8%) attend a private institution, while the remaining 458 (88.2%) are enrolled in public schools. The age group of 18 to 19 year olds has the highest likelihood of being enrolled in private schools, with 8 (53.3% in the age bracket) enrolled. Conversely, the age group of 15 to 17 year olds has the lowest likelihood of being enrolled in a private school, with 52 (100.0% in the age bracket) attending a public institution.
| Age Bracket | Public School | Private School |
| 3 to 4 Year Olds | 33 (84.6%) | 6 (15.4%) |
| 5 to 9 Year Old | 199 (91.7%) | 18 (8.3%) |
| 10 to 14 Year Olds | 131 (88.5%) | 17 (11.5%) |
| 15 to 17 Year Olds | 52 (100.0%) | 0 (0.0%) |
| 18 to 19 Year Olds | 7 (46.7%) | 8 (53.3%) |
| 20 to 24 Year Olds | 4 (57.1%) | 3 (42.9%) |
| 25 to 34 Year Olds | 22 (100.0%) | 0 (0.0%) |
| 35 Years and over | 10 (52.6%) | 9 (47.4%) |
| Total | 458 (88.2%) | 61 (11.8%) |
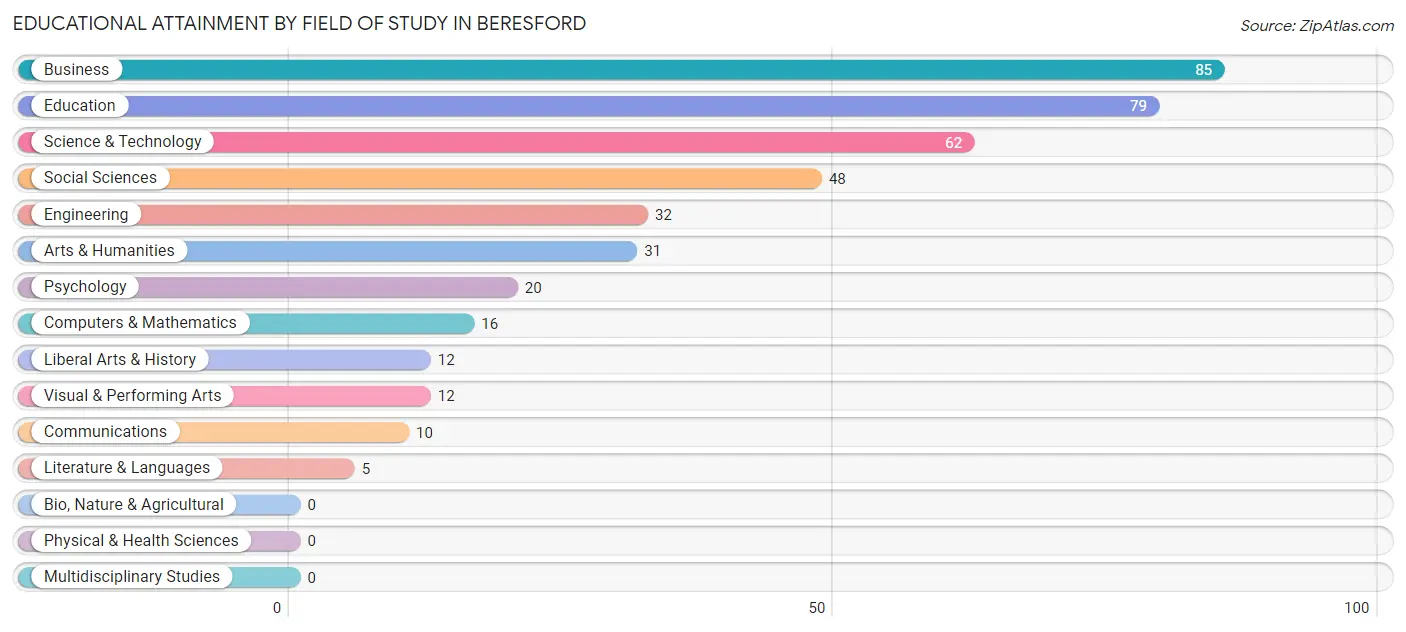
Educational Attainment by Field of Study in Beresford
Business (85 | 20.6%), education (79 | 19.2%), science & technology (62 | 15.0%), social sciences (48 | 11.7%), and engineering (32 | 7.8%) are the most common fields of study among 412 individuals in Beresford who have obtained a bachelor's degree or higher.
| Field of Study | # Graduates | % Graduates |
| Computers & Mathematics | 16 | 3.9% |
| Bio, Nature & Agricultural | 0 | 0.0% |
| Physical & Health Sciences | 0 | 0.0% |
| Psychology | 20 | 4.9% |
| Social Sciences | 48 | 11.7% |
| Engineering | 32 | 7.8% |
| Multidisciplinary Studies | 0 | 0.0% |
| Science & Technology | 62 | 15.0% |
| Business | 85 | 20.6% |
| Education | 79 | 19.2% |
| Literature & Languages | 5 | 1.2% |
| Liberal Arts & History | 12 | 2.9% |
| Visual & Performing Arts | 12 | 2.9% |
| Communications | 10 | 2.4% |
| Arts & Humanities | 31 | 7.5% |
| Total | 412 | 100.0% |
Transportation & Commute in Beresford
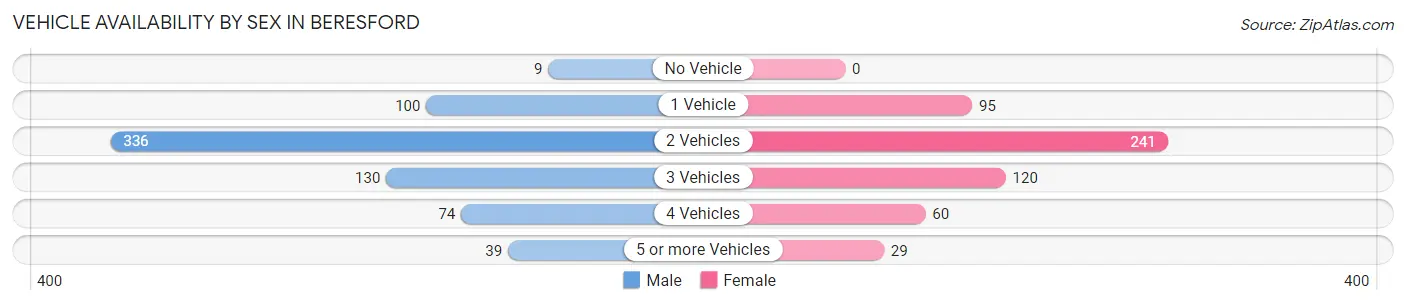
Vehicle Availability by Sex in Beresford
The most prevalent vehicle ownership categories in Beresford are males with 2 vehicles (336, accounting for 48.8%) and females with 2 vehicles (241, making up 61.7%).
| Vehicles Available | Male | Female |
| No Vehicle | 9 (1.3%) | 0 (0.0%) |
| 1 Vehicle | 100 (14.5%) | 95 (17.4%) |
| 2 Vehicles | 336 (48.8%) | 241 (44.2%) |
| 3 Vehicles | 130 (18.9%) | 120 (22.0%) |
| 4 Vehicles | 74 (10.8%) | 60 (11.0%) |
| 5 or more Vehicles | 39 (5.7%) | 29 (5.3%) |
| Total | 688 (100.0%) | 545 (100.0%) |
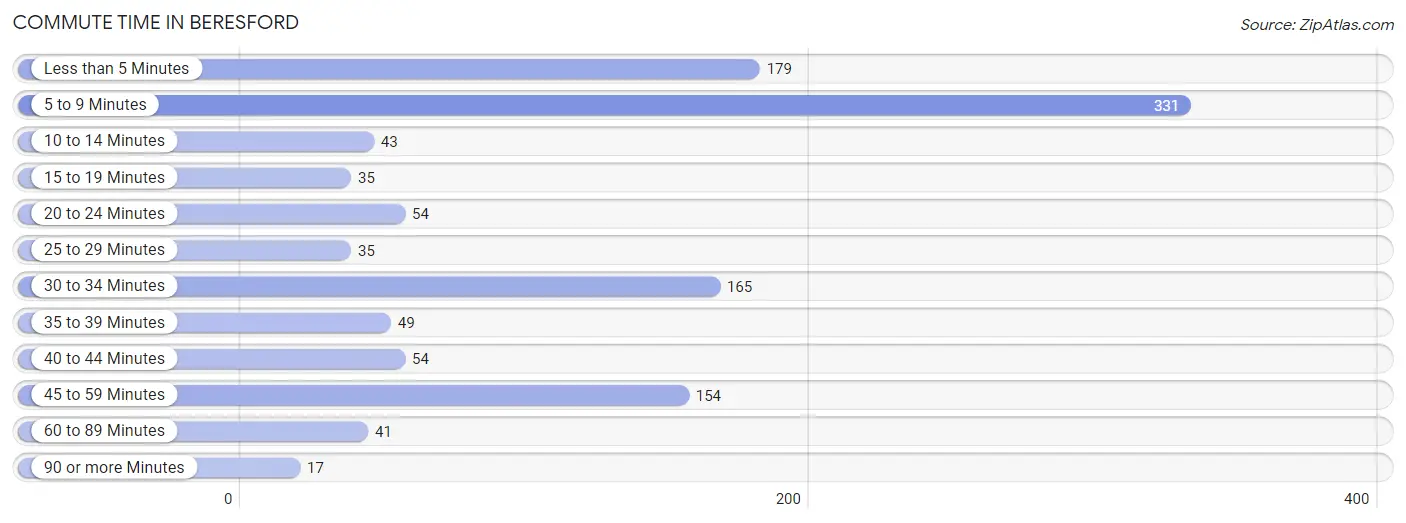
Commute Time in Beresford
The most frequently occuring commute durations in Beresford are 5 to 9 minutes (331 commuters, 28.6%), less than 5 minutes (179 commuters, 15.5%), and 30 to 34 minutes (165 commuters, 14.3%).
| Commute Time | # Commuters | % Commuters |
| Less than 5 Minutes | 179 | 15.5% |
| 5 to 9 Minutes | 331 | 28.6% |
| 10 to 14 Minutes | 43 | 3.7% |
| 15 to 19 Minutes | 35 | 3.0% |
| 20 to 24 Minutes | 54 | 4.7% |
| 25 to 29 Minutes | 35 | 3.0% |
| 30 to 34 Minutes | 165 | 14.3% |
| 35 to 39 Minutes | 49 | 4.2% |
| 40 to 44 Minutes | 54 | 4.7% |
| 45 to 59 Minutes | 154 | 13.3% |
| 60 to 89 Minutes | 41 | 3.5% |
| 90 or more Minutes | 17 | 1.5% |
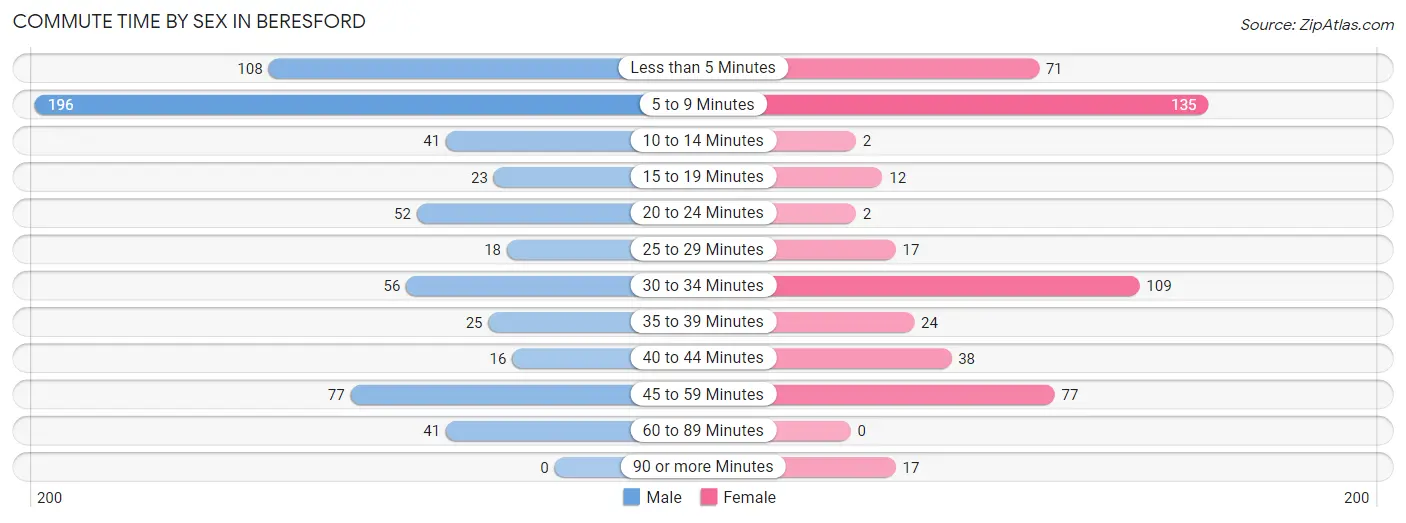
Commute Time by Sex in Beresford
The most common commute times in Beresford are 5 to 9 minutes (196 commuters, 30.0%) for males and 5 to 9 minutes (135 commuters, 26.8%) for females.
| Commute Time | Male | Female |
| Less than 5 Minutes | 108 (16.5%) | 71 (14.1%) |
| 5 to 9 Minutes | 196 (30.0%) | 135 (26.8%) |
| 10 to 14 Minutes | 41 (6.3%) | 2 (0.4%) |
| 15 to 19 Minutes | 23 (3.5%) | 12 (2.4%) |
| 20 to 24 Minutes | 52 (8.0%) | 2 (0.4%) |
| 25 to 29 Minutes | 18 (2.8%) | 17 (3.4%) |
| 30 to 34 Minutes | 56 (8.6%) | 109 (21.6%) |
| 35 to 39 Minutes | 25 (3.8%) | 24 (4.8%) |
| 40 to 44 Minutes | 16 (2.5%) | 38 (7.5%) |
| 45 to 59 Minutes | 77 (11.8%) | 77 (15.3%) |
| 60 to 89 Minutes | 41 (6.3%) | 0 (0.0%) |
| 90 or more Minutes | 0 (0.0%) | 17 (3.4%) |
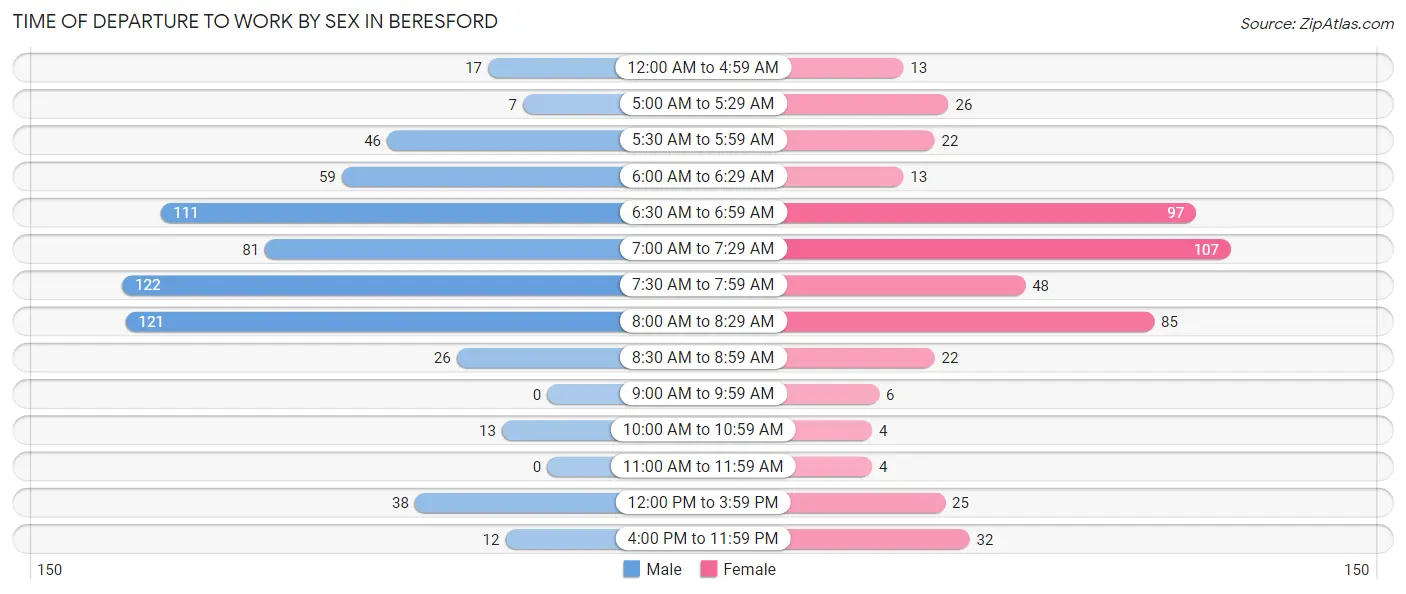
Time of Departure to Work by Sex in Beresford
The most frequent times of departure to work in Beresford are 7:30 AM to 7:59 AM (122, 18.7%) for males and 7:00 AM to 7:29 AM (107, 21.2%) for females.
| Time of Departure | Male | Female |
| 12:00 AM to 4:59 AM | 17 (2.6%) | 13 (2.6%) |
| 5:00 AM to 5:29 AM | 7 (1.1%) | 26 (5.2%) |
| 5:30 AM to 5:59 AM | 46 (7.0%) | 22 (4.4%) |
| 6:00 AM to 6:29 AM | 59 (9.0%) | 13 (2.6%) |
| 6:30 AM to 6:59 AM | 111 (17.0%) | 97 (19.3%) |
| 7:00 AM to 7:29 AM | 81 (12.4%) | 107 (21.2%) |
| 7:30 AM to 7:59 AM | 122 (18.7%) | 48 (9.5%) |
| 8:00 AM to 8:29 AM | 121 (18.5%) | 85 (16.9%) |
| 8:30 AM to 8:59 AM | 26 (4.0%) | 22 (4.4%) |
| 9:00 AM to 9:59 AM | 0 (0.0%) | 6 (1.2%) |
| 10:00 AM to 10:59 AM | 13 (2.0%) | 4 (0.8%) |
| 11:00 AM to 11:59 AM | 0 (0.0%) | 4 (0.8%) |
| 12:00 PM to 3:59 PM | 38 (5.8%) | 25 (5.0%) |
| 4:00 PM to 11:59 PM | 12 (1.8%) | 32 (6.4%) |
| Total | 653 (100.0%) | 504 (100.0%) |
Housing Occupancy in Beresford
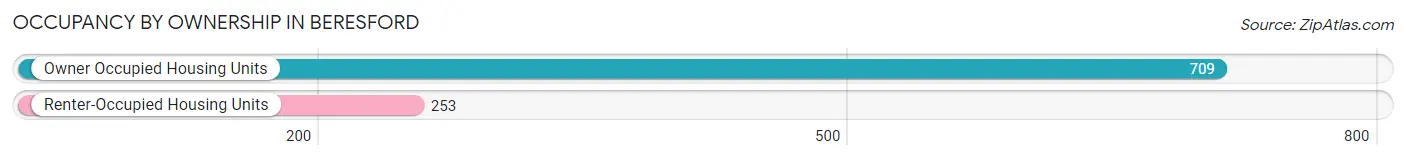
Occupancy by Ownership in Beresford
Of the total 962 dwellings in Beresford, owner-occupied units account for 709 (73.7%), while renter-occupied units make up 253 (26.3%).
| Occupancy | # Housing Units | % Housing Units |
| Owner Occupied Housing Units | 709 | 73.7% |
| Renter-Occupied Housing Units | 253 | 26.3% |
| Total Occupied Housing Units | 962 | 100.0% |
Occupancy by Household Size in Beresford
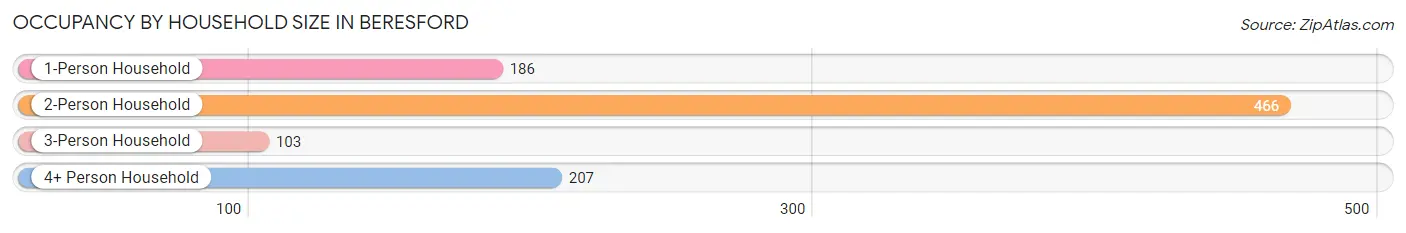
| Household Size | # Housing Units | % Housing Units |
| 1-Person Household | 186 | 19.3% |
| 2-Person Household | 466 | 48.4% |
| 3-Person Household | 103 | 10.7% |
| 4+ Person Household | 207 | 21.5% |
| Total Housing Units | 962 | 100.0% |
Occupancy by Ownership by Household Size in Beresford
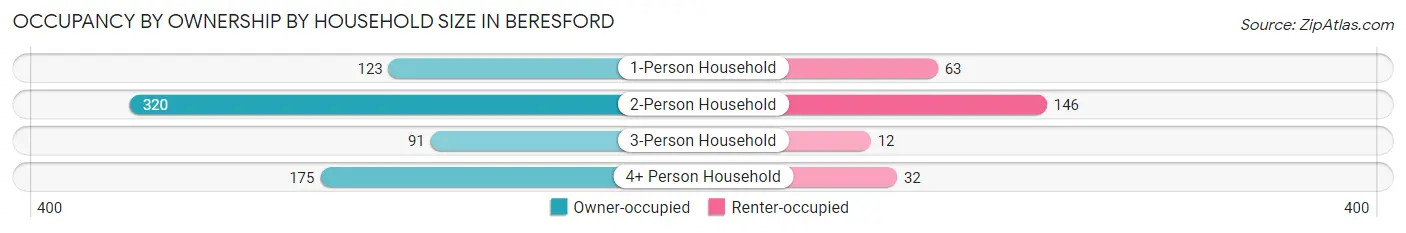
| Household Size | Owner-occupied | Renter-occupied |
| 1-Person Household | 123 (66.1%) | 63 (33.9%) |
| 2-Person Household | 320 (68.7%) | 146 (31.3%) |
| 3-Person Household | 91 (88.3%) | 12 (11.7%) |
| 4+ Person Household | 175 (84.5%) | 32 (15.5%) |
| Total Housing Units | 709 (73.7%) | 253 (26.3%) |
Occupancy by Educational Attainment in Beresford
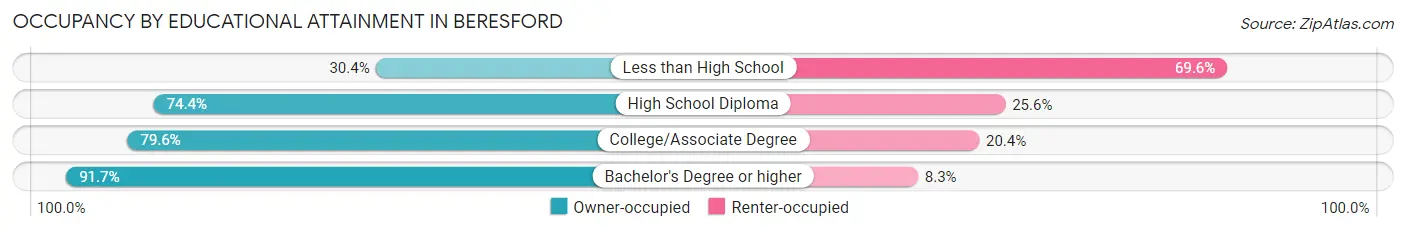
| Household Size | Owner-occupied | Renter-occupied |
| Less than High School | 42 (30.4%) | 96 (69.6%) |
| High School Diploma | 221 (74.4%) | 76 (25.6%) |
| College/Associate Degree | 246 (79.6%) | 63 (20.4%) |
| Bachelor's Degree or higher | 200 (91.7%) | 18 (8.3%) |
Occupancy by Age of Householder in Beresford
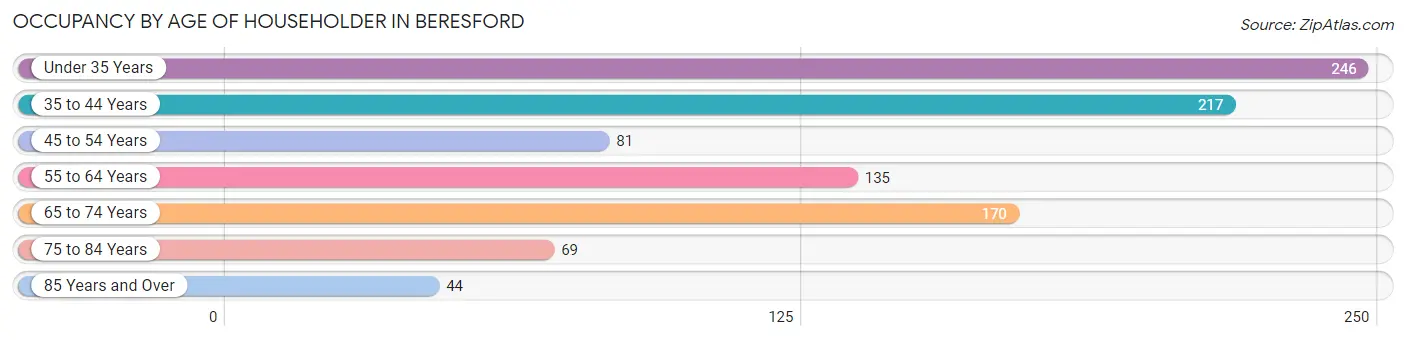
| Age Bracket | # Households | % Households |
| Under 35 Years | 246 | 25.6% |
| 35 to 44 Years | 217 | 22.6% |
| 45 to 54 Years | 81 | 8.4% |
| 55 to 64 Years | 135 | 14.0% |
| 65 to 74 Years | 170 | 17.7% |
| 75 to 84 Years | 69 | 7.2% |
| 85 Years and Over | 44 | 4.6% |
| Total | 962 | 100.0% |
Housing Finances in Beresford
Median Income by Occupancy in Beresford
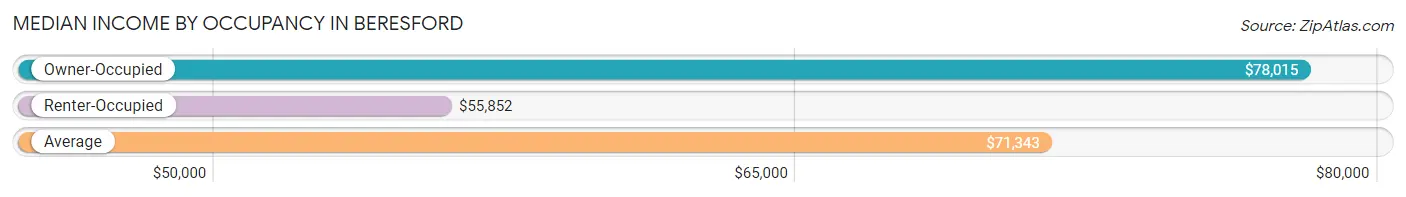
| Occupancy Type | # Households | Median Income |
| Owner-Occupied | 709 (73.7%) | $78,015 |
| Renter-Occupied | 253 (26.3%) | $55,852 |
| Average | 962 (100.0%) | $71,343 |
Occupancy by Householder Income Bracket in Beresford
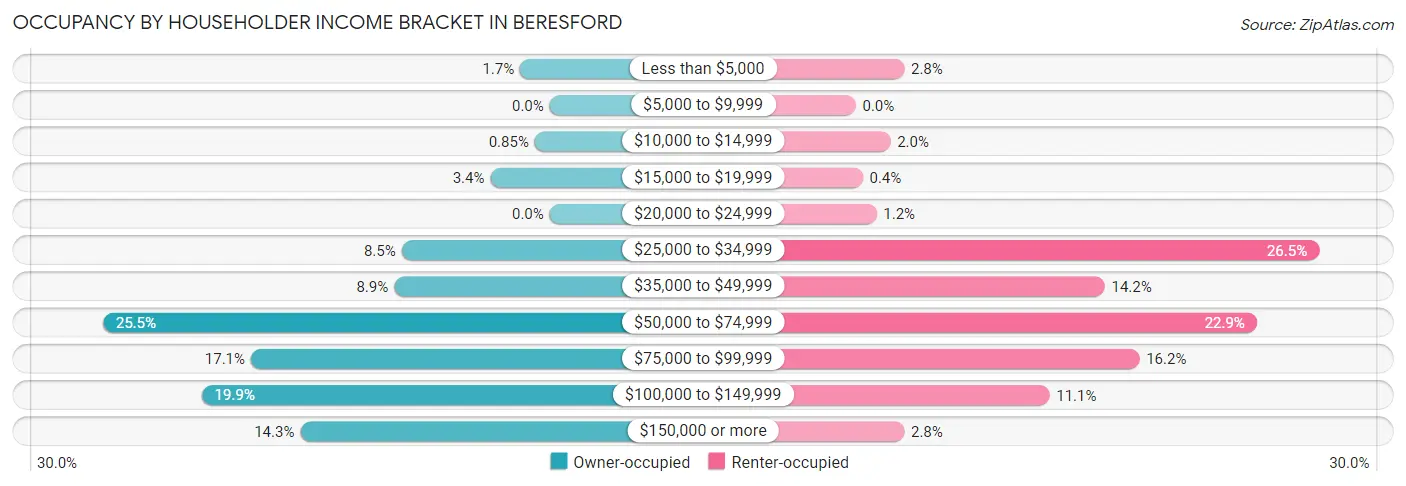
| Income Bracket | Owner-occupied | Renter-occupied |
| Less than $5,000 | 12 (1.7%) | 7 (2.8%) |
| $5,000 to $9,999 | 0 (0.0%) | 0 (0.0%) |
| $10,000 to $14,999 | 6 (0.9%) | 5 (2.0%) |
| $15,000 to $19,999 | 24 (3.4%) | 1 (0.4%) |
| $20,000 to $24,999 | 0 (0.0%) | 3 (1.2%) |
| $25,000 to $34,999 | 60 (8.5%) | 67 (26.5%) |
| $35,000 to $49,999 | 63 (8.9%) | 36 (14.2%) |
| $50,000 to $74,999 | 181 (25.5%) | 58 (22.9%) |
| $75,000 to $99,999 | 121 (17.1%) | 41 (16.2%) |
| $100,000 to $149,999 | 141 (19.9%) | 28 (11.1%) |
| $150,000 or more | 101 (14.2%) | 7 (2.8%) |
| Total | 709 (100.0%) | 253 (100.0%) |
Monthly Housing Cost Tiers in Beresford
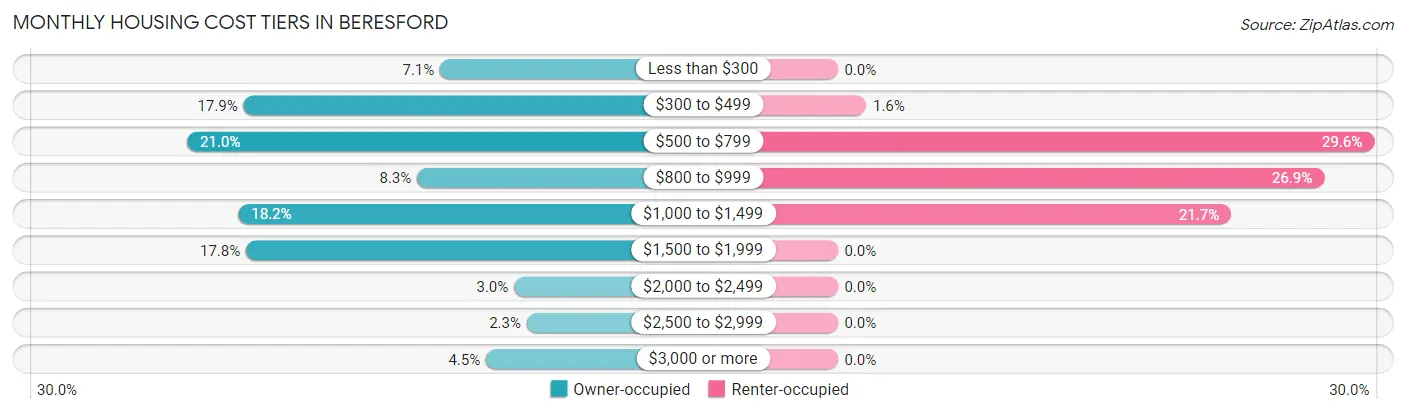
| Monthly Cost | Owner-occupied | Renter-occupied |
| Less than $300 | 50 (7.0%) | 0 (0.0%) |
| $300 to $499 | 127 (17.9%) | 4 (1.6%) |
| $500 to $799 | 149 (21.0%) | 75 (29.6%) |
| $800 to $999 | 59 (8.3%) | 68 (26.9%) |
| $1,000 to $1,499 | 129 (18.2%) | 55 (21.7%) |
| $1,500 to $1,999 | 126 (17.8%) | 0 (0.0%) |
| $2,000 to $2,499 | 21 (3.0%) | 0 (0.0%) |
| $2,500 to $2,999 | 16 (2.3%) | 0 (0.0%) |
| $3,000 or more | 32 (4.5%) | 0 (0.0%) |
| Total | 709 (100.0%) | 253 (100.0%) |
Physical Housing Characteristics in Beresford
Housing Structures in Beresford
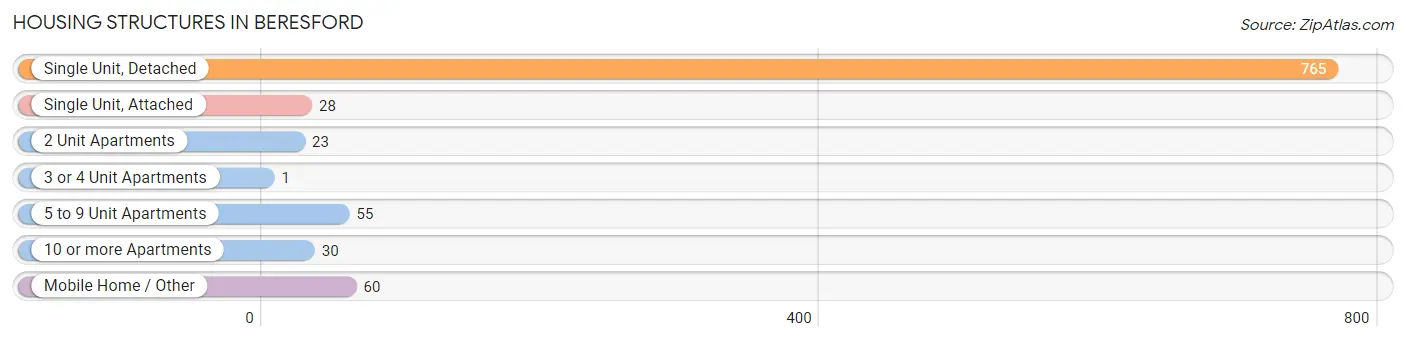
| Structure Type | # Housing Units | % Housing Units |
| Single Unit, Detached | 765 | 79.5% |
| Single Unit, Attached | 28 | 2.9% |
| 2 Unit Apartments | 23 | 2.4% |
| 3 or 4 Unit Apartments | 1 | 0.1% |
| 5 to 9 Unit Apartments | 55 | 5.7% |
| 10 or more Apartments | 30 | 3.1% |
| Mobile Home / Other | 60 | 6.2% |
| Total | 962 | 100.0% |
Housing Structures by Occupancy in Beresford
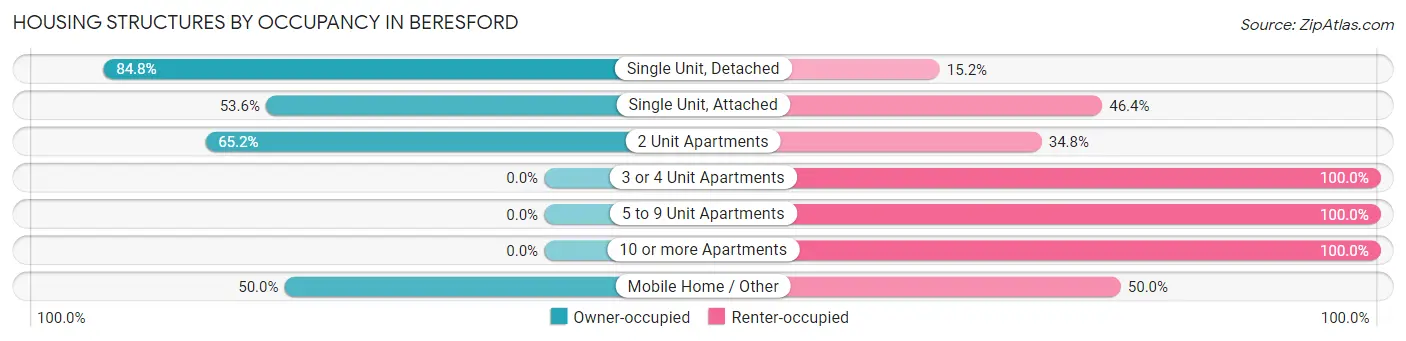
| Structure Type | Owner-occupied | Renter-occupied |
| Single Unit, Detached | 649 (84.8%) | 116 (15.2%) |
| Single Unit, Attached | 15 (53.6%) | 13 (46.4%) |
| 2 Unit Apartments | 15 (65.2%) | 8 (34.8%) |
| 3 or 4 Unit Apartments | 0 (0.0%) | 1 (100.0%) |
| 5 to 9 Unit Apartments | 0 (0.0%) | 55 (100.0%) |
| 10 or more Apartments | 0 (0.0%) | 30 (100.0%) |
| Mobile Home / Other | 30 (50.0%) | 30 (50.0%) |
| Total | 709 (73.7%) | 253 (26.3%) |
Housing Structures by Number of Rooms in Beresford
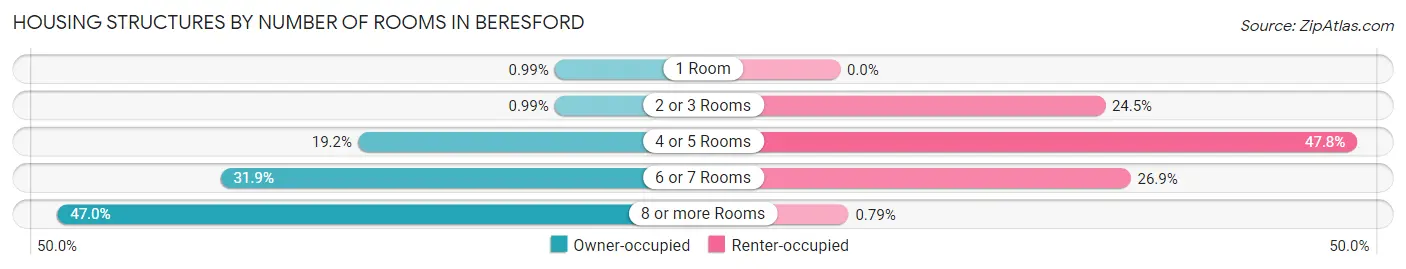
| Number of Rooms | Owner-occupied | Renter-occupied |
| 1 Room | 7 (1.0%) | 0 (0.0%) |
| 2 or 3 Rooms | 7 (1.0%) | 62 (24.5%) |
| 4 or 5 Rooms | 136 (19.2%) | 121 (47.8%) |
| 6 or 7 Rooms | 226 (31.9%) | 68 (26.9%) |
| 8 or more Rooms | 333 (47.0%) | 2 (0.8%) |
| Total | 709 (100.0%) | 253 (100.0%) |
Housing Structure by Heating Type in Beresford
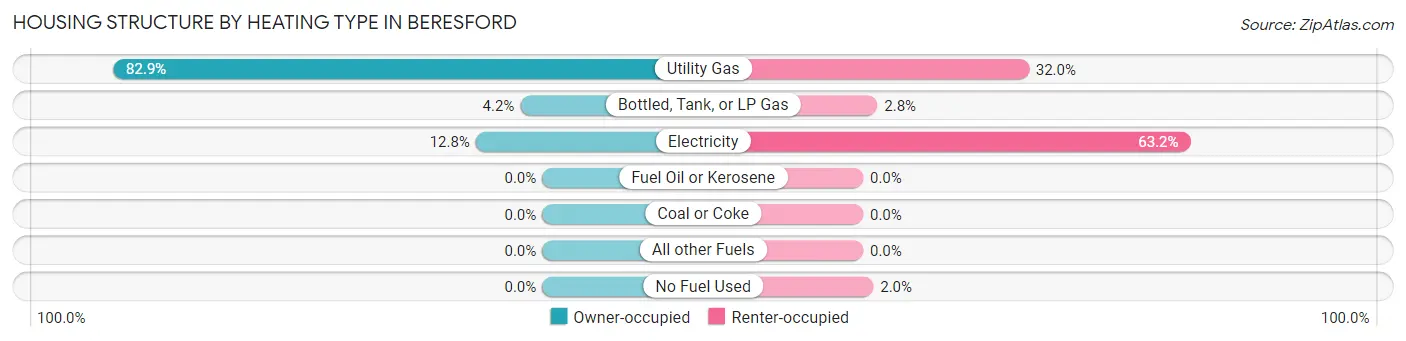
| Heating Type | Owner-occupied | Renter-occupied |
| Utility Gas | 588 (82.9%) | 81 (32.0%) |
| Bottled, Tank, or LP Gas | 30 (4.2%) | 7 (2.8%) |
| Electricity | 91 (12.8%) | 160 (63.2%) |
| Fuel Oil or Kerosene | 0 (0.0%) | 0 (0.0%) |
| Coal or Coke | 0 (0.0%) | 0 (0.0%) |
| All other Fuels | 0 (0.0%) | 0 (0.0%) |
| No Fuel Used | 0 (0.0%) | 5 (2.0%) |
| Total | 709 (100.0%) | 253 (100.0%) |
Household Vehicle Usage in Beresford
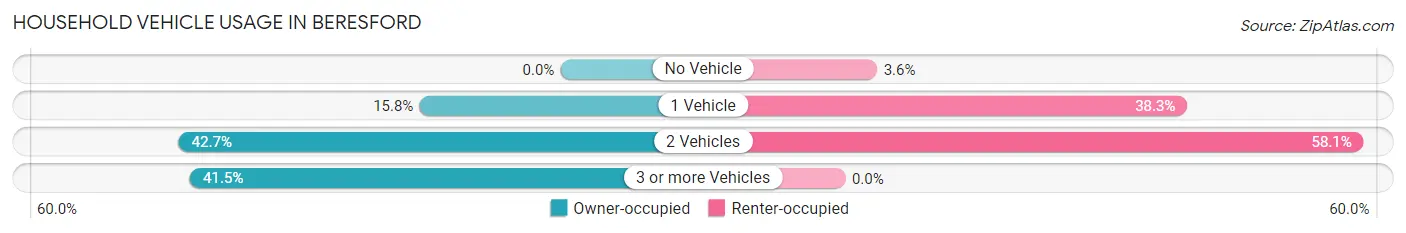
| Vehicles per Household | Owner-occupied | Renter-occupied |
| No Vehicle | 0 (0.0%) | 9 (3.6%) |
| 1 Vehicle | 112 (15.8%) | 97 (38.3%) |
| 2 Vehicles | 303 (42.7%) | 147 (58.1%) |
| 3 or more Vehicles | 294 (41.5%) | 0 (0.0%) |
| Total | 709 (100.0%) | 253 (100.0%) |
Real Estate & Mortgages in Beresford
Real Estate and Mortgage Overview in Beresford
| Characteristic | Without Mortgage | With Mortgage |
| Housing Units | 332 | 377 |
| Median Property Value | $168,600 | $213,000 |
| Median Household Income | $69,000 | $40 |
| Monthly Housing Costs | $498 | $32 |
| Real Estate Taxes | $2,228 | $4 |
Property Value by Mortgage Status in Beresford
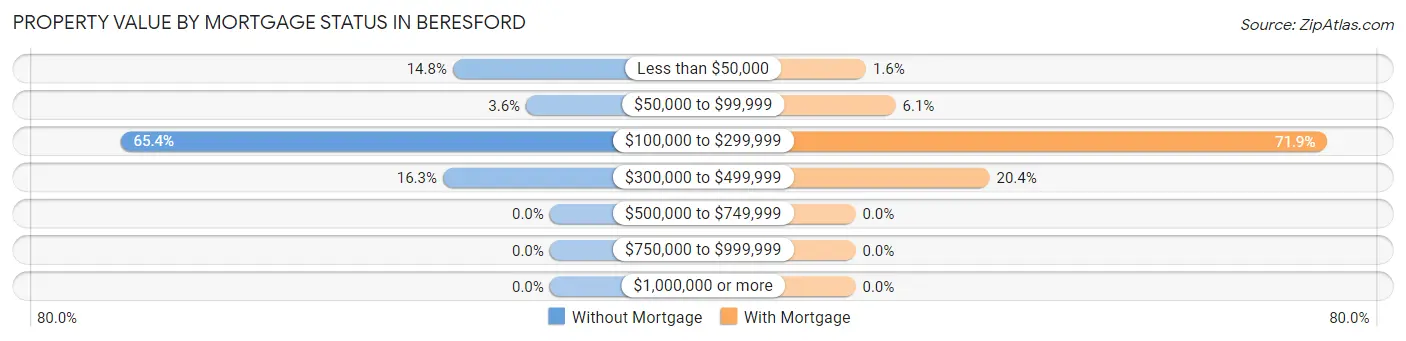
| Property Value | Without Mortgage | With Mortgage |
| Less than $50,000 | 49 (14.8%) | 6 (1.6%) |
| $50,000 to $99,999 | 12 (3.6%) | 23 (6.1%) |
| $100,000 to $299,999 | 217 (65.4%) | 271 (71.9%) |
| $300,000 to $499,999 | 54 (16.3%) | 77 (20.4%) |
| $500,000 to $749,999 | 0 (0.0%) | 0 (0.0%) |
| $750,000 to $999,999 | 0 (0.0%) | 0 (0.0%) |
| $1,000,000 or more | 0 (0.0%) | 0 (0.0%) |
| Total | 332 (100.0%) | 377 (100.0%) |
Household Income by Mortgage Status in Beresford
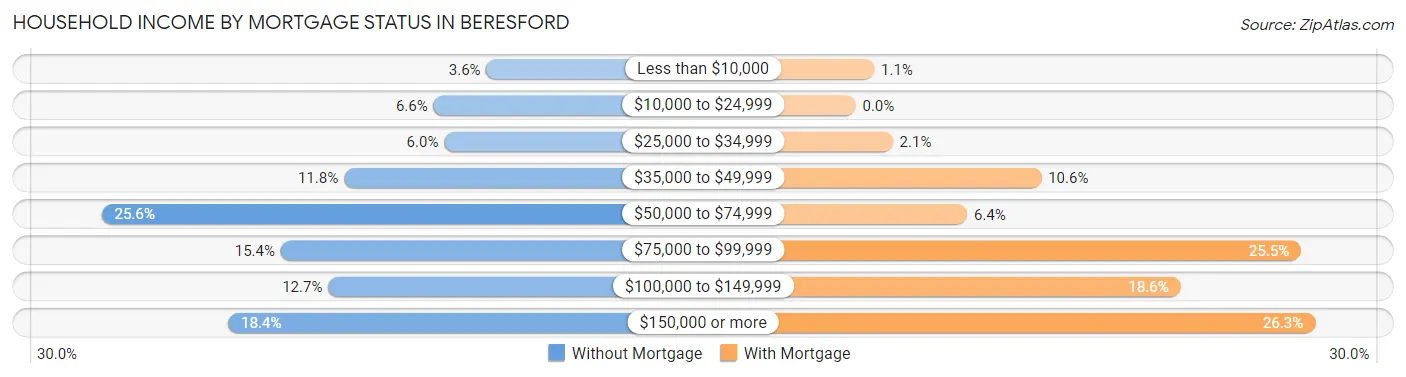
| Household Income | Without Mortgage | With Mortgage |
| Less than $10,000 | 12 (3.6%) | 4 (1.1%) |
| $10,000 to $24,999 | 22 (6.6%) | 0 (0.0%) |
| $25,000 to $34,999 | 20 (6.0%) | 8 (2.1%) |
| $35,000 to $49,999 | 39 (11.7%) | 40 (10.6%) |
| $50,000 to $74,999 | 85 (25.6%) | 24 (6.4%) |
| $75,000 to $99,999 | 51 (15.4%) | 96 (25.5%) |
| $100,000 to $149,999 | 42 (12.7%) | 70 (18.6%) |
| $150,000 or more | 61 (18.4%) | 99 (26.3%) |
| Total | 332 (100.0%) | 377 (100.0%) |
Property Value to Household Income Ratio in Beresford
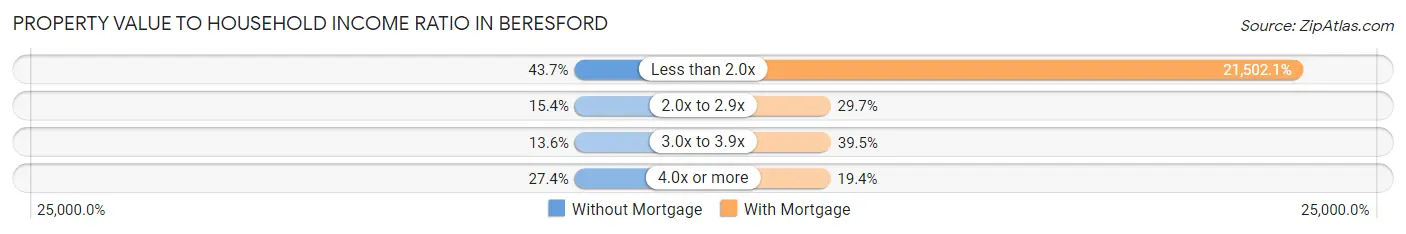
| Value-to-Income Ratio | Without Mortgage | With Mortgage |
| Less than 2.0x | 145 (43.7%) | 81,063 (21,502.1%) |
| 2.0x to 2.9x | 51 (15.4%) | 112 (29.7%) |
| 3.0x to 3.9x | 45 (13.6%) | 149 (39.5%) |
| 4.0x or more | 91 (27.4%) | 73 (19.4%) |
| Total | 332 (100.0%) | 377 (100.0%) |
Real Estate Taxes by Mortgage Status in Beresford
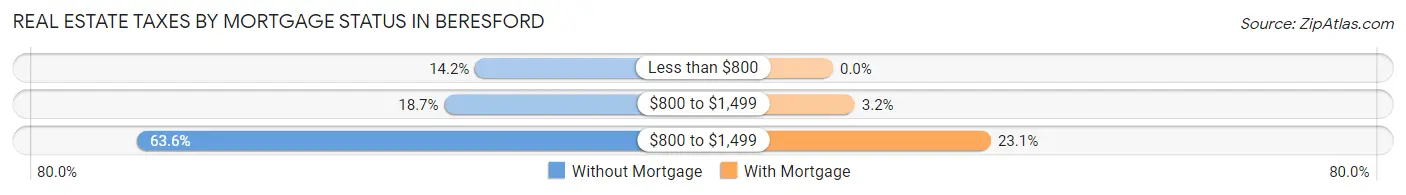
| Property Taxes | Without Mortgage | With Mortgage |
| Less than $800 | 47 (14.2%) | 0 (0.0%) |
| $800 to $1,499 | 62 (18.7%) | 12 (3.2%) |
| $800 to $1,499 | 211 (63.5%) | 87 (23.1%) |
| Total | 332 (100.0%) | 377 (100.0%) |
Health & Disability in Beresford
Health Insurance Coverage by Age in Beresford
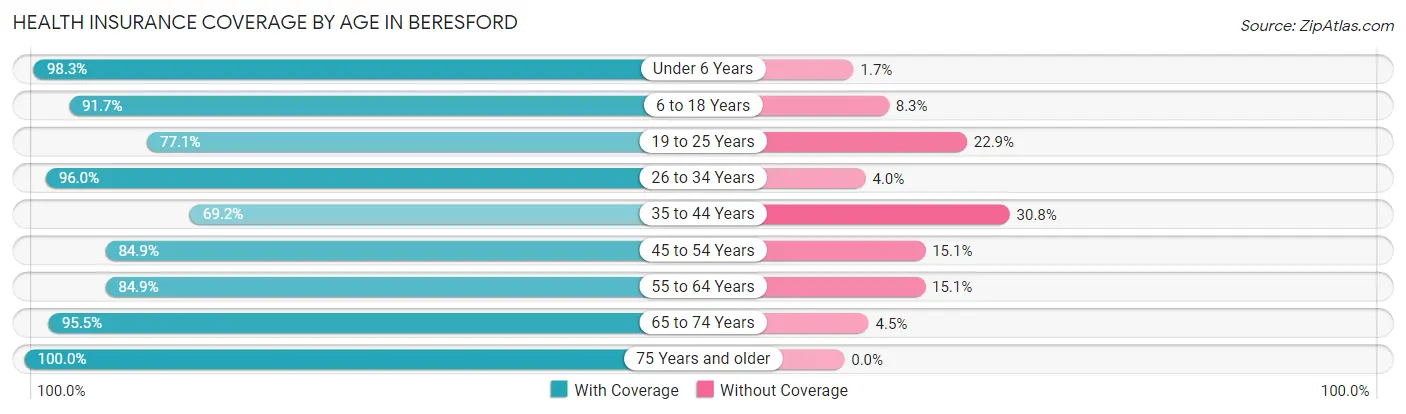
| Age Bracket | With Coverage | Without Coverage |
| Under 6 Years | 226 (98.3%) | 4 (1.7%) |
| 6 to 18 Years | 442 (91.7%) | 40 (8.3%) |
| 19 to 25 Years | 135 (77.1%) | 40 (22.9%) |
| 26 to 34 Years | 291 (96.0%) | 12 (4.0%) |
| 35 to 44 Years | 249 (69.2%) | 111 (30.8%) |
| 45 to 54 Years | 135 (84.9%) | 24 (15.1%) |
| 55 to 64 Years | 220 (84.9%) | 39 (15.1%) |
| 65 to 74 Years | 253 (95.5%) | 12 (4.5%) |
| 75 Years and older | 186 (100.0%) | 0 (0.0%) |
| Total | 2,137 (88.3%) | 282 (11.7%) |
Health Insurance Coverage by Citizenship Status in Beresford
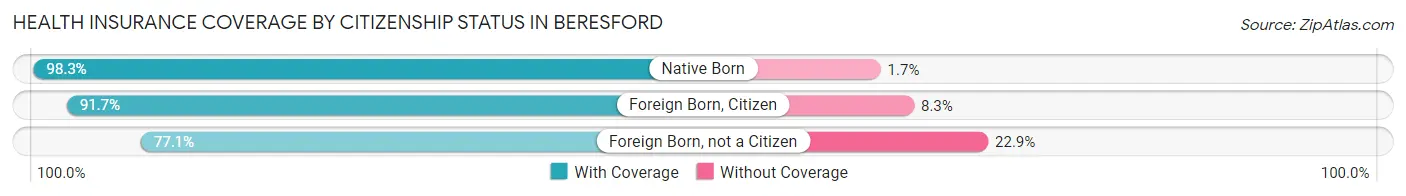
| Citizenship Status | With Coverage | Without Coverage |
| Native Born | 226 (98.3%) | 4 (1.7%) |
| Foreign Born, Citizen | 442 (91.7%) | 40 (8.3%) |
| Foreign Born, not a Citizen | 135 (77.1%) | 40 (22.9%) |
Health Insurance Coverage by Household Income in Beresford
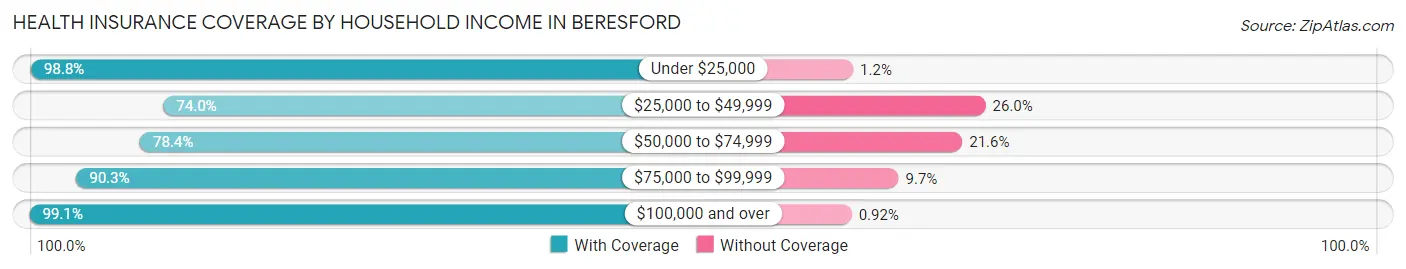
| Household Income | With Coverage | Without Coverage |
| Under $25,000 | 83 (98.8%) | 1 (1.2%) |
| $25,000 to $49,999 | 276 (74.0%) | 97 (26.0%) |
| $50,000 to $74,999 | 460 (78.4%) | 127 (21.6%) |
| $75,000 to $99,999 | 456 (90.3%) | 49 (9.7%) |
| $100,000 and over | 862 (99.1%) | 8 (0.9%) |
Public vs Private Health Insurance Coverage by Age in Beresford
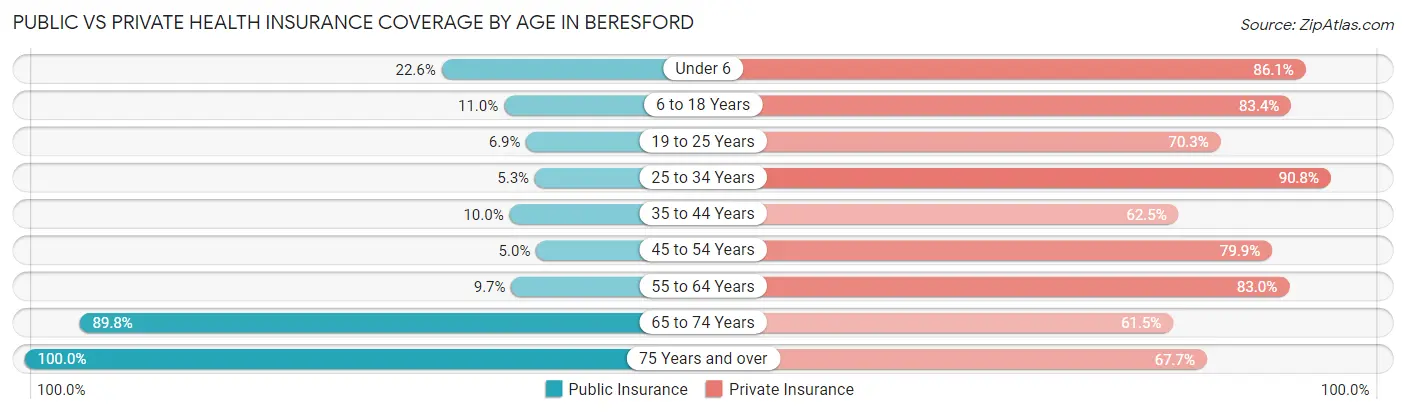
| Age Bracket | Public Insurance | Private Insurance |
| Under 6 | 52 (22.6%) | 198 (86.1%) |
| 6 to 18 Years | 53 (11.0%) | 402 (83.4%) |
| 19 to 25 Years | 12 (6.9%) | 123 (70.3%) |
| 25 to 34 Years | 16 (5.3%) | 275 (90.8%) |
| 35 to 44 Years | 36 (10.0%) | 225 (62.5%) |
| 45 to 54 Years | 8 (5.0%) | 127 (79.9%) |
| 55 to 64 Years | 25 (9.7%) | 215 (83.0%) |
| 65 to 74 Years | 238 (89.8%) | 163 (61.5%) |
| 75 Years and over | 186 (100.0%) | 126 (67.7%) |
| Total | 626 (25.9%) | 1,854 (76.6%) |
Disability Status by Sex by Age in Beresford
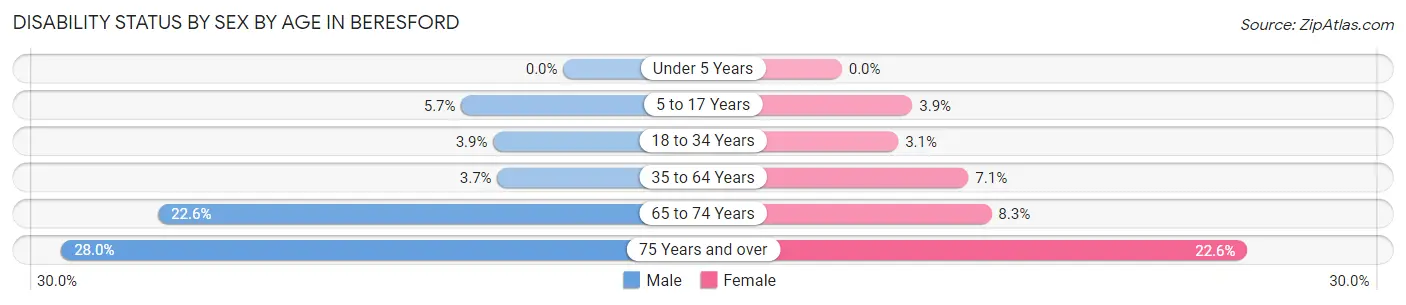
| Age Bracket | Male | Female |
| Under 5 Years | 0 (0.0%) | 0 (0.0%) |
| 5 to 17 Years | 15 (5.7%) | 9 (3.9%) |
| 18 to 34 Years | 9 (3.9%) | 8 (3.1%) |
| 35 to 64 Years | 15 (3.7%) | 26 (7.0%) |
| 65 to 74 Years | 30 (22.6%) | 11 (8.3%) |
| 75 Years and over | 26 (28.0%) | 21 (22.6%) |
Disability Class by Sex by Age in Beresford
Disability Class: Hearing Difficulty
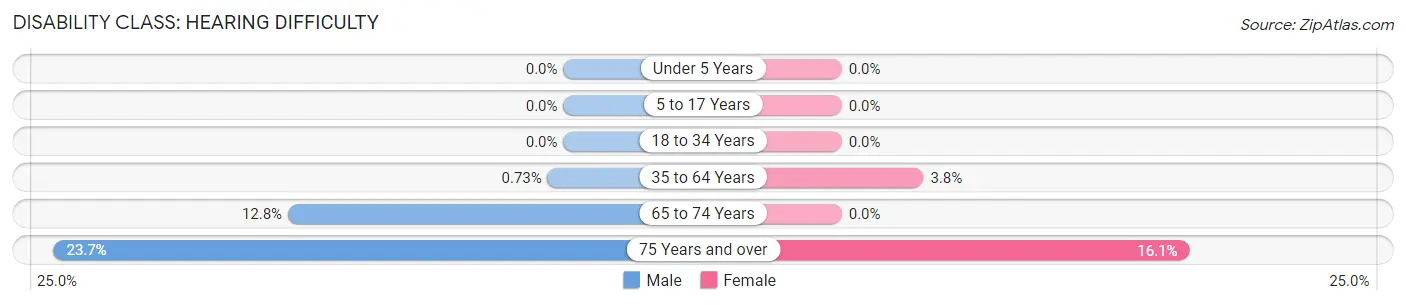
| Age Bracket | Male | Female |
| Under 5 Years | 0 (0.0%) | 0 (0.0%) |
| 5 to 17 Years | 0 (0.0%) | 0 (0.0%) |
| 18 to 34 Years | 0 (0.0%) | 0 (0.0%) |
| 35 to 64 Years | 3 (0.7%) | 14 (3.8%) |
| 65 to 74 Years | 17 (12.8%) | 0 (0.0%) |
| 75 Years and over | 22 (23.7%) | 15 (16.1%) |
Disability Class: Vision Difficulty
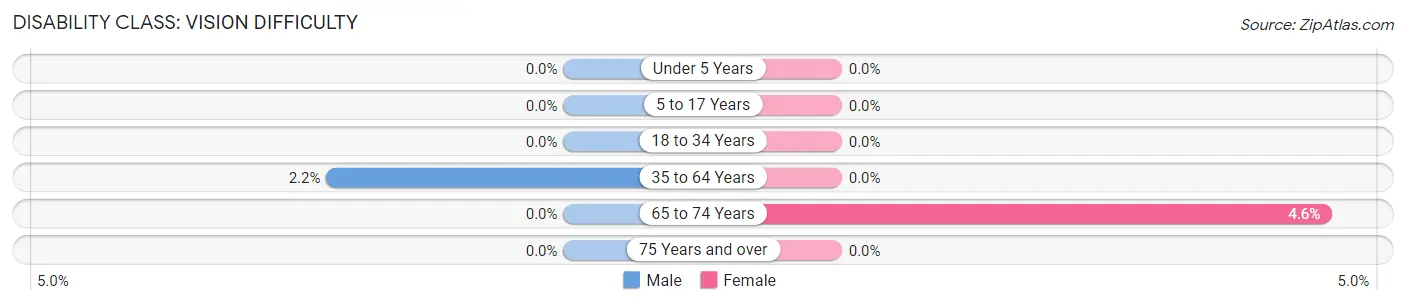
| Age Bracket | Male | Female |
| Under 5 Years | 0 (0.0%) | 0 (0.0%) |
| 5 to 17 Years | 0 (0.0%) | 0 (0.0%) |
| 18 to 34 Years | 0 (0.0%) | 0 (0.0%) |
| 35 to 64 Years | 9 (2.2%) | 0 (0.0%) |
| 65 to 74 Years | 0 (0.0%) | 6 (4.5%) |
| 75 Years and over | 0 (0.0%) | 0 (0.0%) |
Disability Class: Cognitive Difficulty
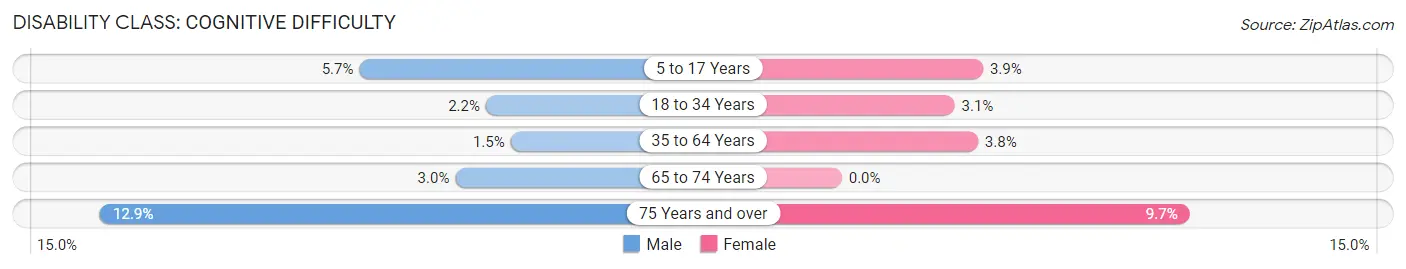
| Age Bracket | Male | Female |
| 5 to 17 Years | 15 (5.7%) | 9 (3.9%) |
| 18 to 34 Years | 5 (2.2%) | 8 (3.1%) |
| 35 to 64 Years | 6 (1.5%) | 14 (3.8%) |
| 65 to 74 Years | 4 (3.0%) | 0 (0.0%) |
| 75 Years and over | 12 (12.9%) | 9 (9.7%) |
Disability Class: Ambulatory Difficulty
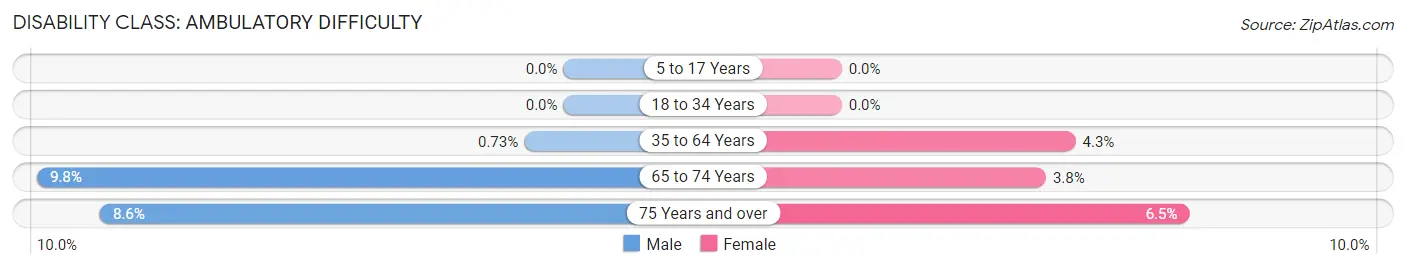
| Age Bracket | Male | Female |
| 5 to 17 Years | 0 (0.0%) | 0 (0.0%) |
| 18 to 34 Years | 0 (0.0%) | 0 (0.0%) |
| 35 to 64 Years | 3 (0.7%) | 16 (4.3%) |
| 65 to 74 Years | 13 (9.8%) | 5 (3.8%) |
| 75 Years and over | 8 (8.6%) | 6 (6.5%) |
Disability Class: Self-Care Difficulty
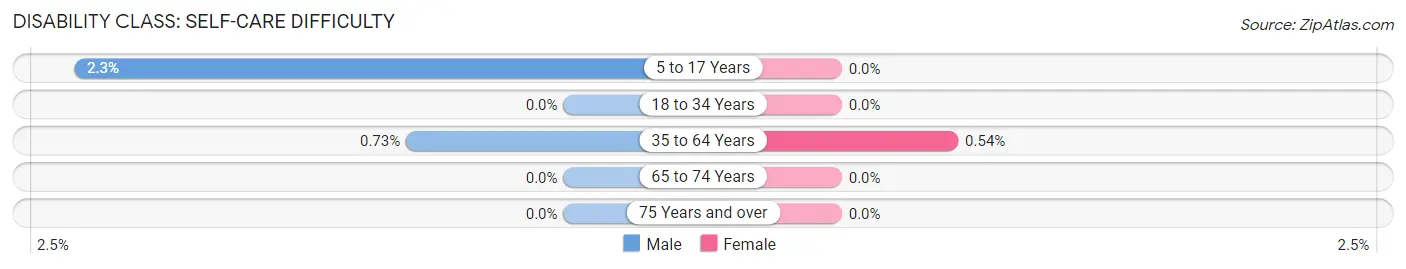
| Age Bracket | Male | Female |
| 5 to 17 Years | 6 (2.3%) | 0 (0.0%) |
| 18 to 34 Years | 0 (0.0%) | 0 (0.0%) |
| 35 to 64 Years | 3 (0.7%) | 2 (0.5%) |
| 65 to 74 Years | 0 (0.0%) | 0 (0.0%) |
| 75 Years and over | 0 (0.0%) | 0 (0.0%) |
Technology Access in Beresford
Computing Device Access in Beresford
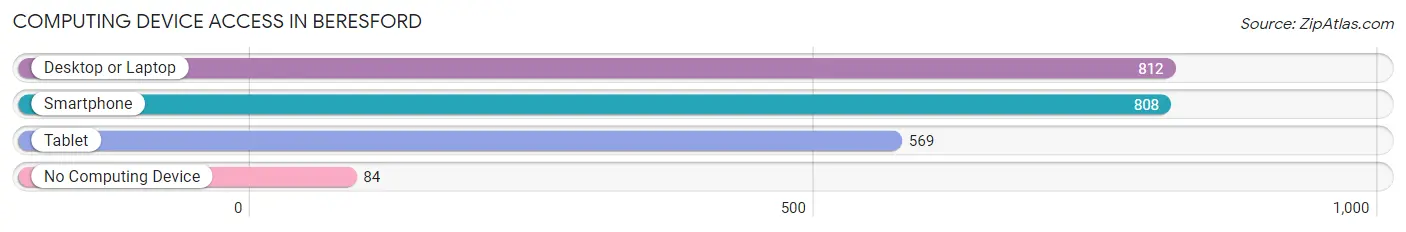
| Device Type | # Households | % Households |
| Desktop or Laptop | 812 | 84.4% |
| Smartphone | 808 | 84.0% |
| Tablet | 569 | 59.2% |
| No Computing Device | 84 | 8.7% |
| Total | 962 | 100.0% |
Internet Access in Beresford
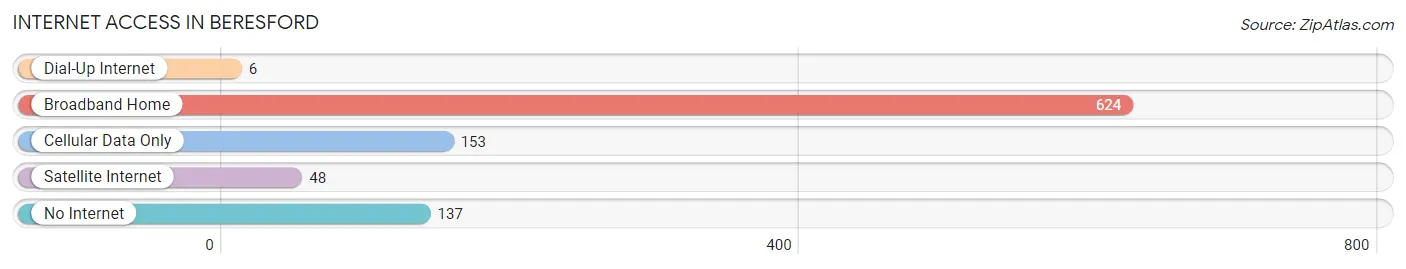
| Internet Type | # Households | % Households |
| Dial-Up Internet | 6 | 0.6% |
| Broadband Home | 624 | 64.9% |
| Cellular Data Only | 153 | 15.9% |
| Satellite Internet | 48 | 5.0% |
| No Internet | 137 | 14.2% |
| Total | 962 | 100.0% |
Beresford Summary
Beresford, South Dakota is a small city located in Union County, South Dakota. It is situated along the Big Sioux River, about 20 miles south of Sioux Falls. The city has a population of approximately 2,500 people and is the county seat of Union County.
History
Beresford was founded in 1881 by a group of settlers from Wisconsin. The city was named after the Beresford family, who were among the first settlers in the area. The city was incorporated in 1883 and was the first city in Union County.
The city was originally a farming community, but in the early 1900s, the railroad came to town and the city began to grow. The railroad brought new businesses and industries to the area, and the city began to thrive.
In the 1950s, Beresford began to experience a population boom, as many people moved to the city from other parts of the state. This growth continued into the 1960s and 1970s, and the city's population reached its peak in the 1980s.
Geography
Beresford is located in the southeastern corner of South Dakota, about 20 miles south of Sioux Falls. The city is situated along the Big Sioux River, and is surrounded by rolling hills and farmland. The city has a total area of 2.2 square miles, all of which is land.
The climate in Beresford is typical of the Midwest, with hot summers and cold winters. The average temperature in the summer is around 80 degrees Fahrenheit, and the average temperature in the winter is around 20 degrees Fahrenheit.
Economy
Beresford's economy is largely based on agriculture and manufacturing. The city is home to several large agricultural companies, including Cargill, ADM, and Tyson Foods. The city also has several manufacturing companies, including a plastics plant and a metal fabrication plant.
Beresford also has a thriving retail sector, with several stores and restaurants located in the downtown area. The city also has a number of small businesses, including a local newspaper, a hardware store, and a variety of other shops.
Demographics
As of the 2010 census, Beresford had a population of 2,500 people. The racial makeup of the city was 97.2% White, 0.8% African American, 0.4% Native American, 0.4% Asian, and 0.2% from other races. Hispanic or Latino of any race were 1.2% of the population.
The median income for a household in Beresford was $41,250, and the median income for a family was $50,000. The per capita income for the city was $20,845. About 8.2% of families and 10.2% of the population were below the poverty line, including 14.2% of those under age 18 and 6.2% of those age 65 or over.
Beresford is a small city with a rich history and a vibrant economy. The city is home to a diverse population, and is a great place to live and work. With its close proximity to Sioux Falls, Beresford is a great place to call home.
Common Questions
What is Per Capita Income in Beresford?
Per Capita income in Beresford is $33,094.
What is the Median Family Income in Beresford?
Median Family Income in Beresford is $81,667.
What is the Median Household income in Beresford?
Median Household Income in Beresford is $71,343.
What is Income or Wage Gap in Beresford?
Income or Wage Gap in Beresford is 28.4%.
Women in Beresford earn 71.6 cents for every dollar earned by a man.
What is Inequality or Gini Index in Beresford?
Inequality or Gini Index in Beresford is 0.33.
What is the Total Population of Beresford?
Total Population of Beresford is 2,419.
What is the Total Male Population of Beresford?
Total Male Population of Beresford is 1,225.
What is the Total Female Population of Beresford?
Total Female Population of Beresford is 1,194.
What is the Ratio of Males per 100 Females in Beresford?
There are 102.60 Males per 100 Females in Beresford.
What is the Ratio of Females per 100 Males in Beresford?
There are 97.47 Females per 100 Males in Beresford.
What is the Median Population Age in Beresford?
Median Population Age in Beresford is 37.6 Years.
What is the Average Family Size in Beresford
Average Family Size in Beresford is 3.0 People.
What is the Average Household Size in Beresford
Average Household Size in Beresford is 2.5 People.
How Large is the Labor Force in Beresford?
There are 1,313 People in the Labor Forcein in Beresford.
What is the Percentage of People in the Labor Force in Beresford?
72.8% of People are in the Labor Force in Beresford.
What is the Unemployment Rate in Beresford?
Unemployment Rate in Beresford is 4.9%.