Clark, SD Map & Demographics
Clark Map
Clark Overview
$35,170
PER CAPITA INCOME
$69,688
AVG FAMILY INCOME
$47,305
AVG HOUSEHOLD INCOME
41.4%
WAGE / INCOME GAP [ % ]
58.6¢/ $1
WAGE / INCOME GAP [ $ ]
0.45
INEQUALITY / GINI INDEX
1,206
TOTAL POPULATION
551
MALE POPULATION
655
FEMALE POPULATION
84.12
MALES / 100 FEMALES
118.87
FEMALES / 100 MALES
49.4
MEDIAN AGE
3.0
AVG FAMILY SIZE
2.3
AVG HOUSEHOLD SIZE
576
LABOR FORCE [ PEOPLE ]
58.5%
PERCENT IN LABOR FORCE
4.3%
UNEMPLOYMENT RATE
Clark Zip Codes
Clark Area Codes
Income in Clark
Income Overview in Clark
Per Capita Income in Clark is $35,170, while median incomes of families and households are $69,688 and $47,305 respectively.
| Characteristic | Number | Measure |
| Per Capita Income | 1,206 | $35,170 |
| Median Family Income | 259 | $69,688 |
| Mean Family Income | 259 | $86,978 |
| Median Household Income | 495 | $47,305 |
| Mean Household Income | 495 | $72,768 |
| Income Deficit | 259 | $0 |
| Wage / Income Gap (%) | 1,206 | 41.44% |
| Wage / Income Gap ($) | 1,206 | 58.56¢ per $1 |
| Gini / Inequality Index | 1,206 | 0.45 |
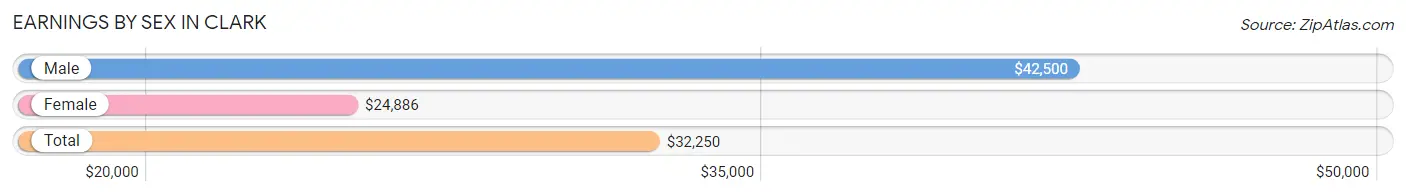
Earnings by Sex in Clark
Average Earnings in Clark are $32,250, $42,500 for men and $24,886 for women, a difference of 41.4%.
| Sex | Number | Average Earnings |
| Male | 312 (51.2%) | $42,500 |
| Female | 297 (48.8%) | $24,886 |
| Total | 609 (100.0%) | $32,250 |
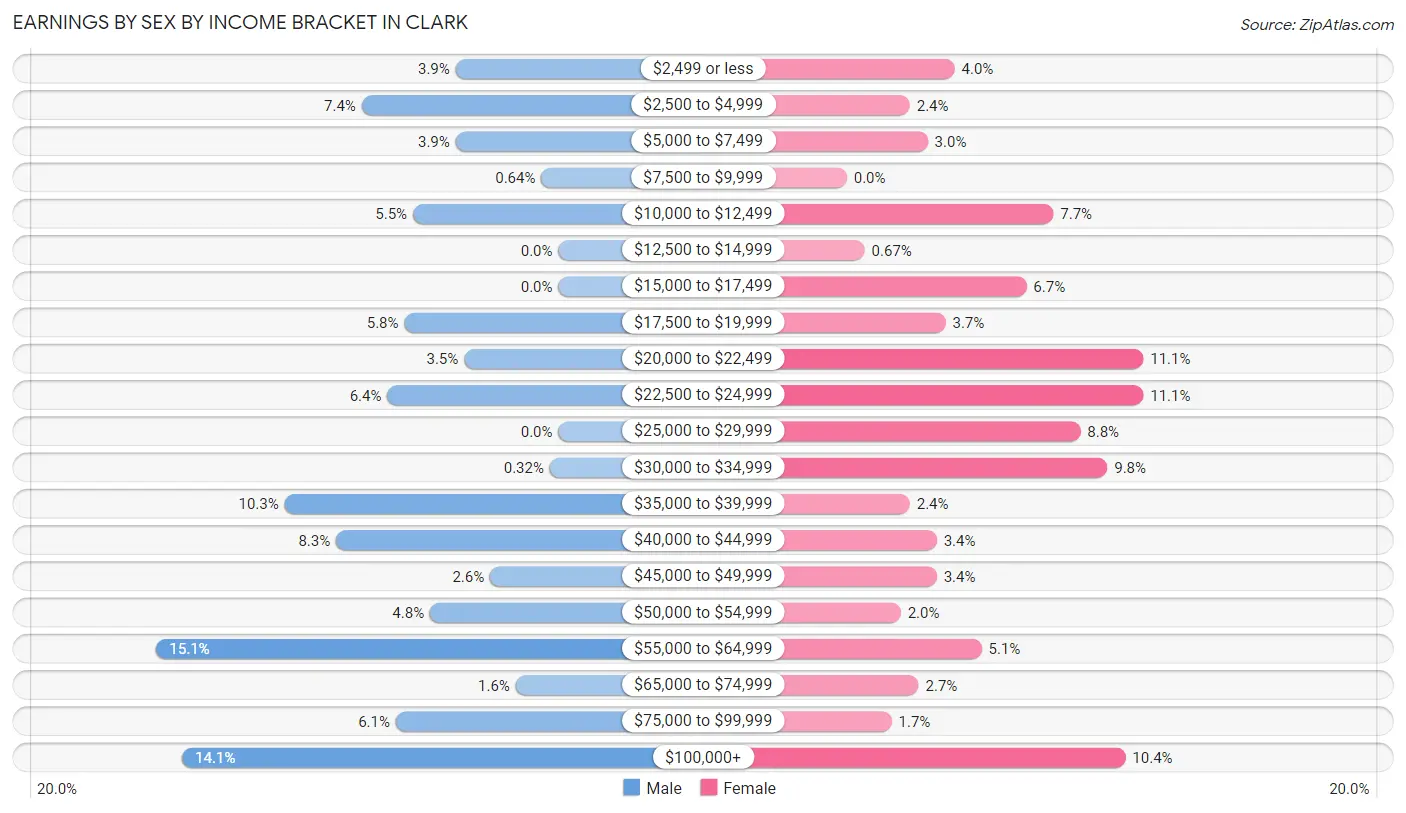
Earnings by Sex by Income Bracket in Clark
The most common earnings brackets in Clark are $55,000 to $64,999 for men (47 | 15.1%) and $20,000 to $22,499 for women (33 | 11.1%).
| Income | Male | Female |
| $2,499 or less | 12 (3.8%) | 12 (4.0%) |
| $2,500 to $4,999 | 23 (7.4%) | 7 (2.4%) |
| $5,000 to $7,499 | 12 (3.8%) | 9 (3.0%) |
| $7,500 to $9,999 | 2 (0.6%) | 0 (0.0%) |
| $10,000 to $12,499 | 17 (5.4%) | 23 (7.7%) |
| $12,500 to $14,999 | 0 (0.0%) | 2 (0.7%) |
| $15,000 to $17,499 | 0 (0.0%) | 20 (6.7%) |
| $17,500 to $19,999 | 18 (5.8%) | 11 (3.7%) |
| $20,000 to $22,499 | 11 (3.5%) | 33 (11.1%) |
| $22,500 to $24,999 | 20 (6.4%) | 33 (11.1%) |
| $25,000 to $29,999 | 0 (0.0%) | 26 (8.7%) |
| $30,000 to $34,999 | 1 (0.3%) | 29 (9.8%) |
| $35,000 to $39,999 | 32 (10.3%) | 7 (2.4%) |
| $40,000 to $44,999 | 26 (8.3%) | 10 (3.4%) |
| $45,000 to $49,999 | 8 (2.6%) | 10 (3.4%) |
| $50,000 to $54,999 | 15 (4.8%) | 6 (2.0%) |
| $55,000 to $64,999 | 47 (15.1%) | 15 (5.1%) |
| $65,000 to $74,999 | 5 (1.6%) | 8 (2.7%) |
| $75,000 to $99,999 | 19 (6.1%) | 5 (1.7%) |
| $100,000+ | 44 (14.1%) | 31 (10.4%) |
| Total | 312 (100.0%) | 297 (100.0%) |
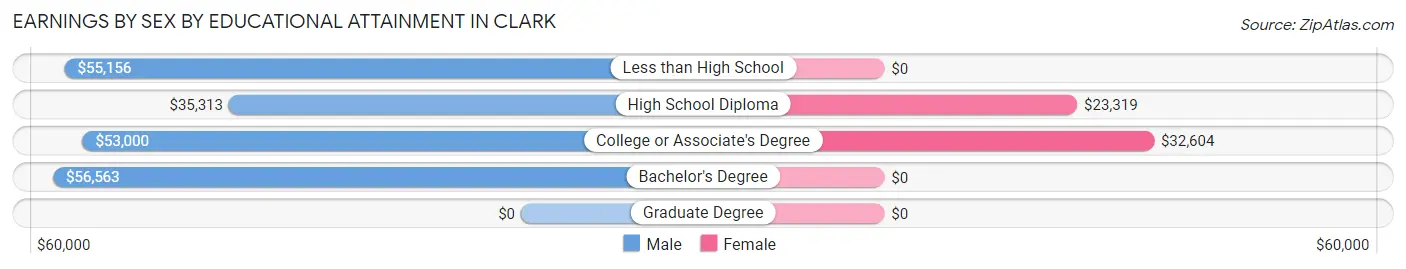
Earnings by Sex by Educational Attainment in Clark
Average earnings in Clark are $45,833 for men and $28,413 for women, a difference of 38.0%. Men with an educational attainment of bachelor's degree enjoy the highest average annual earnings of $56,563, while those with high school diploma education earn the least with $35,313. Women with an educational attainment of college or associate's degree earn the most with the average annual earnings of $32,604, while those with high school diploma education have the smallest earnings of $23,319.
| Educational Attainment | Male Income | Female Income |
| Less than High School | $55,156 | $0 |
| High School Diploma | $35,313 | $23,319 |
| College or Associate's Degree | $53,000 | $32,604 |
| Bachelor's Degree | $56,563 | $0 |
| Graduate Degree | - | - |
| Total | $45,833 | $28,413 |
Family Income in Clark
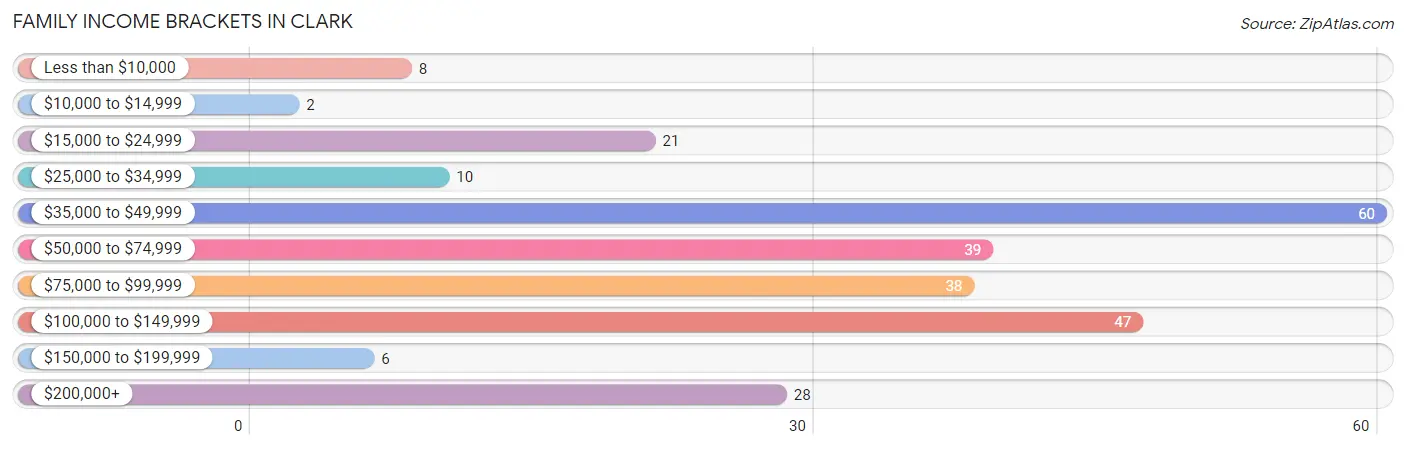
Family Income Brackets in Clark
According to the Clark family income data, there are 60 families falling into the $35,000 to $49,999 income range, which is the most common income bracket and makes up 23.2% of all families. Conversely, the $10,000 to $14,999 income bracket is the least frequent group with only 2 families (0.8%) belonging to this category.
| Income Bracket | # Families | % Families |
| Less than $10,000 | 8 | 3.1% |
| $10,000 to $14,999 | 2 | 0.8% |
| $15,000 to $24,999 | 21 | 8.1% |
| $25,000 to $34,999 | 10 | 3.9% |
| $35,000 to $49,999 | 60 | 23.2% |
| $50,000 to $74,999 | 39 | 15.1% |
| $75,000 to $99,999 | 38 | 14.7% |
| $100,000 to $149,999 | 47 | 18.1% |
| $150,000 to $199,999 | 6 | 2.3% |
| $200,000+ | 28 | 10.8% |
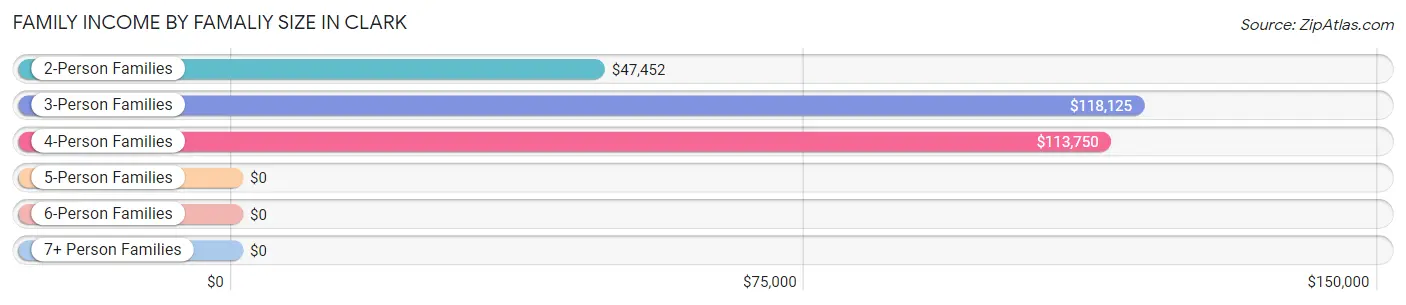
Family Income by Famaliy Size in Clark
3-person families (19 | 7.3%) account for the highest median family income in Clark with $118,125 per family, while 3-person families (19 | 7.3%) have the highest median income of $39,375 per family member.
| Income Bracket | # Families | Median Income |
| 2-Person Families | 189 (73.0%) | $47,452 |
| 3-Person Families | 19 (7.3%) | $118,125 |
| 4-Person Families | 32 (12.4%) | $113,750 |
| 5-Person Families | 4 (1.5%) | $0 |
| 6-Person Families | 15 (5.8%) | $0 |
| 7+ Person Families | 0 (0.0%) | $0 |
| Total | 259 (100.0%) | $69,688 |
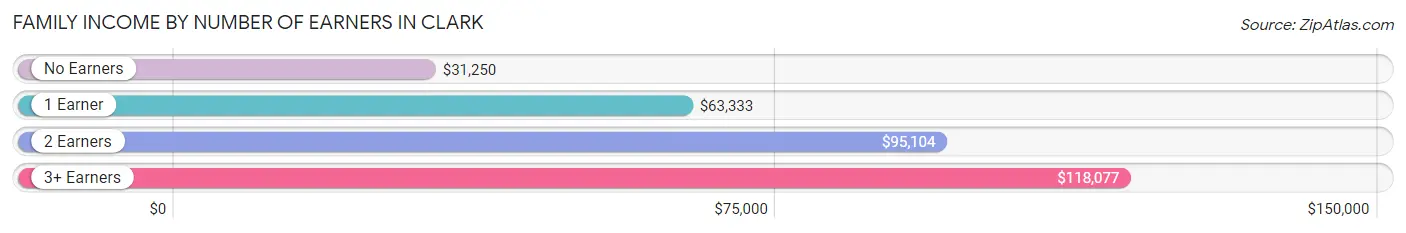
Family Income by Number of Earners in Clark
The median family income in Clark is $69,688, with families comprising 3+ earners (20) having the highest median family income of $118,077, while families with no earners (38) have the lowest median family income of $31,250, accounting for 7.7% and 14.7% of families, respectively.
| Number of Earners | # Families | Median Income |
| No Earners | 38 (14.7%) | $31,250 |
| 1 Earner | 68 (26.3%) | $63,333 |
| 2 Earners | 133 (51.3%) | $95,104 |
| 3+ Earners | 20 (7.7%) | $118,077 |
| Total | 259 (100.0%) | $69,688 |
Household Income in Clark
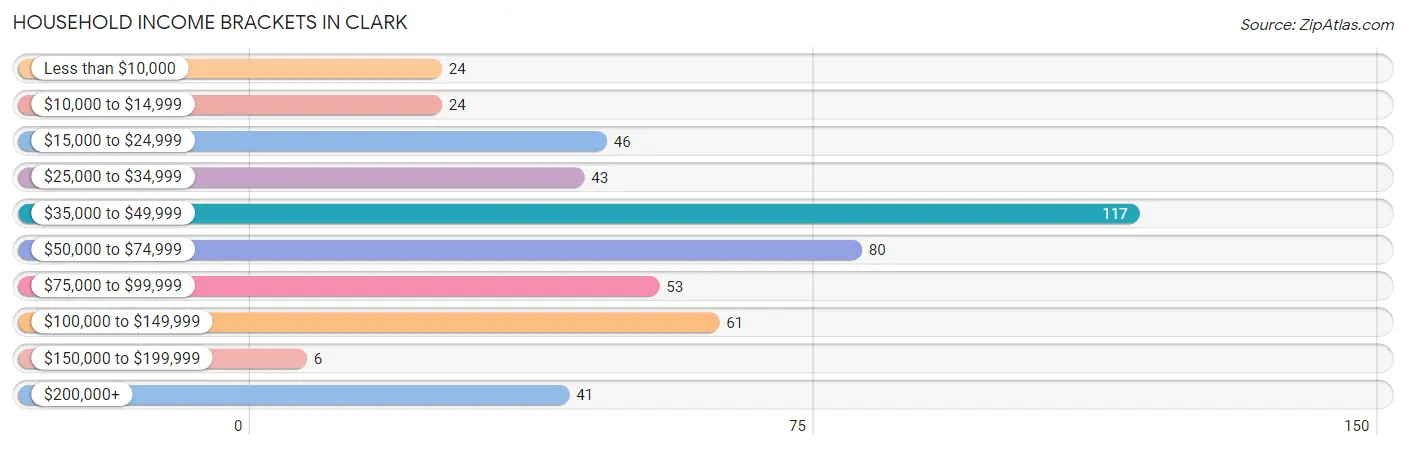
Household Income Brackets in Clark
With 117 households falling in the category, the $35,000 to $49,999 income range is the most frequent in Clark, accounting for 23.6% of all households. In contrast, only 6 households (1.2%) fall into the $150,000 to $199,999 income bracket, making it the least populous group.
| Income Bracket | # Households | % Households |
| Less than $10,000 | 24 | 4.8% |
| $10,000 to $14,999 | 24 | 4.8% |
| $15,000 to $24,999 | 46 | 9.3% |
| $25,000 to $34,999 | 43 | 8.7% |
| $35,000 to $49,999 | 117 | 23.6% |
| $50,000 to $74,999 | 80 | 16.2% |
| $75,000 to $99,999 | 53 | 10.7% |
| $100,000 to $149,999 | 61 | 12.3% |
| $150,000 to $199,999 | 6 | 1.2% |
| $200,000+ | 41 | 8.3% |
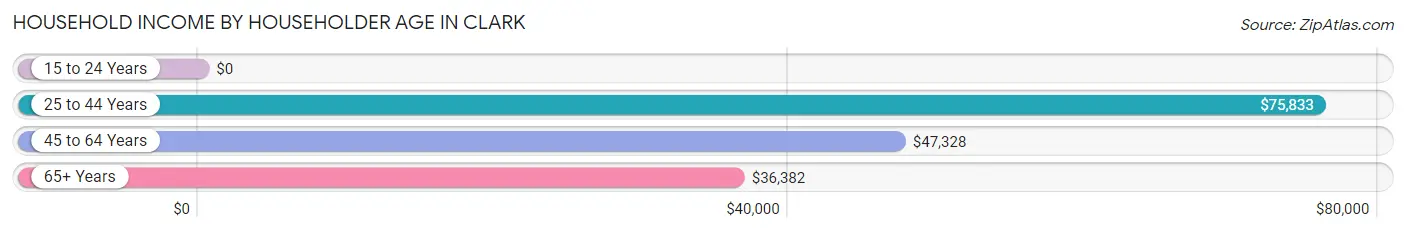
Household Income by Householder Age in Clark
The median household income in Clark is $47,305, with the highest median household income of $75,833 found in the 25 to 44 years age bracket for the primary householder. A total of 134 households (27.1%) fall into this category. Meanwhile, the 15 to 24 years age bracket for the primary householder has the lowest median household income of $0, with 18 households (3.6%) in this group.
| Income Bracket | # Households | Median Income |
| 15 to 24 Years | 18 (3.6%) | $0 |
| 25 to 44 Years | 134 (27.1%) | $75,833 |
| 45 to 64 Years | 160 (32.3%) | $47,328 |
| 65+ Years | 183 (37.0%) | $36,382 |
| Total | 495 (100.0%) | $47,305 |
Poverty in Clark
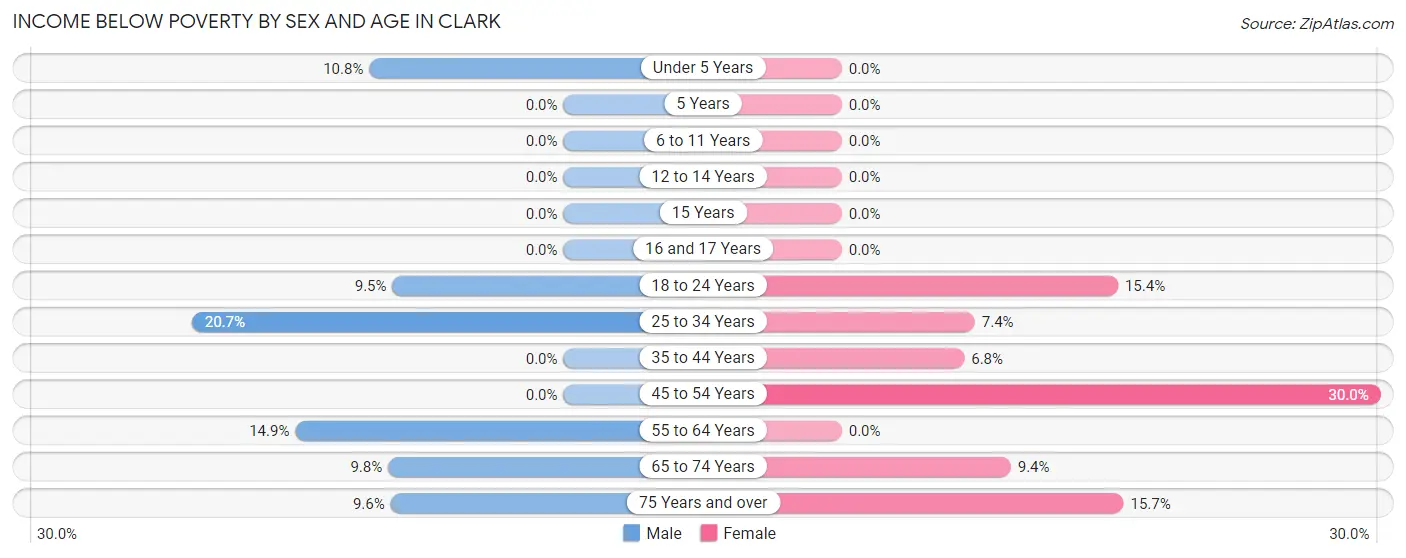
Income Below Poverty by Sex and Age in Clark
With 8.0% poverty level for males and 9.7% for females among the residents of Clark, 25 to 34 year old males and 45 to 54 year old females are the most vulnerable to poverty, with 12 males (20.7%) and 21 females (30.0%) in their respective age groups living below the poverty level.
| Age Bracket | Male | Female |
| Under 5 Years | 4 (10.8%) | 0 (0.0%) |
| 5 Years | 0 (0.0%) | 0 (0.0%) |
| 6 to 11 Years | 0 (0.0%) | 0 (0.0%) |
| 12 to 14 Years | 0 (0.0%) | 0 (0.0%) |
| 15 Years | 0 (0.0%) | 0 (0.0%) |
| 16 and 17 Years | 0 (0.0%) | 0 (0.0%) |
| 18 to 24 Years | 4 (9.5%) | 4 (15.4%) |
| 25 to 34 Years | 12 (20.7%) | 6 (7.4%) |
| 35 to 44 Years | 0 (0.0%) | 3 (6.8%) |
| 45 to 54 Years | 0 (0.0%) | 21 (30.0%) |
| 55 to 64 Years | 10 (14.9%) | 0 (0.0%) |
| 65 to 74 Years | 8 (9.8%) | 8 (9.4%) |
| 75 Years and over | 5 (9.6%) | 16 (15.7%) |
| Total | 43 (8.0%) | 58 (9.7%) |
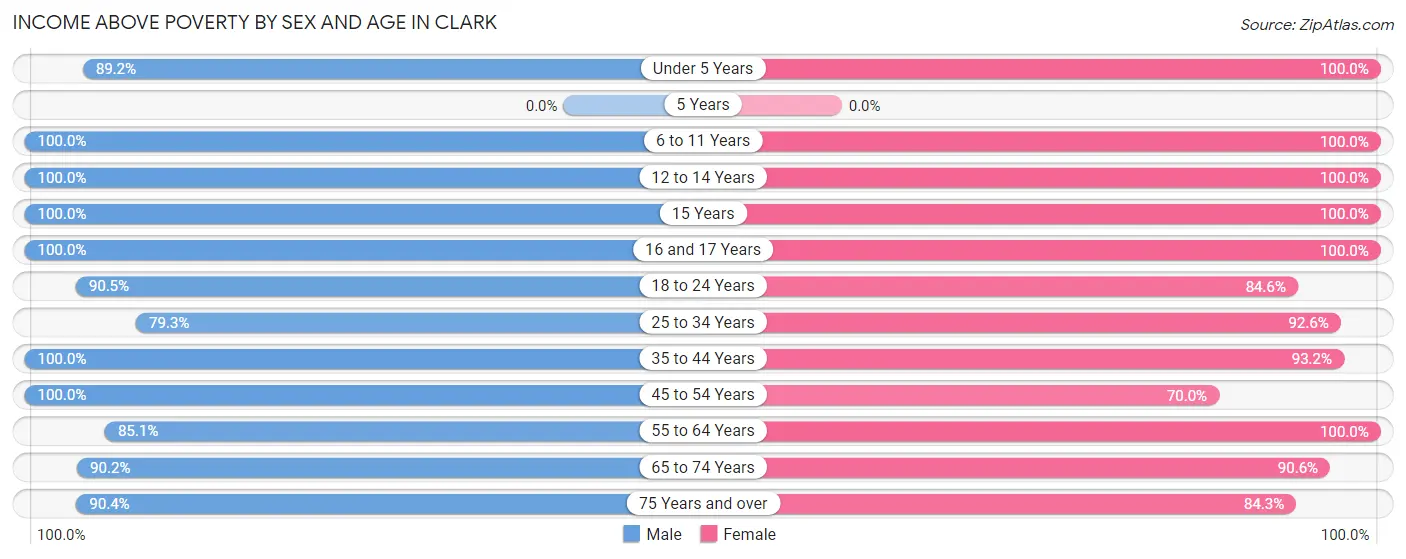
Income Above Poverty by Sex and Age in Clark
According to the poverty statistics in Clark, males aged 6 to 11 years and females aged under 5 years are the age groups that are most secure financially, with 100.0% of males and 100.0% of females in these age groups living above the poverty line.
| Age Bracket | Male | Female |
| Under 5 Years | 33 (89.2%) | 25 (100.0%) |
| 5 Years | 0 (0.0%) | 0 (0.0%) |
| 6 to 11 Years | 54 (100.0%) | 14 (100.0%) |
| 12 to 14 Years | 26 (100.0%) | 41 (100.0%) |
| 15 Years | 6 (100.0%) | 19 (100.0%) |
| 16 and 17 Years | 6 (100.0%) | 3 (100.0%) |
| 18 to 24 Years | 38 (90.5%) | 22 (84.6%) |
| 25 to 34 Years | 46 (79.3%) | 75 (92.6%) |
| 35 to 44 Years | 57 (100.0%) | 41 (93.2%) |
| 45 to 54 Years | 53 (100.0%) | 49 (70.0%) |
| 55 to 64 Years | 57 (85.1%) | 88 (100.0%) |
| 65 to 74 Years | 74 (90.2%) | 77 (90.6%) |
| 75 Years and over | 47 (90.4%) | 86 (84.3%) |
| Total | 497 (92.0%) | 540 (90.3%) |
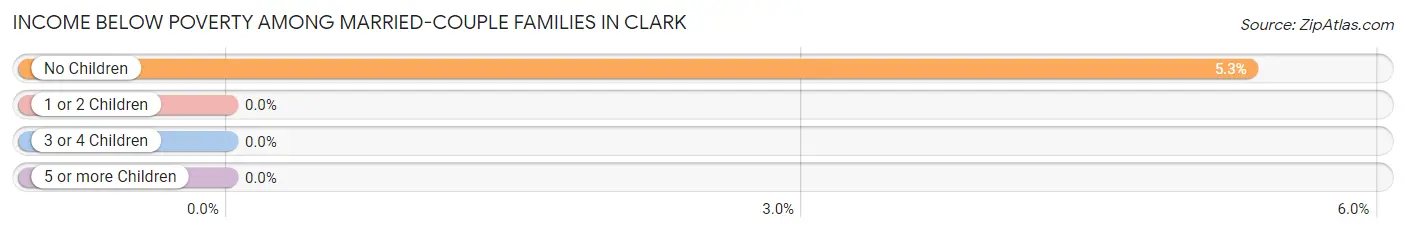
Income Below Poverty Among Married-Couple Families in Clark
The poverty statistics for married-couple families in Clark show that 3.8% or 8 of the total 211 families live below the poverty line. Families with no children have the highest poverty rate of 5.3%, comprising of 8 families. On the other hand, families with 1 or 2 children have the lowest poverty rate of 0.0%, which includes 0 families.
| Children | Above Poverty | Below Poverty |
| No Children | 142 (94.7%) | 8 (5.3%) |
| 1 or 2 Children | 56 (100.0%) | 0 (0.0%) |
| 3 or 4 Children | 5 (100.0%) | 0 (0.0%) |
| 5 or more Children | 0 (0.0%) | 0 (0.0%) |
| Total | 203 (96.2%) | 8 (3.8%) |
Income Below Poverty Among Single-Parent Households in Clark
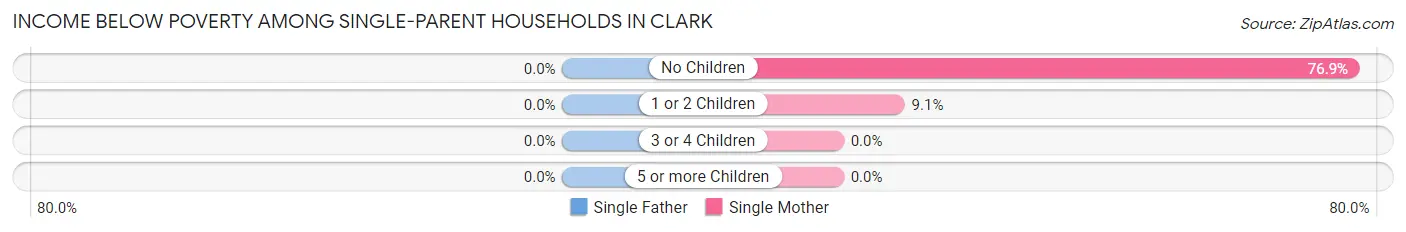
| Children | Single Father | Single Mother |
| No Children | 0 (0.0%) | 10 (76.9%) |
| 1 or 2 Children | 0 (0.0%) | 2 (9.1%) |
| 3 or 4 Children | 0 (0.0%) | 0 (0.0%) |
| 5 or more Children | 0 (0.0%) | 0 (0.0%) |
| Total | 0 (0.0%) | 12 (34.3%) |
Income Below Poverty Among Married-Couple vs Single-Parent Households in Clark
The poverty data for Clark shows that 8 of the married-couple family households (3.8%) and 12 of the single-parent households (25.0%) are living below the poverty level. Within the married-couple family households, those with no children have the highest poverty rate, with 8 households (5.3%) falling below the poverty line. Among the single-parent households, those with no children have the highest poverty rate, with 10 household (66.7%) living below poverty.
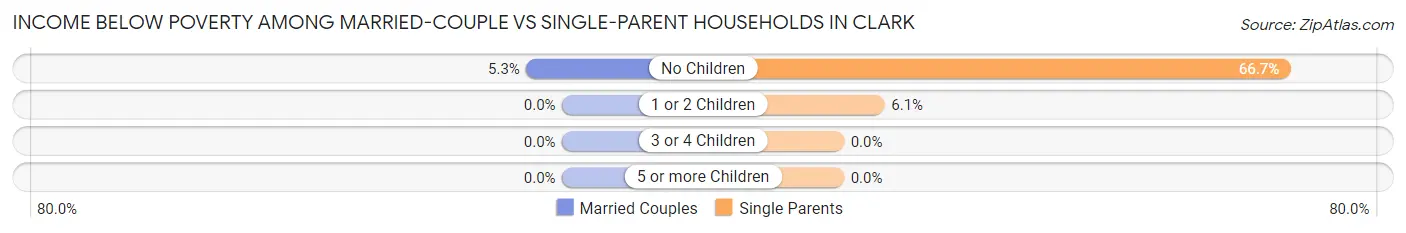
| Children | Married-Couple Families | Single-Parent Households |
| No Children | 8 (5.3%) | 10 (66.7%) |
| 1 or 2 Children | 0 (0.0%) | 2 (6.1%) |
| 3 or 4 Children | 0 (0.0%) | 0 (0.0%) |
| 5 or more Children | 0 (0.0%) | 0 (0.0%) |
| Total | 8 (3.8%) | 12 (25.0%) |
Race in Clark
The most populous races in Clark are White / Caucasian (1,064 | 88.2%), Two or more Races (110 | 9.1%), and Hispanic or Latino (99 | 8.2%).
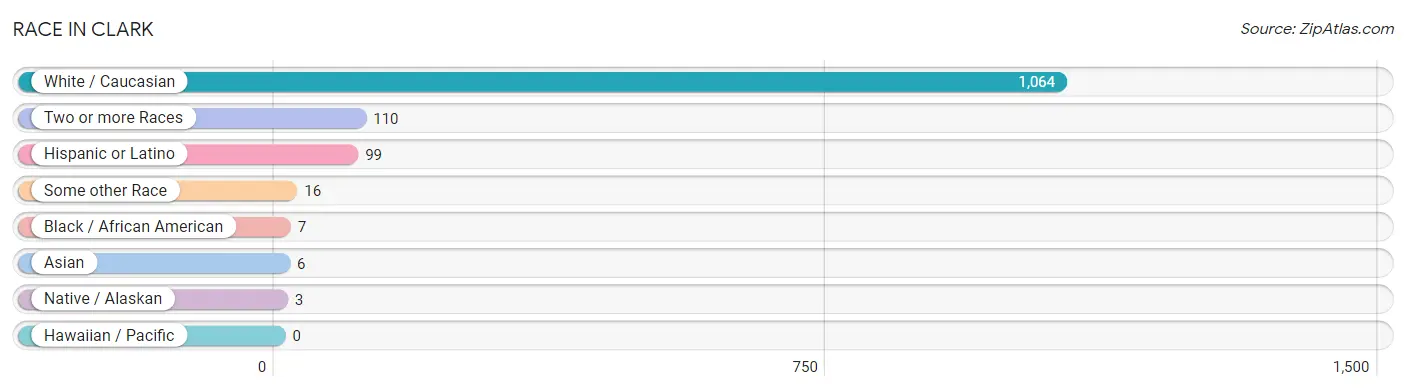
| Race | # Population | % Population |
| Asian | 6 | 0.5% |
| Black / African American | 7 | 0.6% |
| Hawaiian / Pacific | 0 | 0.0% |
| Hispanic or Latino | 99 | 8.2% |
| Native / Alaskan | 3 | 0.3% |
| White / Caucasian | 1,064 | 88.2% |
| Two or more Races | 110 | 9.1% |
| Some other Race | 16 | 1.3% |
| Total | 1,206 | 100.0% |
Ancestry in Clark
The most populous ancestries reported in Clark are German (551 | 45.7%), Norwegian (233 | 19.3%), English (147 | 12.2%), Irish (146 | 12.1%), and Swedish (80 | 6.6%), together accounting for 95.9% of all Clark residents.
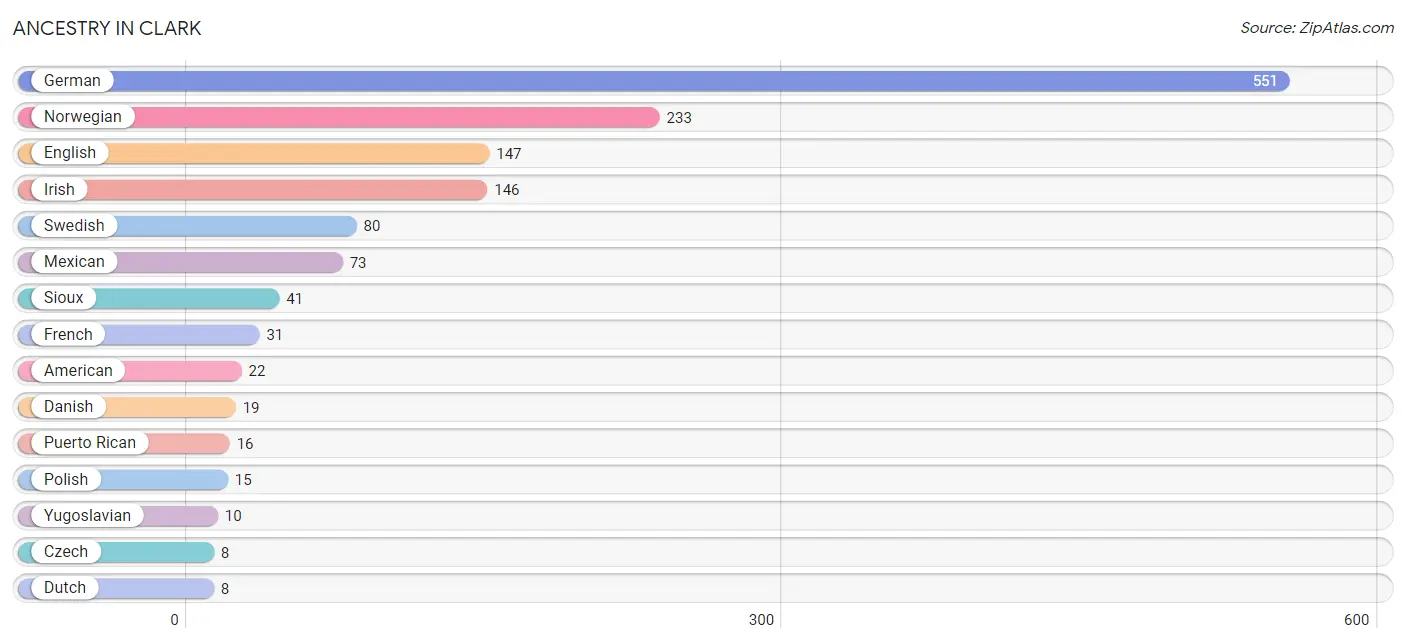
| Ancestry | # Population | % Population |
| American | 22 | 1.8% |
| Arab | 1 | 0.1% |
| British | 2 | 0.2% |
| Czech | 8 | 0.7% |
| Danish | 19 | 1.6% |
| Dutch | 8 | 0.7% |
| English | 147 | 12.2% |
| Finnish | 4 | 0.3% |
| French | 31 | 2.6% |
| French Canadian | 5 | 0.4% |
| German | 551 | 45.7% |
| Irish | 146 | 12.1% |
| Italian | 3 | 0.3% |
| Korean | 6 | 0.5% |
| Mexican | 73 | 6.0% |
| New Zealander | 6 | 0.5% |
| Norwegian | 233 | 19.3% |
| Polish | 15 | 1.2% |
| Puerto Rican | 16 | 1.3% |
| Russian | 5 | 0.4% |
| Scandinavian | 5 | 0.4% |
| Scotch-Irish | 8 | 0.7% |
| Scottish | 4 | 0.3% |
| Sioux | 41 | 3.4% |
| Spaniard | 2 | 0.2% |
| Subsaharan African | 1 | 0.1% |
| Swedish | 80 | 6.6% |
| Ugandan | 1 | 0.1% |
| Yugoslavian | 10 | 0.8% | View All 29 Rows |
Immigrants in Clark
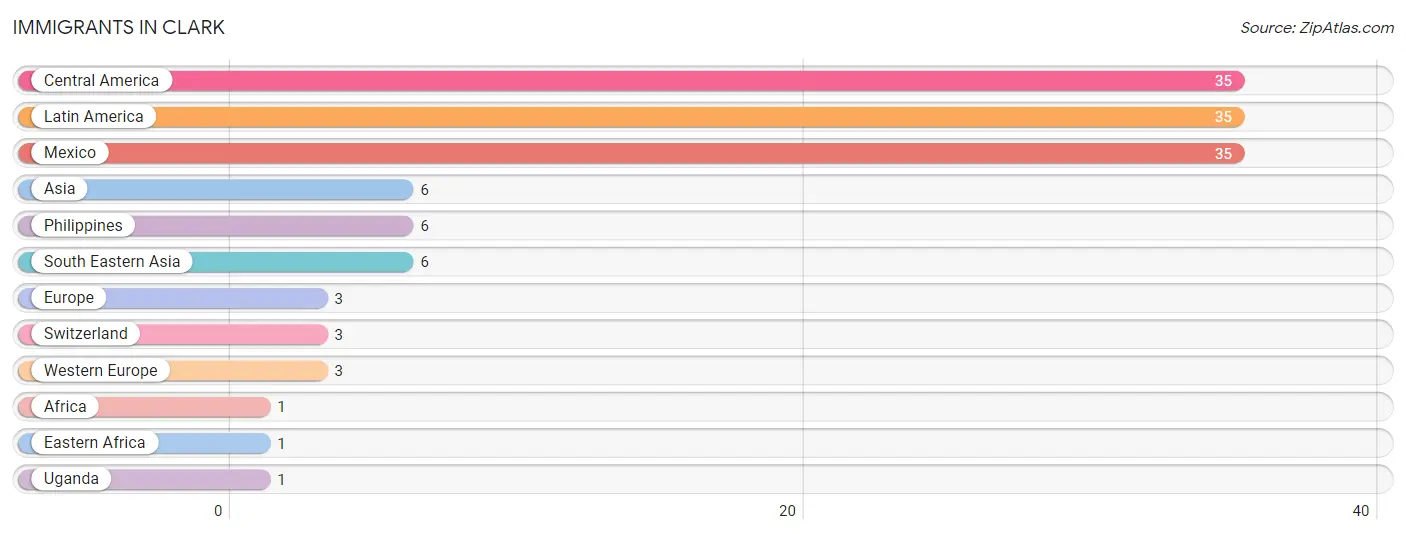
The most numerous immigrant groups reported in Clark came from Central America (35 | 2.9%), Latin America (35 | 2.9%), Mexico (35 | 2.9%), Asia (6 | 0.5%), and Philippines (6 | 0.5%), together accounting for 9.7% of all Clark residents.
| Immigration Origin | # Population | % Population |
| Africa | 1 | 0.1% |
| Asia | 6 | 0.5% |
| Central America | 35 | 2.9% |
| Eastern Africa | 1 | 0.1% |
| Europe | 3 | 0.3% |
| Latin America | 35 | 2.9% |
| Mexico | 35 | 2.9% |
| Philippines | 6 | 0.5% |
| South Eastern Asia | 6 | 0.5% |
| Switzerland | 3 | 0.3% |
| Uganda | 1 | 0.1% |
| Western Europe | 3 | 0.3% | View All 12 Rows |
Sex and Age in Clark
Sex and Age in Clark
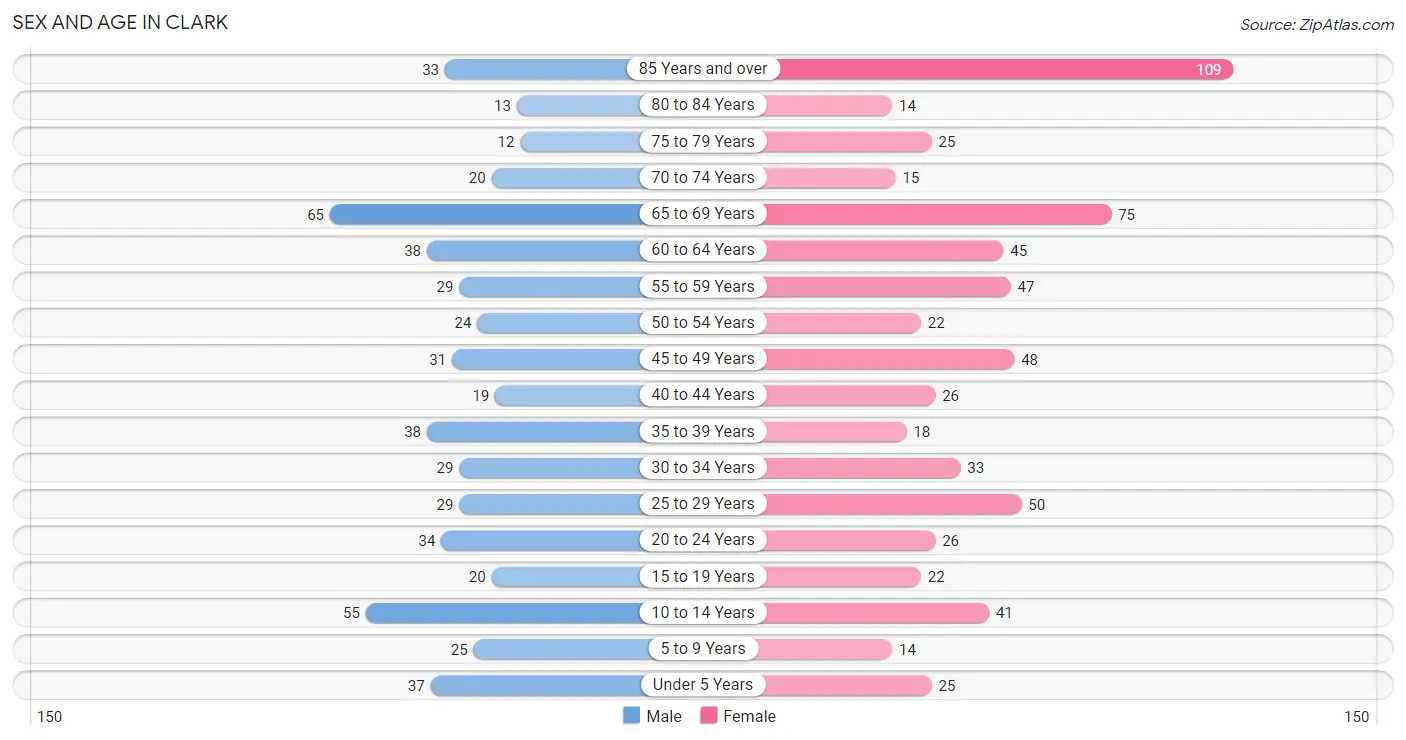
The most populous age groups in Clark are 65 to 69 Years (65 | 11.8%) for men and 85 Years and over (109 | 16.6%) for women.
| Age Bracket | Male | Female |
| Under 5 Years | 37 (6.7%) | 25 (3.8%) |
| 5 to 9 Years | 25 (4.5%) | 14 (2.1%) |
| 10 to 14 Years | 55 (10.0%) | 41 (6.3%) |
| 15 to 19 Years | 20 (3.6%) | 22 (3.4%) |
| 20 to 24 Years | 34 (6.2%) | 26 (4.0%) |
| 25 to 29 Years | 29 (5.3%) | 50 (7.6%) |
| 30 to 34 Years | 29 (5.3%) | 33 (5.0%) |
| 35 to 39 Years | 38 (6.9%) | 18 (2.8%) |
| 40 to 44 Years | 19 (3.5%) | 26 (4.0%) |
| 45 to 49 Years | 31 (5.6%) | 48 (7.3%) |
| 50 to 54 Years | 24 (4.4%) | 22 (3.4%) |
| 55 to 59 Years | 29 (5.3%) | 47 (7.2%) |
| 60 to 64 Years | 38 (6.9%) | 45 (6.9%) |
| 65 to 69 Years | 65 (11.8%) | 75 (11.5%) |
| 70 to 74 Years | 20 (3.6%) | 15 (2.3%) |
| 75 to 79 Years | 12 (2.2%) | 25 (3.8%) |
| 80 to 84 Years | 13 (2.4%) | 14 (2.1%) |
| 85 Years and over | 33 (6.0%) | 109 (16.6%) |
| Total | 551 (100.0%) | 655 (100.0%) |
Families and Households in Clark
Median Family Size in Clark
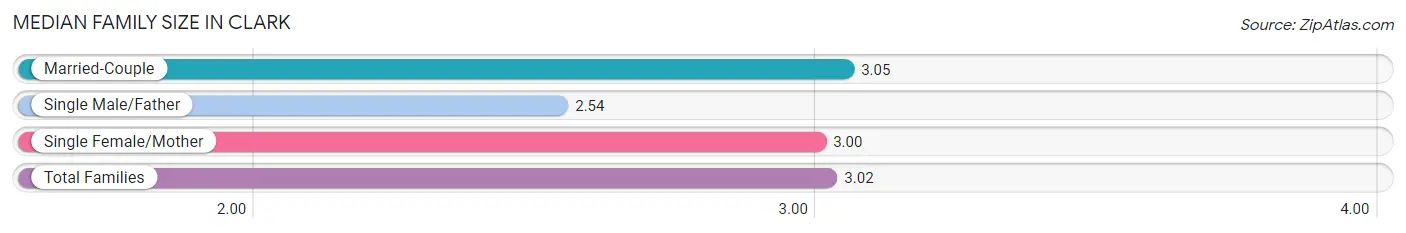
The median family size in Clark is 3.02 persons per family, with married-couple families (211 | 81.5%) accounting for the largest median family size of 3.05 persons per family. On the other hand, single male/father families (13 | 5.0%) represent the smallest median family size with 2.54 persons per family.
| Family Type | # Families | Family Size |
| Married-Couple | 211 (81.5%) | 3.05 |
| Single Male/Father | 13 (5.0%) | 2.54 |
| Single Female/Mother | 35 (13.5%) | 3.00 |
| Total Families | 259 (100.0%) | 3.02 |
Median Household Size in Clark
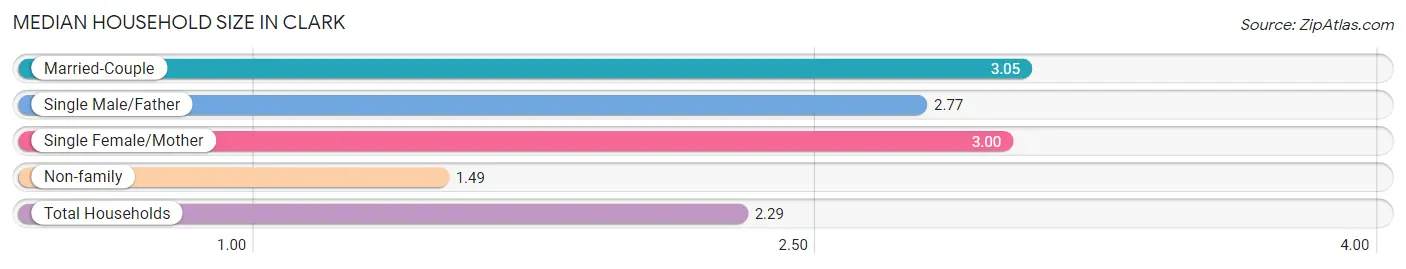
The median household size in Clark is 2.29 persons per household, with married-couple households (211 | 42.6%) accounting for the largest median household size of 3.05 persons per household. non-family households (236 | 47.7%) represent the smallest median household size with 1.49 persons per household.
| Household Type | # Households | Household Size |
| Married-Couple | 211 (42.6%) | 3.05 |
| Single Male/Father | 13 (2.6%) | 2.77 |
| Single Female/Mother | 35 (7.1%) | 3.00 |
| Non-family | 236 (47.7%) | 1.49 |
| Total Households | 495 (100.0%) | 2.29 |
Household Size by Marriage Status in Clark
Out of a total of 495 households in Clark, 259 (52.3%) are family households, while 236 (47.7%) are nonfamily households. The most numerous type of family households are 2-person households, comprising 186, and the most common type of nonfamily households are 1-person households, comprising 181.
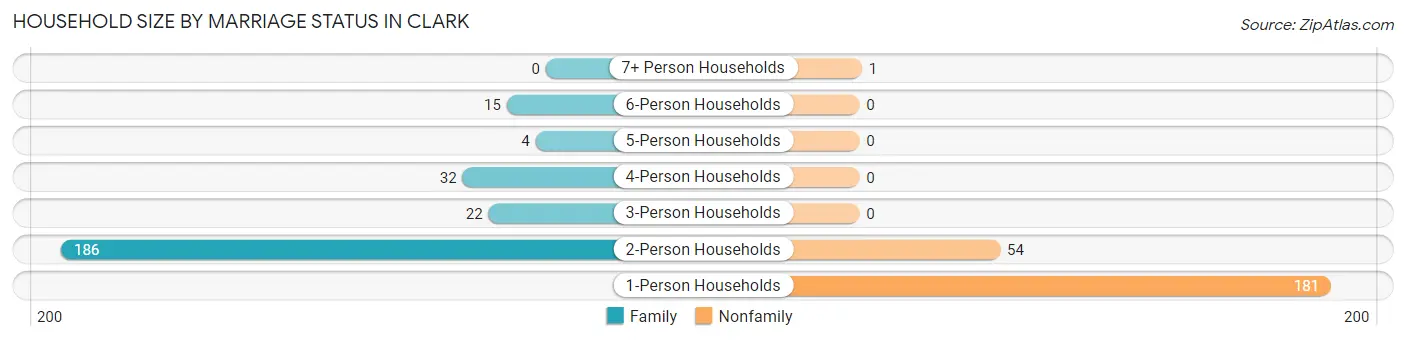
| Household Size | Family Households | Nonfamily Households |
| 1-Person Households | - | 181 (36.6%) |
| 2-Person Households | 186 (37.6%) | 54 (10.9%) |
| 3-Person Households | 22 (4.4%) | 0 (0.0%) |
| 4-Person Households | 32 (6.5%) | 0 (0.0%) |
| 5-Person Households | 4 (0.8%) | 0 (0.0%) |
| 6-Person Households | 15 (3.0%) | 0 (0.0%) |
| 7+ Person Households | 0 (0.0%) | 1 (0.2%) |
| Total | 259 (52.3%) | 236 (47.7%) |
Female Fertility in Clark
Fertility by Age in Clark
Average fertility rate in Clark is 57.0 births per 1,000 women. Women in the age bracket of 20 to 34 years have the highest fertility rate with 92.0 births per 1,000 women. Women in the age bracket of 20 to 34 years acount for 76.9% of all women with births.
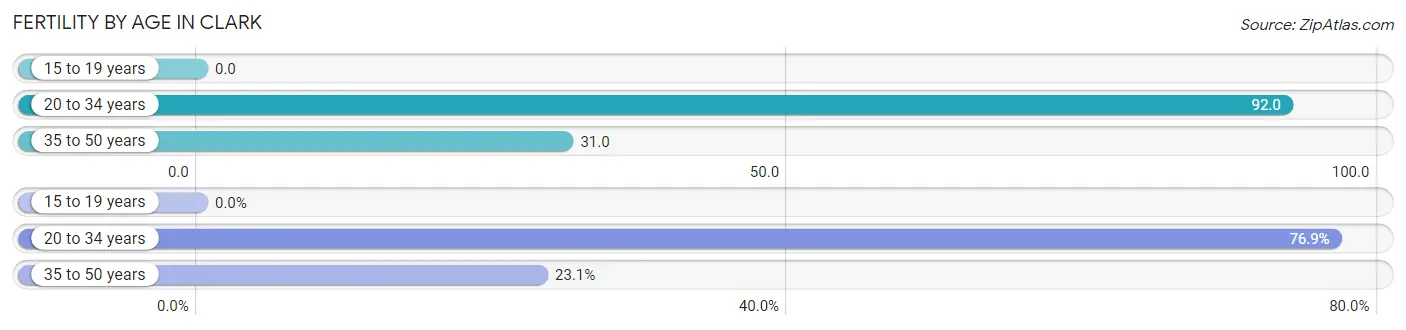
| Age Bracket | Women with Births | Births / 1,000 Women |
| 15 to 19 years | 0 (0.0%) | 0.0 |
| 20 to 34 years | 10 (76.9%) | 92.0 |
| 35 to 50 years | 3 (23.1%) | 31.0 |
| Total | 13 (100.0%) | 57.0 |
Fertility by Age by Marriage Status in Clark
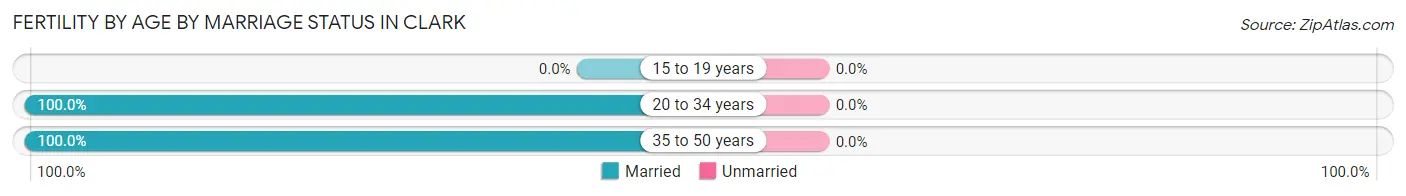
| Age Bracket | Married | Unmarried |
| 15 to 19 years | 0 (0.0%) | 0 (0.0%) |
| 20 to 34 years | 10 (100.0%) | 0 (0.0%) |
| 35 to 50 years | 3 (100.0%) | 0 (0.0%) |
| Total | 13 (100.0%) | 0 (0.0%) |
Fertility by Education in Clark
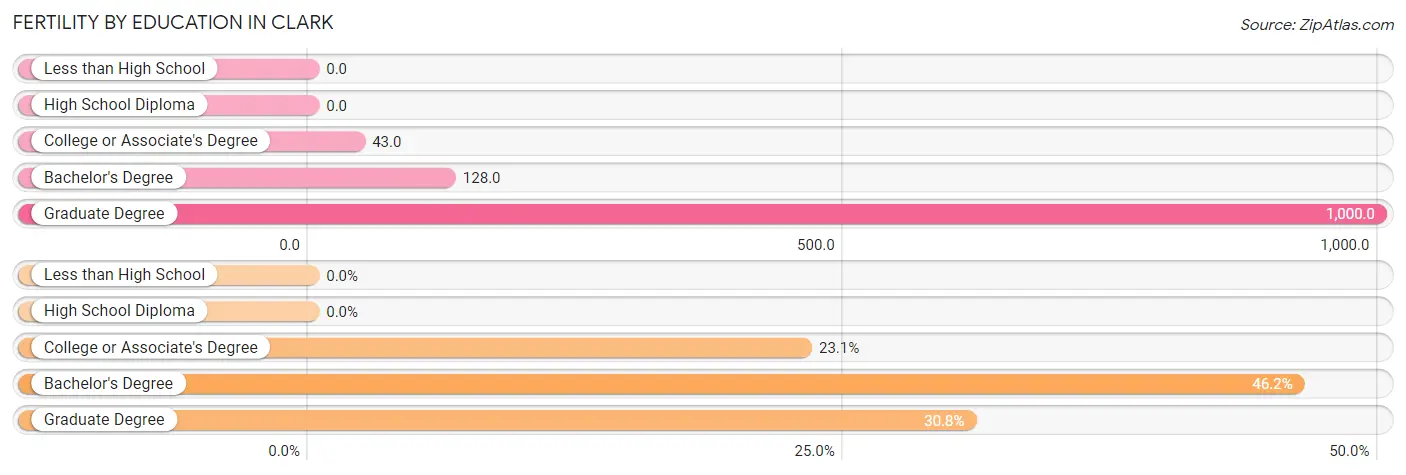
| Educational Attainment | Women with Births | Births / 1,000 Women |
| Less than High School | 0 (0.0%) | 0.0 |
| High School Diploma | 0 (0.0%) | 0.0 |
| College or Associate's Degree | 3 (23.1%) | 43.0 |
| Bachelor's Degree | 6 (46.2%) | 128.0 |
| Graduate Degree | 4 (30.8%) | 1,000.0 |
| Total | 13 (100.0%) | 57.0 |
Fertility by Education by Marriage Status in Clark
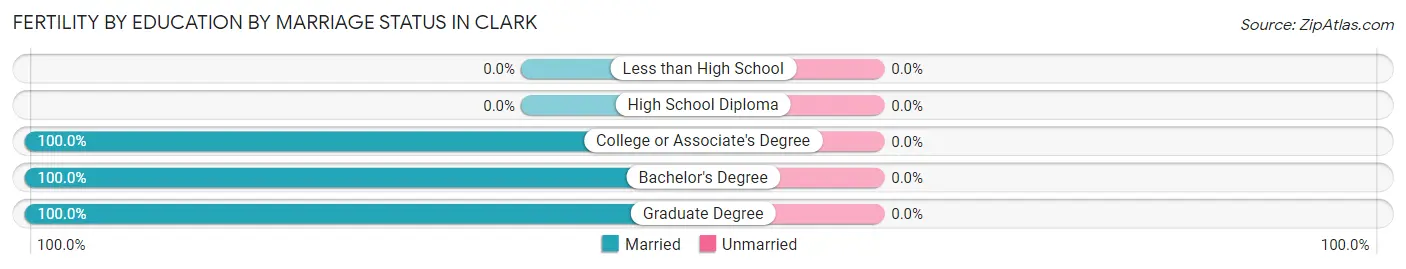
| Educational Attainment | Married | Unmarried |
| Less than High School | 0 (0.0%) | 0 (0.0%) |
| High School Diploma | 0 (0.0%) | 0 (0.0%) |
| College or Associate's Degree | 3 (100.0%) | 0 (0.0%) |
| Bachelor's Degree | 6 (100.0%) | 0 (0.0%) |
| Graduate Degree | 4 (100.0%) | 0 (0.0%) |
| Total | 13 (100.0%) | 0 (0.0%) |
Employment Characteristics in Clark
Employment by Class of Employer in Clark
Among the 548 employed individuals in Clark, private company employees (332 | 60.6%), local government employees (64 | 11.7%), and self-employed (not incorporated) (62 | 11.3%) make up the most common classes of employment.
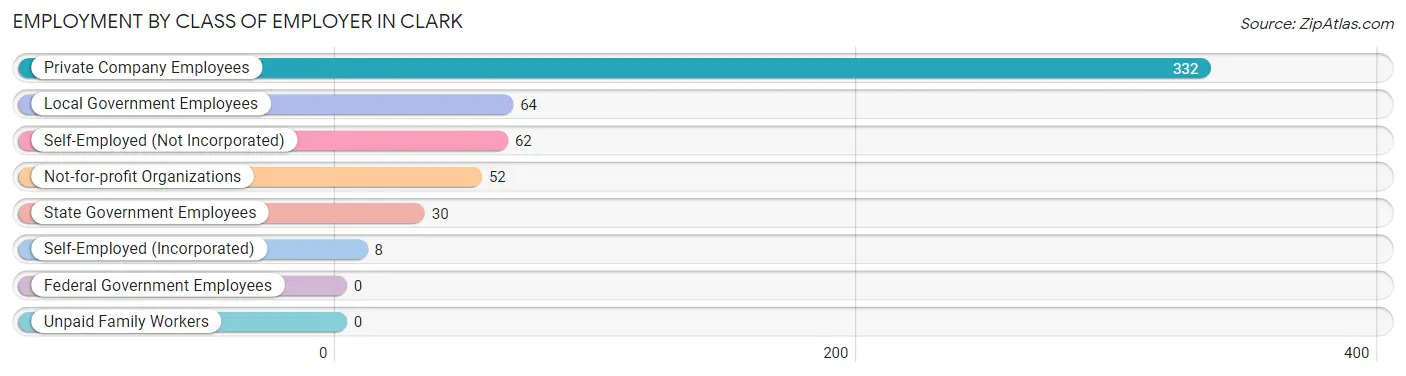
| Employer Class | # Employees | % Employees |
| Private Company Employees | 332 | 60.6% |
| Self-Employed (Incorporated) | 8 | 1.5% |
| Self-Employed (Not Incorporated) | 62 | 11.3% |
| Not-for-profit Organizations | 52 | 9.5% |
| Local Government Employees | 64 | 11.7% |
| State Government Employees | 30 | 5.5% |
| Federal Government Employees | 0 | 0.0% |
| Unpaid Family Workers | 0 | 0.0% |
| Total | 548 | 100.0% |
Employment Status by Age in Clark
According to the labor force statistics for Clark, out of the total population over 16 years of age (984), 58.5% or 576 individuals are in the labor force, with 4.3% or 25 of them unemployed. The age group with the highest labor force participation rate is 25 to 29 years, with 100.0% or 79 individuals in the labor force. Within the labor force, the 60 to 64 years age range has the highest percentage of unemployed individuals, with 18.2% or 10 of them being unemployed.
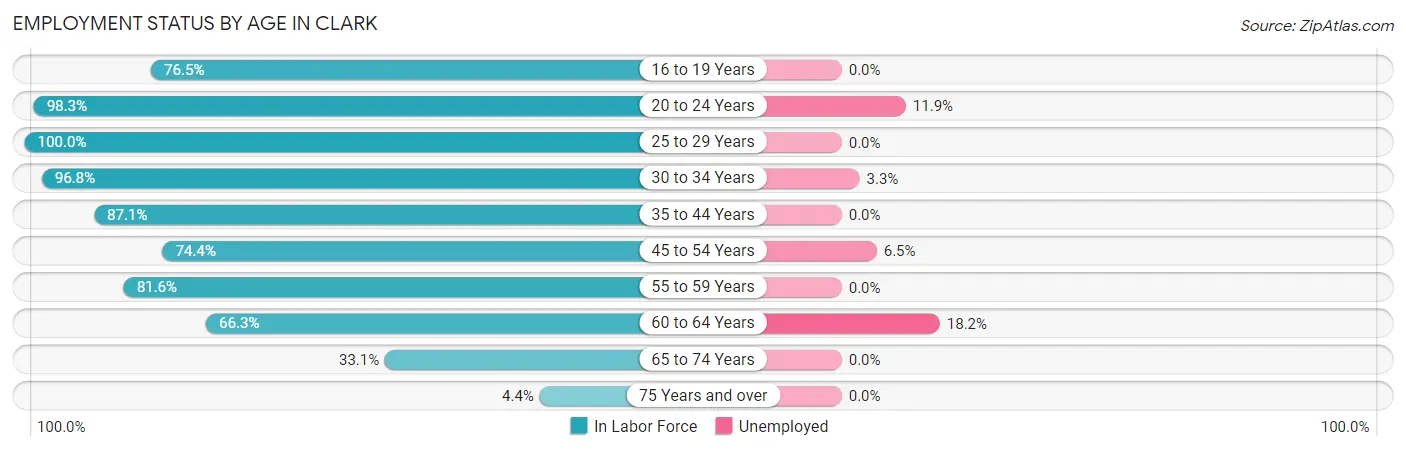
| Age Bracket | In Labor Force | Unemployed |
| 16 to 19 Years | 13 (76.5%) | 0 (0.0%) |
| 20 to 24 Years | 59 (98.3%) | 7 (11.9%) |
| 25 to 29 Years | 79 (100.0%) | 0 (0.0%) |
| 30 to 34 Years | 60 (96.8%) | 2 (3.3%) |
| 35 to 44 Years | 88 (87.1%) | 0 (0.0%) |
| 45 to 54 Years | 93 (74.4%) | 6 (6.5%) |
| 55 to 59 Years | 62 (81.6%) | 0 (0.0%) |
| 60 to 64 Years | 55 (66.3%) | 10 (18.2%) |
| 65 to 74 Years | 58 (33.1%) | 0 (0.0%) |
| 75 Years and over | 9 (4.4%) | 0 (0.0%) |
| Total | 576 (58.5%) | 25 (4.3%) |
Employment Status by Educational Attainment in Clark
According to labor force statistics for Clark, 83.1% of individuals (437) out of the total population between 25 and 64 years of age (526) are in the labor force, with 4.1% or 18 of them being unemployed. The group with the highest labor force participation rate are those with the educational attainment of college / associate degree, with 91.2% or 155 individuals in the labor force. Within the labor force, individuals with less than high school education have the highest percentage of unemployment, with 35.3% or 6 of them being unemployed.
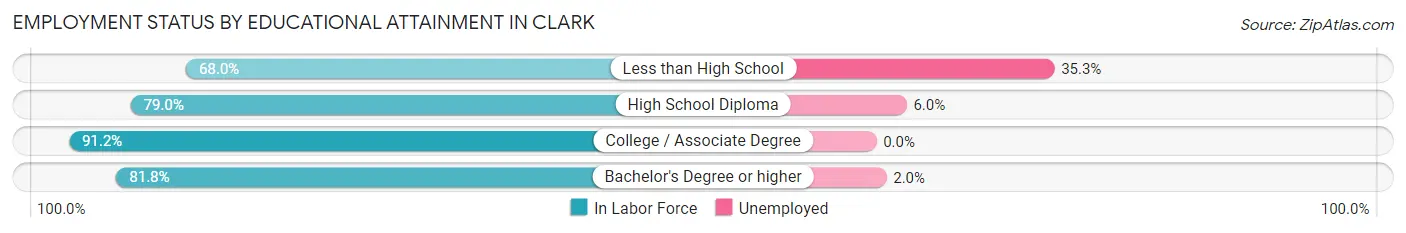
| Educational Attainment | In Labor Force | Unemployed |
| Less than High School | 17 (68.0%) | 9 (35.3%) |
| High School Diploma | 166 (79.0%) | 13 (6.0%) |
| College / Associate Degree | 155 (91.2%) | 0 (0.0%) |
| Bachelor's Degree or higher | 99 (81.8%) | 2 (2.0%) |
| Total | 437 (83.1%) | 22 (4.1%) |
Employment Occupations by Sex in Clark
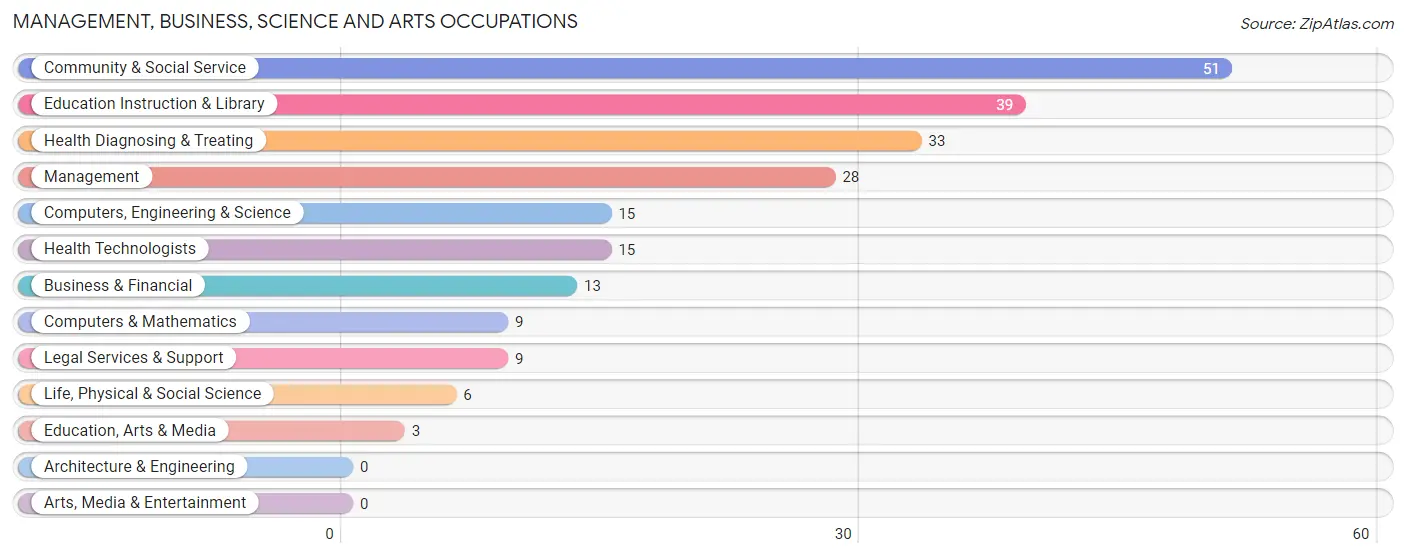
Management, Business, Science and Arts Occupations
The most common Management, Business, Science and Arts occupations in Clark are Community & Social Service (51 | 9.3%), Education Instruction & Library (39 | 7.1%), Health Diagnosing & Treating (33 | 6.0%), Management (28 | 5.1%), and Computers, Engineering & Science (15 | 2.7%).
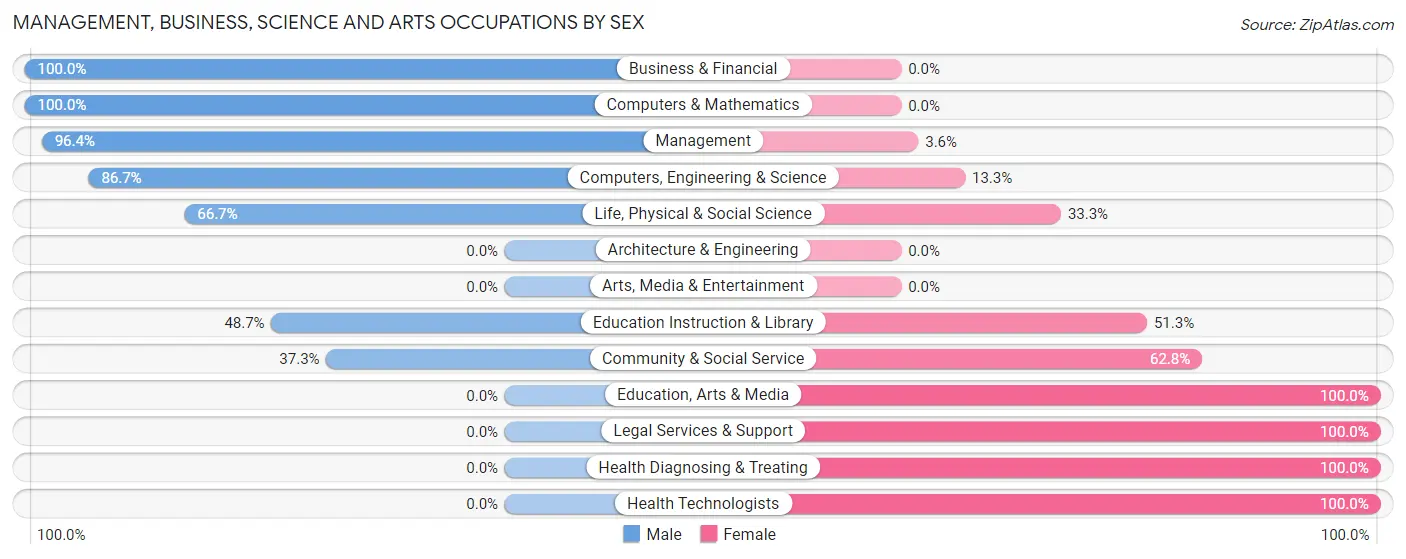
Management, Business, Science and Arts Occupations by Sex
Within the Management, Business, Science and Arts occupations in Clark, the most male-oriented occupations are Business & Financial (100.0%), Computers & Mathematics (100.0%), and Management (96.4%), while the most female-oriented occupations are Education, Arts & Media (100.0%), Legal Services & Support (100.0%), and Health Diagnosing & Treating (100.0%).
| Occupation | Male | Female |
| Management | 27 (96.4%) | 1 (3.6%) |
| Business & Financial | 13 (100.0%) | 0 (0.0%) |
| Computers, Engineering & Science | 13 (86.7%) | 2 (13.3%) |
| Computers & Mathematics | 9 (100.0%) | 0 (0.0%) |
| Architecture & Engineering | 0 (0.0%) | 0 (0.0%) |
| Life, Physical & Social Science | 4 (66.7%) | 2 (33.3%) |
| Community & Social Service | 19 (37.2%) | 32 (62.7%) |
| Education, Arts & Media | 0 (0.0%) | 3 (100.0%) |
| Legal Services & Support | 0 (0.0%) | 9 (100.0%) |
| Education Instruction & Library | 19 (48.7%) | 20 (51.3%) |
| Arts, Media & Entertainment | 0 (0.0%) | 0 (0.0%) |
| Health Diagnosing & Treating | 0 (0.0%) | 33 (100.0%) |
| Health Technologists | 0 (0.0%) | 15 (100.0%) |
| Total (Category) | 72 (51.4%) | 68 (48.6%) |
| Total (Overall) | 265 (48.1%) | 286 (51.9%) |
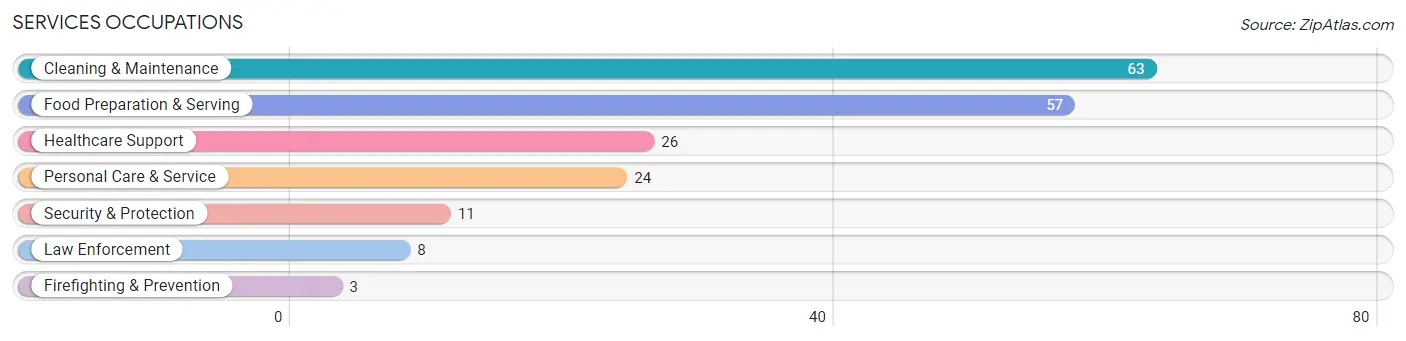
Services Occupations
The most common Services occupations in Clark are Cleaning & Maintenance (63 | 11.4%), Food Preparation & Serving (57 | 10.3%), Healthcare Support (26 | 4.7%), Personal Care & Service (24 | 4.4%), and Security & Protection (11 | 2.0%).
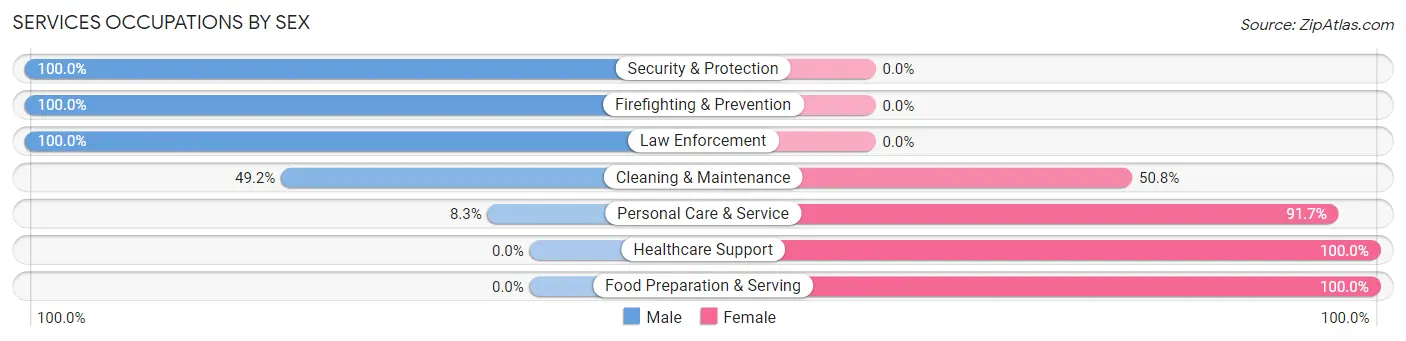
Services Occupations by Sex
Within the Services occupations in Clark, the most male-oriented occupations are Security & Protection (100.0%), Firefighting & Prevention (100.0%), and Law Enforcement (100.0%), while the most female-oriented occupations are Healthcare Support (100.0%), Food Preparation & Serving (100.0%), and Personal Care & Service (91.7%).
| Occupation | Male | Female |
| Healthcare Support | 0 (0.0%) | 26 (100.0%) |
| Security & Protection | 11 (100.0%) | 0 (0.0%) |
| Firefighting & Prevention | 3 (100.0%) | 0 (0.0%) |
| Law Enforcement | 8 (100.0%) | 0 (0.0%) |
| Food Preparation & Serving | 0 (0.0%) | 57 (100.0%) |
| Cleaning & Maintenance | 31 (49.2%) | 32 (50.8%) |
| Personal Care & Service | 2 (8.3%) | 22 (91.7%) |
| Total (Category) | 44 (24.3%) | 137 (75.7%) |
| Total (Overall) | 265 (48.1%) | 286 (51.9%) |
Sales and Office Occupations
The most common Sales and Office occupations in Clark are Sales & Related (49 | 8.9%), and Office & Administration (38 | 6.9%).
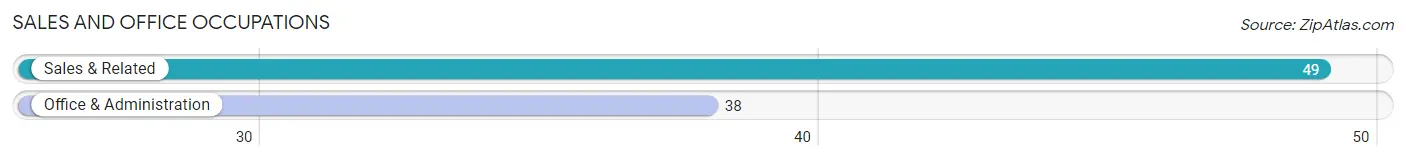
Sales and Office Occupations by Sex
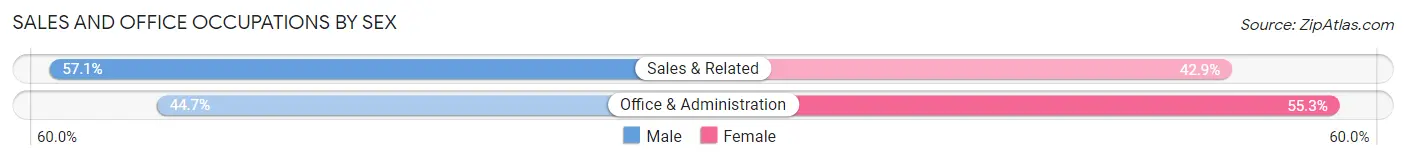
| Occupation | Male | Female |
| Sales & Related | 28 (57.1%) | 21 (42.9%) |
| Office & Administration | 17 (44.7%) | 21 (55.3%) |
| Total (Category) | 45 (51.7%) | 42 (48.3%) |
| Total (Overall) | 265 (48.1%) | 286 (51.9%) |
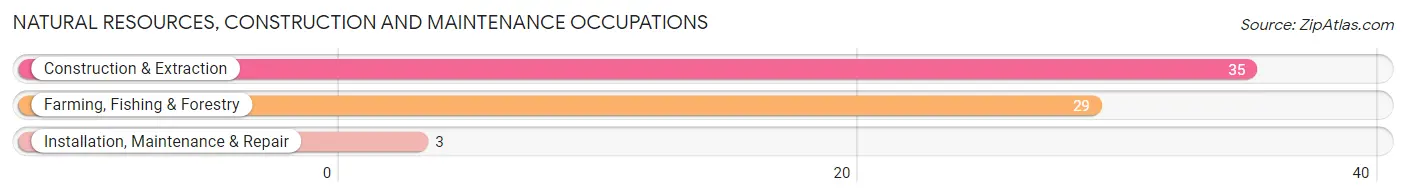
Natural Resources, Construction and Maintenance Occupations
The most common Natural Resources, Construction and Maintenance occupations in Clark are Construction & Extraction (35 | 6.4%), Farming, Fishing & Forestry (29 | 5.3%), and Installation, Maintenance & Repair (3 | 0.5%).
Natural Resources, Construction and Maintenance Occupations by Sex
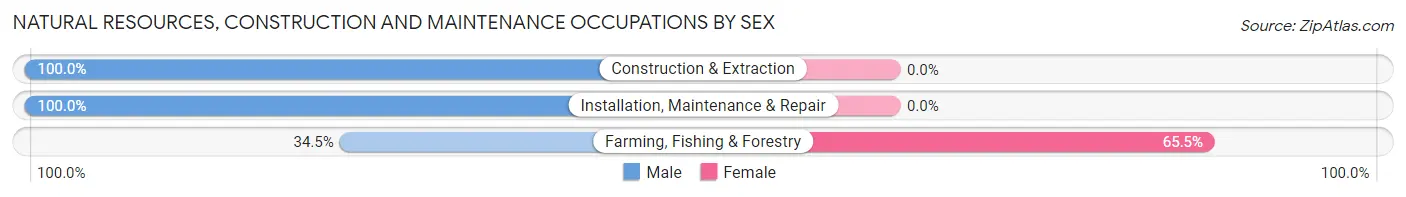
| Occupation | Male | Female |
| Farming, Fishing & Forestry | 10 (34.5%) | 19 (65.5%) |
| Construction & Extraction | 35 (100.0%) | 0 (0.0%) |
| Installation, Maintenance & Repair | 3 (100.0%) | 0 (0.0%) |
| Total (Category) | 48 (71.6%) | 19 (28.4%) |
| Total (Overall) | 265 (48.1%) | 286 (51.9%) |
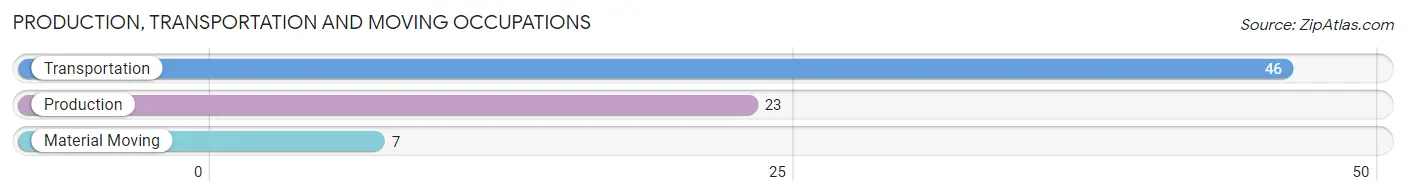
Production, Transportation and Moving Occupations
The most common Production, Transportation and Moving occupations in Clark are Transportation (46 | 8.4%), Production (23 | 4.2%), and Material Moving (7 | 1.3%).
Production, Transportation and Moving Occupations by Sex
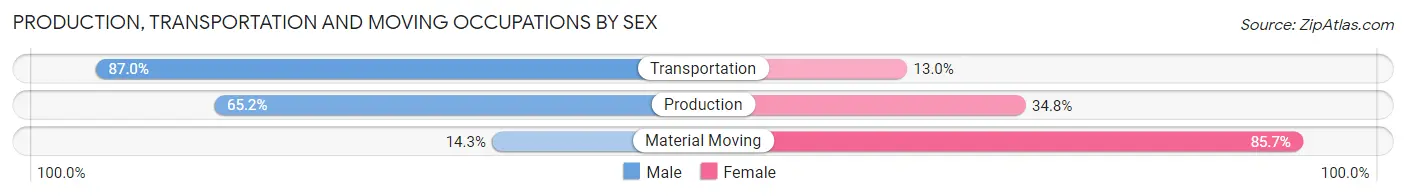
| Occupation | Male | Female |
| Production | 15 (65.2%) | 8 (34.8%) |
| Transportation | 40 (87.0%) | 6 (13.0%) |
| Material Moving | 1 (14.3%) | 6 (85.7%) |
| Total (Category) | 56 (73.7%) | 20 (26.3%) |
| Total (Overall) | 265 (48.1%) | 286 (51.9%) |
Employment Industries by Sex in Clark
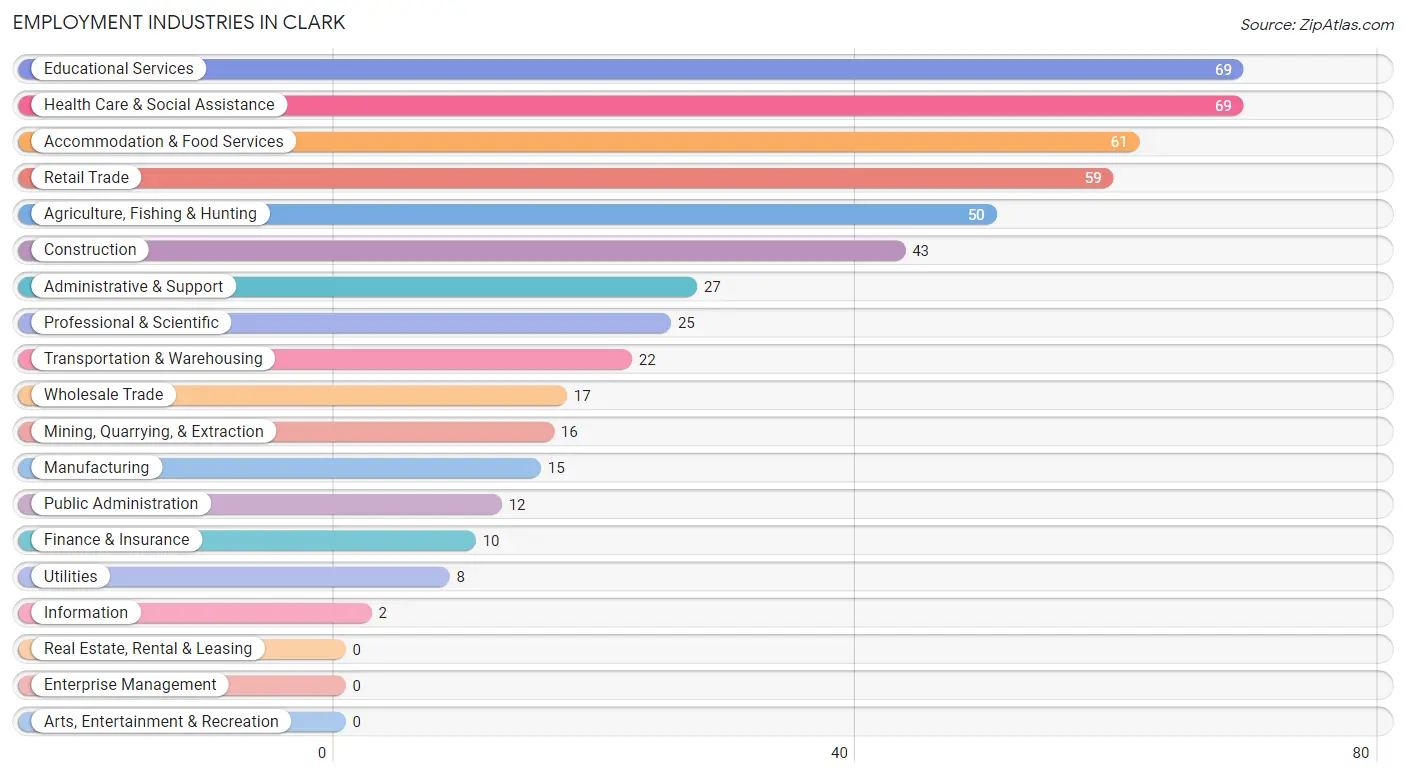
Employment Industries in Clark
The major employment industries in Clark include Educational Services (69 | 12.5%), Health Care & Social Assistance (69 | 12.5%), Accommodation & Food Services (61 | 11.1%), Retail Trade (59 | 10.7%), and Agriculture, Fishing & Hunting (50 | 9.1%).
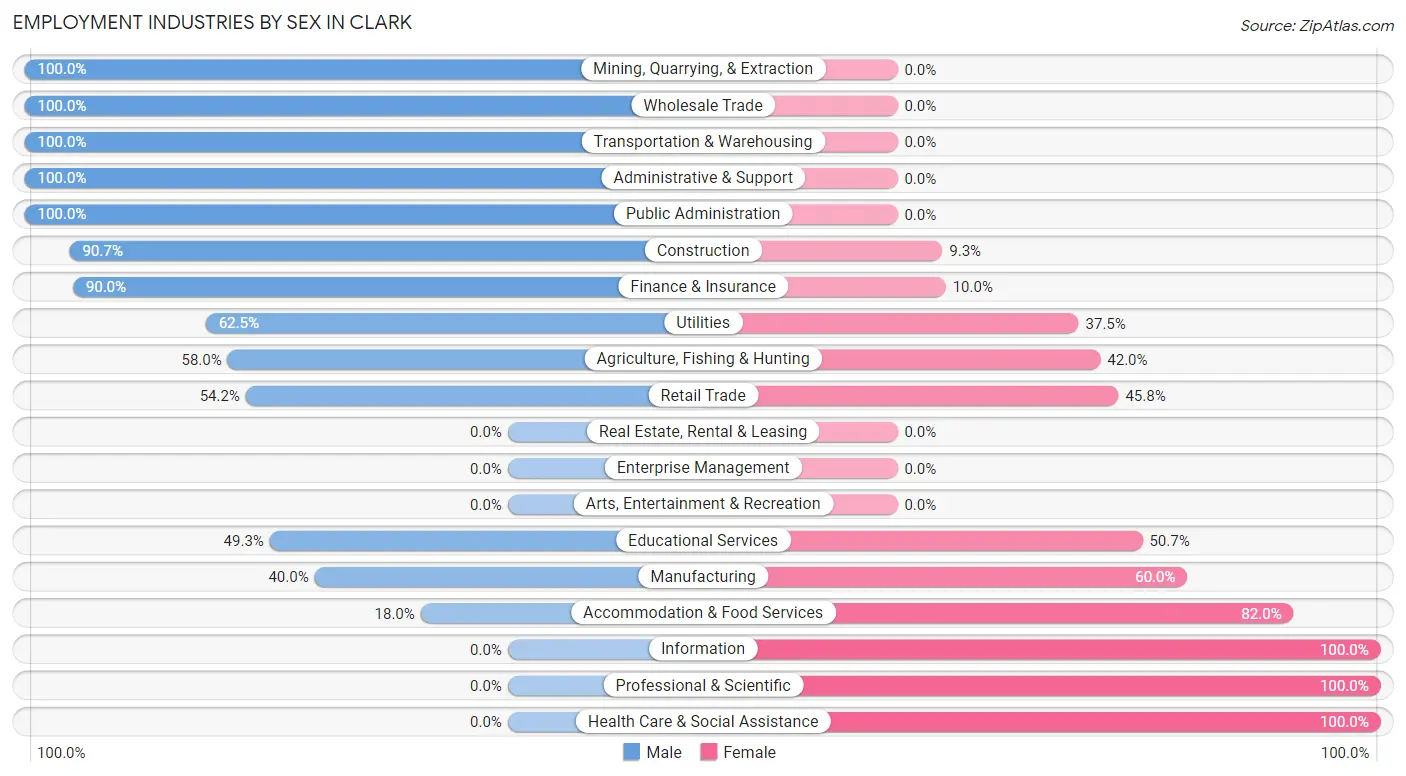
Employment Industries by Sex in Clark
The Clark industries that see more men than women are Mining, Quarrying, & Extraction (100.0%), Wholesale Trade (100.0%), and Transportation & Warehousing (100.0%), whereas the industries that tend to have a higher number of women are Information (100.0%), Professional & Scientific (100.0%), and Health Care & Social Assistance (100.0%).
| Industry | Male | Female |
| Agriculture, Fishing & Hunting | 29 (58.0%) | 21 (42.0%) |
| Mining, Quarrying, & Extraction | 16 (100.0%) | 0 (0.0%) |
| Construction | 39 (90.7%) | 4 (9.3%) |
| Manufacturing | 6 (40.0%) | 9 (60.0%) |
| Wholesale Trade | 17 (100.0%) | 0 (0.0%) |
| Retail Trade | 32 (54.2%) | 27 (45.8%) |
| Transportation & Warehousing | 22 (100.0%) | 0 (0.0%) |
| Utilities | 5 (62.5%) | 3 (37.5%) |
| Information | 0 (0.0%) | 2 (100.0%) |
| Finance & Insurance | 9 (90.0%) | 1 (10.0%) |
| Real Estate, Rental & Leasing | 0 (0.0%) | 0 (0.0%) |
| Professional & Scientific | 0 (0.0%) | 25 (100.0%) |
| Enterprise Management | 0 (0.0%) | 0 (0.0%) |
| Administrative & Support | 27 (100.0%) | 0 (0.0%) |
| Educational Services | 34 (49.3%) | 35 (50.7%) |
| Health Care & Social Assistance | 0 (0.0%) | 69 (100.0%) |
| Arts, Entertainment & Recreation | 0 (0.0%) | 0 (0.0%) |
| Accommodation & Food Services | 11 (18.0%) | 50 (82.0%) |
| Public Administration | 12 (100.0%) | 0 (0.0%) |
| Total | 265 (48.1%) | 286 (51.9%) |
Education in Clark
School Enrollment in Clark
The most common levels of schooling among the 200 students in Clark are middle school (74 | 37.0%), high school (52 | 26.0%), and elementary school (39 | 19.5%).
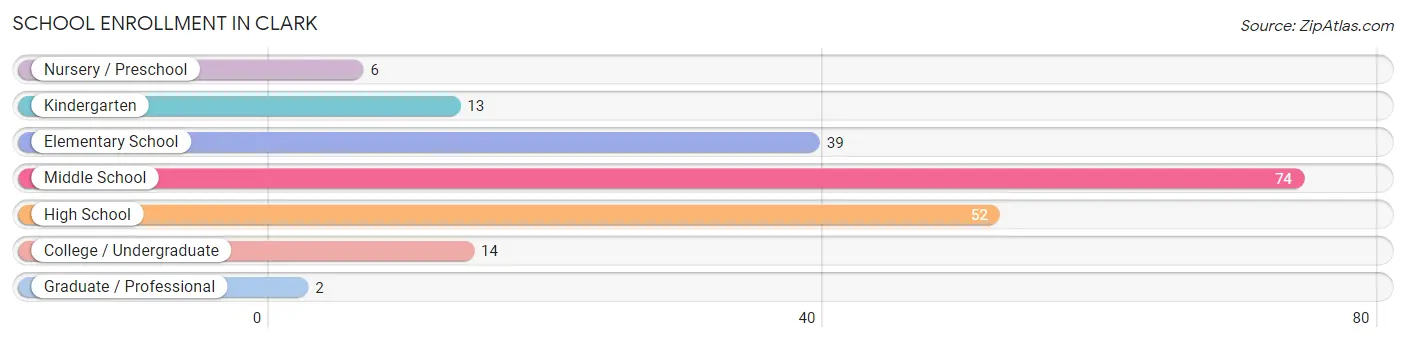
| School Level | # Students | % Students |
| Nursery / Preschool | 6 | 3.0% |
| Kindergarten | 13 | 6.5% |
| Elementary School | 39 | 19.5% |
| Middle School | 74 | 37.0% |
| High School | 52 | 26.0% |
| College / Undergraduate | 14 | 7.0% |
| Graduate / Professional | 2 | 1.0% |
| Total | 200 | 100.0% |
School Enrollment by Age by Funding Source in Clark
Out of a total of 200 students who are enrolled in schools in Clark, 4 (2.0%) attend a private institution, while the remaining 196 (98.0%) are enrolled in public schools. The age group of 10 to 14 year olds has the highest likelihood of being enrolled in private schools, with 4 (4.2% in the age bracket) enrolled. Conversely, the age group of 3 to 4 year olds has the lowest likelihood of being enrolled in a private school, with 6 (100.0% in the age bracket) attending a public institution.
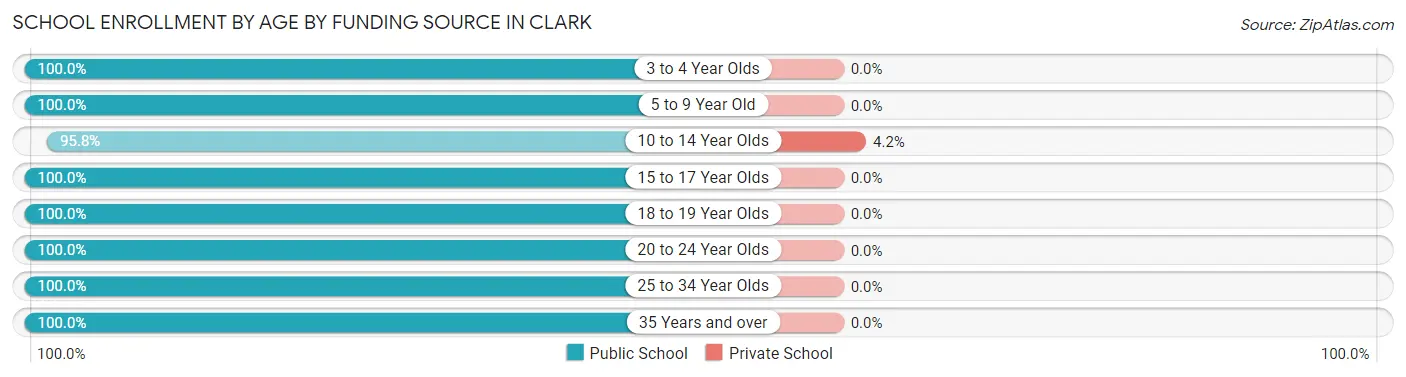
| Age Bracket | Public School | Private School |
| 3 to 4 Year Olds | 6 (100.0%) | 0 (0.0%) |
| 5 to 9 Year Old | 39 (100.0%) | 0 (0.0%) |
| 10 to 14 Year Olds | 92 (95.8%) | 4 (4.2%) |
| 15 to 17 Year Olds | 34 (100.0%) | 0 (0.0%) |
| 18 to 19 Year Olds | 8 (100.0%) | 0 (0.0%) |
| 20 to 24 Year Olds | 8 (100.0%) | 0 (0.0%) |
| 25 to 34 Year Olds | 4 (100.0%) | 0 (0.0%) |
| 35 Years and over | 5 (100.0%) | 0 (0.0%) |
| Total | 196 (98.0%) | 4 (2.0%) |
Educational Attainment by Field of Study in Clark
Education (72 | 41.9%), bio, nature & agricultural (31 | 18.0%), science & technology (22 | 12.8%), arts & humanities (18 | 10.5%), and business (11 | 6.4%) are the most common fields of study among 172 individuals in Clark who have obtained a bachelor's degree or higher.
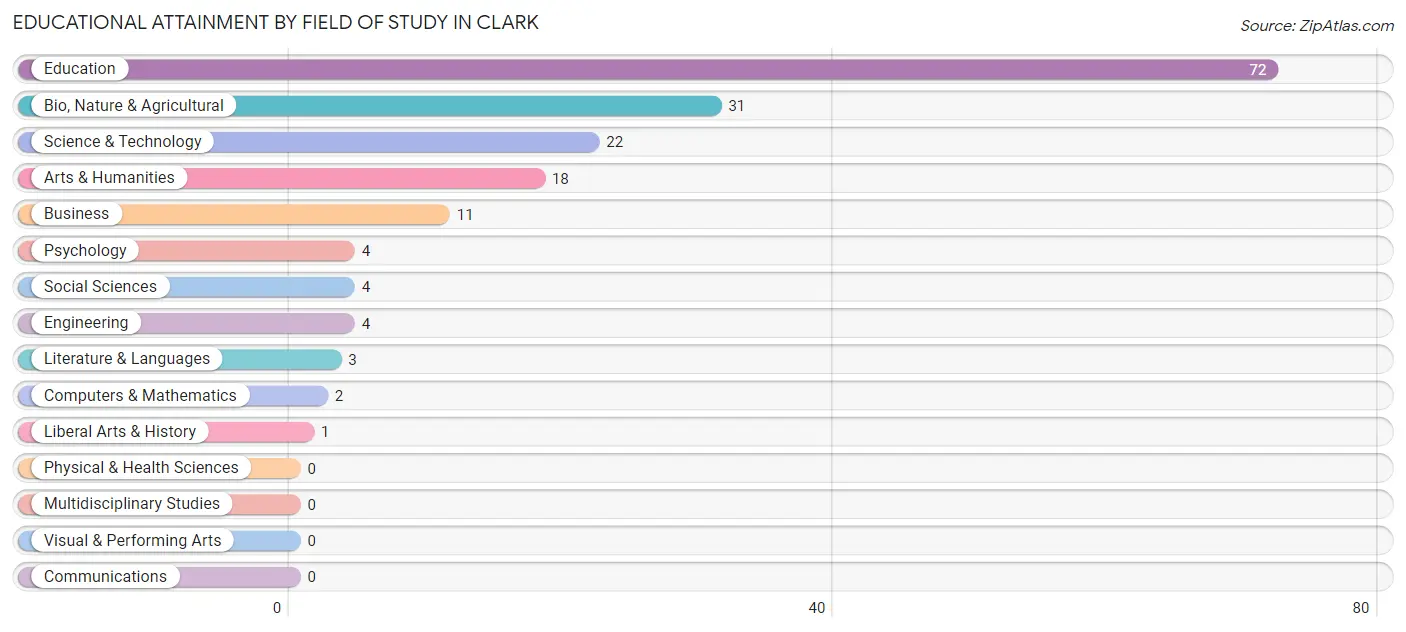
| Field of Study | # Graduates | % Graduates |
| Computers & Mathematics | 2 | 1.2% |
| Bio, Nature & Agricultural | 31 | 18.0% |
| Physical & Health Sciences | 0 | 0.0% |
| Psychology | 4 | 2.3% |
| Social Sciences | 4 | 2.3% |
| Engineering | 4 | 2.3% |
| Multidisciplinary Studies | 0 | 0.0% |
| Science & Technology | 22 | 12.8% |
| Business | 11 | 6.4% |
| Education | 72 | 41.9% |
| Literature & Languages | 3 | 1.7% |
| Liberal Arts & History | 1 | 0.6% |
| Visual & Performing Arts | 0 | 0.0% |
| Communications | 0 | 0.0% |
| Arts & Humanities | 18 | 10.5% |
| Total | 172 | 100.0% |
Transportation & Commute in Clark
Vehicle Availability by Sex in Clark
The most prevalent vehicle ownership categories in Clark are males with 2 vehicles (106, accounting for 40.6%) and females with 2 vehicles (99, making up 37.1%).
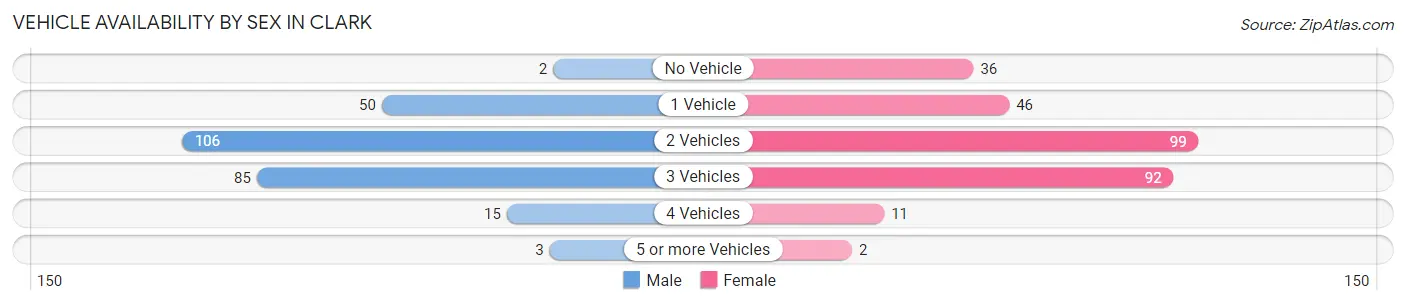
| Vehicles Available | Male | Female |
| No Vehicle | 2 (0.8%) | 36 (12.6%) |
| 1 Vehicle | 50 (19.2%) | 46 (16.1%) |
| 2 Vehicles | 106 (40.6%) | 99 (34.6%) |
| 3 Vehicles | 85 (32.6%) | 92 (32.2%) |
| 4 Vehicles | 15 (5.8%) | 11 (3.8%) |
| 5 or more Vehicles | 3 (1.1%) | 2 (0.7%) |
| Total | 261 (100.0%) | 286 (100.0%) |
Commute Time in Clark
The most frequently occuring commute durations in Clark are 5 to 9 minutes (153 commuters, 29.2%), less than 5 minutes (120 commuters, 22.9%), and 30 to 34 minutes (51 commuters, 9.8%).
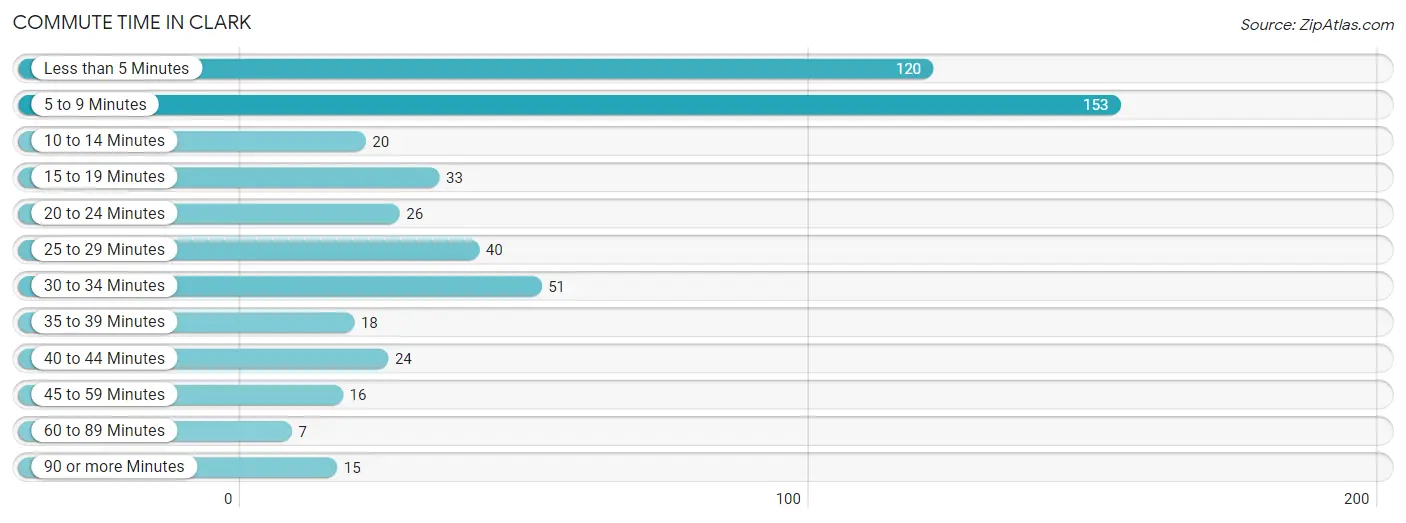
| Commute Time | # Commuters | % Commuters |
| Less than 5 Minutes | 120 | 22.9% |
| 5 to 9 Minutes | 153 | 29.2% |
| 10 to 14 Minutes | 20 | 3.8% |
| 15 to 19 Minutes | 33 | 6.3% |
| 20 to 24 Minutes | 26 | 5.0% |
| 25 to 29 Minutes | 40 | 7.6% |
| 30 to 34 Minutes | 51 | 9.8% |
| 35 to 39 Minutes | 18 | 3.4% |
| 40 to 44 Minutes | 24 | 4.6% |
| 45 to 59 Minutes | 16 | 3.1% |
| 60 to 89 Minutes | 7 | 1.3% |
| 90 or more Minutes | 15 | 2.9% |
Commute Time by Sex in Clark
The most common commute times in Clark are 5 to 9 minutes (72 commuters, 29.0%) for males and 5 to 9 minutes (81 commuters, 29.4%) for females.
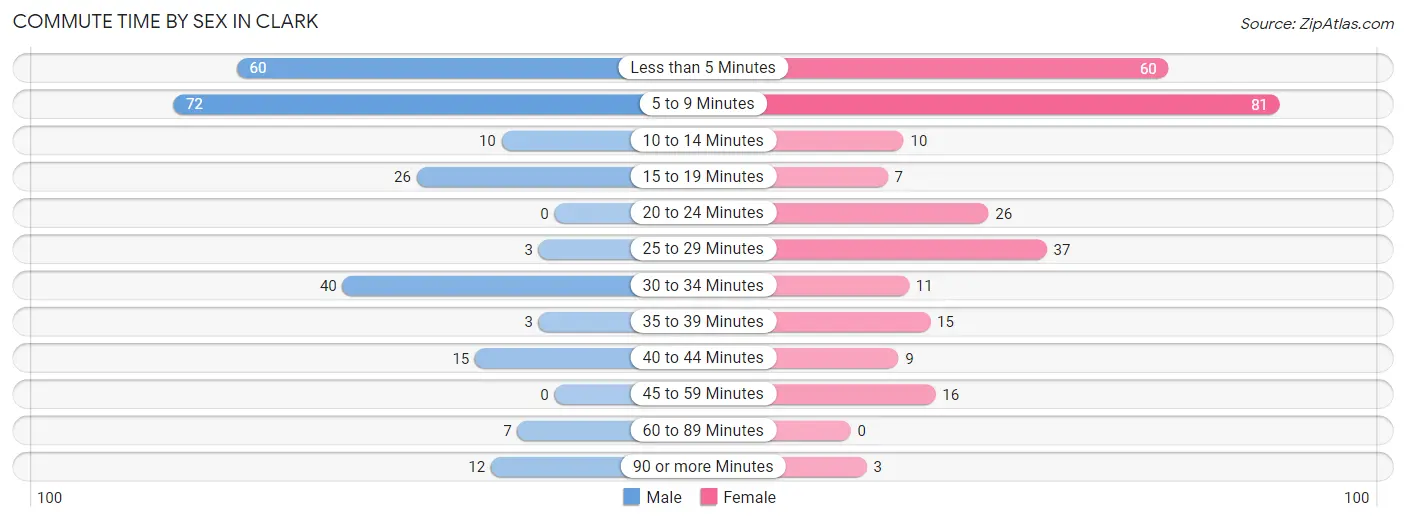
| Commute Time | Male | Female |
| Less than 5 Minutes | 60 (24.2%) | 60 (21.8%) |
| 5 to 9 Minutes | 72 (29.0%) | 81 (29.4%) |
| 10 to 14 Minutes | 10 (4.0%) | 10 (3.6%) |
| 15 to 19 Minutes | 26 (10.5%) | 7 (2.5%) |
| 20 to 24 Minutes | 0 (0.0%) | 26 (9.5%) |
| 25 to 29 Minutes | 3 (1.2%) | 37 (13.5%) |
| 30 to 34 Minutes | 40 (16.1%) | 11 (4.0%) |
| 35 to 39 Minutes | 3 (1.2%) | 15 (5.4%) |
| 40 to 44 Minutes | 15 (6.0%) | 9 (3.3%) |
| 45 to 59 Minutes | 0 (0.0%) | 16 (5.8%) |
| 60 to 89 Minutes | 7 (2.8%) | 0 (0.0%) |
| 90 or more Minutes | 12 (4.8%) | 3 (1.1%) |
Time of Departure to Work by Sex in Clark
The most frequent times of departure to work in Clark are 7:00 AM to 7:29 AM (61, 24.6%) for males and 7:30 AM to 7:59 AM (44, 16.0%) for females.
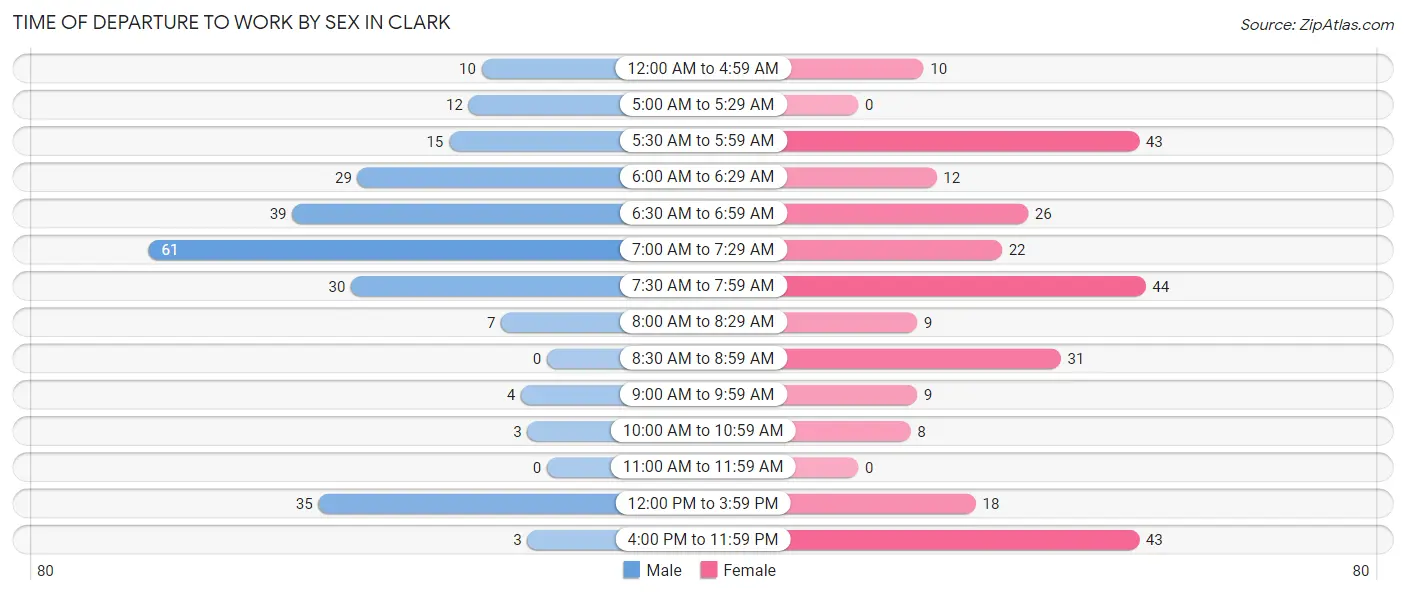
| Time of Departure | Male | Female |
| 12:00 AM to 4:59 AM | 10 (4.0%) | 10 (3.6%) |
| 5:00 AM to 5:29 AM | 12 (4.8%) | 0 (0.0%) |
| 5:30 AM to 5:59 AM | 15 (6.0%) | 43 (15.6%) |
| 6:00 AM to 6:29 AM | 29 (11.7%) | 12 (4.4%) |
| 6:30 AM to 6:59 AM | 39 (15.7%) | 26 (9.5%) |
| 7:00 AM to 7:29 AM | 61 (24.6%) | 22 (8.0%) |
| 7:30 AM to 7:59 AM | 30 (12.1%) | 44 (16.0%) |
| 8:00 AM to 8:29 AM | 7 (2.8%) | 9 (3.3%) |
| 8:30 AM to 8:59 AM | 0 (0.0%) | 31 (11.3%) |
| 9:00 AM to 9:59 AM | 4 (1.6%) | 9 (3.3%) |
| 10:00 AM to 10:59 AM | 3 (1.2%) | 8 (2.9%) |
| 11:00 AM to 11:59 AM | 0 (0.0%) | 0 (0.0%) |
| 12:00 PM to 3:59 PM | 35 (14.1%) | 18 (6.6%) |
| 4:00 PM to 11:59 PM | 3 (1.2%) | 43 (15.6%) |
| Total | 248 (100.0%) | 275 (100.0%) |
Housing Occupancy in Clark
Occupancy by Ownership in Clark
Of the total 495 dwellings in Clark, owner-occupied units account for 350 (70.7%), while renter-occupied units make up 145 (29.3%).
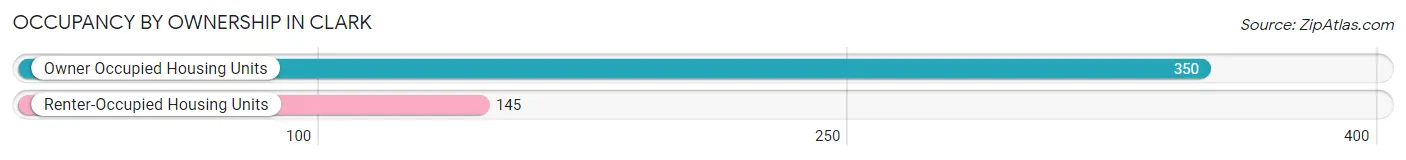
| Occupancy | # Housing Units | % Housing Units |
| Owner Occupied Housing Units | 350 | 70.7% |
| Renter-Occupied Housing Units | 145 | 29.3% |
| Total Occupied Housing Units | 495 | 100.0% |
Occupancy by Household Size in Clark
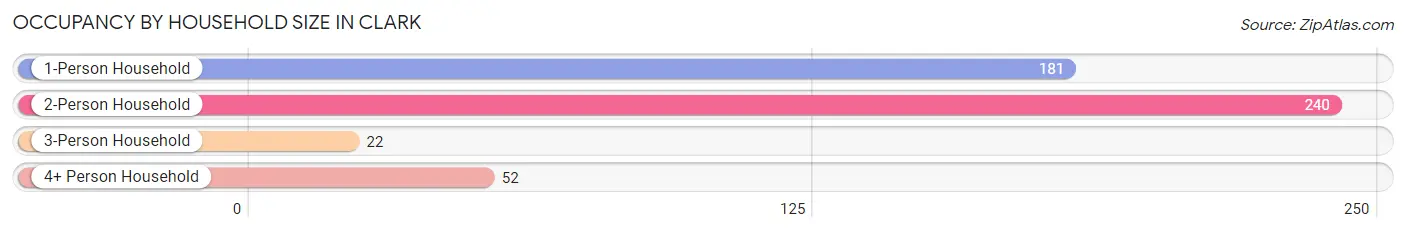
| Household Size | # Housing Units | % Housing Units |
| 1-Person Household | 181 | 36.6% |
| 2-Person Household | 240 | 48.5% |
| 3-Person Household | 22 | 4.4% |
| 4+ Person Household | 52 | 10.5% |
| Total Housing Units | 495 | 100.0% |
Occupancy by Ownership by Household Size in Clark
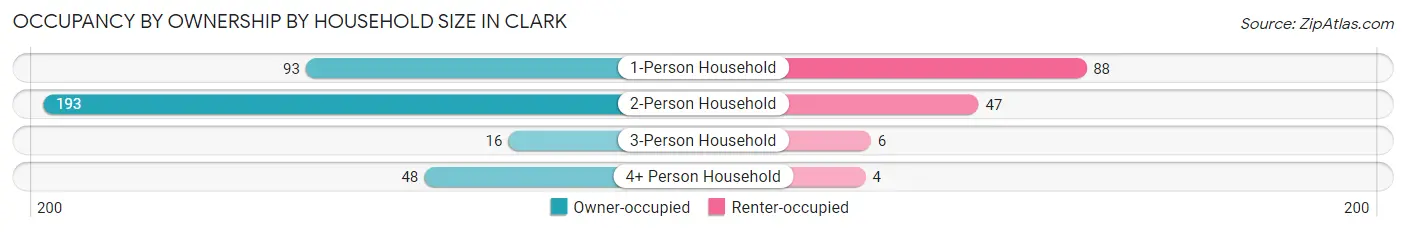
| Household Size | Owner-occupied | Renter-occupied |
| 1-Person Household | 93 (51.4%) | 88 (48.6%) |
| 2-Person Household | 193 (80.4%) | 47 (19.6%) |
| 3-Person Household | 16 (72.7%) | 6 (27.3%) |
| 4+ Person Household | 48 (92.3%) | 4 (7.7%) |
| Total Housing Units | 350 (70.7%) | 145 (29.3%) |
Occupancy by Educational Attainment in Clark
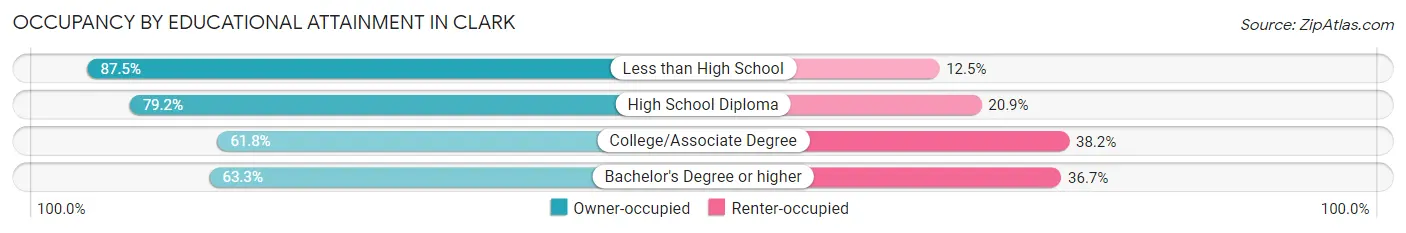
| Household Size | Owner-occupied | Renter-occupied |
| Less than High School | 21 (87.5%) | 3 (12.5%) |
| High School Diploma | 167 (79.1%) | 44 (20.8%) |
| College/Associate Degree | 105 (61.8%) | 65 (38.2%) |
| Bachelor's Degree or higher | 57 (63.3%) | 33 (36.7%) |
Occupancy by Age of Householder in Clark
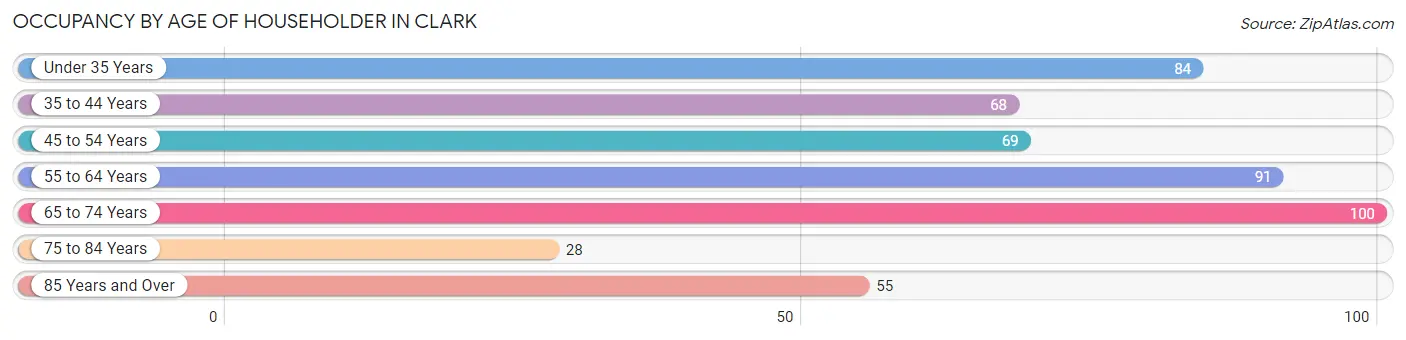
| Age Bracket | # Households | % Households |
| Under 35 Years | 84 | 17.0% |
| 35 to 44 Years | 68 | 13.7% |
| 45 to 54 Years | 69 | 13.9% |
| 55 to 64 Years | 91 | 18.4% |
| 65 to 74 Years | 100 | 20.2% |
| 75 to 84 Years | 28 | 5.7% |
| 85 Years and Over | 55 | 11.1% |
| Total | 495 | 100.0% |
Housing Finances in Clark
Median Income by Occupancy in Clark
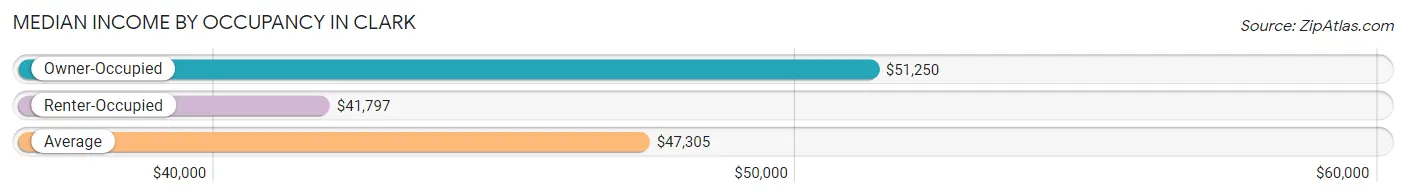
| Occupancy Type | # Households | Median Income |
| Owner-Occupied | 350 (70.7%) | $51,250 |
| Renter-Occupied | 145 (29.3%) | $41,797 |
| Average | 495 (100.0%) | $47,305 |
Occupancy by Householder Income Bracket in Clark
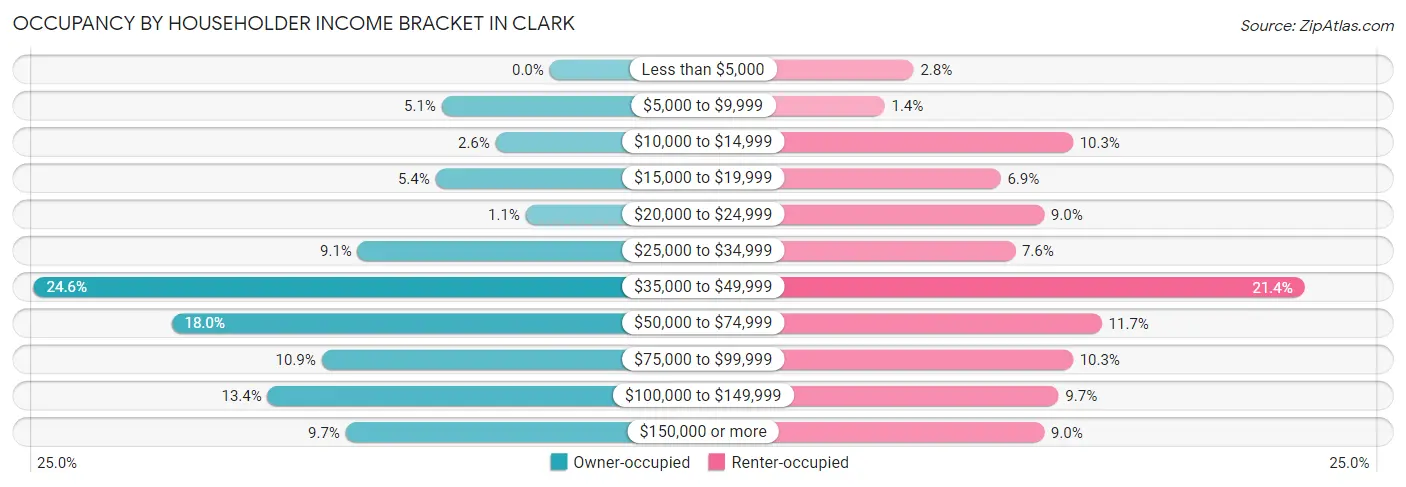
| Income Bracket | Owner-occupied | Renter-occupied |
| Less than $5,000 | 0 (0.0%) | 4 (2.8%) |
| $5,000 to $9,999 | 18 (5.1%) | 2 (1.4%) |
| $10,000 to $14,999 | 9 (2.6%) | 15 (10.3%) |
| $15,000 to $19,999 | 19 (5.4%) | 10 (6.9%) |
| $20,000 to $24,999 | 4 (1.1%) | 13 (9.0%) |
| $25,000 to $34,999 | 32 (9.1%) | 11 (7.6%) |
| $35,000 to $49,999 | 86 (24.6%) | 31 (21.4%) |
| $50,000 to $74,999 | 63 (18.0%) | 17 (11.7%) |
| $75,000 to $99,999 | 38 (10.9%) | 15 (10.3%) |
| $100,000 to $149,999 | 47 (13.4%) | 14 (9.7%) |
| $150,000 or more | 34 (9.7%) | 13 (9.0%) |
| Total | 350 (100.0%) | 145 (100.0%) |
Monthly Housing Cost Tiers in Clark
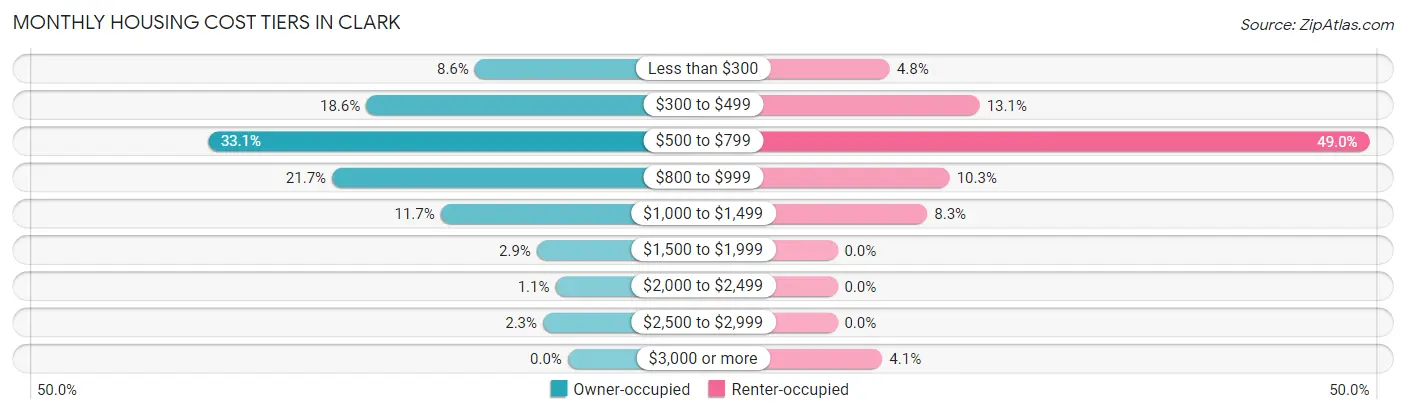
| Monthly Cost | Owner-occupied | Renter-occupied |
| Less than $300 | 30 (8.6%) | 7 (4.8%) |
| $300 to $499 | 65 (18.6%) | 19 (13.1%) |
| $500 to $799 | 116 (33.1%) | 71 (49.0%) |
| $800 to $999 | 76 (21.7%) | 15 (10.3%) |
| $1,000 to $1,499 | 41 (11.7%) | 12 (8.3%) |
| $1,500 to $1,999 | 10 (2.9%) | 0 (0.0%) |
| $2,000 to $2,499 | 4 (1.1%) | 0 (0.0%) |
| $2,500 to $2,999 | 8 (2.3%) | 0 (0.0%) |
| $3,000 or more | 0 (0.0%) | 6 (4.1%) |
| Total | 350 (100.0%) | 145 (100.0%) |
Physical Housing Characteristics in Clark
Housing Structures in Clark
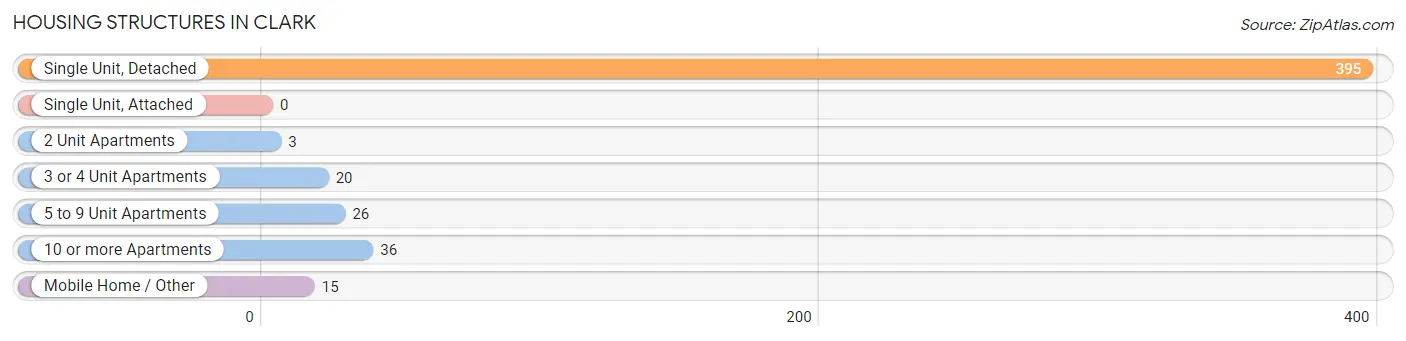
| Structure Type | # Housing Units | % Housing Units |
| Single Unit, Detached | 395 | 79.8% |
| Single Unit, Attached | 0 | 0.0% |
| 2 Unit Apartments | 3 | 0.6% |
| 3 or 4 Unit Apartments | 20 | 4.0% |
| 5 to 9 Unit Apartments | 26 | 5.2% |
| 10 or more Apartments | 36 | 7.3% |
| Mobile Home / Other | 15 | 3.0% |
| Total | 495 | 100.0% |
Housing Structures by Occupancy in Clark
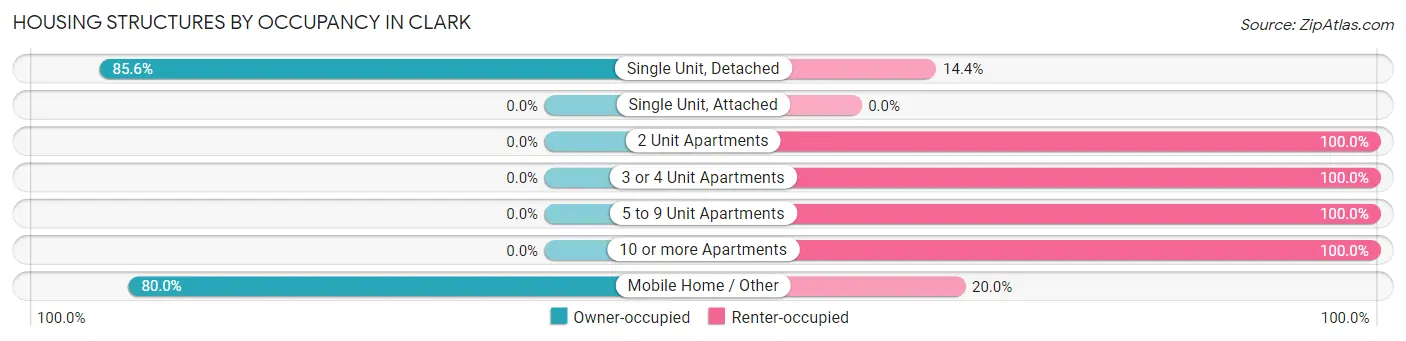
| Structure Type | Owner-occupied | Renter-occupied |
| Single Unit, Detached | 338 (85.6%) | 57 (14.4%) |
| Single Unit, Attached | 0 (0.0%) | 0 (0.0%) |
| 2 Unit Apartments | 0 (0.0%) | 3 (100.0%) |
| 3 or 4 Unit Apartments | 0 (0.0%) | 20 (100.0%) |
| 5 to 9 Unit Apartments | 0 (0.0%) | 26 (100.0%) |
| 10 or more Apartments | 0 (0.0%) | 36 (100.0%) |
| Mobile Home / Other | 12 (80.0%) | 3 (20.0%) |
| Total | 350 (70.7%) | 145 (29.3%) |
Housing Structures by Number of Rooms in Clark
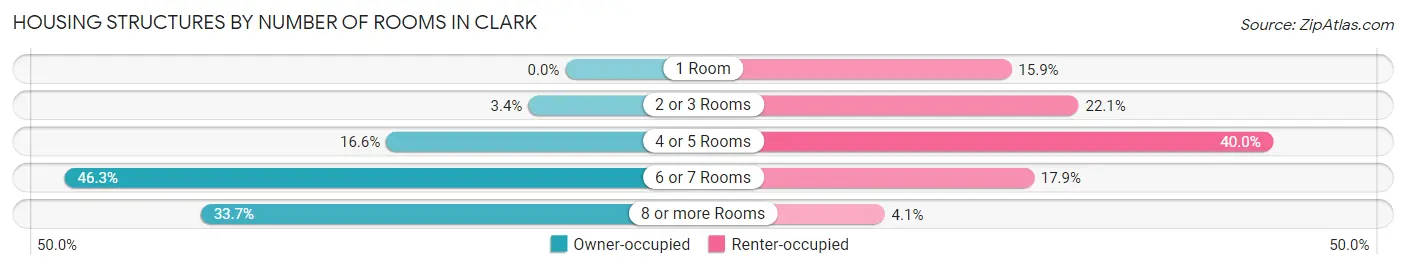
| Number of Rooms | Owner-occupied | Renter-occupied |
| 1 Room | 0 (0.0%) | 23 (15.9%) |
| 2 or 3 Rooms | 12 (3.4%) | 32 (22.1%) |
| 4 or 5 Rooms | 58 (16.6%) | 58 (40.0%) |
| 6 or 7 Rooms | 162 (46.3%) | 26 (17.9%) |
| 8 or more Rooms | 118 (33.7%) | 6 (4.1%) |
| Total | 350 (100.0%) | 145 (100.0%) |
Housing Structure by Heating Type in Clark
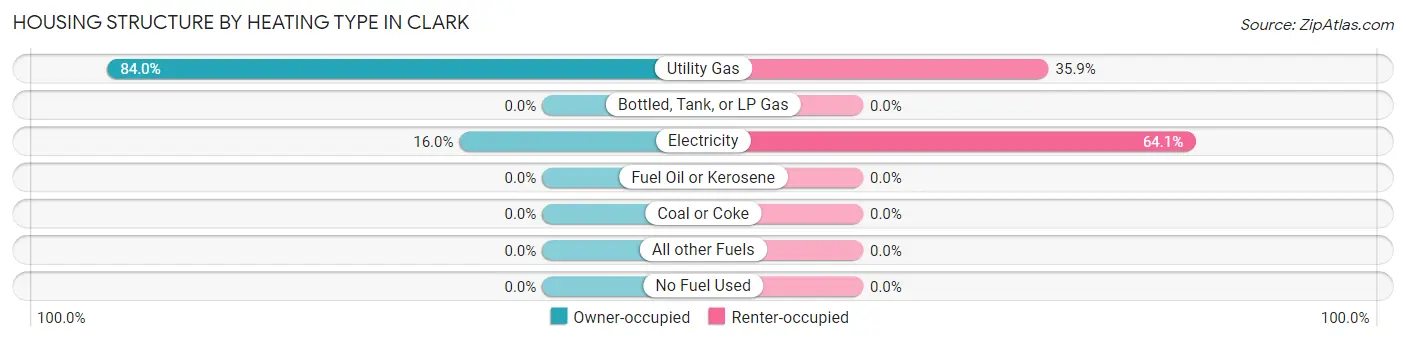
| Heating Type | Owner-occupied | Renter-occupied |
| Utility Gas | 294 (84.0%) | 52 (35.9%) |
| Bottled, Tank, or LP Gas | 0 (0.0%) | 0 (0.0%) |
| Electricity | 56 (16.0%) | 93 (64.1%) |
| Fuel Oil or Kerosene | 0 (0.0%) | 0 (0.0%) |
| Coal or Coke | 0 (0.0%) | 0 (0.0%) |
| All other Fuels | 0 (0.0%) | 0 (0.0%) |
| No Fuel Used | 0 (0.0%) | 0 (0.0%) |
| Total | 350 (100.0%) | 145 (100.0%) |
Household Vehicle Usage in Clark
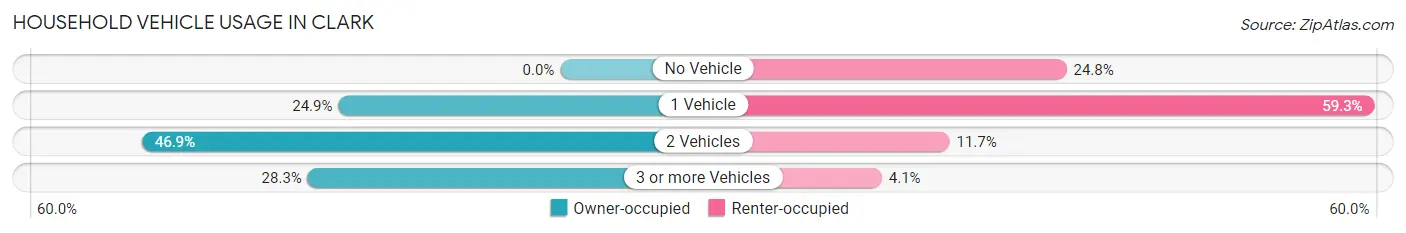
| Vehicles per Household | Owner-occupied | Renter-occupied |
| No Vehicle | 0 (0.0%) | 36 (24.8%) |
| 1 Vehicle | 87 (24.9%) | 86 (59.3%) |
| 2 Vehicles | 164 (46.9%) | 17 (11.7%) |
| 3 or more Vehicles | 99 (28.3%) | 6 (4.1%) |
| Total | 350 (100.0%) | 145 (100.0%) |
Real Estate & Mortgages in Clark
Real Estate and Mortgage Overview in Clark
| Characteristic | Without Mortgage | With Mortgage |
| Housing Units | 187 | 163 |
| Median Property Value | $106,300 | $119,600 |
| Median Household Income | $37,303 | $14 |
| Monthly Housing Costs | $494 | $0 |
| Real Estate Taxes | $1,406 | $4 |
Property Value by Mortgage Status in Clark
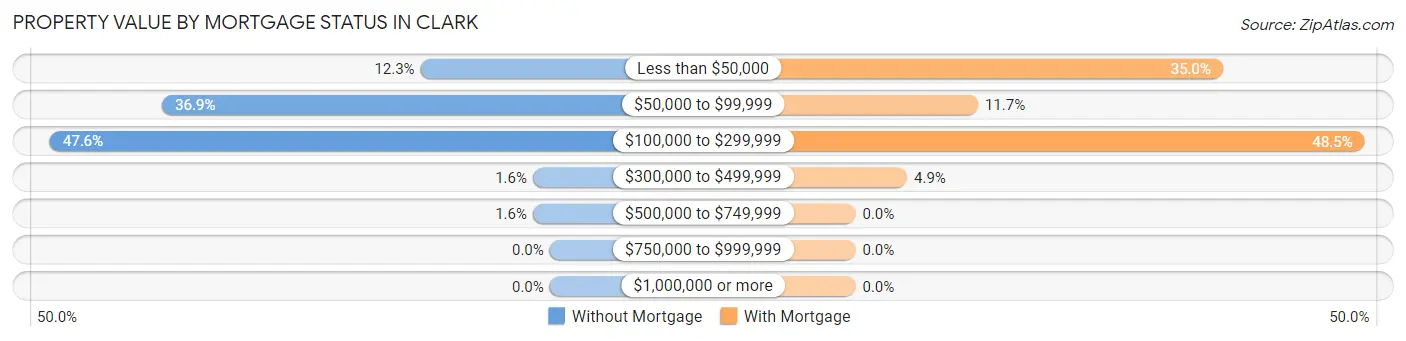
| Property Value | Without Mortgage | With Mortgage |
| Less than $50,000 | 23 (12.3%) | 57 (35.0%) |
| $50,000 to $99,999 | 69 (36.9%) | 19 (11.7%) |
| $100,000 to $299,999 | 89 (47.6%) | 79 (48.5%) |
| $300,000 to $499,999 | 3 (1.6%) | 8 (4.9%) |
| $500,000 to $749,999 | 3 (1.6%) | 0 (0.0%) |
| $750,000 to $999,999 | 0 (0.0%) | 0 (0.0%) |
| $1,000,000 or more | 0 (0.0%) | 0 (0.0%) |
| Total | 187 (100.0%) | 163 (100.0%) |
Household Income by Mortgage Status in Clark
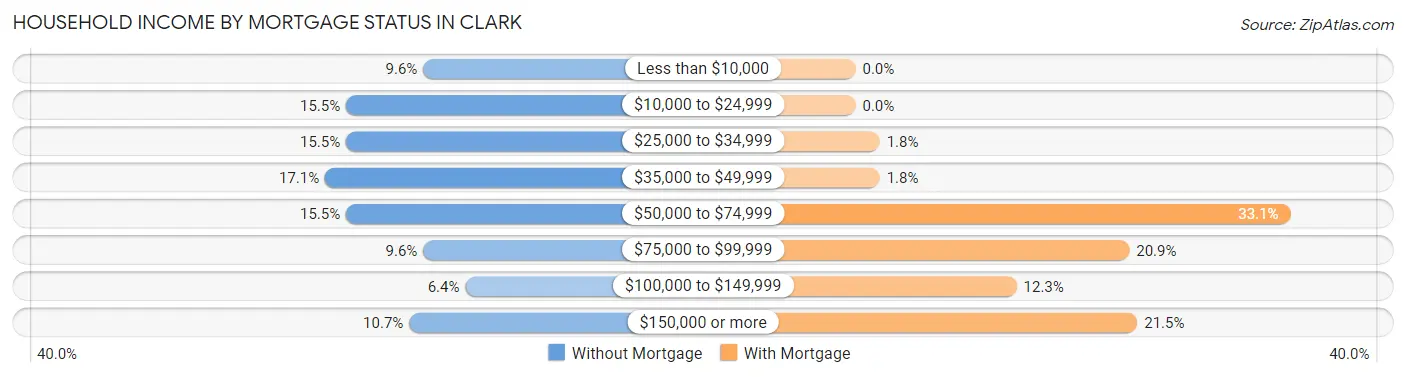
| Household Income | Without Mortgage | With Mortgage |
| Less than $10,000 | 18 (9.6%) | 0 (0.0%) |
| $10,000 to $24,999 | 29 (15.5%) | 0 (0.0%) |
| $25,000 to $34,999 | 29 (15.5%) | 3 (1.8%) |
| $35,000 to $49,999 | 32 (17.1%) | 3 (1.8%) |
| $50,000 to $74,999 | 29 (15.5%) | 54 (33.1%) |
| $75,000 to $99,999 | 18 (9.6%) | 34 (20.9%) |
| $100,000 to $149,999 | 12 (6.4%) | 20 (12.3%) |
| $150,000 or more | 20 (10.7%) | 35 (21.5%) |
| Total | 187 (100.0%) | 163 (100.0%) |
Property Value to Household Income Ratio in Clark
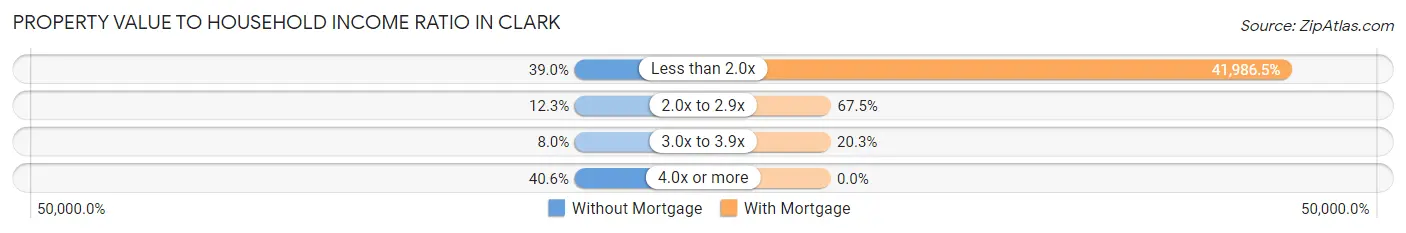
| Value-to-Income Ratio | Without Mortgage | With Mortgage |
| Less than 2.0x | 73 (39.0%) | 68,438 (41,986.5%) |
| 2.0x to 2.9x | 23 (12.3%) | 110 (67.5%) |
| 3.0x to 3.9x | 15 (8.0%) | 33 (20.3%) |
| 4.0x or more | 76 (40.6%) | 0 (0.0%) |
| Total | 187 (100.0%) | 163 (100.0%) |
Real Estate Taxes by Mortgage Status in Clark
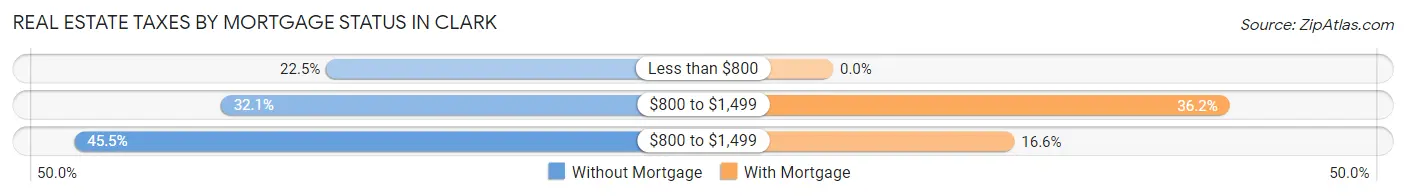
| Property Taxes | Without Mortgage | With Mortgage |
| Less than $800 | 42 (22.5%) | 0 (0.0%) |
| $800 to $1,499 | 60 (32.1%) | 59 (36.2%) |
| $800 to $1,499 | 85 (45.5%) | 27 (16.6%) |
| Total | 187 (100.0%) | 163 (100.0%) |
Health & Disability in Clark
Health Insurance Coverage by Age in Clark
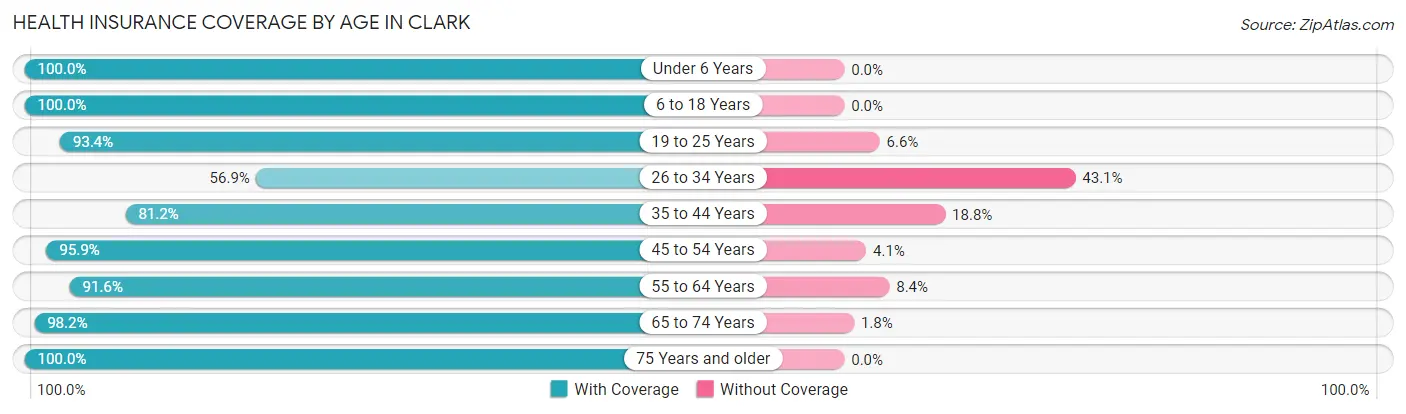
| Age Bracket | With Coverage | Without Coverage |
| Under 6 Years | 62 (100.0%) | 0 (0.0%) |
| 6 to 18 Years | 177 (100.0%) | 0 (0.0%) |
| 19 to 25 Years | 71 (93.4%) | 5 (6.6%) |
| 26 to 34 Years | 70 (56.9%) | 53 (43.1%) |
| 35 to 44 Years | 82 (81.2%) | 19 (18.8%) |
| 45 to 54 Years | 118 (95.9%) | 5 (4.1%) |
| 55 to 64 Years | 142 (91.6%) | 13 (8.4%) |
| 65 to 74 Years | 164 (98.2%) | 3 (1.8%) |
| 75 Years and older | 154 (100.0%) | 0 (0.0%) |
| Total | 1,040 (91.4%) | 98 (8.6%) |
Health Insurance Coverage by Citizenship Status in Clark
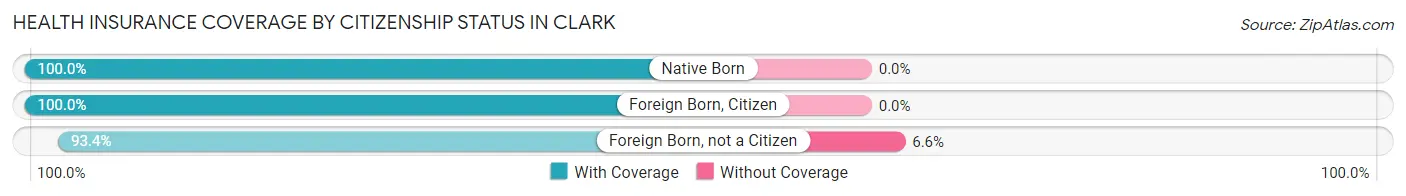
| Citizenship Status | With Coverage | Without Coverage |
| Native Born | 62 (100.0%) | 0 (0.0%) |
| Foreign Born, Citizen | 177 (100.0%) | 0 (0.0%) |
| Foreign Born, not a Citizen | 71 (93.4%) | 5 (6.6%) |
Health Insurance Coverage by Household Income in Clark
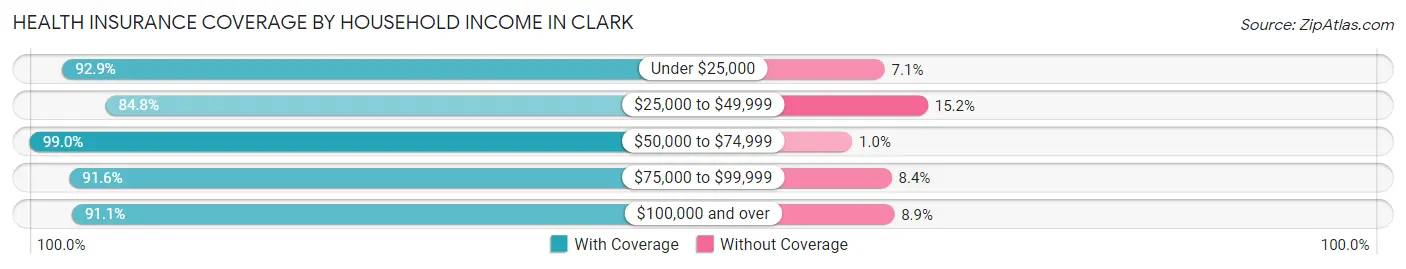
| Household Income | With Coverage | Without Coverage |
| Under $25,000 | 131 (92.9%) | 10 (7.1%) |
| $25,000 to $49,999 | 218 (84.8%) | 39 (15.2%) |
| $50,000 to $74,999 | 198 (99.0%) | 2 (1.0%) |
| $75,000 to $99,999 | 131 (91.6%) | 12 (8.4%) |
| $100,000 and over | 359 (91.1%) | 35 (8.9%) |
Public vs Private Health Insurance Coverage by Age in Clark
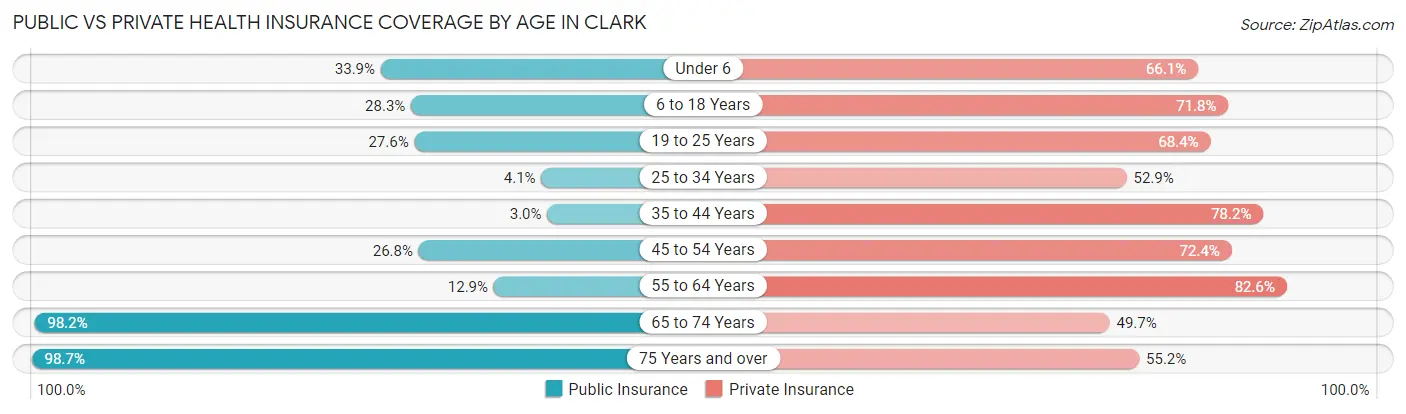
| Age Bracket | Public Insurance | Private Insurance |
| Under 6 | 21 (33.9%) | 41 (66.1%) |
| 6 to 18 Years | 50 (28.2%) | 127 (71.8%) |
| 19 to 25 Years | 21 (27.6%) | 52 (68.4%) |
| 25 to 34 Years | 5 (4.1%) | 65 (52.8%) |
| 35 to 44 Years | 3 (3.0%) | 79 (78.2%) |
| 45 to 54 Years | 33 (26.8%) | 89 (72.4%) |
| 55 to 64 Years | 20 (12.9%) | 128 (82.6%) |
| 65 to 74 Years | 164 (98.2%) | 83 (49.7%) |
| 75 Years and over | 152 (98.7%) | 85 (55.2%) |
| Total | 469 (41.2%) | 749 (65.8%) |
Disability Status by Sex by Age in Clark
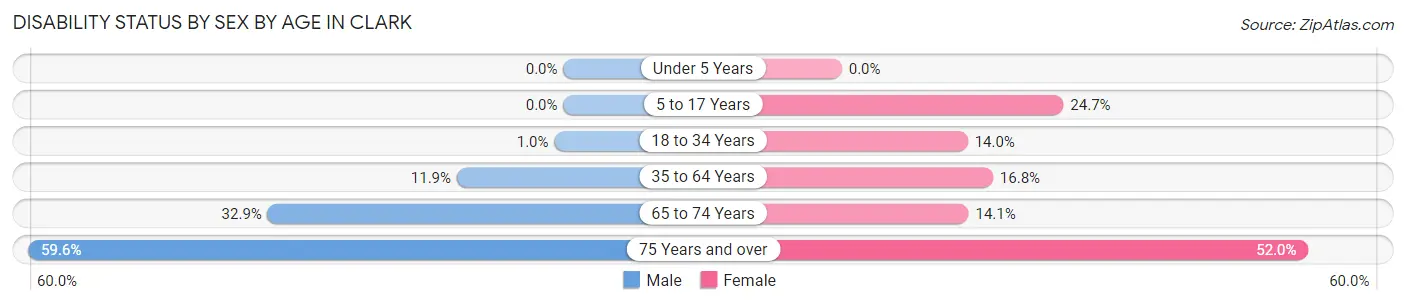
| Age Bracket | Male | Female |
| Under 5 Years | 0 (0.0%) | 0 (0.0%) |
| 5 to 17 Years | 0 (0.0%) | 19 (24.7%) |
| 18 to 34 Years | 1 (1.0%) | 15 (14.0%) |
| 35 to 64 Years | 21 (11.9%) | 34 (16.8%) |
| 65 to 74 Years | 27 (32.9%) | 12 (14.1%) |
| 75 Years and over | 31 (59.6%) | 53 (52.0%) |
Disability Class by Sex by Age in Clark
Disability Class: Hearing Difficulty
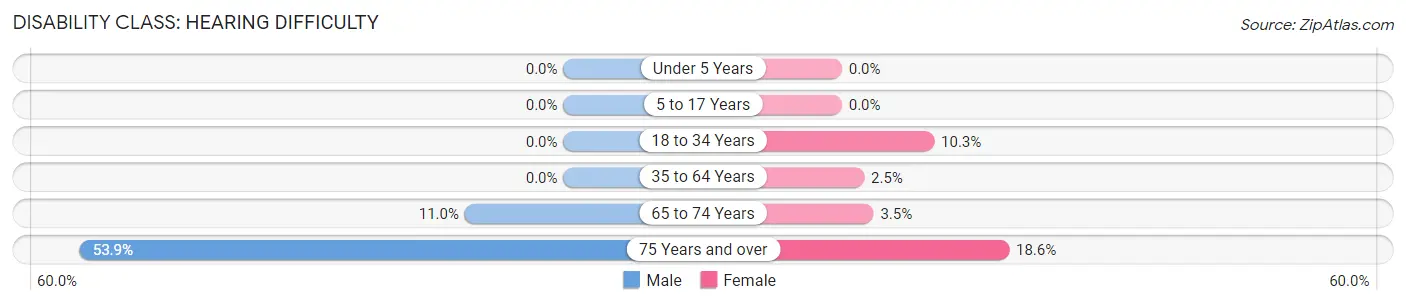
| Age Bracket | Male | Female |
| Under 5 Years | 0 (0.0%) | 0 (0.0%) |
| 5 to 17 Years | 0 (0.0%) | 0 (0.0%) |
| 18 to 34 Years | 0 (0.0%) | 11 (10.3%) |
| 35 to 64 Years | 0 (0.0%) | 5 (2.5%) |
| 65 to 74 Years | 9 (11.0%) | 3 (3.5%) |
| 75 Years and over | 28 (53.8%) | 19 (18.6%) |
Disability Class: Vision Difficulty
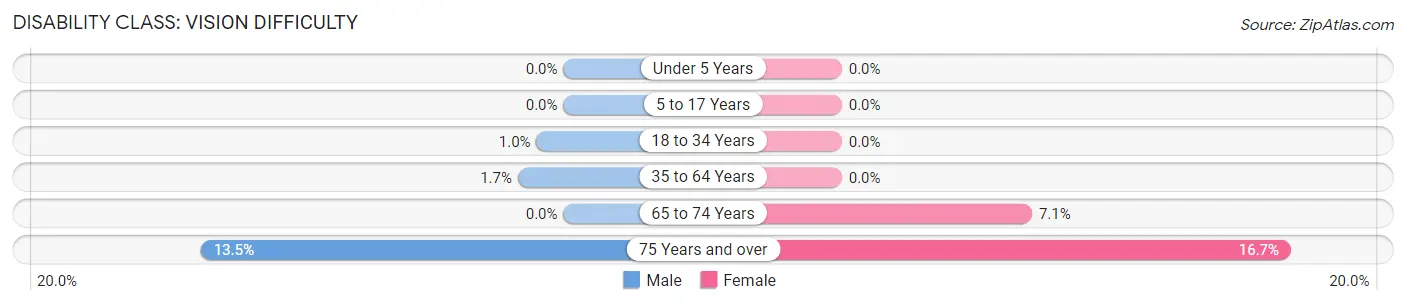
| Age Bracket | Male | Female |
| Under 5 Years | 0 (0.0%) | 0 (0.0%) |
| 5 to 17 Years | 0 (0.0%) | 0 (0.0%) |
| 18 to 34 Years | 1 (1.0%) | 0 (0.0%) |
| 35 to 64 Years | 3 (1.7%) | 0 (0.0%) |
| 65 to 74 Years | 0 (0.0%) | 6 (7.1%) |
| 75 Years and over | 7 (13.5%) | 17 (16.7%) |
Disability Class: Cognitive Difficulty
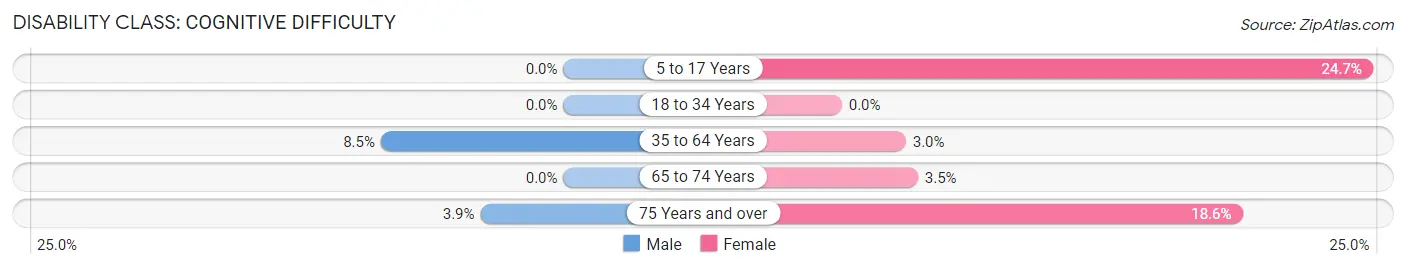
| Age Bracket | Male | Female |
| 5 to 17 Years | 0 (0.0%) | 19 (24.7%) |
| 18 to 34 Years | 0 (0.0%) | 0 (0.0%) |
| 35 to 64 Years | 15 (8.5%) | 6 (3.0%) |
| 65 to 74 Years | 0 (0.0%) | 3 (3.5%) |
| 75 Years and over | 2 (3.8%) | 19 (18.6%) |
Disability Class: Ambulatory Difficulty
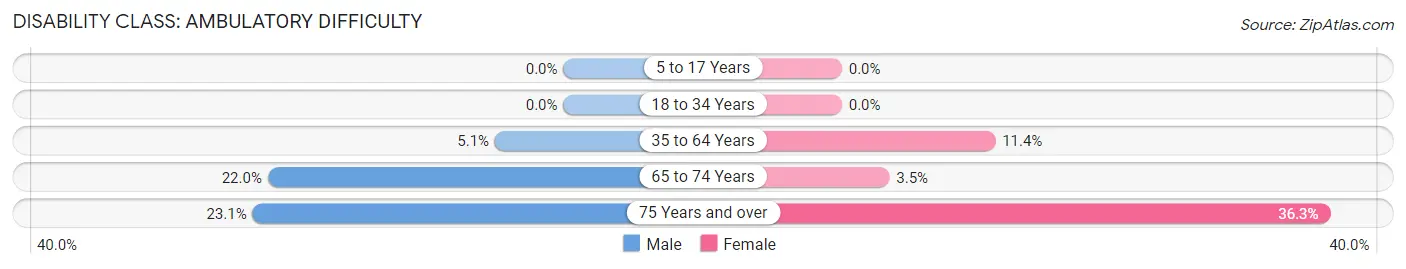
| Age Bracket | Male | Female |
| 5 to 17 Years | 0 (0.0%) | 0 (0.0%) |
| 18 to 34 Years | 0 (0.0%) | 0 (0.0%) |
| 35 to 64 Years | 9 (5.1%) | 23 (11.4%) |
| 65 to 74 Years | 18 (22.0%) | 3 (3.5%) |
| 75 Years and over | 12 (23.1%) | 37 (36.3%) |
Disability Class: Self-Care Difficulty
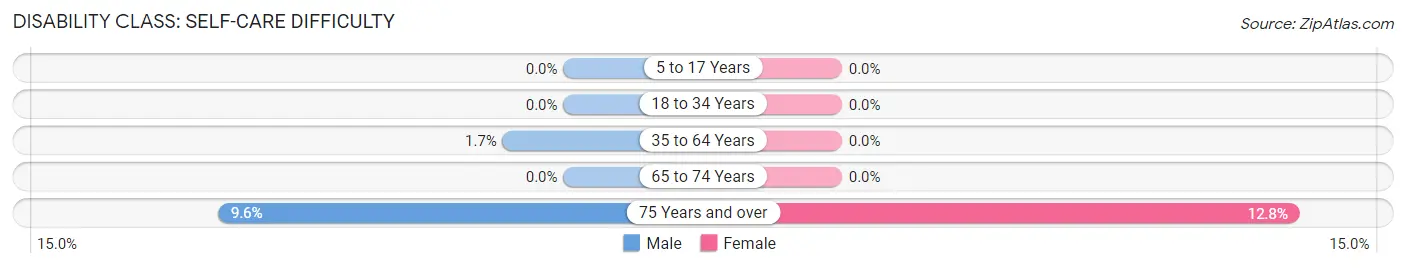
| Age Bracket | Male | Female |
| 5 to 17 Years | 0 (0.0%) | 0 (0.0%) |
| 18 to 34 Years | 0 (0.0%) | 0 (0.0%) |
| 35 to 64 Years | 3 (1.7%) | 0 (0.0%) |
| 65 to 74 Years | 0 (0.0%) | 0 (0.0%) |
| 75 Years and over | 5 (9.6%) | 13 (12.8%) |
Technology Access in Clark
Computing Device Access in Clark
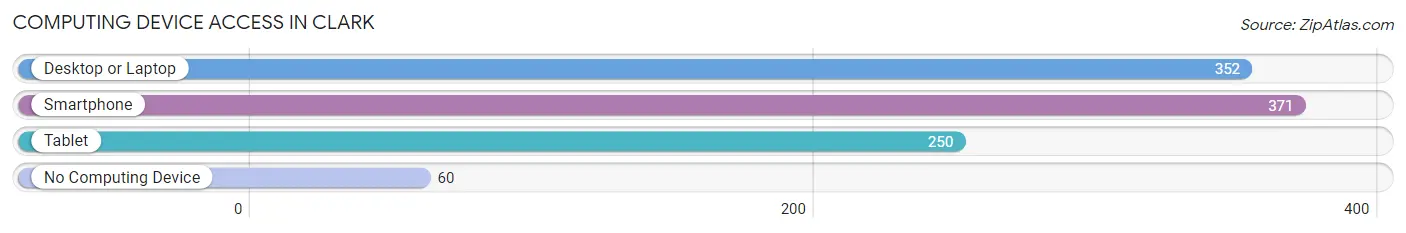
| Device Type | # Households | % Households |
| Desktop or Laptop | 352 | 71.1% |
| Smartphone | 371 | 75.0% |
| Tablet | 250 | 50.5% |
| No Computing Device | 60 | 12.1% |
| Total | 495 | 100.0% |
Internet Access in Clark
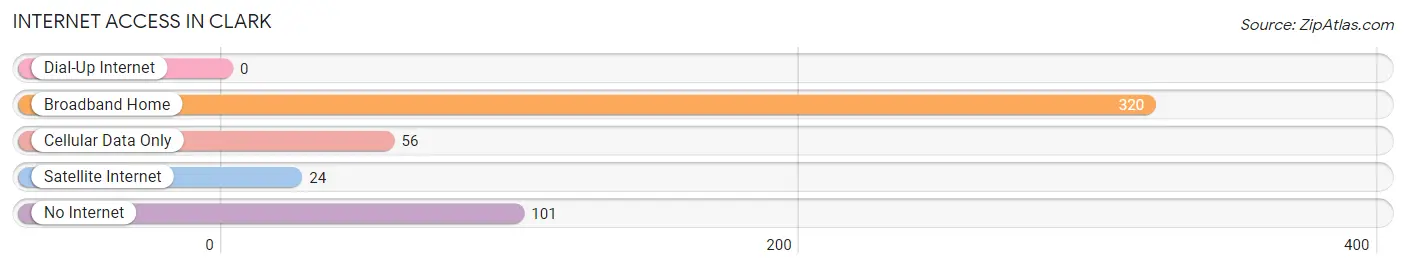
| Internet Type | # Households | % Households |
| Dial-Up Internet | 0 | 0.0% |
| Broadband Home | 320 | 64.6% |
| Cellular Data Only | 56 | 11.3% |
| Satellite Internet | 24 | 4.9% |
| No Internet | 101 | 20.4% |
| Total | 495 | 100.0% |
Clark Summary
History
Clark, South Dakota is a small city located in Clark County, South Dakota. It is the county seat of Clark County and is located in the northeastern part of the state. The city was founded in 1881 and was named after the Clark family, who were early settlers in the area. The city was incorporated in 1883 and has a population of 1,082 as of the 2010 census.
The area around Clark was first settled by Native Americans, including the Lakota Sioux, who used the area for hunting and gathering. The first white settlers arrived in the area in the late 1870s and early 1880s. The Clark family, who were among the first settlers, established a homestead in the area in 1881. The town was named after the Clark family and was incorporated in 1883.
The early years of Clark were marked by growth and development. The town was home to a variety of businesses, including a hotel, a bank, a newspaper, a lumberyard, and a variety of other businesses. The town also had a school, a post office, and a variety of churches.
In the early 1900s, the town experienced a period of growth and prosperity. The population of the town grew to over 1,000 by 1910. The town was home to a variety of businesses, including a flour mill, a creamery, a furniture store, a hardware store, and a variety of other businesses.
The town experienced a period of decline in the mid-1900s, as many of the businesses in the town closed or moved away. The population of the town declined to just over 500 by the 1970s. However, the town has experienced a resurgence in recent years, with the population increasing to over 1,000 by the 2010 census.
Geography
Clark is located in northeastern South Dakota, in Clark County. The city is situated at the intersection of U.S. Route 12 and South Dakota Highway 34. The city is located about 40 miles east of Pierre, the state capital, and about 80 miles west of Sioux Falls.
The city is located in a rural area, with the nearest large city being Watertown, which is about 40 miles to the east. The city is located in a flat, open area, with the nearest hills being located about 10 miles to the west. The city is located in the Missouri River Valley, with the Missouri River located about 10 miles to the north.
The climate in Clark is typical of the Great Plains, with hot summers and cold winters. The average high temperature in the summer is around 85 degrees Fahrenheit, while the average low temperature in the winter is around 10 degrees Fahrenheit. The area receives an average of about 20 inches of precipitation per year.
Economy
The economy of Clark is largely based on agriculture. The area is home to a variety of farms, which produce a variety of crops, including corn, soybeans, wheat, and hay. The area is also home to a variety of livestock, including cattle, sheep, and hogs.
The city is also home to a variety of businesses, including a grocery store, a hardware store, a bank, a newspaper, and a variety of other businesses. The city is also home to a variety of manufacturing businesses, including a furniture factory, a flour mill, and a creamery.
Demographics
As of the 2010 census, the population of Clark was 1,082. The population is largely white, with about 95% of the population being white. The median age of the population is about 44 years old, and the median household income is about $41,000. The city has a poverty rate of about 11%, which is slightly higher than the national average.
Common Questions
What is Per Capita Income in Clark?
Per Capita income in Clark is $35,170.
What is the Median Family Income in Clark?
Median Family Income in Clark is $69,688.
What is the Median Household income in Clark?
Median Household Income in Clark is $47,305.
What is Income or Wage Gap in Clark?
Income or Wage Gap in Clark is 41.4%.
Women in Clark earn 58.6 cents for every dollar earned by a man.
What is Inequality or Gini Index in Clark?
Inequality or Gini Index in Clark is 0.45.
What is the Total Population of Clark?
Total Population of Clark is 1,206.
What is the Total Male Population of Clark?
Total Male Population of Clark is 551.
What is the Total Female Population of Clark?
Total Female Population of Clark is 655.
What is the Ratio of Males per 100 Females in Clark?
There are 84.12 Males per 100 Females in Clark.
What is the Ratio of Females per 100 Males in Clark?
There are 118.87 Females per 100 Males in Clark.
What is the Median Population Age in Clark?
Median Population Age in Clark is 49.4 Years.
What is the Average Family Size in Clark
Average Family Size in Clark is 3.0 People.
What is the Average Household Size in Clark
Average Household Size in Clark is 2.3 People.
How Large is the Labor Force in Clark?
There are 576 People in the Labor Forcein in Clark.
What is the Percentage of People in the Labor Force in Clark?
58.5% of People are in the Labor Force in Clark.
What is the Unemployment Rate in Clark?
Unemployment Rate in Clark is 4.3%.