Presho, SD Map & Demographics
Presho Map
Presho Overview
$40,290
PER CAPITA INCOME
$78,125
AVG FAMILY INCOME
$70,833
AVG HOUSEHOLD INCOME
50.6%
WAGE / INCOME GAP [ % ]
49.4¢/ $1
WAGE / INCOME GAP [ $ ]
0.39
INEQUALITY / GINI INDEX
338
TOTAL POPULATION
183
MALE POPULATION
155
FEMALE POPULATION
118.06
MALES / 100 FEMALES
84.70
FEMALES / 100 MALES
54.6
MEDIAN AGE
2.7
AVG FAMILY SIZE
2.0
AVG HOUSEHOLD SIZE
240
LABOR FORCE [ PEOPLE ]
75.9%
PERCENT IN LABOR FORCE
2.1%
UNEMPLOYMENT RATE
Presho Zip Codes
Presho Area Codes
Income in Presho
Income Overview in Presho
Per Capita Income in Presho is $40,290, while median incomes of families and households are $78,125 and $70,833 respectively.
| Characteristic | Number | Measure |
| Per Capita Income | 338 | $40,290 |
| Median Family Income | 83 | $78,125 |
| Mean Family Income | 83 | $99,302 |
| Median Household Income | 164 | $70,833 |
| Mean Household Income | 164 | $82,031 |
| Income Deficit | 83 | $0 |
| Wage / Income Gap (%) | 338 | 50.64% |
| Wage / Income Gap ($) | 338 | 49.36¢ per $1 |
| Gini / Inequality Index | 338 | 0.39 |
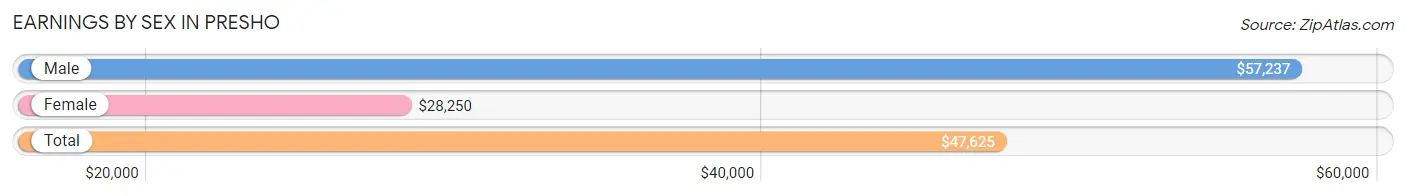
Earnings by Sex in Presho
Average Earnings in Presho are $47,625, $57,237 for men and $28,250 for women, a difference of 50.6%.
| Sex | Number | Average Earnings |
| Male | 130 (52.6%) | $57,237 |
| Female | 117 (47.4%) | $28,250 |
| Total | 247 (100.0%) | $47,625 |
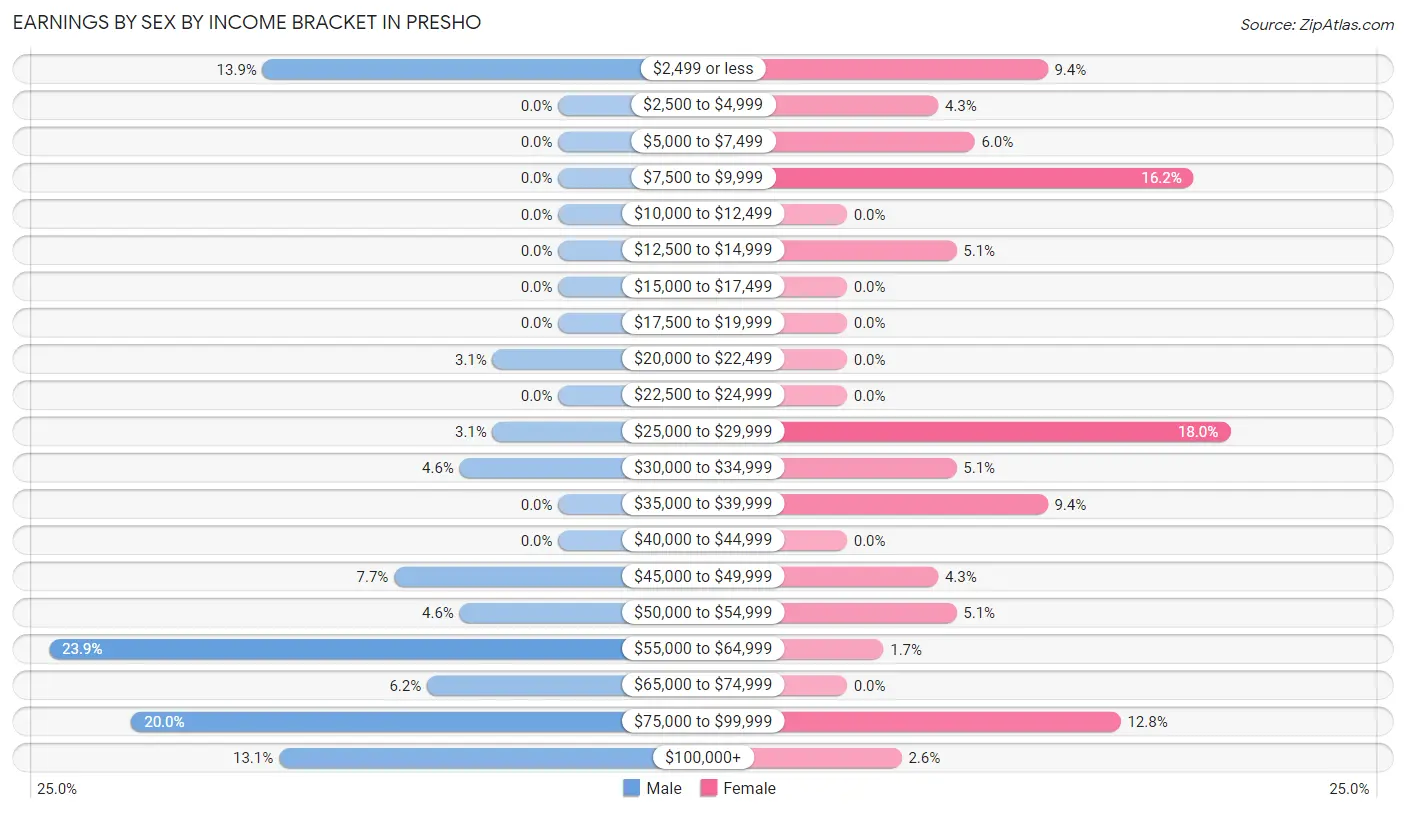
Earnings by Sex by Income Bracket in Presho
The most common earnings brackets in Presho are $55,000 to $64,999 for men (31 | 23.8%) and $25,000 to $29,999 for women (21 | 17.9%).
| Income | Male | Female |
| $2,499 or less | 18 (13.9%) | 11 (9.4%) |
| $2,500 to $4,999 | 0 (0.0%) | 5 (4.3%) |
| $5,000 to $7,499 | 0 (0.0%) | 7 (6.0%) |
| $7,500 to $9,999 | 0 (0.0%) | 19 (16.2%) |
| $10,000 to $12,499 | 0 (0.0%) | 0 (0.0%) |
| $12,500 to $14,999 | 0 (0.0%) | 6 (5.1%) |
| $15,000 to $17,499 | 0 (0.0%) | 0 (0.0%) |
| $17,500 to $19,999 | 0 (0.0%) | 0 (0.0%) |
| $20,000 to $22,499 | 4 (3.1%) | 0 (0.0%) |
| $22,500 to $24,999 | 0 (0.0%) | 0 (0.0%) |
| $25,000 to $29,999 | 4 (3.1%) | 21 (17.9%) |
| $30,000 to $34,999 | 6 (4.6%) | 6 (5.1%) |
| $35,000 to $39,999 | 0 (0.0%) | 11 (9.4%) |
| $40,000 to $44,999 | 0 (0.0%) | 0 (0.0%) |
| $45,000 to $49,999 | 10 (7.7%) | 5 (4.3%) |
| $50,000 to $54,999 | 6 (4.6%) | 6 (5.1%) |
| $55,000 to $64,999 | 31 (23.8%) | 2 (1.7%) |
| $65,000 to $74,999 | 8 (6.1%) | 0 (0.0%) |
| $75,000 to $99,999 | 26 (20.0%) | 15 (12.8%) |
| $100,000+ | 17 (13.1%) | 3 (2.6%) |
| Total | 130 (100.0%) | 117 (100.0%) |
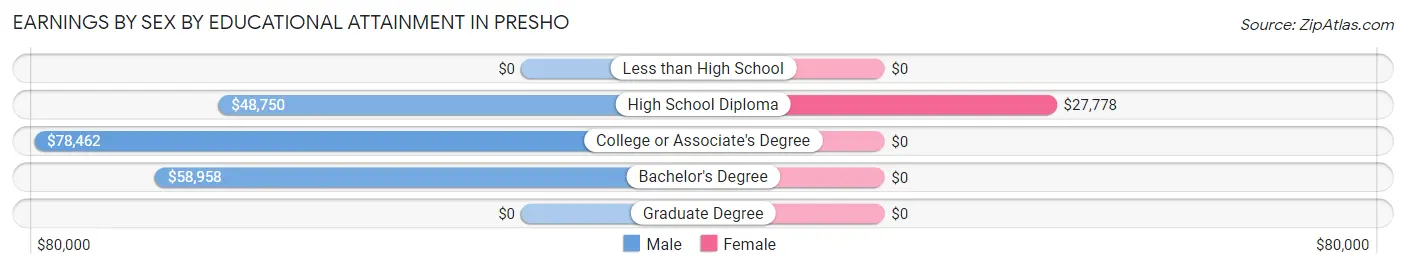
Earnings by Sex by Educational Attainment in Presho
Average earnings in Presho are $59,063 for men and $28,750 for women, a difference of 51.3%. Men with an educational attainment of college or associate's degree enjoy the highest average annual earnings of $78,462, while those with high school diploma education earn the least with $48,750. Women with an educational attainment of high school diploma earn the most with the average annual earnings of $27,778, while those with high school diploma education have the smallest earnings of $27,778.
| Educational Attainment | Male Income | Female Income |
| Less than High School | - | - |
| High School Diploma | $48,750 | $27,778 |
| College or Associate's Degree | $78,462 | $0 |
| Bachelor's Degree | $58,958 | $0 |
| Graduate Degree | - | - |
| Total | $59,063 | $28,750 |
Family Income in Presho
Family Income Brackets in Presho
According to the Presho family income data, there are 17 families falling into the $50,000 to $74,999 income range, which is the most common income bracket and makes up 20.5% of all families.
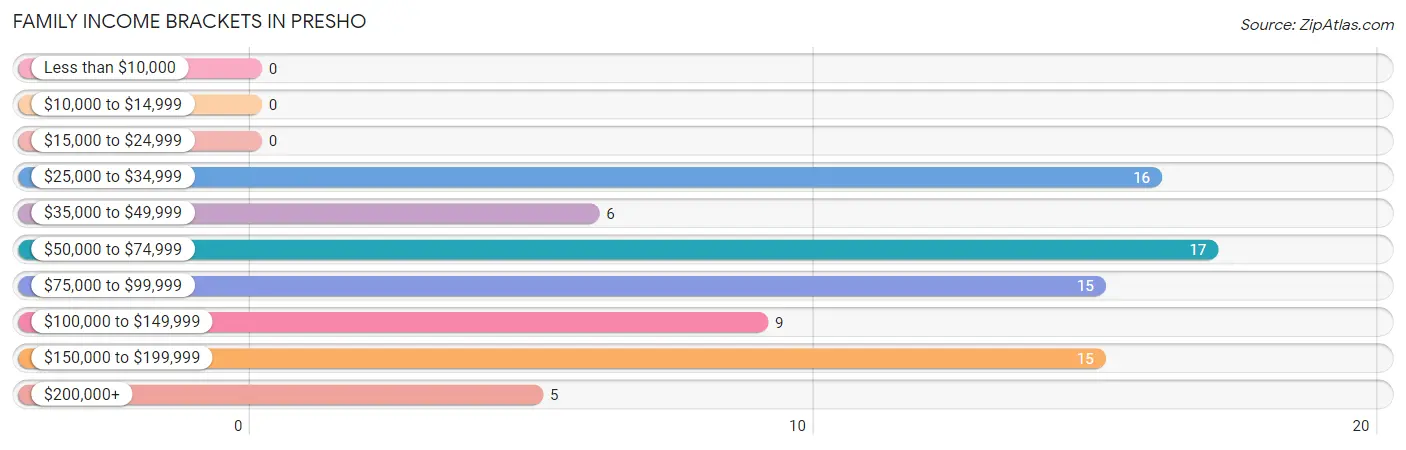
| Income Bracket | # Families | % Families |
| Less than $10,000 | 0 | 0.0% |
| $10,000 to $14,999 | 0 | 0.0% |
| $15,000 to $24,999 | 0 | 0.0% |
| $25,000 to $34,999 | 16 | 19.3% |
| $35,000 to $49,999 | 6 | 7.2% |
| $50,000 to $74,999 | 17 | 20.5% |
| $75,000 to $99,999 | 15 | 18.1% |
| $100,000 to $149,999 | 9 | 10.8% |
| $150,000 to $199,999 | 15 | 18.1% |
| $200,000+ | 5 | 6.0% |
Family Income by Famaliy Size in Presho
2-person families (50 | 60.2%) account for the highest median family income in Presho with $68,125 per family, while 2-person families (50 | 60.2%) have the highest median income of $34,062 per family member.
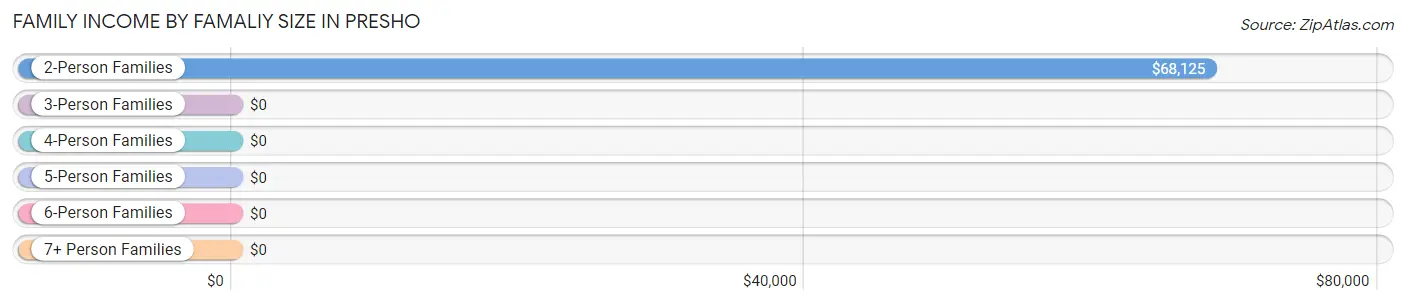
| Income Bracket | # Families | Median Income |
| 2-Person Families | 50 (60.2%) | $68,125 |
| 3-Person Families | 19 (22.9%) | $0 |
| 4-Person Families | 9 (10.8%) | $0 |
| 5-Person Families | 5 (6.0%) | $0 |
| 6-Person Families | 0 (0.0%) | $0 |
| 7+ Person Families | 0 (0.0%) | $0 |
| Total | 83 (100.0%) | $78,125 |
Family Income by Number of Earners in Presho
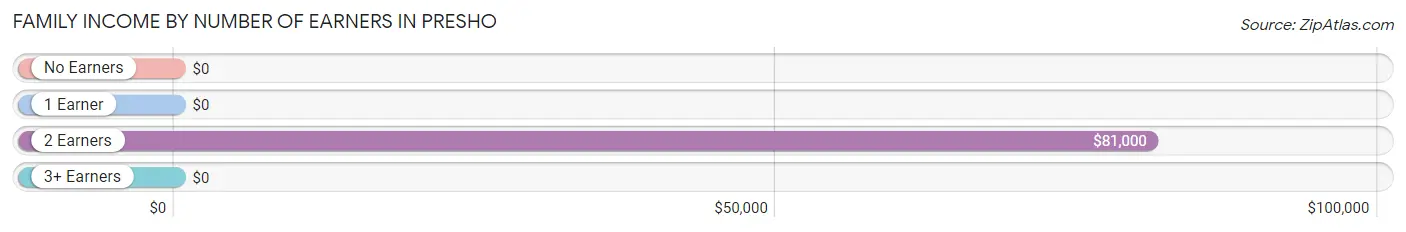
| Number of Earners | # Families | Median Income |
| No Earners | 0 (0.0%) | $0 |
| 1 Earner | 24 (28.9%) | $0 |
| 2 Earners | 54 (65.1%) | $81,000 |
| 3+ Earners | 5 (6.0%) | $0 |
| Total | 83 (100.0%) | $78,125 |
Household Income in Presho
Household Income Brackets in Presho
With 33 households falling in the category, the $50,000 to $74,999 income range is the most frequent in Presho, accounting for 20.1% of all households.
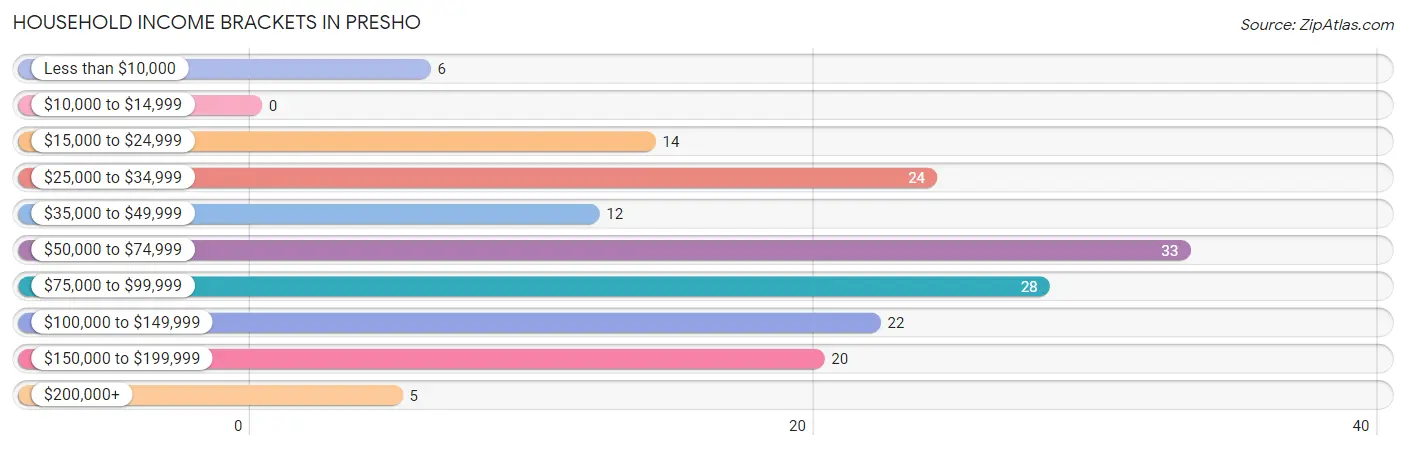
| Income Bracket | # Households | % Households |
| Less than $10,000 | 6 | 3.7% |
| $10,000 to $14,999 | 0 | 0.0% |
| $15,000 to $24,999 | 14 | 8.5% |
| $25,000 to $34,999 | 24 | 14.6% |
| $35,000 to $49,999 | 12 | 7.3% |
| $50,000 to $74,999 | 33 | 20.1% |
| $75,000 to $99,999 | 28 | 17.1% |
| $100,000 to $149,999 | 22 | 13.4% |
| $150,000 to $199,999 | 20 | 12.2% |
| $200,000+ | 5 | 3.0% |
Household Income by Householder Age in Presho
The median household income in Presho is $70,833, with the highest median household income of $69,000 found in the 45 to 64 years age bracket for the primary householder. A total of 96 households (58.5%) fall into this category.
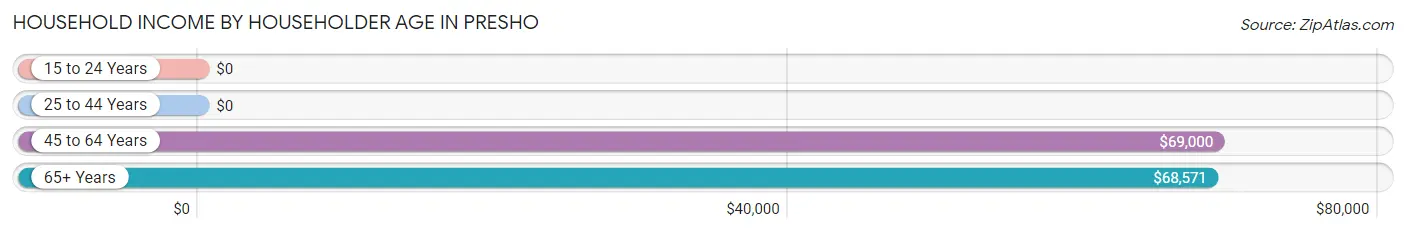
| Income Bracket | # Households | Median Income |
| 15 to 24 Years | 0 (0.0%) | $0 |
| 25 to 44 Years | 30 (18.3%) | $0 |
| 45 to 64 Years | 96 (58.5%) | $69,000 |
| 65+ Years | 38 (23.2%) | $68,571 |
| Total | 164 (100.0%) | $70,833 |
Poverty in Presho
Income Below Poverty by Sex and Age in Presho
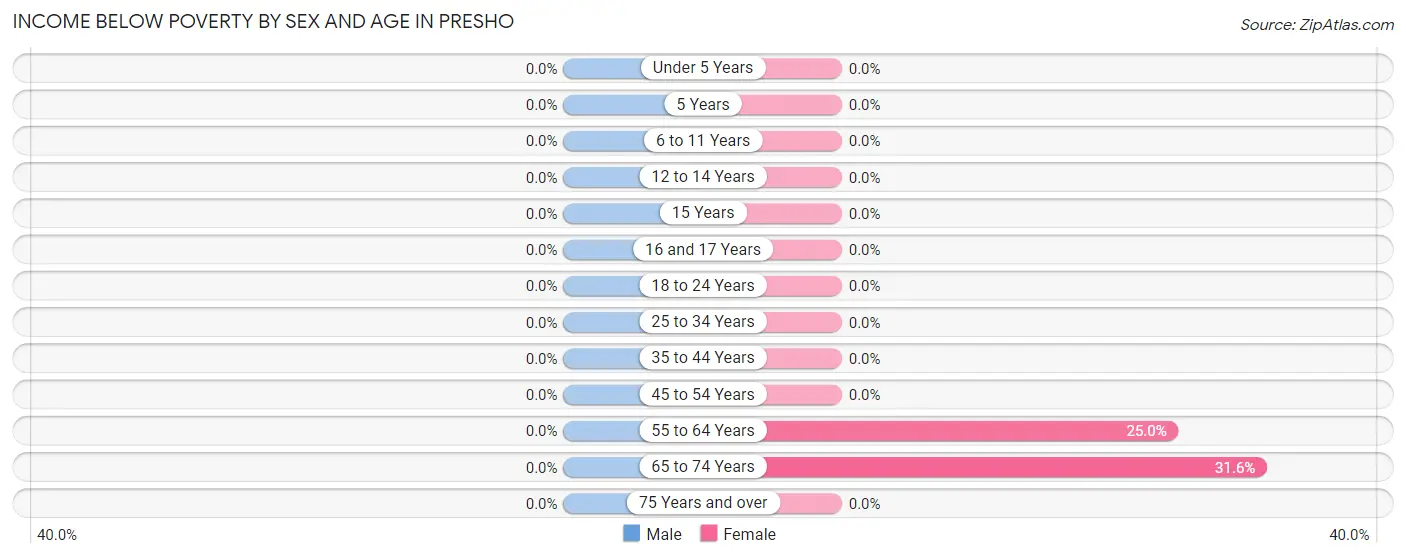
| Age Bracket | Male | Female |
| Under 5 Years | 0 (0.0%) | 0 (0.0%) |
| 5 Years | 0 (0.0%) | 0 (0.0%) |
| 6 to 11 Years | 0 (0.0%) | 0 (0.0%) |
| 12 to 14 Years | 0 (0.0%) | 0 (0.0%) |
| 15 Years | 0 (0.0%) | 0 (0.0%) |
| 16 and 17 Years | 0 (0.0%) | 0 (0.0%) |
| 18 to 24 Years | 0 (0.0%) | 0 (0.0%) |
| 25 to 34 Years | 0 (0.0%) | 0 (0.0%) |
| 35 to 44 Years | 0 (0.0%) | 0 (0.0%) |
| 45 to 54 Years | 0 (0.0%) | 0 (0.0%) |
| 55 to 64 Years | 0 (0.0%) | 15 (25.0%) |
| 65 to 74 Years | 0 (0.0%) | 6 (31.6%) |
| 75 Years and over | 0 (0.0%) | 0 (0.0%) |
| Total | 0 (0.0%) | 21 (13.7%) |
Income Above Poverty by Sex and Age in Presho
According to the poverty statistics in Presho, males aged under 5 years and females aged under 5 years are the age groups that are most secure financially, with 100.0% of males and 100.0% of females in these age groups living above the poverty line.
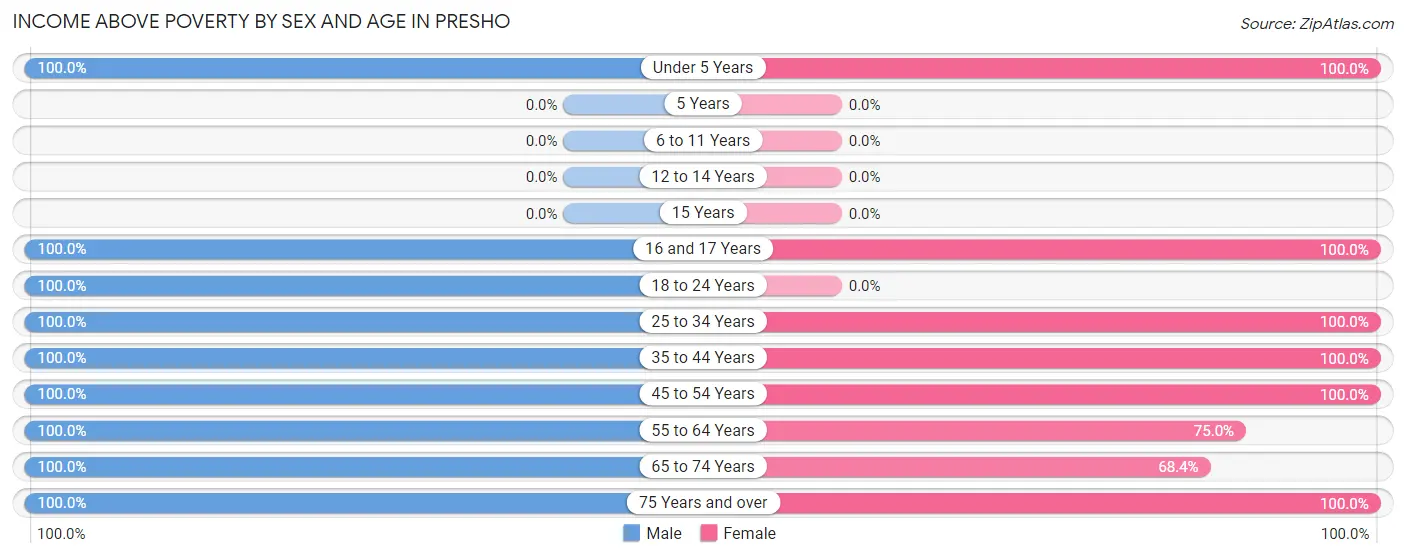
| Age Bracket | Male | Female |
| Under 5 Years | 17 (100.0%) | 5 (100.0%) |
| 5 Years | 0 (0.0%) | 0 (0.0%) |
| 6 to 11 Years | 0 (0.0%) | 0 (0.0%) |
| 12 to 14 Years | 0 (0.0%) | 0 (0.0%) |
| 15 Years | 0 (0.0%) | 0 (0.0%) |
| 16 and 17 Years | 7 (100.0%) | 6 (100.0%) |
| 18 to 24 Years | 19 (100.0%) | 0 (0.0%) |
| 25 to 34 Years | 12 (100.0%) | 11 (100.0%) |
| 35 to 44 Years | 4 (100.0%) | 20 (100.0%) |
| 45 to 54 Years | 54 (100.0%) | 18 (100.0%) |
| 55 to 64 Years | 61 (100.0%) | 45 (75.0%) |
| 65 to 74 Years | 5 (100.0%) | 13 (68.4%) |
| 75 Years and over | 4 (100.0%) | 14 (100.0%) |
| Total | 183 (100.0%) | 132 (86.3%) |
Income Below Poverty Among Married-Couple Families in Presho
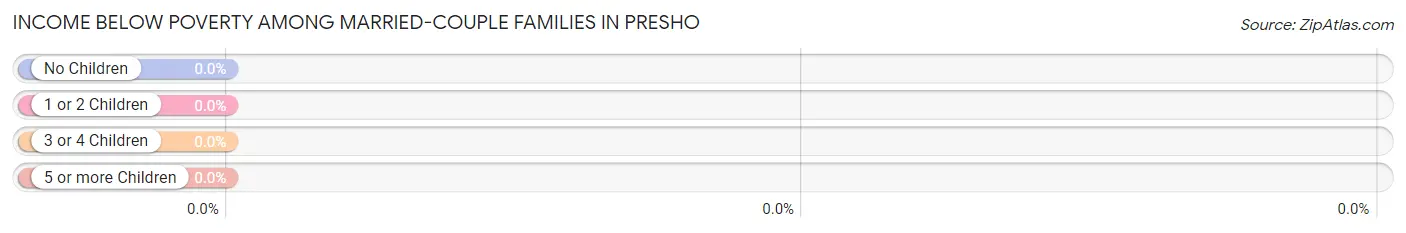
| Children | Above Poverty | Below Poverty |
| No Children | 45 (100.0%) | 0 (0.0%) |
| 1 or 2 Children | 23 (100.0%) | 0 (0.0%) |
| 3 or 4 Children | 5 (100.0%) | 0 (0.0%) |
| 5 or more Children | 0 (0.0%) | 0 (0.0%) |
| Total | 73 (100.0%) | 0 (0.0%) |
Income Below Poverty Among Single-Parent Households in Presho
| Children | Single Father | Single Mother |
| No Children | 0 (0.0%) | 0 (0.0%) |
| 1 or 2 Children | 0 (0.0%) | 0 (0.0%) |
| 3 or 4 Children | 0 (0.0%) | 0 (0.0%) |
| 5 or more Children | 0 (0.0%) | 0 (0.0%) |
| Total | 0 (0.0%) | 0 (0.0%) |
Income Below Poverty Among Married-Couple vs Single-Parent Households in Presho
| Children | Married-Couple Families | Single-Parent Households |
| No Children | 0 (0.0%) | 0 (0.0%) |
| 1 or 2 Children | 0 (0.0%) | 0 (0.0%) |
| 3 or 4 Children | 0 (0.0%) | 0 (0.0%) |
| 5 or more Children | 0 (0.0%) | 0 (0.0%) |
| Total | 0 (0.0%) | 0 (0.0%) |
Race in Presho
The most populous races in Presho are White / Caucasian (332 | 98.2%), Hispanic or Latino (6 | 1.8%), and Two or more Races (6 | 1.8%).
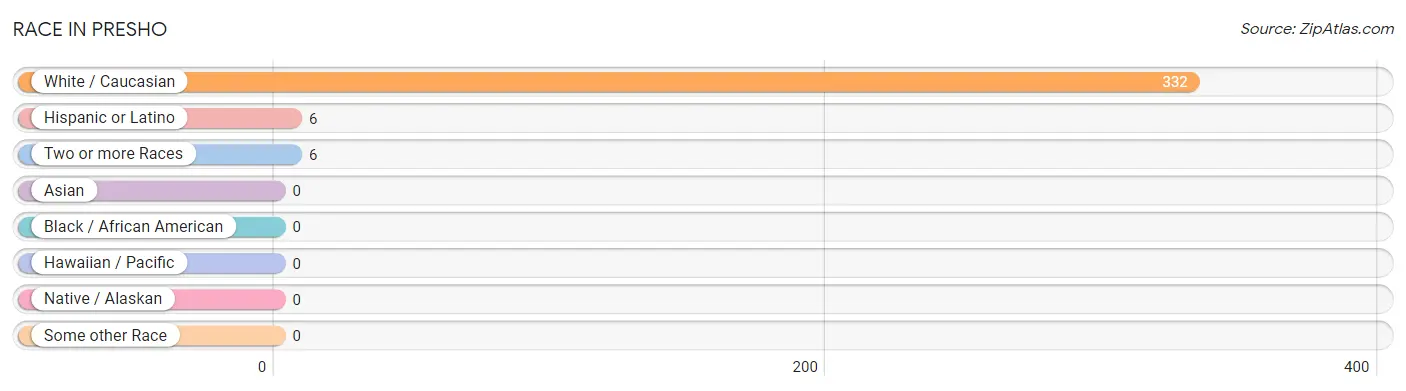
| Race | # Population | % Population |
| Asian | 0 | 0.0% |
| Black / African American | 0 | 0.0% |
| Hawaiian / Pacific | 0 | 0.0% |
| Hispanic or Latino | 6 | 1.8% |
| Native / Alaskan | 0 | 0.0% |
| White / Caucasian | 332 | 98.2% |
| Two or more Races | 6 | 1.8% |
| Some other Race | 0 | 0.0% |
| Total | 338 | 100.0% |
Ancestry in Presho
The most populous ancestries reported in Presho are German (147 | 43.5%), Irish (60 | 17.7%), Norwegian (58 | 17.2%), Czech (30 | 8.9%), and English (30 | 8.9%), together accounting for 96.2% of all Presho residents.
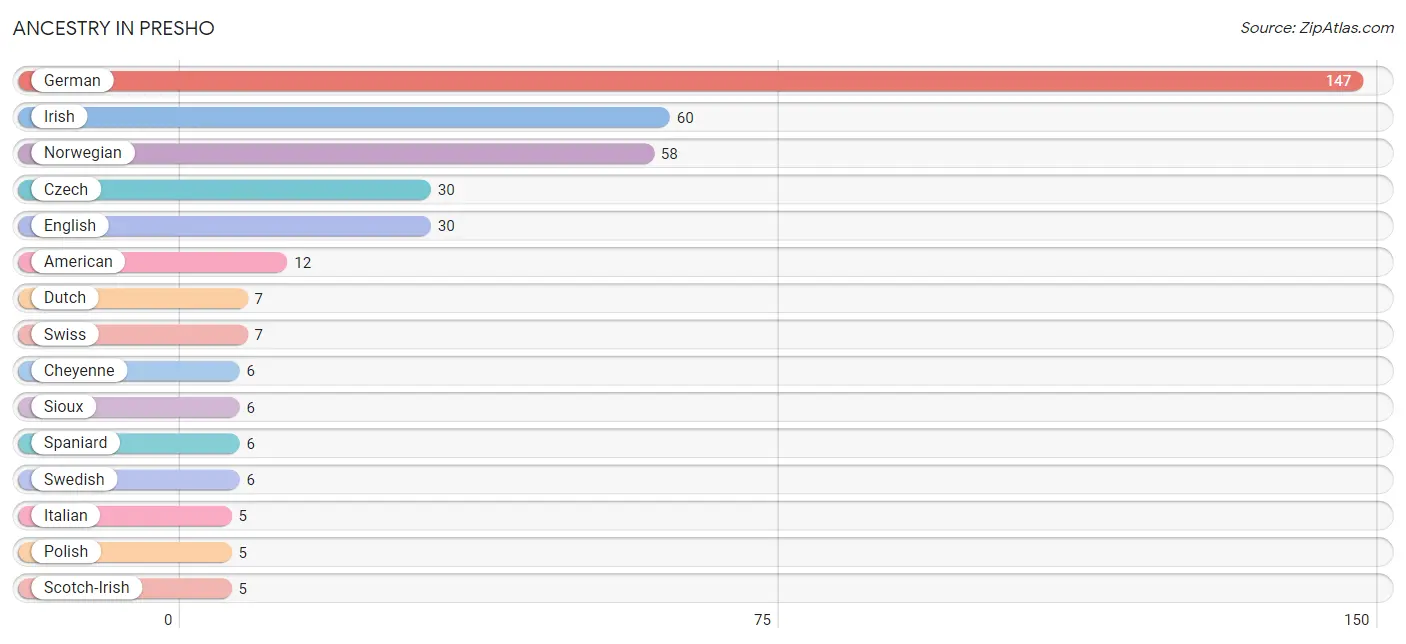
| Ancestry | # Population | % Population |
| American | 12 | 3.5% |
| Cheyenne | 6 | 1.8% |
| Czech | 30 | 8.9% |
| Dutch | 7 | 2.1% |
| English | 30 | 8.9% |
| German | 147 | 43.5% |
| Irish | 60 | 17.7% |
| Italian | 5 | 1.5% |
| Norwegian | 58 | 17.2% |
| Polish | 5 | 1.5% |
| Scotch-Irish | 5 | 1.5% |
| Scottish | 4 | 1.2% |
| Sioux | 6 | 1.8% |
| Spaniard | 6 | 1.8% |
| Swedish | 6 | 1.8% |
| Swiss | 7 | 2.1% | View All 16 Rows |
Immigrants in Presho

| Immigration Origin | # Population | % Population | View All 0 Rows |
Sex and Age in Presho
Sex and Age in Presho
The most populous age groups in Presho are 55 to 59 Years (43 | 23.5%) for men and 55 to 59 Years (31 | 20.0%) for women.
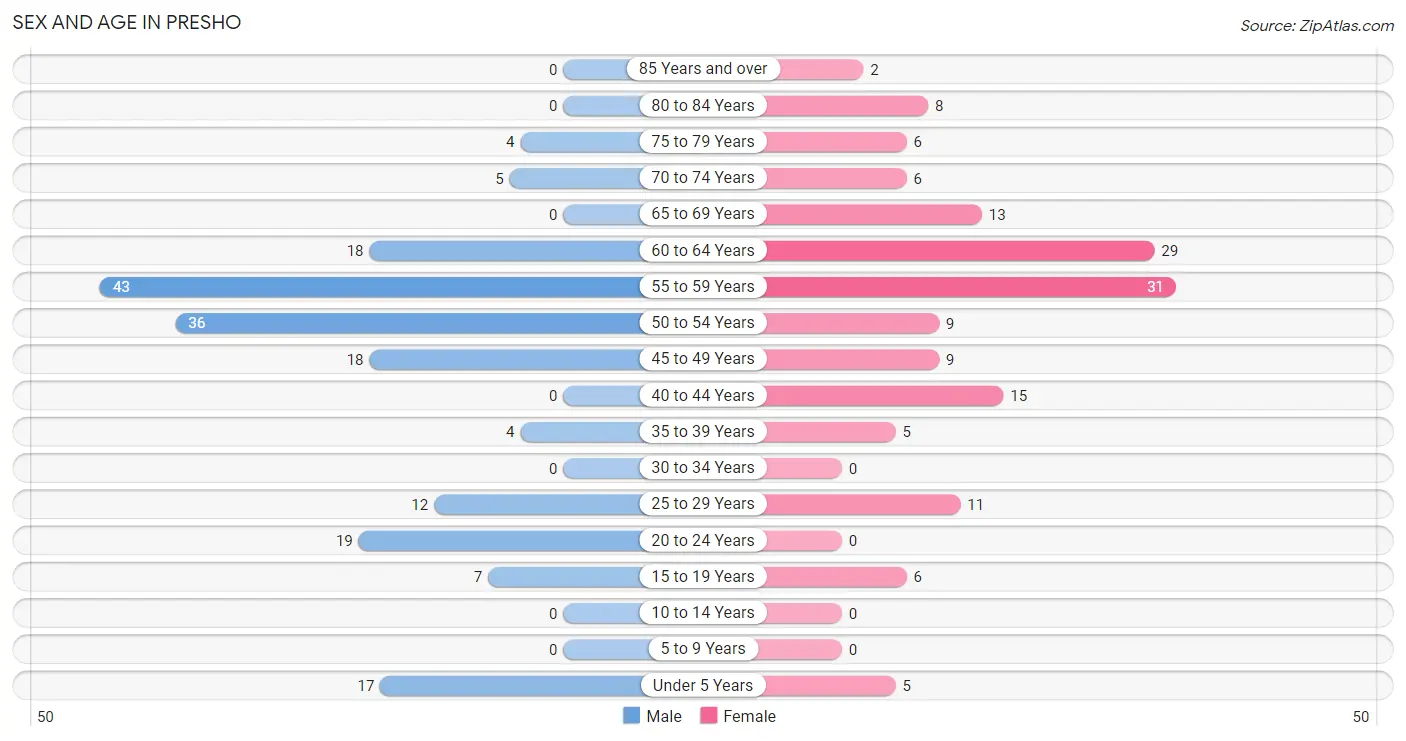
| Age Bracket | Male | Female |
| Under 5 Years | 17 (9.3%) | 5 (3.2%) |
| 5 to 9 Years | 0 (0.0%) | 0 (0.0%) |
| 10 to 14 Years | 0 (0.0%) | 0 (0.0%) |
| 15 to 19 Years | 7 (3.8%) | 6 (3.9%) |
| 20 to 24 Years | 19 (10.4%) | 0 (0.0%) |
| 25 to 29 Years | 12 (6.6%) | 11 (7.1%) |
| 30 to 34 Years | 0 (0.0%) | 0 (0.0%) |
| 35 to 39 Years | 4 (2.2%) | 5 (3.2%) |
| 40 to 44 Years | 0 (0.0%) | 15 (9.7%) |
| 45 to 49 Years | 18 (9.8%) | 9 (5.8%) |
| 50 to 54 Years | 36 (19.7%) | 9 (5.8%) |
| 55 to 59 Years | 43 (23.5%) | 31 (20.0%) |
| 60 to 64 Years | 18 (9.8%) | 29 (18.7%) |
| 65 to 69 Years | 0 (0.0%) | 13 (8.4%) |
| 70 to 74 Years | 5 (2.7%) | 6 (3.9%) |
| 75 to 79 Years | 4 (2.2%) | 6 (3.9%) |
| 80 to 84 Years | 0 (0.0%) | 8 (5.2%) |
| 85 Years and over | 0 (0.0%) | 2 (1.3%) |
| Total | 183 (100.0%) | 155 (100.0%) |
Families and Households in Presho
Median Family Size in Presho
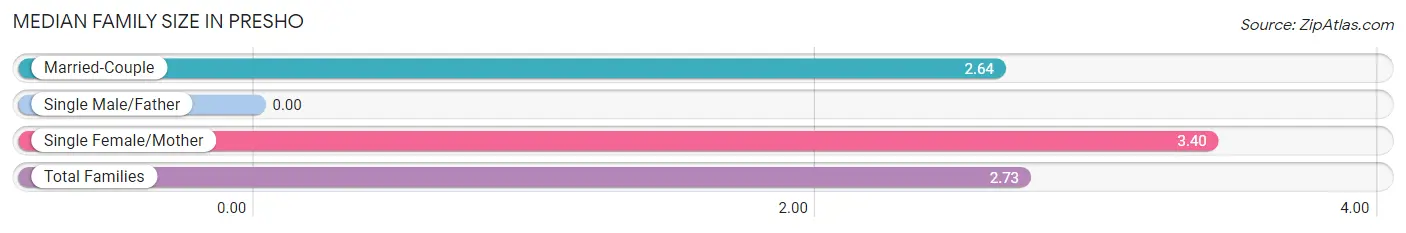
| Family Type | # Families | Family Size |
| Married-Couple | 73 (87.9%) | 2.64 |
| Single Male/Father | 0 (0.0%) | - |
| Single Female/Mother | 10 (12.0%) | 3.40 |
| Total Families | 83 (100.0%) | 2.73 |
Median Household Size in Presho
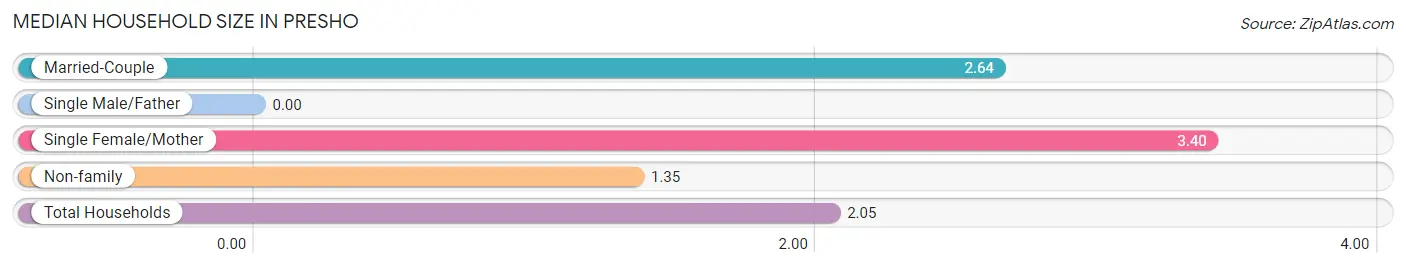
| Household Type | # Households | Household Size |
| Married-Couple | 73 (44.5%) | 2.64 |
| Single Male/Father | 0 (0.0%) | - |
| Single Female/Mother | 10 (6.1%) | 3.40 |
| Non-family | 81 (49.4%) | 1.35 |
| Total Households | 164 (100.0%) | 2.05 |
Household Size by Marriage Status in Presho
Out of a total of 164 households in Presho, 83 (50.6%) are family households, while 81 (49.4%) are nonfamily households. The most numerous type of family households are 2-person households, comprising 50, and the most common type of nonfamily households are 1-person households, comprising 59.
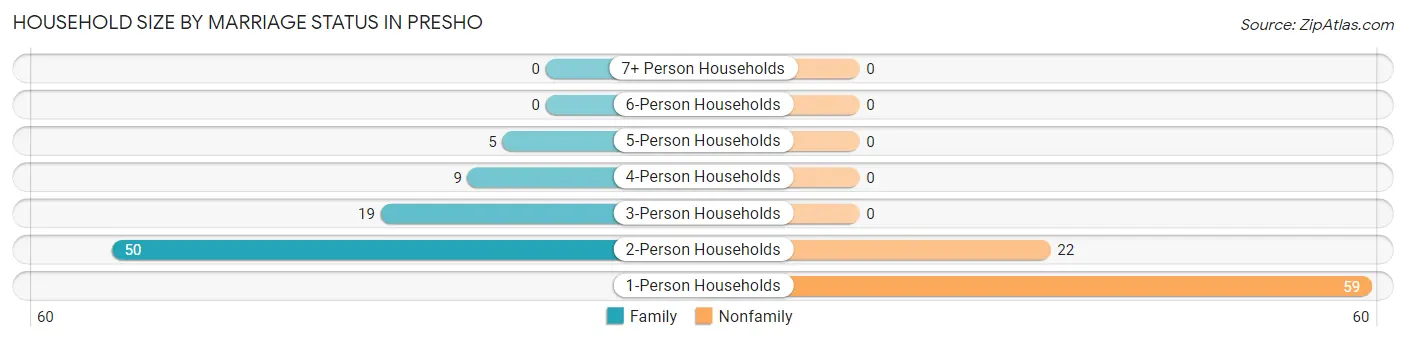
| Household Size | Family Households | Nonfamily Households |
| 1-Person Households | - | 59 (36.0%) |
| 2-Person Households | 50 (30.5%) | 22 (13.4%) |
| 3-Person Households | 19 (11.6%) | 0 (0.0%) |
| 4-Person Households | 9 (5.5%) | 0 (0.0%) |
| 5-Person Households | 5 (3.0%) | 0 (0.0%) |
| 6-Person Households | 0 (0.0%) | 0 (0.0%) |
| 7+ Person Households | 0 (0.0%) | 0 (0.0%) |
| Total | 83 (50.6%) | 81 (49.4%) |
Female Fertility in Presho
Fertility by Age in Presho
Average fertility rate in Presho is 224.0 births per 1,000 women. Women in the age bracket of 20 to 34 years have the highest fertility rate with 1,000.0 births per 1,000 women. Women in the age bracket of 20 to 34 years acount for 100.0% of all women with births.
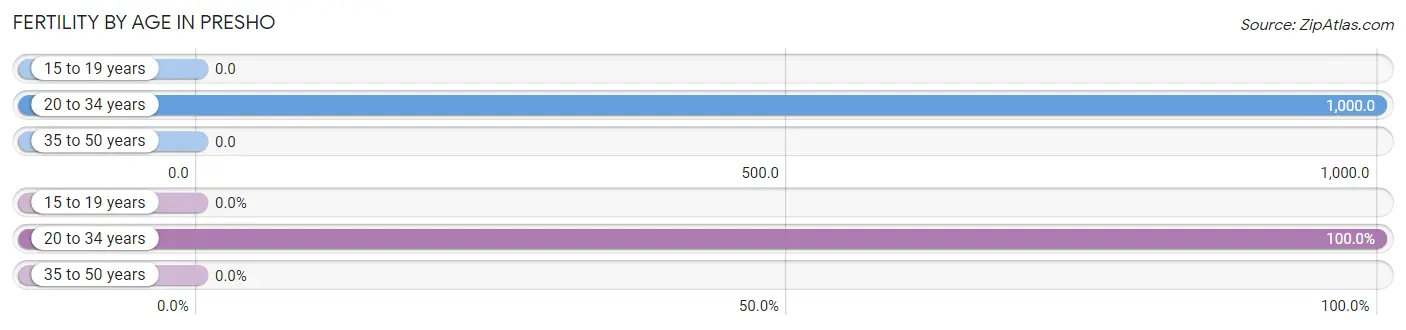
| Age Bracket | Women with Births | Births / 1,000 Women |
| 15 to 19 years | 0 (0.0%) | 0.0 |
| 20 to 34 years | 11 (100.0%) | 1,000.0 |
| 35 to 50 years | 0 (0.0%) | 0.0 |
| Total | 11 (100.0%) | 224.0 |
Fertility by Age by Marriage Status in Presho
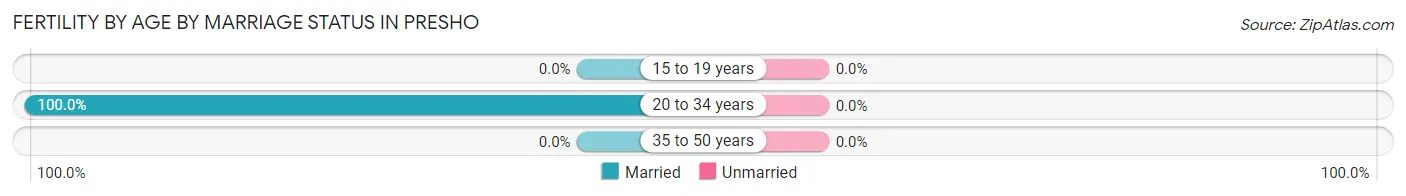
| Age Bracket | Married | Unmarried |
| 15 to 19 years | 0 (0.0%) | 0 (0.0%) |
| 20 to 34 years | 11 (100.0%) | 0 (0.0%) |
| 35 to 50 years | 0 (0.0%) | 0 (0.0%) |
| Total | 11 (100.0%) | 0 (0.0%) |
Fertility by Education in Presho
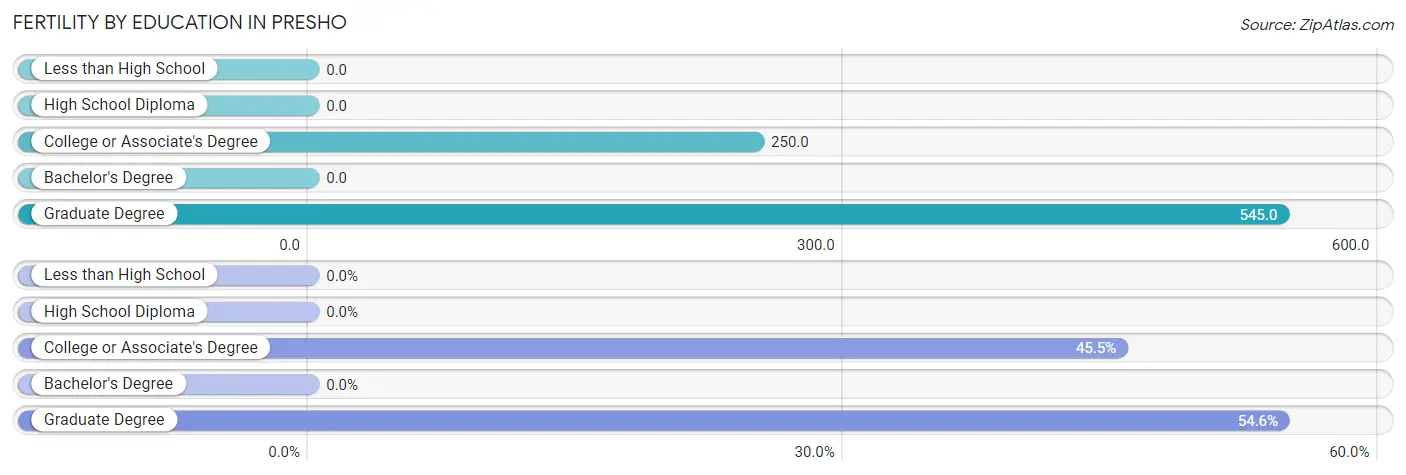
| Educational Attainment | Women with Births | Births / 1,000 Women |
| Less than High School | 0 (0.0%) | 0.0 |
| High School Diploma | 0 (0.0%) | 0.0 |
| College or Associate's Degree | 5 (45.5%) | 250.0 |
| Bachelor's Degree | 0 (0.0%) | 0.0 |
| Graduate Degree | 6 (54.5%) | 545.0 |
| Total | 11 (100.0%) | 224.0 |
Fertility by Education by Marriage Status in Presho
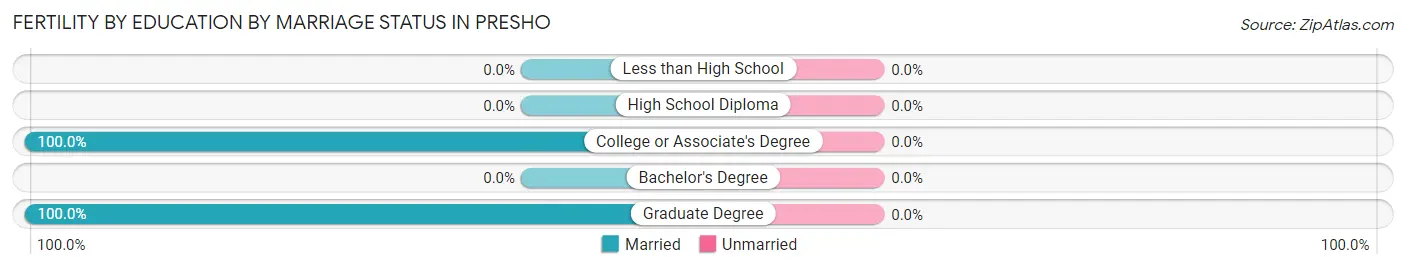
| Educational Attainment | Married | Unmarried |
| Less than High School | 0 (0.0%) | 0 (0.0%) |
| High School Diploma | 0 (0.0%) | 0 (0.0%) |
| College or Associate's Degree | 5 (100.0%) | 0 (0.0%) |
| Bachelor's Degree | 0 (0.0%) | 0 (0.0%) |
| Graduate Degree | 6 (100.0%) | 0 (0.0%) |
| Total | 11 (100.0%) | 0 (0.0%) |
Employment Characteristics in Presho
Employment by Class of Employer in Presho
Among the 231 employed individuals in Presho, private company employees (92 | 39.8%), self-employed (not incorporated) (59 | 25.5%), and local government employees (50 | 21.6%) make up the most common classes of employment.
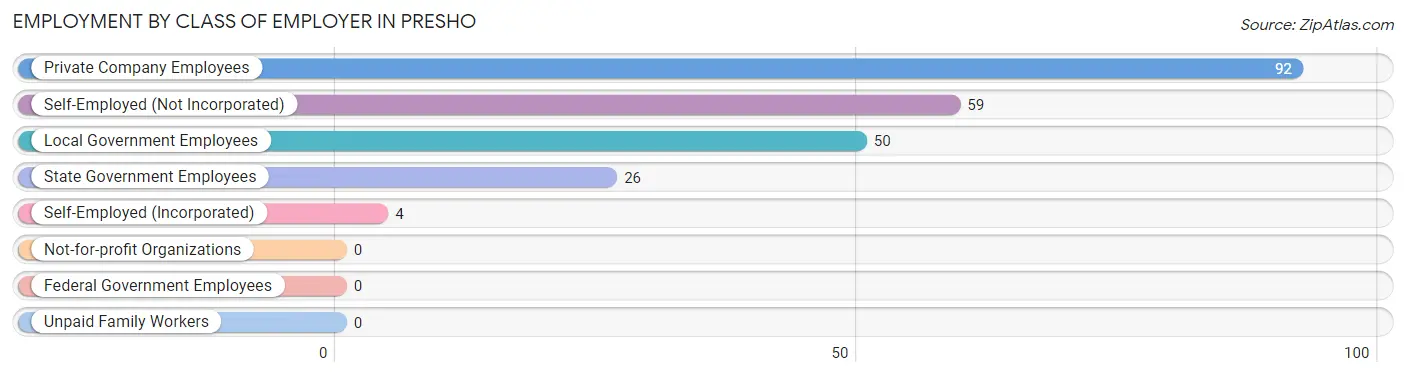
| Employer Class | # Employees | % Employees |
| Private Company Employees | 92 | 39.8% |
| Self-Employed (Incorporated) | 4 | 1.7% |
| Self-Employed (Not Incorporated) | 59 | 25.5% |
| Not-for-profit Organizations | 0 | 0.0% |
| Local Government Employees | 50 | 21.6% |
| State Government Employees | 26 | 11.3% |
| Federal Government Employees | 0 | 0.0% |
| Unpaid Family Workers | 0 | 0.0% |
| Total | 231 | 100.0% |
Employment Status by Age in Presho
According to the labor force statistics for Presho, out of the total population over 16 years of age (316), 75.9% or 240 individuals are in the labor force, with 2.1% or 5 of them unemployed. The age group with the highest labor force participation rate is 20 to 24 years, with 100.0% or 19 individuals in the labor force. Within the labor force, the 55 to 59 years age range has the highest percentage of unemployed individuals, with 7.9% or 5 of them being unemployed.
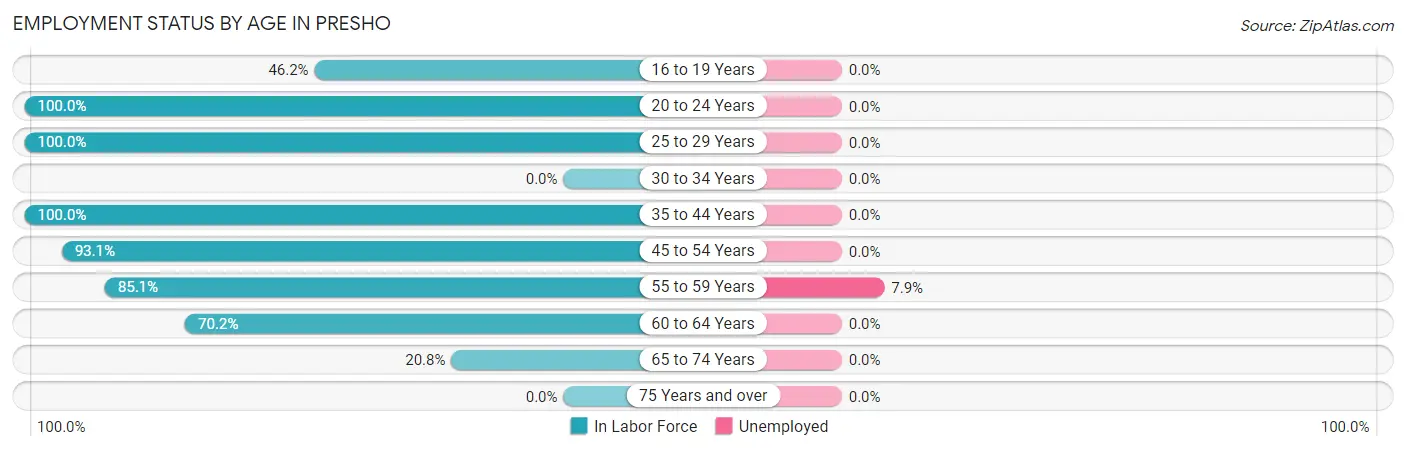
| Age Bracket | In Labor Force | Unemployed |
| 16 to 19 Years | 6 (46.2%) | 0 (0.0%) |
| 20 to 24 Years | 19 (100.0%) | 0 (0.0%) |
| 25 to 29 Years | 23 (100.0%) | 0 (0.0%) |
| 30 to 34 Years | 0 (0.0%) | 0 (0.0%) |
| 35 to 44 Years | 24 (100.0%) | 0 (0.0%) |
| 45 to 54 Years | 67 (93.1%) | 0 (0.0%) |
| 55 to 59 Years | 63 (85.1%) | 5 (7.9%) |
| 60 to 64 Years | 33 (70.2%) | 0 (0.0%) |
| 65 to 74 Years | 5 (20.8%) | 0 (0.0%) |
| 75 Years and over | 0 (0.0%) | 0 (0.0%) |
| Total | 240 (75.9%) | 5 (2.1%) |
Employment Status by Educational Attainment in Presho
According to labor force statistics for Presho, 87.5% of individuals (210) out of the total population between 25 and 64 years of age (240) are in the labor force, with 2.4% or 5 of them being unemployed. The group with the highest labor force participation rate are those with the educational attainment of less than high school, with 100.0% or 4 individuals in the labor force. Within the labor force, individuals with high school diploma education have the highest percentage of unemployment, with 5.4% or 5 of them being unemployed.
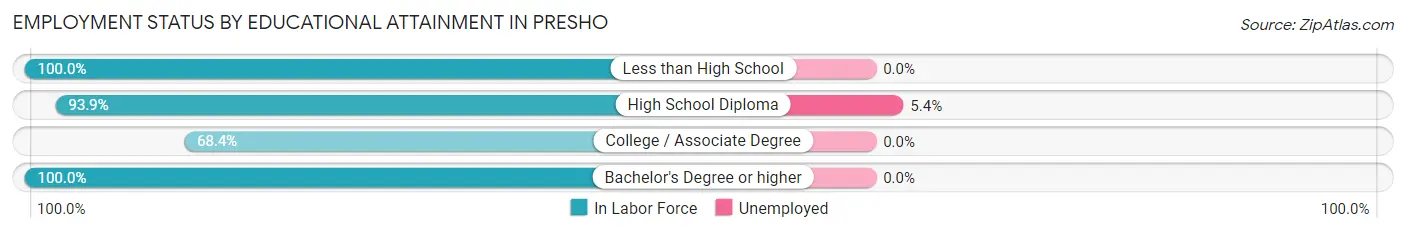
| Educational Attainment | In Labor Force | Unemployed |
| Less than High School | 4 (100.0%) | 0 (0.0%) |
| High School Diploma | 92 (93.9%) | 5 (5.4%) |
| College / Associate Degree | 52 (68.4%) | 0 (0.0%) |
| Bachelor's Degree or higher | 62 (100.0%) | 0 (0.0%) |
| Total | 210 (87.5%) | 6 (2.4%) |
Employment Occupations by Sex in Presho
Management, Business, Science and Arts Occupations
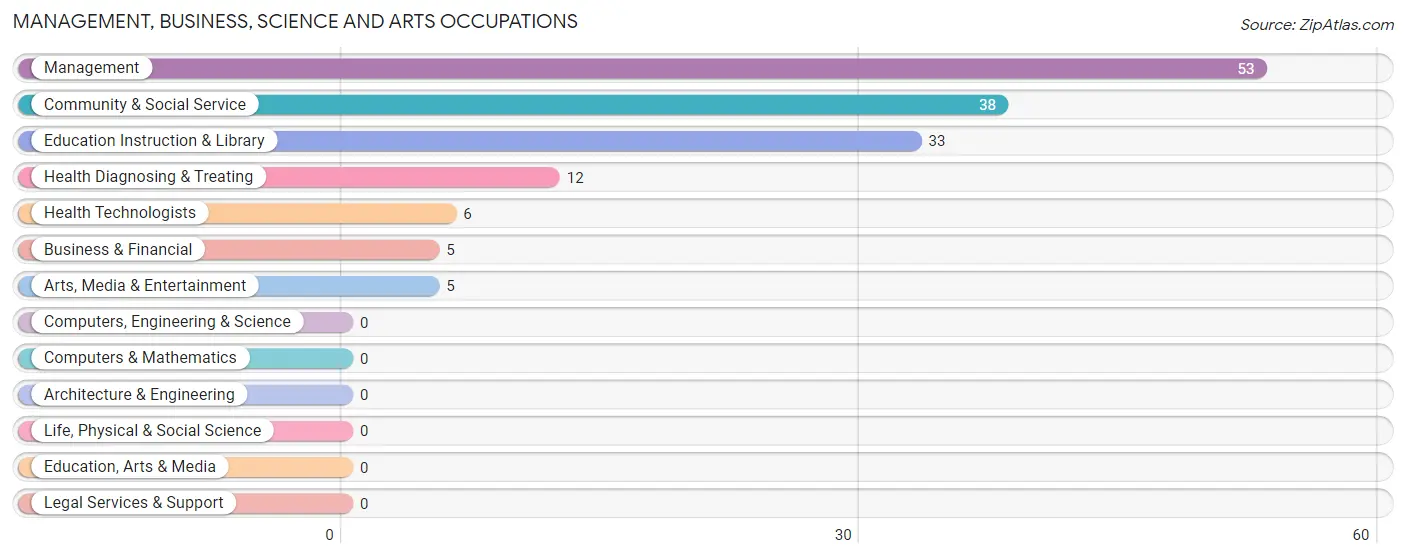
The most common Management, Business, Science and Arts occupations in Presho are Management (53 | 22.6%), Community & Social Service (38 | 16.2%), Education Instruction & Library (33 | 14.0%), Health Diagnosing & Treating (12 | 5.1%), and Health Technologists (6 | 2.5%).
Management, Business, Science and Arts Occupations by Sex
Within the Management, Business, Science and Arts occupations in Presho, the most male-oriented occupations are Business & Financial (100.0%), Management (90.6%), and Education Instruction & Library (39.4%), while the most female-oriented occupations are Arts, Media & Entertainment (100.0%), Health Diagnosing & Treating (100.0%), and Health Technologists (100.0%).
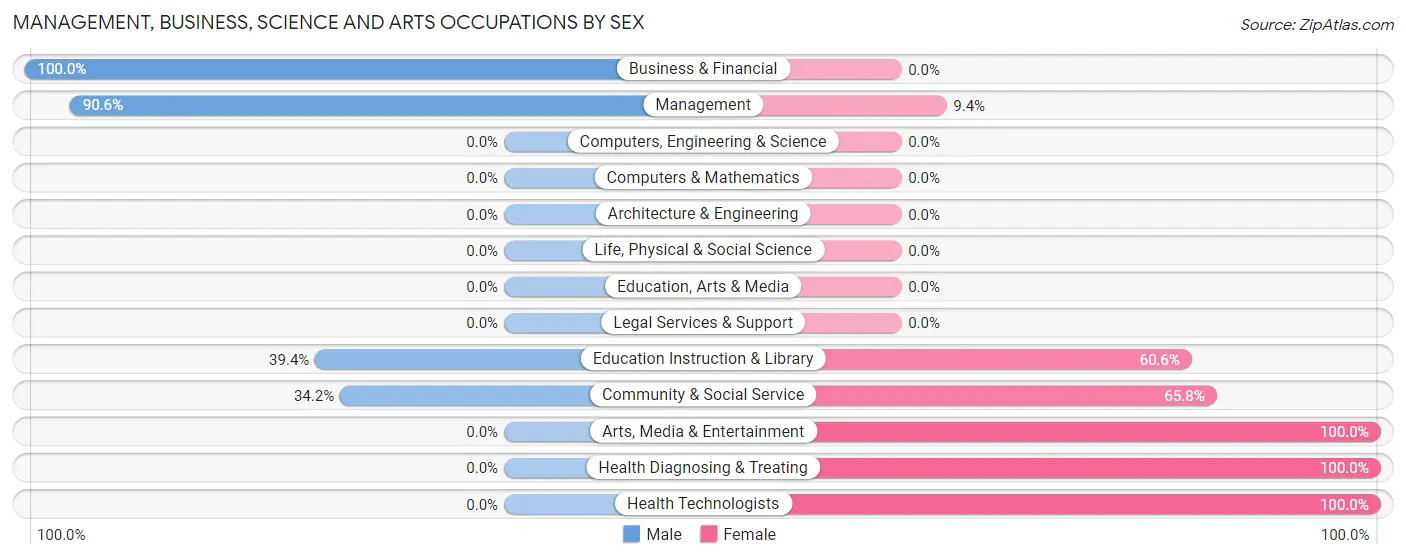
| Occupation | Male | Female |
| Management | 48 (90.6%) | 5 (9.4%) |
| Business & Financial | 5 (100.0%) | 0 (0.0%) |
| Computers, Engineering & Science | 0 (0.0%) | 0 (0.0%) |
| Computers & Mathematics | 0 (0.0%) | 0 (0.0%) |
| Architecture & Engineering | 0 (0.0%) | 0 (0.0%) |
| Life, Physical & Social Science | 0 (0.0%) | 0 (0.0%) |
| Community & Social Service | 13 (34.2%) | 25 (65.8%) |
| Education, Arts & Media | 0 (0.0%) | 0 (0.0%) |
| Legal Services & Support | 0 (0.0%) | 0 (0.0%) |
| Education Instruction & Library | 13 (39.4%) | 20 (60.6%) |
| Arts, Media & Entertainment | 0 (0.0%) | 5 (100.0%) |
| Health Diagnosing & Treating | 0 (0.0%) | 12 (100.0%) |
| Health Technologists | 0 (0.0%) | 6 (100.0%) |
| Total (Category) | 66 (61.1%) | 42 (38.9%) |
| Total (Overall) | 130 (55.3%) | 105 (44.7%) |
Services Occupations
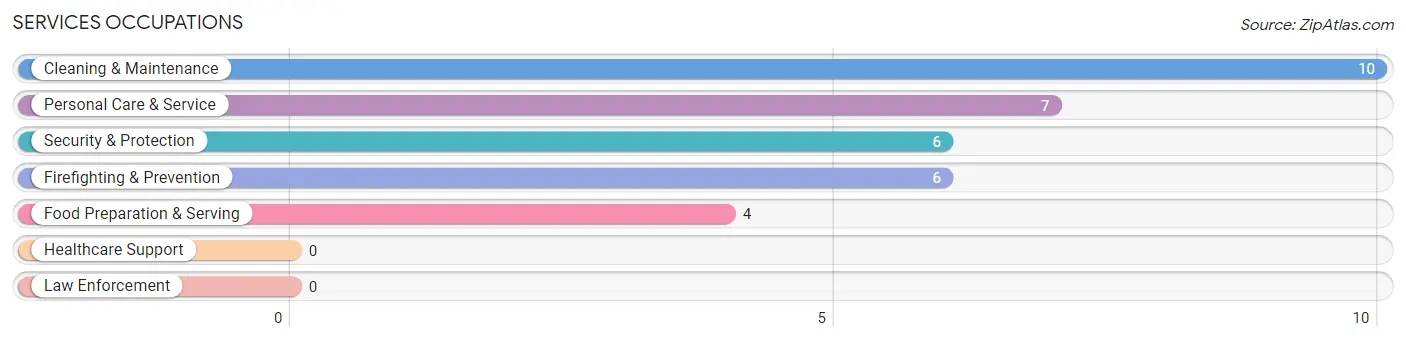
The most common Services occupations in Presho are Cleaning & Maintenance (10 | 4.3%), Personal Care & Service (7 | 3.0%), Security & Protection (6 | 2.5%), Firefighting & Prevention (6 | 2.5%), and Food Preparation & Serving (4 | 1.7%).
Services Occupations by Sex
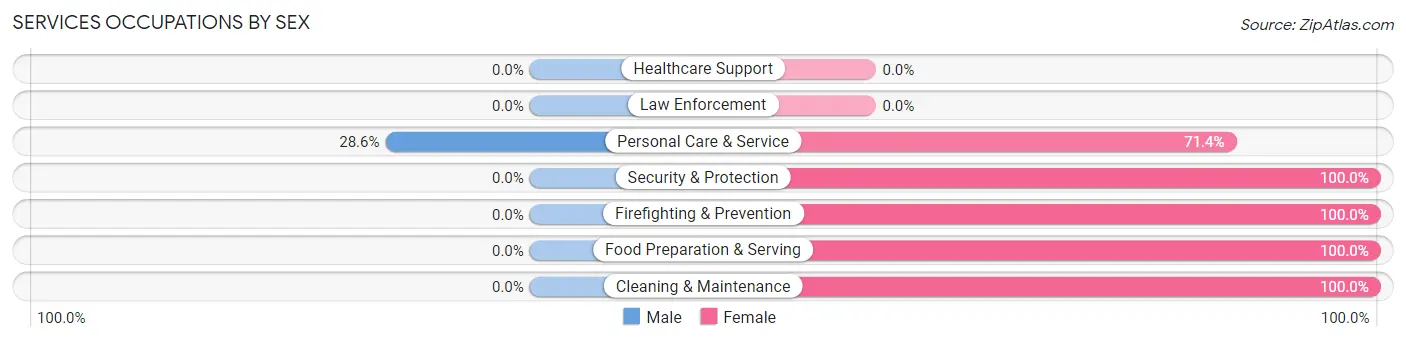
| Occupation | Male | Female |
| Healthcare Support | 0 (0.0%) | 0 (0.0%) |
| Security & Protection | 0 (0.0%) | 6 (100.0%) |
| Firefighting & Prevention | 0 (0.0%) | 6 (100.0%) |
| Law Enforcement | 0 (0.0%) | 0 (0.0%) |
| Food Preparation & Serving | 0 (0.0%) | 4 (100.0%) |
| Cleaning & Maintenance | 0 (0.0%) | 10 (100.0%) |
| Personal Care & Service | 2 (28.6%) | 5 (71.4%) |
| Total (Category) | 2 (7.4%) | 25 (92.6%) |
| Total (Overall) | 130 (55.3%) | 105 (44.7%) |
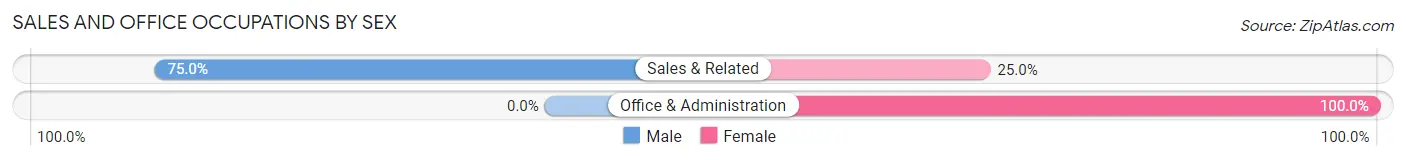
Sales and Office Occupations
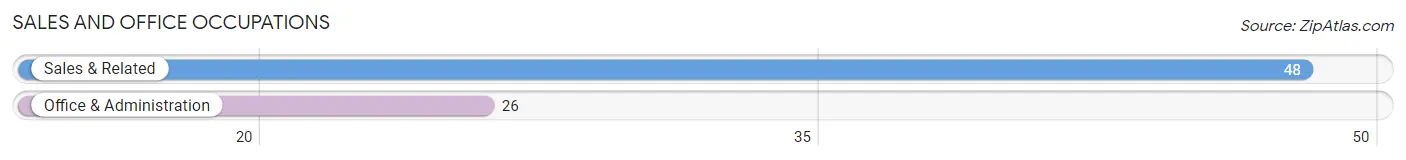
The most common Sales and Office occupations in Presho are Sales & Related (48 | 20.4%), and Office & Administration (26 | 11.1%).
Sales and Office Occupations by Sex
| Occupation | Male | Female |
| Sales & Related | 36 (75.0%) | 12 (25.0%) |
| Office & Administration | 0 (0.0%) | 26 (100.0%) |
| Total (Category) | 36 (48.6%) | 38 (51.3%) |
| Total (Overall) | 130 (55.3%) | 105 (44.7%) |
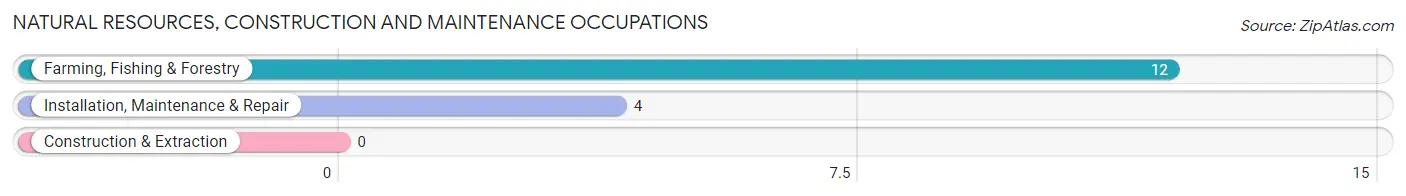
Natural Resources, Construction and Maintenance Occupations
The most common Natural Resources, Construction and Maintenance occupations in Presho are Farming, Fishing & Forestry (12 | 5.1%), and Installation, Maintenance & Repair (4 | 1.7%).
Natural Resources, Construction and Maintenance Occupations by Sex
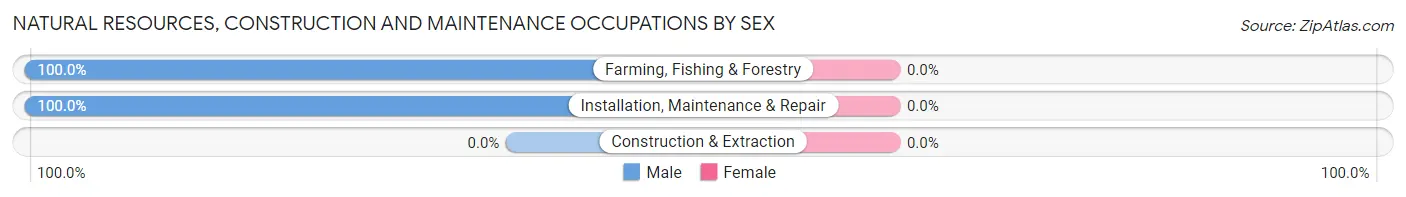
| Occupation | Male | Female |
| Farming, Fishing & Forestry | 12 (100.0%) | 0 (0.0%) |
| Construction & Extraction | 0 (0.0%) | 0 (0.0%) |
| Installation, Maintenance & Repair | 4 (100.0%) | 0 (0.0%) |
| Total (Category) | 16 (100.0%) | 0 (0.0%) |
| Total (Overall) | 130 (55.3%) | 105 (44.7%) |
Production, Transportation and Moving Occupations
The most common Production, Transportation and Moving occupations in Presho are , and Transportation (10 | 4.3%).
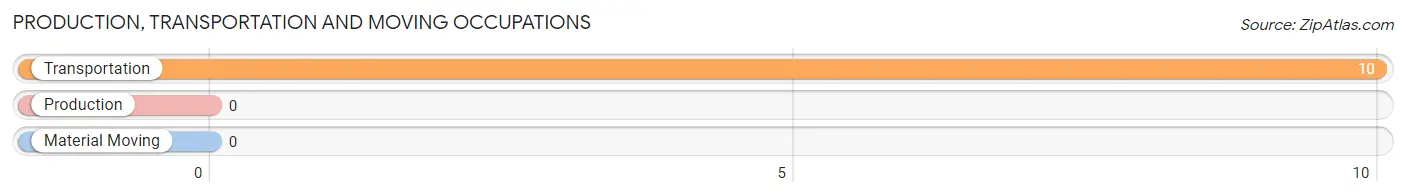
Production, Transportation and Moving Occupations by Sex
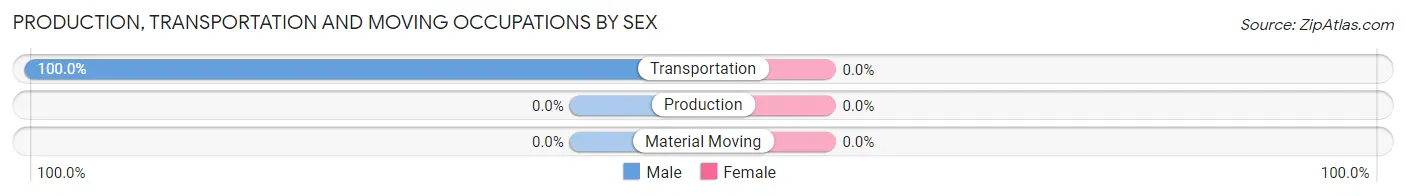
| Occupation | Male | Female |
| Production | 0 (0.0%) | 0 (0.0%) |
| Transportation | 10 (100.0%) | 0 (0.0%) |
| Material Moving | 0 (0.0%) | 0 (0.0%) |
| Total (Category) | 10 (100.0%) | 0 (0.0%) |
| Total (Overall) | 130 (55.3%) | 105 (44.7%) |
Employment Industries by Sex in Presho
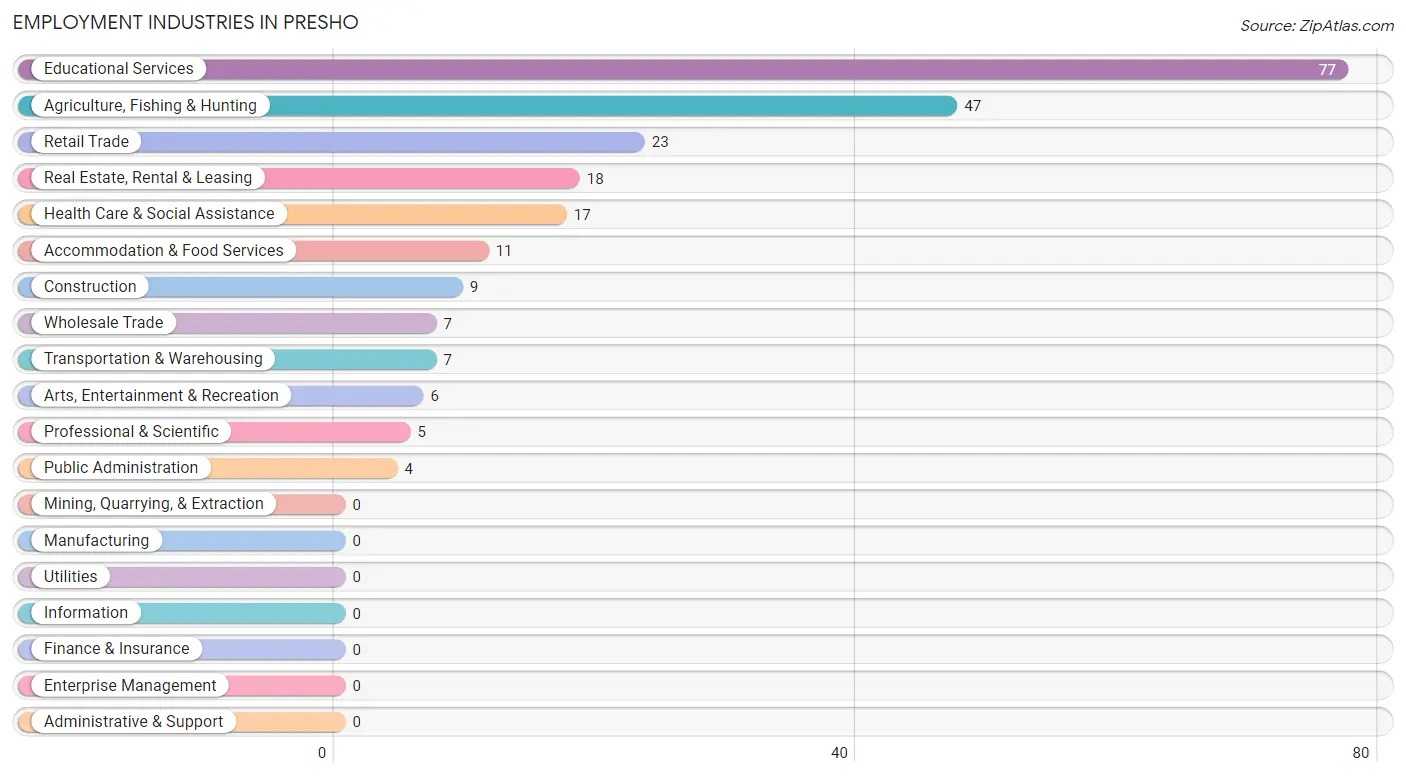
Employment Industries in Presho
The major employment industries in Presho include Educational Services (77 | 32.8%), Agriculture, Fishing & Hunting (47 | 20.0%), Retail Trade (23 | 9.8%), Real Estate, Rental & Leasing (18 | 7.7%), and Health Care & Social Assistance (17 | 7.2%).
Employment Industries by Sex in Presho
The Presho industries that see more men than women are Agriculture, Fishing & Hunting (100.0%), Wholesale Trade (100.0%), and Transportation & Warehousing (100.0%), whereas the industries that tend to have a higher number of women are Construction (100.0%), Health Care & Social Assistance (100.0%), and Arts, Entertainment & Recreation (100.0%).
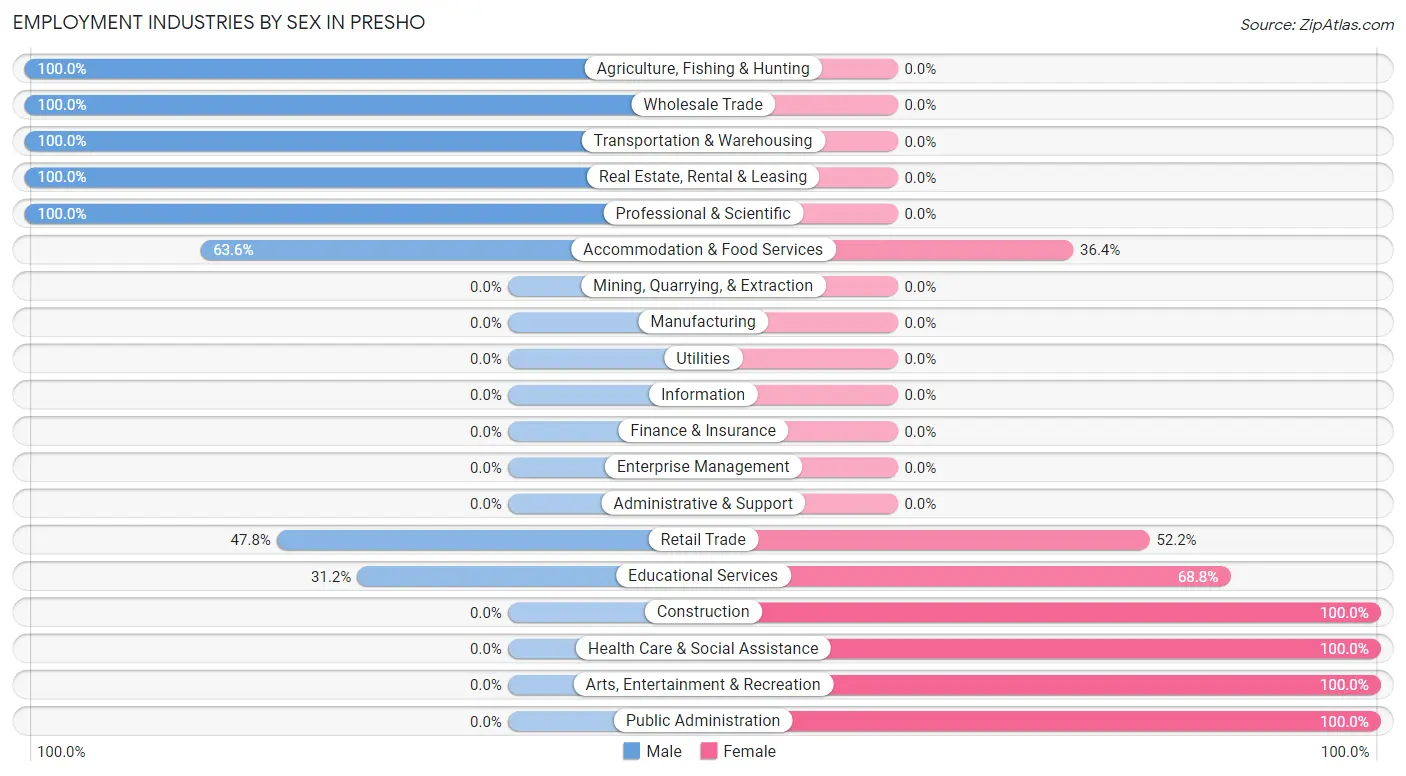
| Industry | Male | Female |
| Agriculture, Fishing & Hunting | 47 (100.0%) | 0 (0.0%) |
| Mining, Quarrying, & Extraction | 0 (0.0%) | 0 (0.0%) |
| Construction | 0 (0.0%) | 9 (100.0%) |
| Manufacturing | 0 (0.0%) | 0 (0.0%) |
| Wholesale Trade | 7 (100.0%) | 0 (0.0%) |
| Retail Trade | 11 (47.8%) | 12 (52.2%) |
| Transportation & Warehousing | 7 (100.0%) | 0 (0.0%) |
| Utilities | 0 (0.0%) | 0 (0.0%) |
| Information | 0 (0.0%) | 0 (0.0%) |
| Finance & Insurance | 0 (0.0%) | 0 (0.0%) |
| Real Estate, Rental & Leasing | 18 (100.0%) | 0 (0.0%) |
| Professional & Scientific | 5 (100.0%) | 0 (0.0%) |
| Enterprise Management | 0 (0.0%) | 0 (0.0%) |
| Administrative & Support | 0 (0.0%) | 0 (0.0%) |
| Educational Services | 24 (31.2%) | 53 (68.8%) |
| Health Care & Social Assistance | 0 (0.0%) | 17 (100.0%) |
| Arts, Entertainment & Recreation | 0 (0.0%) | 6 (100.0%) |
| Accommodation & Food Services | 7 (63.6%) | 4 (36.4%) |
| Public Administration | 0 (0.0%) | 4 (100.0%) |
| Total | 130 (55.3%) | 105 (44.7%) |
Education in Presho
School Enrollment in Presho
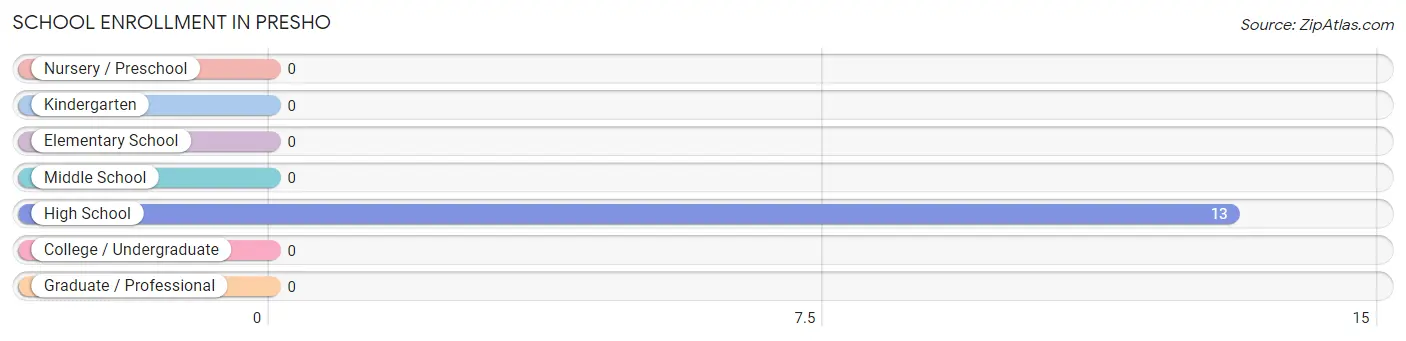
| School Level | # Students | % Students |
| Nursery / Preschool | 0 | 0.0% |
| Kindergarten | 0 | 0.0% |
| Elementary School | 0 | 0.0% |
| Middle School | 0 | 0.0% |
| High School | 13 | 100.0% |
| College / Undergraduate | 0 | 0.0% |
| Graduate / Professional | 0 | 0.0% |
| Total | 13 | 100.0% |
School Enrollment by Age by Funding Source in Presho
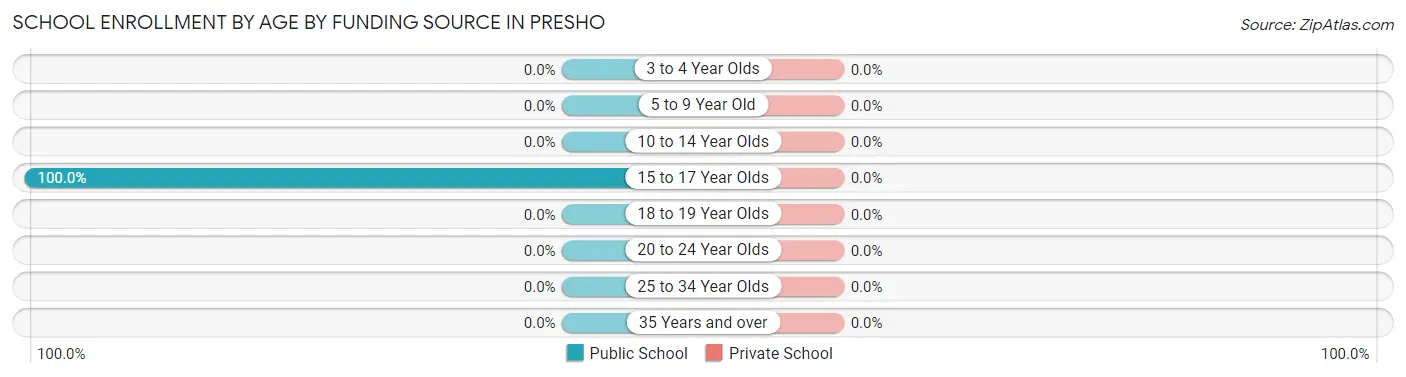
| Age Bracket | Public School | Private School |
| 3 to 4 Year Olds | 0 (0.0%) | 0 (0.0%) |
| 5 to 9 Year Old | 0 (0.0%) | 0 (0.0%) |
| 10 to 14 Year Olds | 0 (0.0%) | 0 (0.0%) |
| 15 to 17 Year Olds | 13 (100.0%) | 0 (0.0%) |
| 18 to 19 Year Olds | 0 (0.0%) | 0 (0.0%) |
| 20 to 24 Year Olds | 0 (0.0%) | 0 (0.0%) |
| 25 to 34 Year Olds | 0 (0.0%) | 0 (0.0%) |
| 35 Years and over | 0 (0.0%) | 0 (0.0%) |
| Total | 13 (100.0%) | 0 (0.0%) |
Educational Attainment by Field of Study in Presho
Education (37 | 56.1%), business (7 | 10.6%), social sciences (6 | 9.1%), science & technology (6 | 9.1%), and communications (5 | 7.6%) are the most common fields of study among 66 individuals in Presho who have obtained a bachelor's degree or higher.
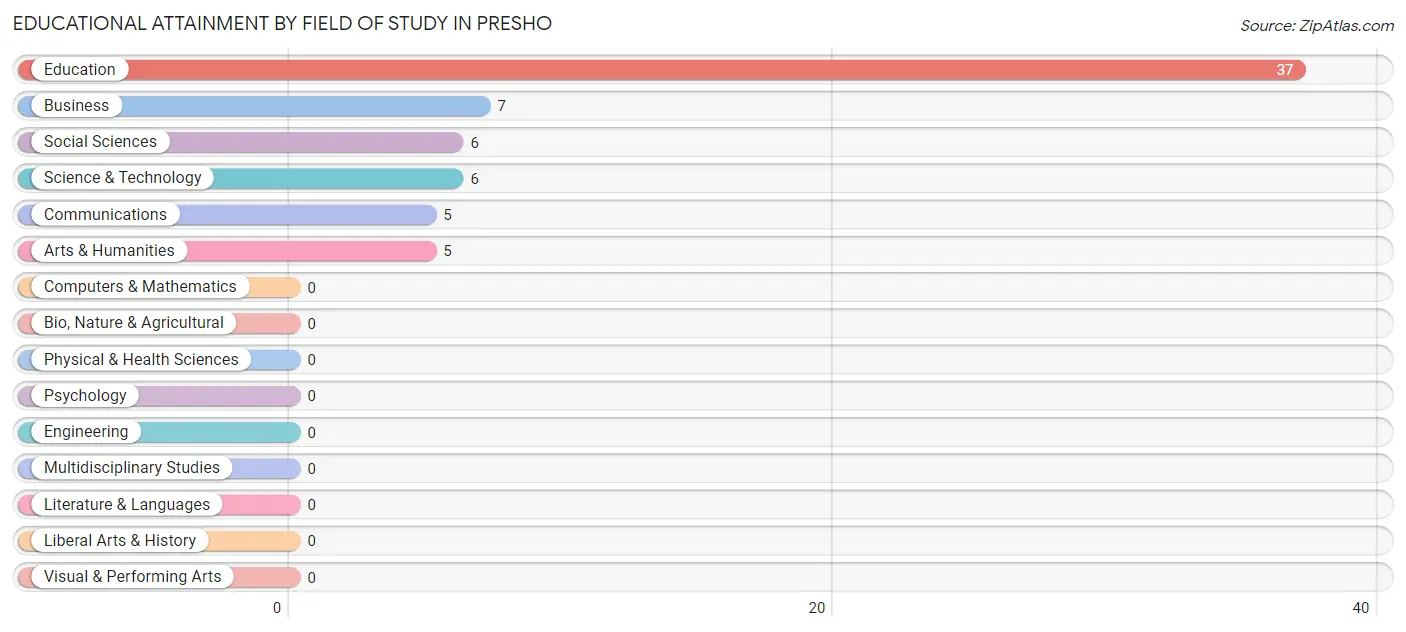
| Field of Study | # Graduates | % Graduates |
| Computers & Mathematics | 0 | 0.0% |
| Bio, Nature & Agricultural | 0 | 0.0% |
| Physical & Health Sciences | 0 | 0.0% |
| Psychology | 0 | 0.0% |
| Social Sciences | 6 | 9.1% |
| Engineering | 0 | 0.0% |
| Multidisciplinary Studies | 0 | 0.0% |
| Science & Technology | 6 | 9.1% |
| Business | 7 | 10.6% |
| Education | 37 | 56.1% |
| Literature & Languages | 0 | 0.0% |
| Liberal Arts & History | 0 | 0.0% |
| Visual & Performing Arts | 0 | 0.0% |
| Communications | 5 | 7.6% |
| Arts & Humanities | 5 | 7.6% |
| Total | 66 | 100.0% |
Transportation & Commute in Presho
Vehicle Availability by Sex in Presho
The most prevalent vehicle ownership categories in Presho are males with 2 vehicles (73, accounting for 57.9%) and females with 2 vehicles (84, making up 69.5%).
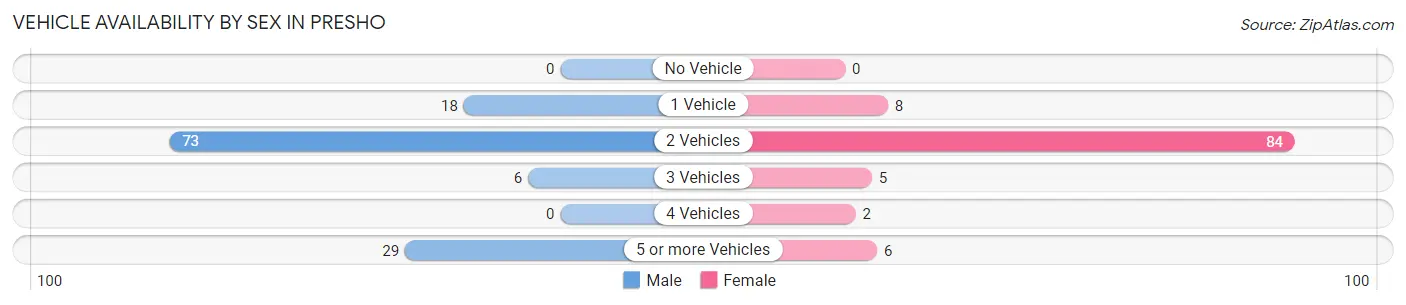
| Vehicles Available | Male | Female |
| No Vehicle | 0 (0.0%) | 0 (0.0%) |
| 1 Vehicle | 18 (14.3%) | 8 (7.6%) |
| 2 Vehicles | 73 (57.9%) | 84 (80.0%) |
| 3 Vehicles | 6 (4.8%) | 5 (4.8%) |
| 4 Vehicles | 0 (0.0%) | 2 (1.9%) |
| 5 or more Vehicles | 29 (23.0%) | 6 (5.7%) |
| Total | 126 (100.0%) | 105 (100.0%) |
Commute Time in Presho
The most frequently occuring commute durations in Presho are 5 to 9 minutes (91 commuters, 44.4%), 15 to 19 minutes (42 commuters, 20.5%), and 10 to 14 minutes (29 commuters, 14.1%).
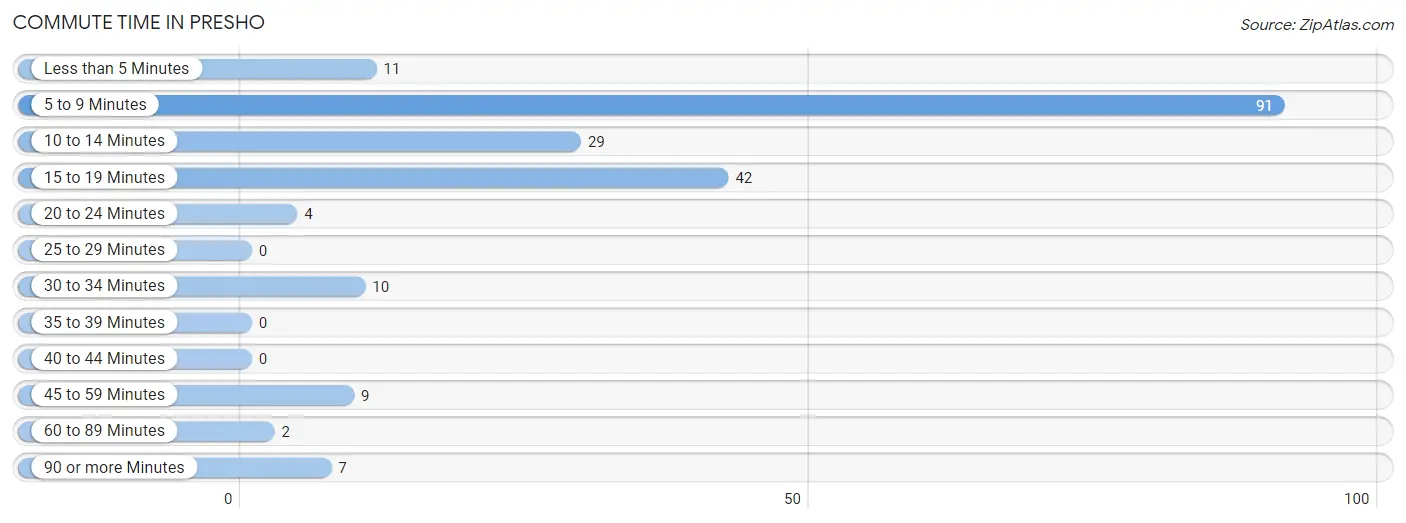
| Commute Time | # Commuters | % Commuters |
| Less than 5 Minutes | 11 | 5.4% |
| 5 to 9 Minutes | 91 | 44.4% |
| 10 to 14 Minutes | 29 | 14.1% |
| 15 to 19 Minutes | 42 | 20.5% |
| 20 to 24 Minutes | 4 | 1.9% |
| 25 to 29 Minutes | 0 | 0.0% |
| 30 to 34 Minutes | 10 | 4.9% |
| 35 to 39 Minutes | 0 | 0.0% |
| 40 to 44 Minutes | 0 | 0.0% |
| 45 to 59 Minutes | 9 | 4.4% |
| 60 to 89 Minutes | 2 | 1.0% |
| 90 or more Minutes | 7 | 3.4% |
Commute Time by Sex in Presho
The most common commute times in Presho are 5 to 9 minutes (61 commuters, 53.0%) for males and 5 to 9 minutes (30 commuters, 33.3%) for females.
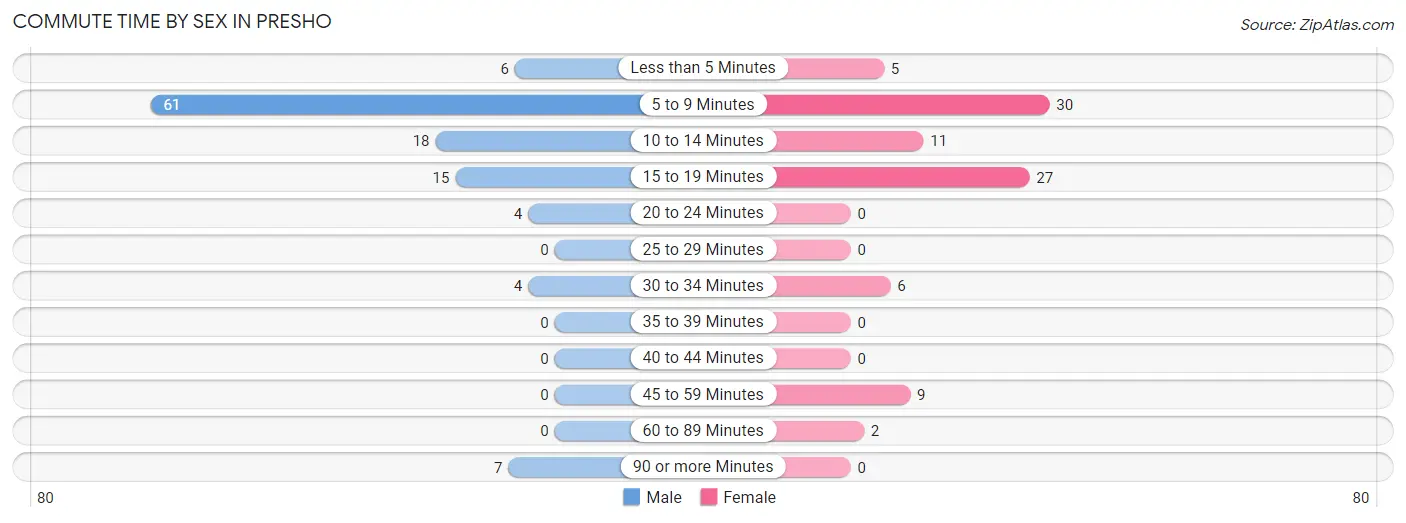
| Commute Time | Male | Female |
| Less than 5 Minutes | 6 (5.2%) | 5 (5.6%) |
| 5 to 9 Minutes | 61 (53.0%) | 30 (33.3%) |
| 10 to 14 Minutes | 18 (15.7%) | 11 (12.2%) |
| 15 to 19 Minutes | 15 (13.0%) | 27 (30.0%) |
| 20 to 24 Minutes | 4 (3.5%) | 0 (0.0%) |
| 25 to 29 Minutes | 0 (0.0%) | 0 (0.0%) |
| 30 to 34 Minutes | 4 (3.5%) | 6 (6.7%) |
| 35 to 39 Minutes | 0 (0.0%) | 0 (0.0%) |
| 40 to 44 Minutes | 0 (0.0%) | 0 (0.0%) |
| 45 to 59 Minutes | 0 (0.0%) | 9 (10.0%) |
| 60 to 89 Minutes | 0 (0.0%) | 2 (2.2%) |
| 90 or more Minutes | 7 (6.1%) | 0 (0.0%) |
Time of Departure to Work by Sex in Presho
The most frequent times of departure to work in Presho are 8:00 AM to 8:29 AM (31, 27.0%) for males and 7:30 AM to 7:59 AM (34, 37.8%) for females.
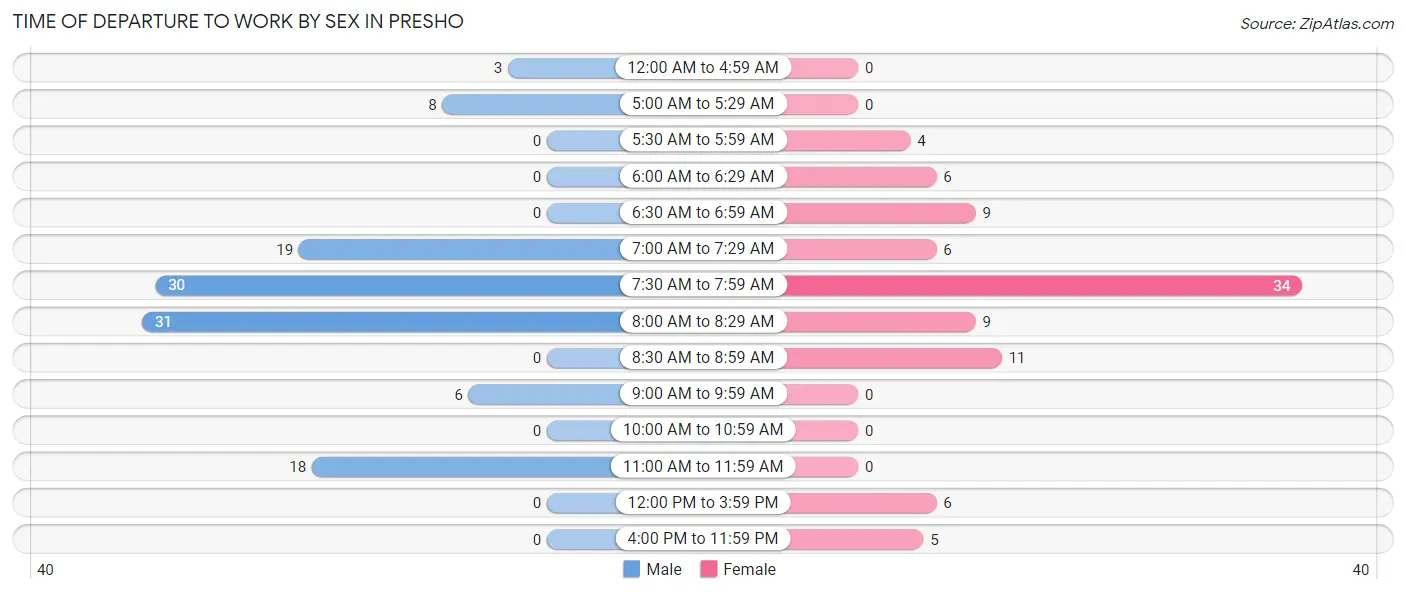
| Time of Departure | Male | Female |
| 12:00 AM to 4:59 AM | 3 (2.6%) | 0 (0.0%) |
| 5:00 AM to 5:29 AM | 8 (7.0%) | 0 (0.0%) |
| 5:30 AM to 5:59 AM | 0 (0.0%) | 4 (4.4%) |
| 6:00 AM to 6:29 AM | 0 (0.0%) | 6 (6.7%) |
| 6:30 AM to 6:59 AM | 0 (0.0%) | 9 (10.0%) |
| 7:00 AM to 7:29 AM | 19 (16.5%) | 6 (6.7%) |
| 7:30 AM to 7:59 AM | 30 (26.1%) | 34 (37.8%) |
| 8:00 AM to 8:29 AM | 31 (27.0%) | 9 (10.0%) |
| 8:30 AM to 8:59 AM | 0 (0.0%) | 11 (12.2%) |
| 9:00 AM to 9:59 AM | 6 (5.2%) | 0 (0.0%) |
| 10:00 AM to 10:59 AM | 0 (0.0%) | 0 (0.0%) |
| 11:00 AM to 11:59 AM | 18 (15.7%) | 0 (0.0%) |
| 12:00 PM to 3:59 PM | 0 (0.0%) | 6 (6.7%) |
| 4:00 PM to 11:59 PM | 0 (0.0%) | 5 (5.6%) |
| Total | 115 (100.0%) | 90 (100.0%) |
Housing Occupancy in Presho
Occupancy by Ownership in Presho
Of the total 164 dwellings in Presho, owner-occupied units account for 124 (75.6%), while renter-occupied units make up 40 (24.4%).
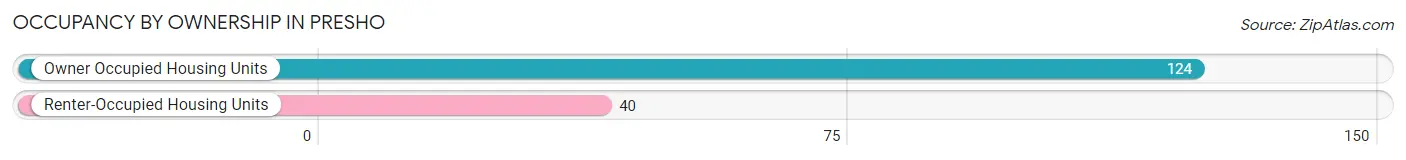
| Occupancy | # Housing Units | % Housing Units |
| Owner Occupied Housing Units | 124 | 75.6% |
| Renter-Occupied Housing Units | 40 | 24.4% |
| Total Occupied Housing Units | 164 | 100.0% |
Occupancy by Household Size in Presho
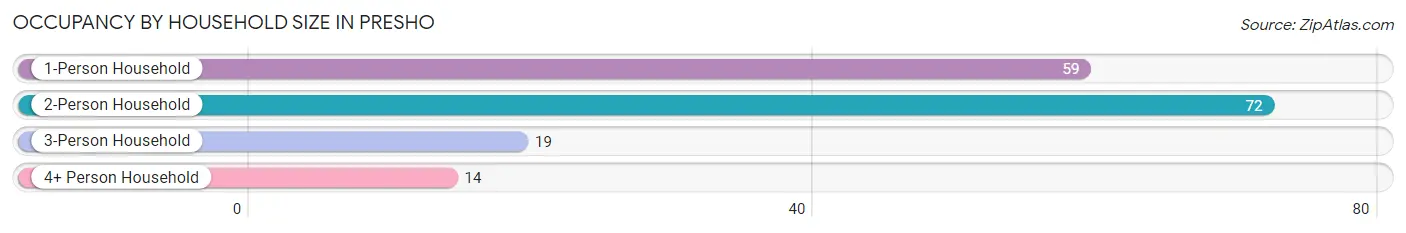
| Household Size | # Housing Units | % Housing Units |
| 1-Person Household | 59 | 36.0% |
| 2-Person Household | 72 | 43.9% |
| 3-Person Household | 19 | 11.6% |
| 4+ Person Household | 14 | 8.5% |
| Total Housing Units | 164 | 100.0% |
Occupancy by Ownership by Household Size in Presho
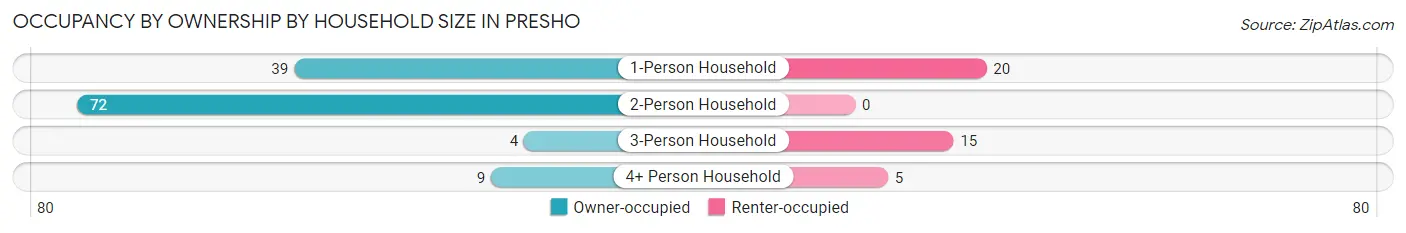
| Household Size | Owner-occupied | Renter-occupied |
| 1-Person Household | 39 (66.1%) | 20 (33.9%) |
| 2-Person Household | 72 (100.0%) | 0 (0.0%) |
| 3-Person Household | 4 (21.0%) | 15 (78.9%) |
| 4+ Person Household | 9 (64.3%) | 5 (35.7%) |
| Total Housing Units | 124 (75.6%) | 40 (24.4%) |
Occupancy by Educational Attainment in Presho
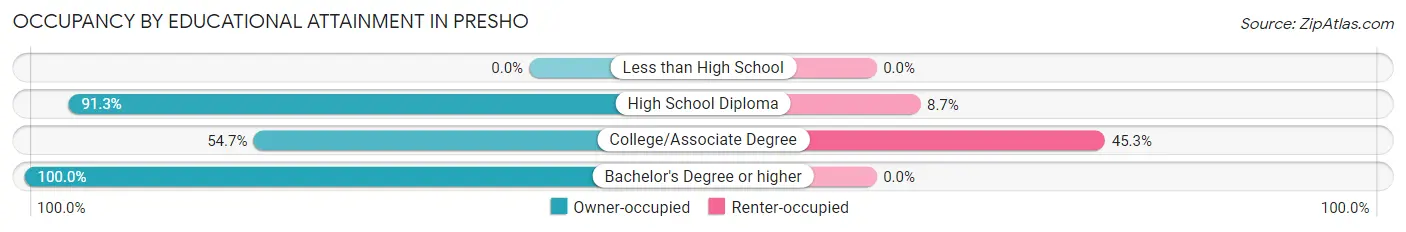
| Household Size | Owner-occupied | Renter-occupied |
| Less than High School | 0 (0.0%) | 0 (0.0%) |
| High School Diploma | 63 (91.3%) | 6 (8.7%) |
| College/Associate Degree | 41 (54.7%) | 34 (45.3%) |
| Bachelor's Degree or higher | 20 (100.0%) | 0 (0.0%) |
Occupancy by Age of Householder in Presho
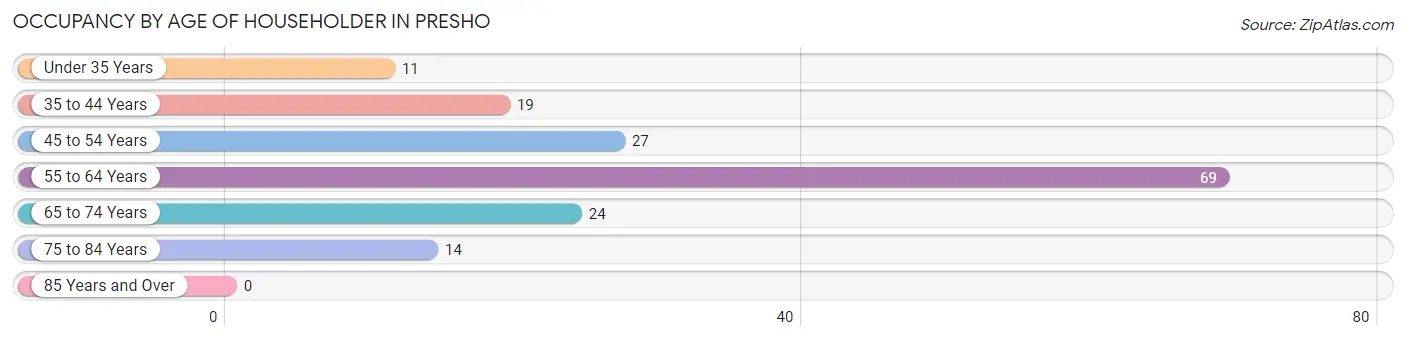
| Age Bracket | # Households | % Households |
| Under 35 Years | 11 | 6.7% |
| 35 to 44 Years | 19 | 11.6% |
| 45 to 54 Years | 27 | 16.5% |
| 55 to 64 Years | 69 | 42.1% |
| 65 to 74 Years | 24 | 14.6% |
| 75 to 84 Years | 14 | 8.5% |
| 85 Years and Over | 0 | 0.0% |
| Total | 164 | 100.0% |
Housing Finances in Presho
Median Income by Occupancy in Presho
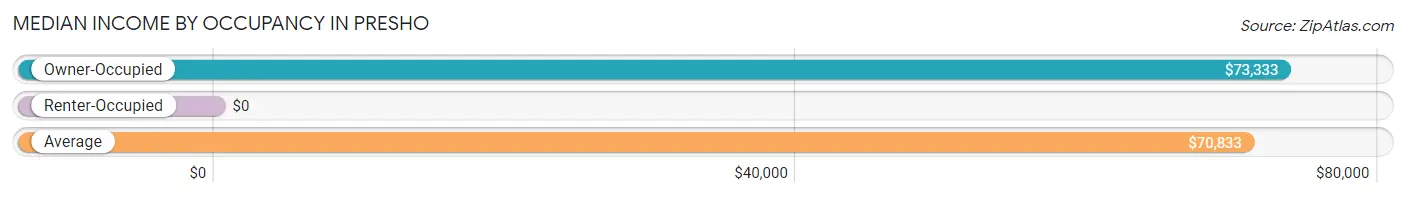
| Occupancy Type | # Households | Median Income |
| Owner-Occupied | 124 (75.6%) | $73,333 |
| Renter-Occupied | 40 (24.4%) | $0 |
| Average | 164 (100.0%) | $70,833 |
Occupancy by Householder Income Bracket in Presho
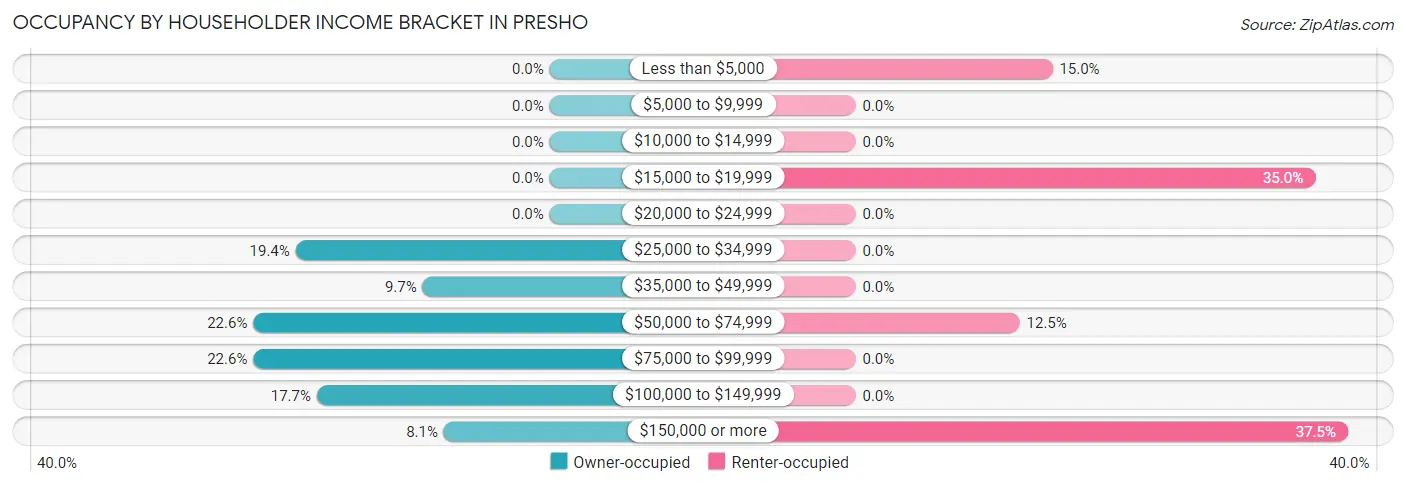
| Income Bracket | Owner-occupied | Renter-occupied |
| Less than $5,000 | 0 (0.0%) | 6 (15.0%) |
| $5,000 to $9,999 | 0 (0.0%) | 0 (0.0%) |
| $10,000 to $14,999 | 0 (0.0%) | 0 (0.0%) |
| $15,000 to $19,999 | 0 (0.0%) | 14 (35.0%) |
| $20,000 to $24,999 | 0 (0.0%) | 0 (0.0%) |
| $25,000 to $34,999 | 24 (19.4%) | 0 (0.0%) |
| $35,000 to $49,999 | 12 (9.7%) | 0 (0.0%) |
| $50,000 to $74,999 | 28 (22.6%) | 5 (12.5%) |
| $75,000 to $99,999 | 28 (22.6%) | 0 (0.0%) |
| $100,000 to $149,999 | 22 (17.7%) | 0 (0.0%) |
| $150,000 or more | 10 (8.1%) | 15 (37.5%) |
| Total | 124 (100.0%) | 40 (100.0%) |
Monthly Housing Cost Tiers in Presho
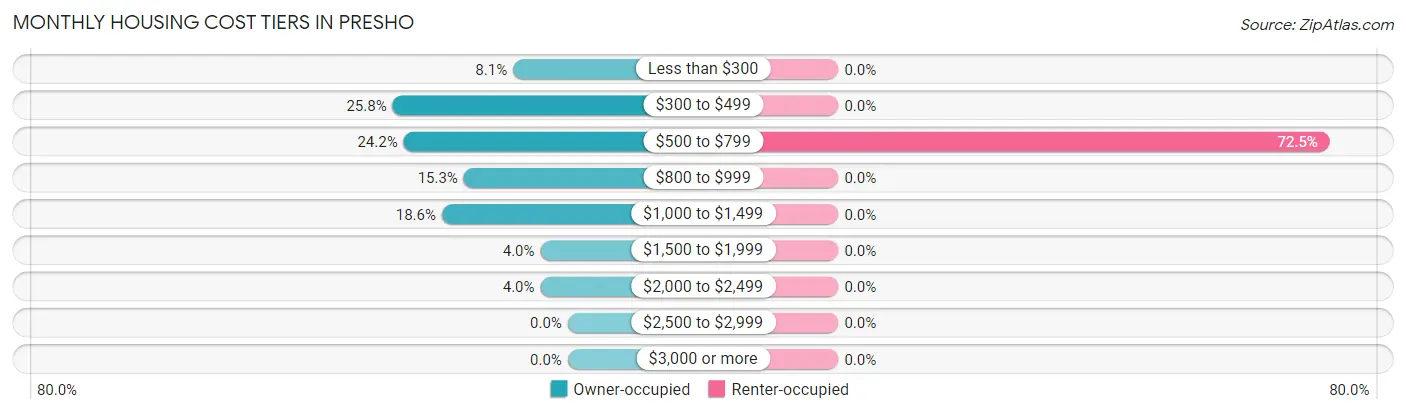
| Monthly Cost | Owner-occupied | Renter-occupied |
| Less than $300 | 10 (8.1%) | 0 (0.0%) |
| $300 to $499 | 32 (25.8%) | 0 (0.0%) |
| $500 to $799 | 30 (24.2%) | 29 (72.5%) |
| $800 to $999 | 19 (15.3%) | 0 (0.0%) |
| $1,000 to $1,499 | 23 (18.5%) | 0 (0.0%) |
| $1,500 to $1,999 | 5 (4.0%) | 0 (0.0%) |
| $2,000 to $2,499 | 5 (4.0%) | 0 (0.0%) |
| $2,500 to $2,999 | 0 (0.0%) | 0 (0.0%) |
| $3,000 or more | 0 (0.0%) | 0 (0.0%) |
| Total | 124 (100.0%) | 40 (100.0%) |
Physical Housing Characteristics in Presho
Housing Structures in Presho
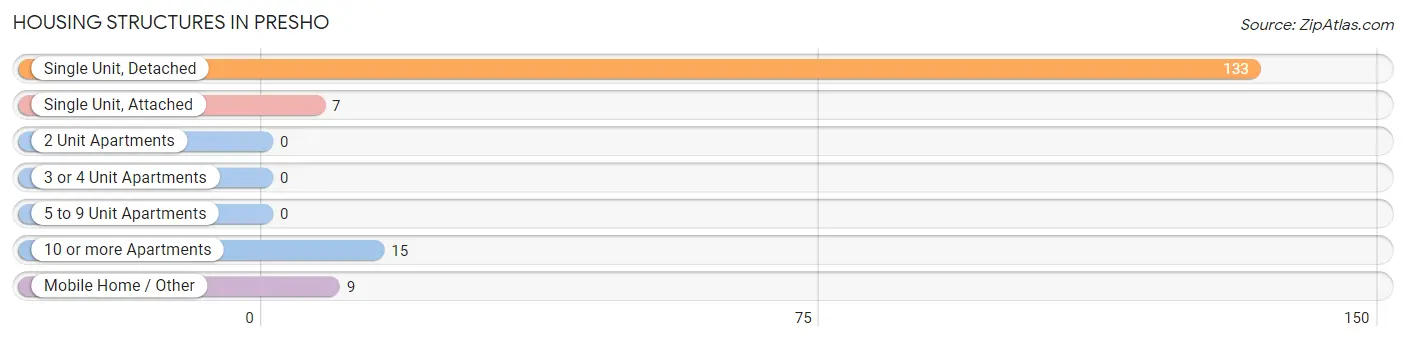
| Structure Type | # Housing Units | % Housing Units |
| Single Unit, Detached | 133 | 81.1% |
| Single Unit, Attached | 7 | 4.3% |
| 2 Unit Apartments | 0 | 0.0% |
| 3 or 4 Unit Apartments | 0 | 0.0% |
| 5 to 9 Unit Apartments | 0 | 0.0% |
| 10 or more Apartments | 15 | 9.1% |
| Mobile Home / Other | 9 | 5.5% |
| Total | 164 | 100.0% |
Housing Structures by Occupancy in Presho
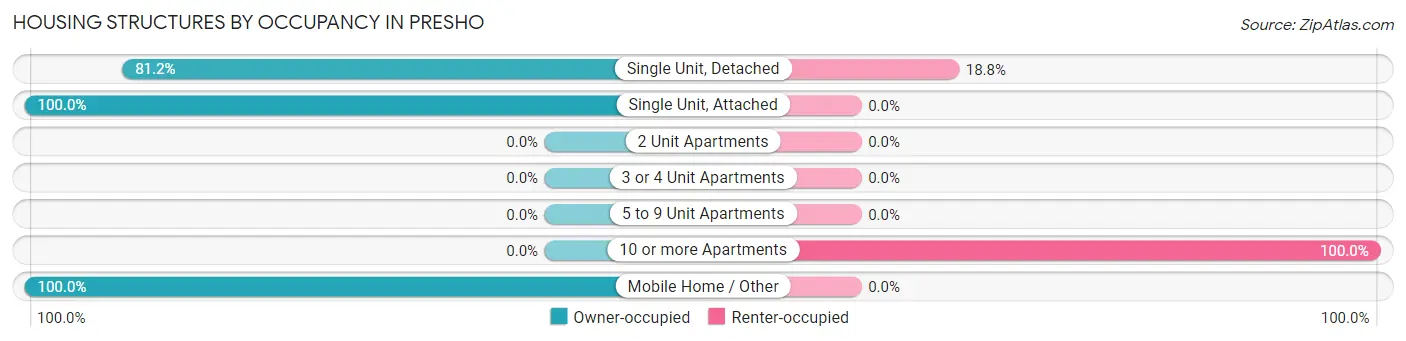
| Structure Type | Owner-occupied | Renter-occupied |
| Single Unit, Detached | 108 (81.2%) | 25 (18.8%) |
| Single Unit, Attached | 7 (100.0%) | 0 (0.0%) |
| 2 Unit Apartments | 0 (0.0%) | 0 (0.0%) |
| 3 or 4 Unit Apartments | 0 (0.0%) | 0 (0.0%) |
| 5 to 9 Unit Apartments | 0 (0.0%) | 0 (0.0%) |
| 10 or more Apartments | 0 (0.0%) | 15 (100.0%) |
| Mobile Home / Other | 9 (100.0%) | 0 (0.0%) |
| Total | 124 (75.6%) | 40 (24.4%) |
Housing Structures by Number of Rooms in Presho
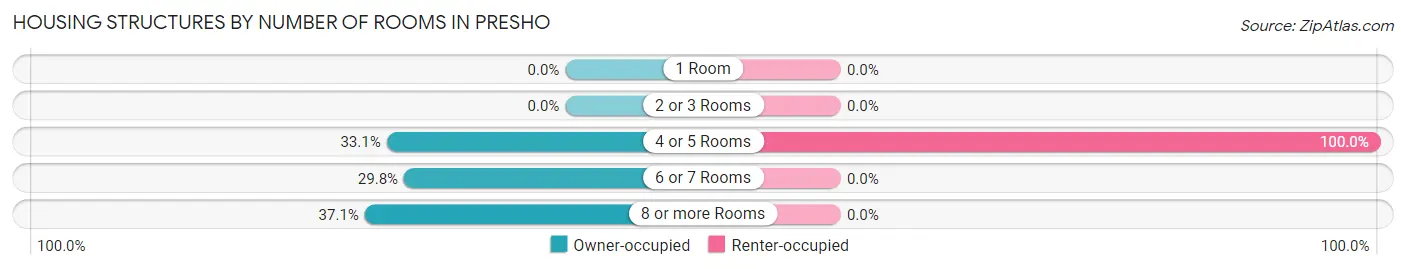
| Number of Rooms | Owner-occupied | Renter-occupied |
| 1 Room | 0 (0.0%) | 0 (0.0%) |
| 2 or 3 Rooms | 0 (0.0%) | 0 (0.0%) |
| 4 or 5 Rooms | 41 (33.1%) | 40 (100.0%) |
| 6 or 7 Rooms | 37 (29.8%) | 0 (0.0%) |
| 8 or more Rooms | 46 (37.1%) | 0 (0.0%) |
| Total | 124 (100.0%) | 40 (100.0%) |
Housing Structure by Heating Type in Presho
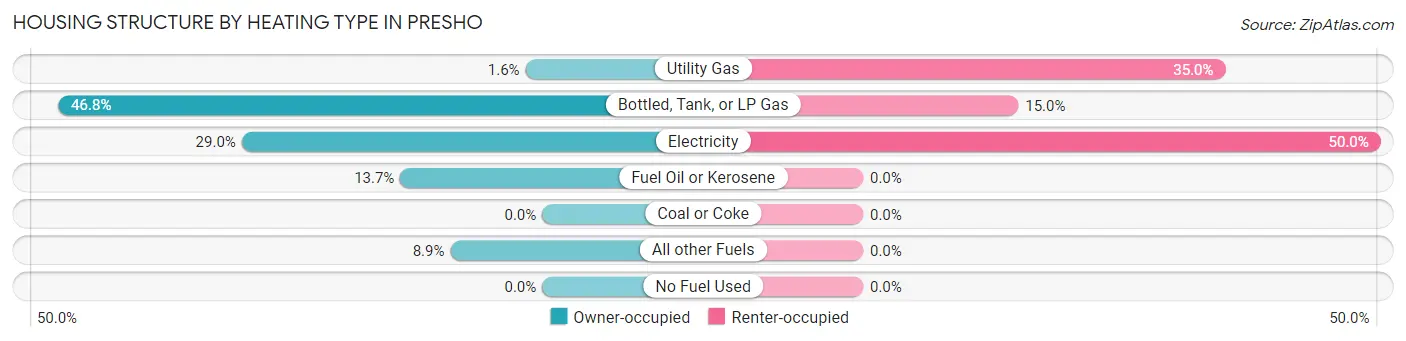
| Heating Type | Owner-occupied | Renter-occupied |
| Utility Gas | 2 (1.6%) | 14 (35.0%) |
| Bottled, Tank, or LP Gas | 58 (46.8%) | 6 (15.0%) |
| Electricity | 36 (29.0%) | 20 (50.0%) |
| Fuel Oil or Kerosene | 17 (13.7%) | 0 (0.0%) |
| Coal or Coke | 0 (0.0%) | 0 (0.0%) |
| All other Fuels | 11 (8.9%) | 0 (0.0%) |
| No Fuel Used | 0 (0.0%) | 0 (0.0%) |
| Total | 124 (100.0%) | 40 (100.0%) |
Household Vehicle Usage in Presho
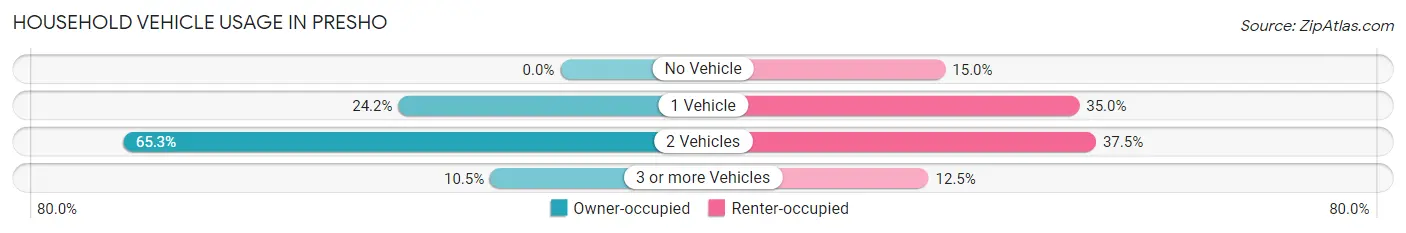
| Vehicles per Household | Owner-occupied | Renter-occupied |
| No Vehicle | 0 (0.0%) | 6 (15.0%) |
| 1 Vehicle | 30 (24.2%) | 14 (35.0%) |
| 2 Vehicles | 81 (65.3%) | 15 (37.5%) |
| 3 or more Vehicles | 13 (10.5%) | 5 (12.5%) |
| Total | 124 (100.0%) | 40 (100.0%) |
Real Estate & Mortgages in Presho
Real Estate and Mortgage Overview in Presho
| Characteristic | Without Mortgage | With Mortgage |
| Housing Units | 94 | 30 |
| Median Property Value | - | - |
| Median Household Income | $69,583 | $5 |
| Monthly Housing Costs | $533 | $0 |
| Real Estate Taxes | $855 | $0 |
Property Value by Mortgage Status in Presho
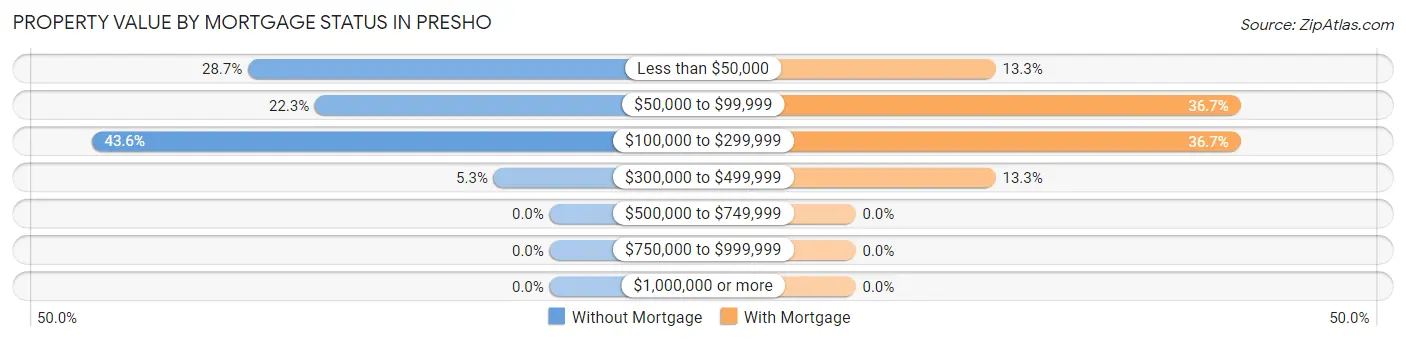
| Property Value | Without Mortgage | With Mortgage |
| Less than $50,000 | 27 (28.7%) | 4 (13.3%) |
| $50,000 to $99,999 | 21 (22.3%) | 11 (36.7%) |
| $100,000 to $299,999 | 41 (43.6%) | 11 (36.7%) |
| $300,000 to $499,999 | 5 (5.3%) | 4 (13.3%) |
| $500,000 to $749,999 | 0 (0.0%) | 0 (0.0%) |
| $750,000 to $999,999 | 0 (0.0%) | 0 (0.0%) |
| $1,000,000 or more | 0 (0.0%) | 0 (0.0%) |
| Total | 94 (100.0%) | 30 (100.0%) |
Household Income by Mortgage Status in Presho
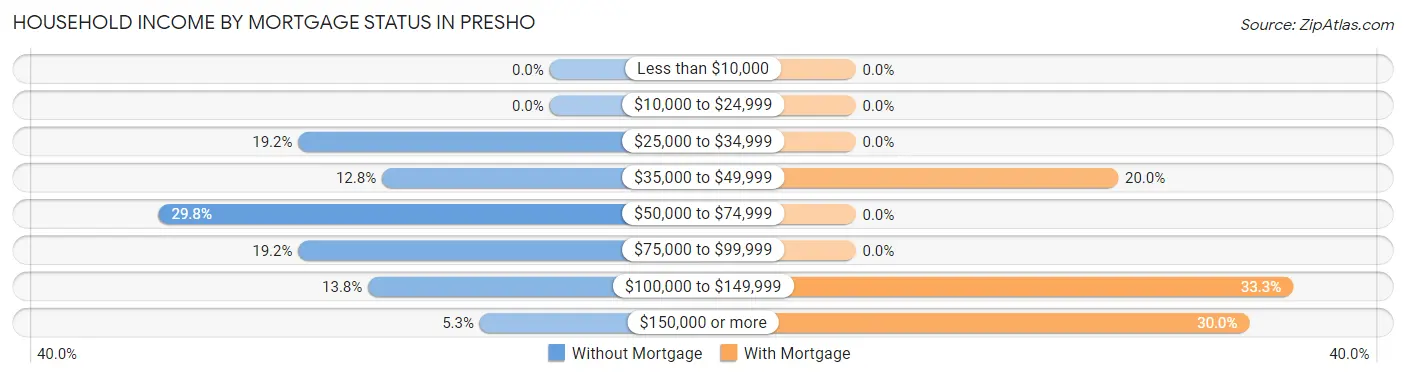
| Household Income | Without Mortgage | With Mortgage |
| Less than $10,000 | 0 (0.0%) | 0 (0.0%) |
| $10,000 to $24,999 | 0 (0.0%) | 0 (0.0%) |
| $25,000 to $34,999 | 18 (19.2%) | 0 (0.0%) |
| $35,000 to $49,999 | 12 (12.8%) | 6 (20.0%) |
| $50,000 to $74,999 | 28 (29.8%) | 0 (0.0%) |
| $75,000 to $99,999 | 18 (19.2%) | 0 (0.0%) |
| $100,000 to $149,999 | 13 (13.8%) | 10 (33.3%) |
| $150,000 or more | 5 (5.3%) | 9 (30.0%) |
| Total | 94 (100.0%) | 30 (100.0%) |
Property Value to Household Income Ratio in Presho
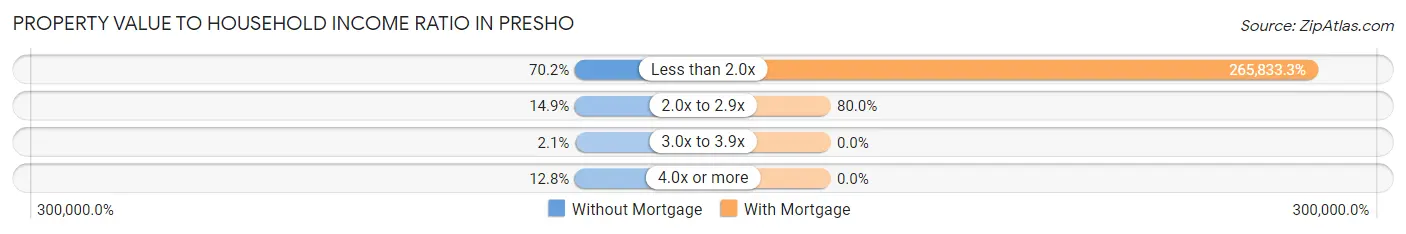
| Value-to-Income Ratio | Without Mortgage | With Mortgage |
| Less than 2.0x | 66 (70.2%) | 79,750 (265,833.3%) |
| 2.0x to 2.9x | 14 (14.9%) | 24 (80.0%) |
| 3.0x to 3.9x | 2 (2.1%) | 0 (0.0%) |
| 4.0x or more | 12 (12.8%) | 0 (0.0%) |
| Total | 94 (100.0%) | 30 (100.0%) |
Real Estate Taxes by Mortgage Status in Presho
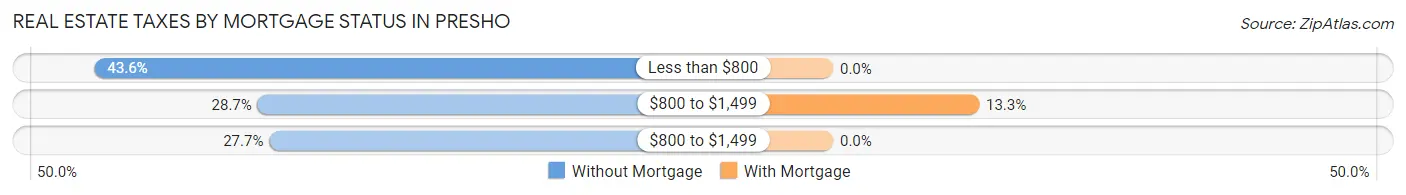
| Property Taxes | Without Mortgage | With Mortgage |
| Less than $800 | 41 (43.6%) | 0 (0.0%) |
| $800 to $1,499 | 27 (28.7%) | 4 (13.3%) |
| $800 to $1,499 | 26 (27.7%) | 0 (0.0%) |
| Total | 94 (100.0%) | 30 (100.0%) |
Health & Disability in Presho
Health Insurance Coverage by Age in Presho
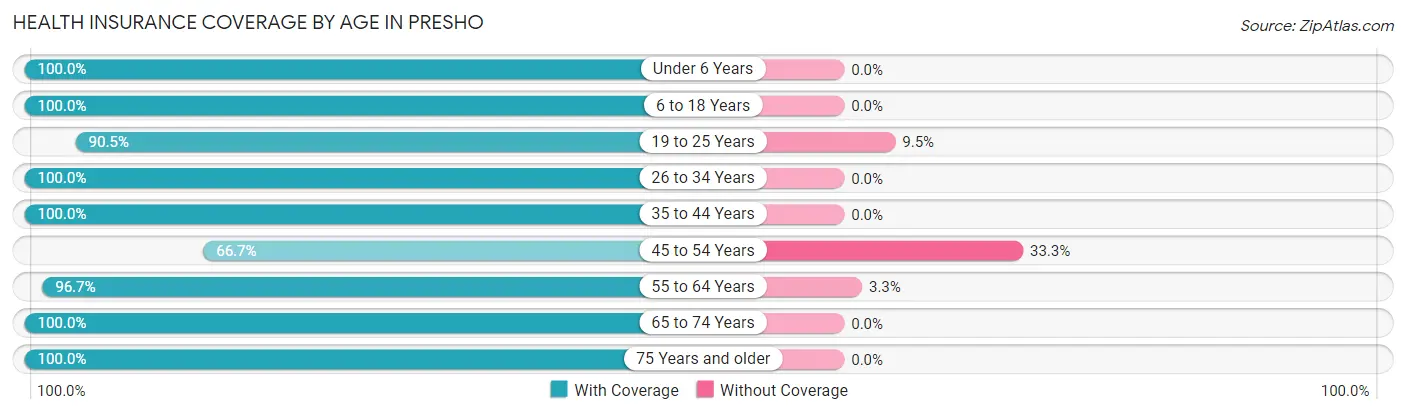
| Age Bracket | With Coverage | Without Coverage |
| Under 6 Years | 22 (100.0%) | 0 (0.0%) |
| 6 to 18 Years | 13 (100.0%) | 0 (0.0%) |
| 19 to 25 Years | 19 (90.5%) | 2 (9.5%) |
| 26 to 34 Years | 21 (100.0%) | 0 (0.0%) |
| 35 to 44 Years | 24 (100.0%) | 0 (0.0%) |
| 45 to 54 Years | 48 (66.7%) | 24 (33.3%) |
| 55 to 64 Years | 117 (96.7%) | 4 (3.3%) |
| 65 to 74 Years | 24 (100.0%) | 0 (0.0%) |
| 75 Years and older | 18 (100.0%) | 0 (0.0%) |
| Total | 306 (91.1%) | 30 (8.9%) |
Health Insurance Coverage by Citizenship Status in Presho
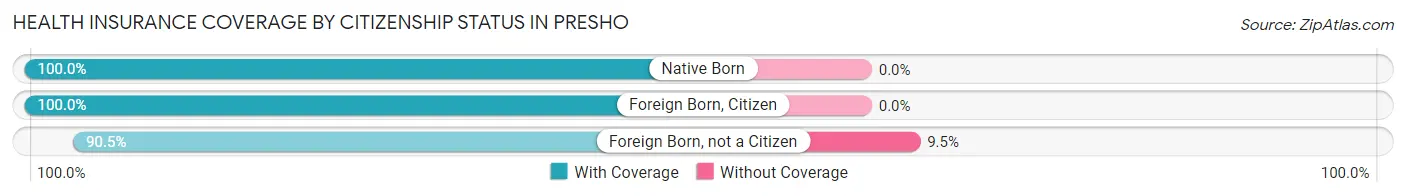
| Citizenship Status | With Coverage | Without Coverage |
| Native Born | 22 (100.0%) | 0 (0.0%) |
| Foreign Born, Citizen | 13 (100.0%) | 0 (0.0%) |
| Foreign Born, not a Citizen | 19 (90.5%) | 2 (9.5%) |
Health Insurance Coverage by Household Income in Presho
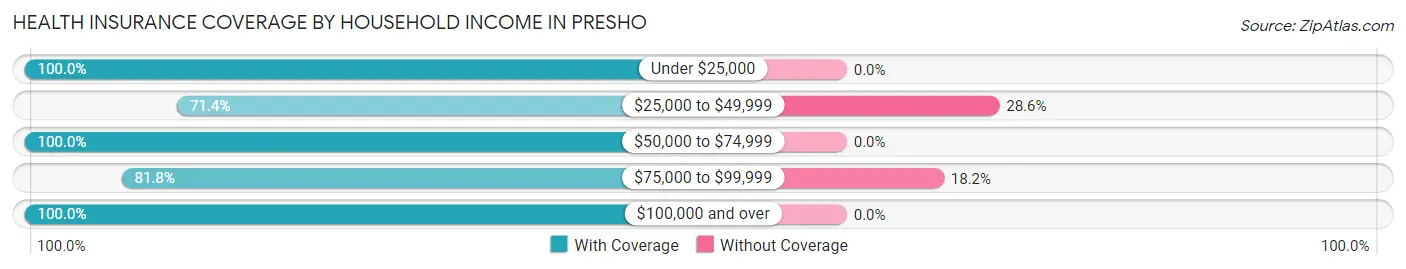
| Household Income | With Coverage | Without Coverage |
| Under $25,000 | 20 (100.0%) | 0 (0.0%) |
| $25,000 to $49,999 | 50 (71.4%) | 20 (28.6%) |
| $50,000 to $74,999 | 75 (100.0%) | 0 (0.0%) |
| $75,000 to $99,999 | 45 (81.8%) | 10 (18.2%) |
| $100,000 and over | 116 (100.0%) | 0 (0.0%) |
Public vs Private Health Insurance Coverage by Age in Presho
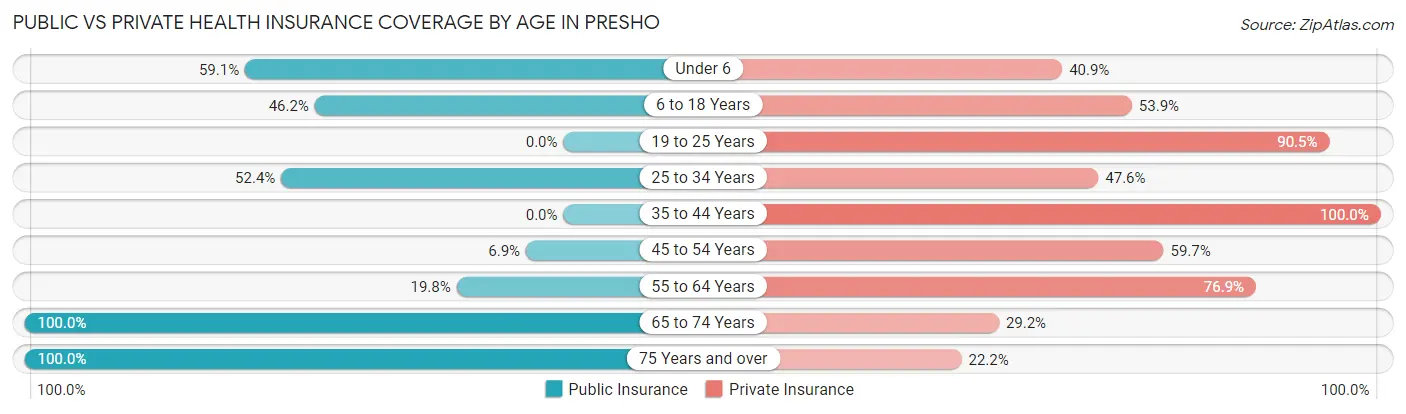
| Age Bracket | Public Insurance | Private Insurance |
| Under 6 | 13 (59.1%) | 9 (40.9%) |
| 6 to 18 Years | 6 (46.2%) | 7 (53.8%) |
| 19 to 25 Years | 0 (0.0%) | 19 (90.5%) |
| 25 to 34 Years | 11 (52.4%) | 10 (47.6%) |
| 35 to 44 Years | 0 (0.0%) | 24 (100.0%) |
| 45 to 54 Years | 5 (6.9%) | 43 (59.7%) |
| 55 to 64 Years | 24 (19.8%) | 93 (76.9%) |
| 65 to 74 Years | 24 (100.0%) | 7 (29.2%) |
| 75 Years and over | 18 (100.0%) | 4 (22.2%) |
| Total | 101 (30.1%) | 216 (64.3%) |
Disability Status by Sex by Age in Presho
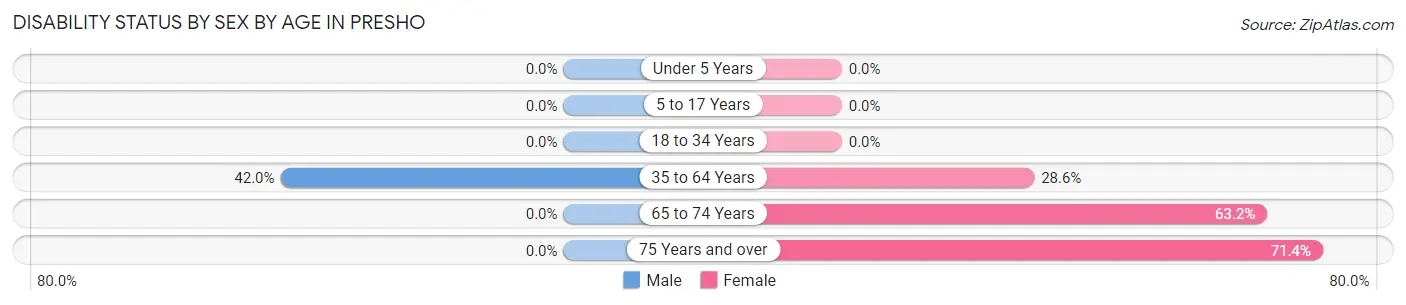
| Age Bracket | Male | Female |
| Under 5 Years | 0 (0.0%) | 0 (0.0%) |
| 5 to 17 Years | 0 (0.0%) | 0 (0.0%) |
| 18 to 34 Years | 0 (0.0%) | 0 (0.0%) |
| 35 to 64 Years | 50 (42.0%) | 28 (28.6%) |
| 65 to 74 Years | 0 (0.0%) | 12 (63.2%) |
| 75 Years and over | 0 (0.0%) | 10 (71.4%) |
Disability Class by Sex by Age in Presho
Disability Class: Hearing Difficulty
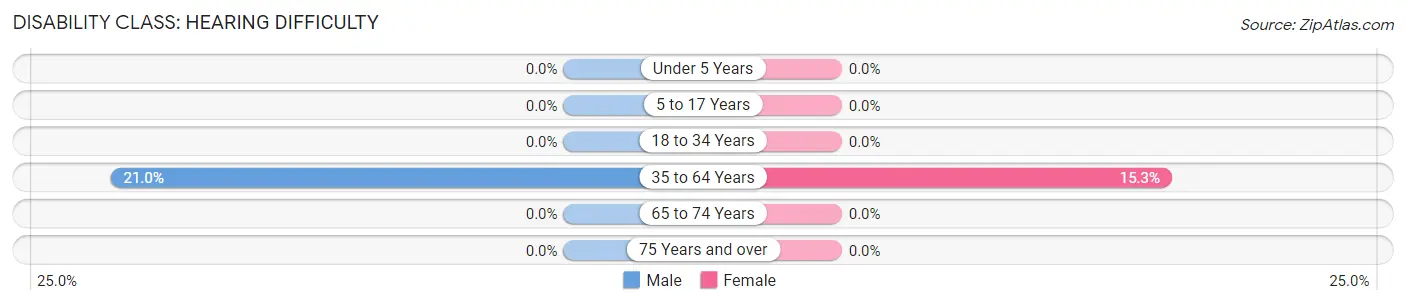
| Age Bracket | Male | Female |
| Under 5 Years | 0 (0.0%) | 0 (0.0%) |
| 5 to 17 Years | 0 (0.0%) | 0 (0.0%) |
| 18 to 34 Years | 0 (0.0%) | 0 (0.0%) |
| 35 to 64 Years | 25 (21.0%) | 15 (15.3%) |
| 65 to 74 Years | 0 (0.0%) | 0 (0.0%) |
| 75 Years and over | 0 (0.0%) | 0 (0.0%) |
Disability Class: Vision Difficulty
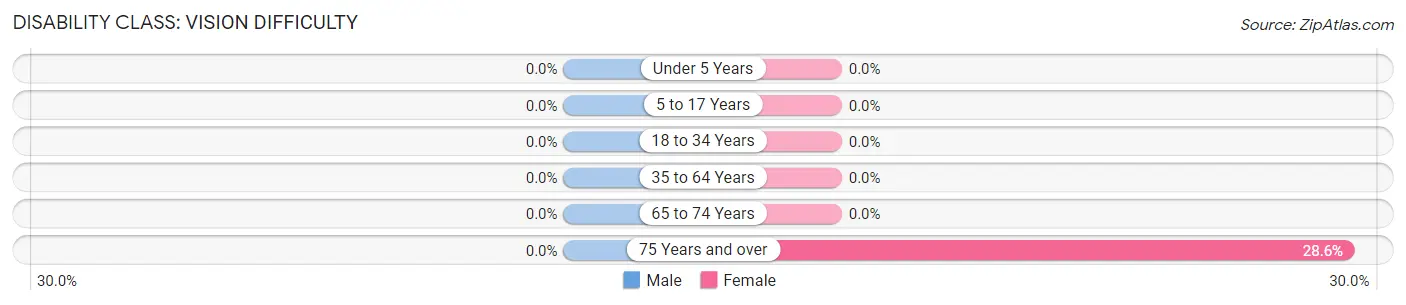
| Age Bracket | Male | Female |
| Under 5 Years | 0 (0.0%) | 0 (0.0%) |
| 5 to 17 Years | 0 (0.0%) | 0 (0.0%) |
| 18 to 34 Years | 0 (0.0%) | 0 (0.0%) |
| 35 to 64 Years | 0 (0.0%) | 0 (0.0%) |
| 65 to 74 Years | 0 (0.0%) | 0 (0.0%) |
| 75 Years and over | 0 (0.0%) | 4 (28.6%) |
Disability Class: Cognitive Difficulty
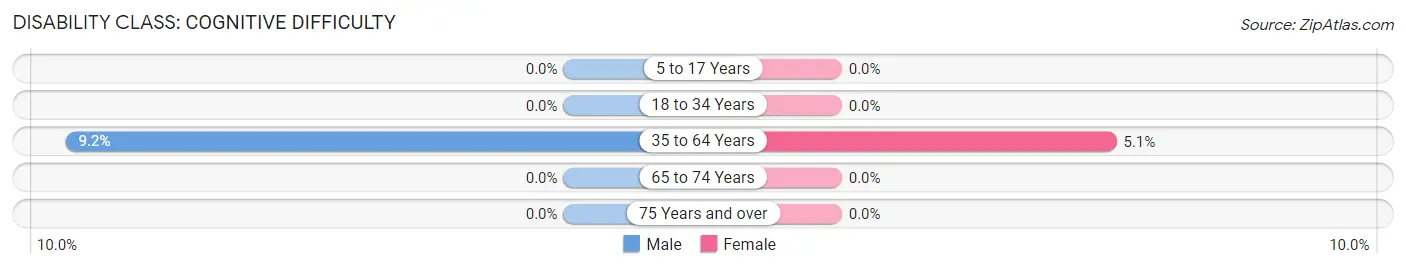
| Age Bracket | Male | Female |
| 5 to 17 Years | 0 (0.0%) | 0 (0.0%) |
| 18 to 34 Years | 0 (0.0%) | 0 (0.0%) |
| 35 to 64 Years | 11 (9.2%) | 5 (5.1%) |
| 65 to 74 Years | 0 (0.0%) | 0 (0.0%) |
| 75 Years and over | 0 (0.0%) | 0 (0.0%) |
Disability Class: Ambulatory Difficulty
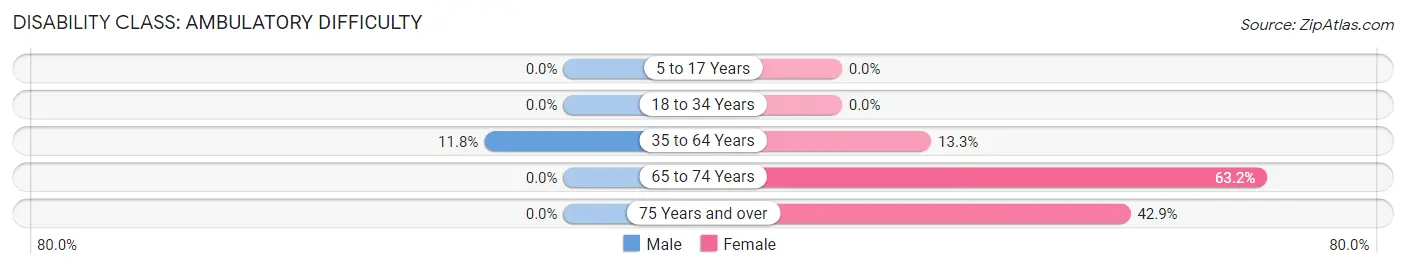
| Age Bracket | Male | Female |
| 5 to 17 Years | 0 (0.0%) | 0 (0.0%) |
| 18 to 34 Years | 0 (0.0%) | 0 (0.0%) |
| 35 to 64 Years | 14 (11.8%) | 13 (13.3%) |
| 65 to 74 Years | 0 (0.0%) | 12 (63.2%) |
| 75 Years and over | 0 (0.0%) | 6 (42.9%) |
Disability Class: Self-Care Difficulty
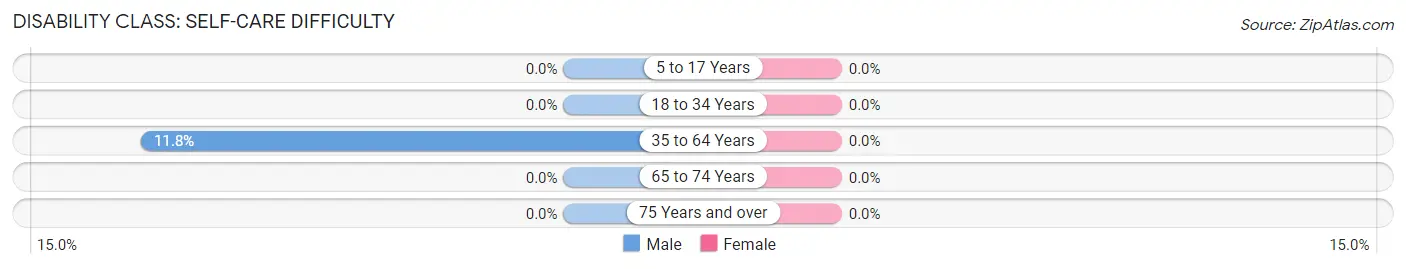
| Age Bracket | Male | Female |
| 5 to 17 Years | 0 (0.0%) | 0 (0.0%) |
| 18 to 34 Years | 0 (0.0%) | 0 (0.0%) |
| 35 to 64 Years | 14 (11.8%) | 0 (0.0%) |
| 65 to 74 Years | 0 (0.0%) | 0 (0.0%) |
| 75 Years and over | 0 (0.0%) | 0 (0.0%) |
Technology Access in Presho
Computing Device Access in Presho
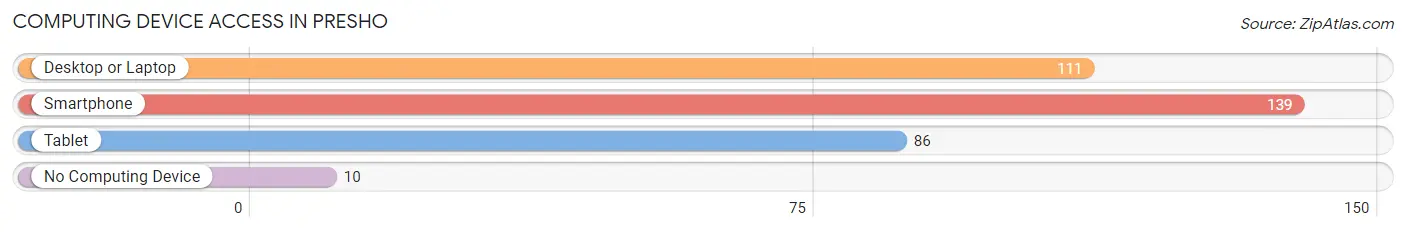
| Device Type | # Households | % Households |
| Desktop or Laptop | 111 | 67.7% |
| Smartphone | 139 | 84.8% |
| Tablet | 86 | 52.4% |
| No Computing Device | 10 | 6.1% |
| Total | 164 | 100.0% |
Internet Access in Presho
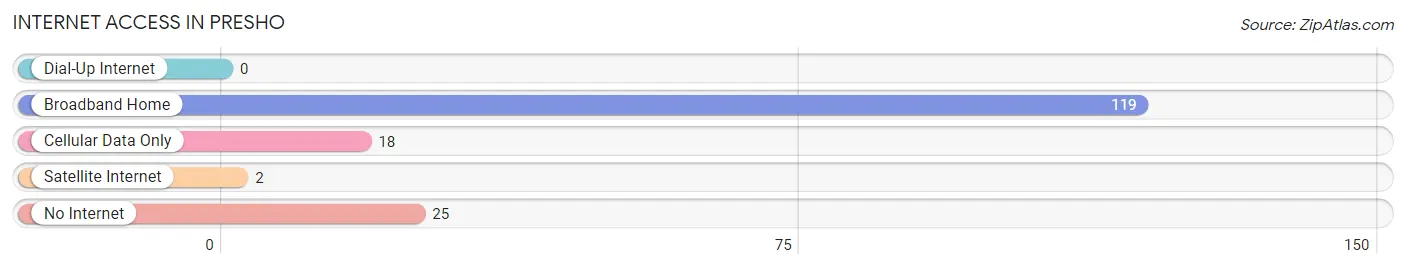
| Internet Type | # Households | % Households |
| Dial-Up Internet | 0 | 0.0% |
| Broadband Home | 119 | 72.6% |
| Cellular Data Only | 18 | 11.0% |
| Satellite Internet | 2 | 1.2% |
| No Internet | 25 | 15.2% |
| Total | 164 | 100.0% |
Presho Summary
Presho is a small town located in Lyman County, South Dakota. It is situated in the southeastern corner of the state, about 20 miles south of the Missouri River. The town was founded in 1883 and has a population of approximately 1,000 people.
Geography
Presho is located in the southeastern corner of South Dakota, about 20 miles south of the Missouri River. The town is situated in the rolling hills of the Great Plains, with an elevation of 2,400 feet. The climate is semi-arid, with hot summers and cold winters. The average annual precipitation is about 17 inches.
The town is surrounded by agricultural land, with corn, soybeans, and wheat being the main crops. There are also some cattle and sheep ranches in the area. The town is located near the Bad River, which is a tributary of the Missouri River.
Economy
The economy of Presho is largely based on agriculture. The town is home to several grain elevators, which store and process the crops grown in the area. There are also several feed mills and livestock processing plants in the area.
In addition to agriculture, Presho is home to several small businesses, including a grocery store, a hardware store, and a few restaurants. The town also has a bank, a post office, and a library.
Demographics
As of the 2010 census, the population of Presho was 1,000 people. The racial makeup of the town was 97.2% White, 0.7% African American, 0.3% Native American, 0.2% Asian, 0.1% Pacific Islander, and 1.5% from two or more races. The median household income was $37,500, and the median family income was $45,000.
The town is served by the Lyman County School District, which includes two elementary schools, a middle school, and a high school. The town also has a public library and a community center.
Conclusion
Presho is a small town located in the southeastern corner of South Dakota. It is situated in the rolling hills of the Great Plains, with an elevation of 2,400 feet. The town is surrounded by agricultural land, and the economy is largely based on agriculture. The population of Presho is 1,000 people, and the town is served by the Lyman County School District.
Common Questions
What is Per Capita Income in Presho?
Per Capita income in Presho is $40,290.
What is the Median Family Income in Presho?
Median Family Income in Presho is $78,125.
What is the Median Household income in Presho?
Median Household Income in Presho is $70,833.
What is Income or Wage Gap in Presho?
Income or Wage Gap in Presho is 50.6%.
Women in Presho earn 49.4 cents for every dollar earned by a man.
What is Inequality or Gini Index in Presho?
Inequality or Gini Index in Presho is 0.39.
What is the Total Population of Presho?
Total Population of Presho is 338.
What is the Total Male Population of Presho?
Total Male Population of Presho is 183.
What is the Total Female Population of Presho?
Total Female Population of Presho is 155.
What is the Ratio of Males per 100 Females in Presho?
There are 118.06 Males per 100 Females in Presho.
What is the Ratio of Females per 100 Males in Presho?
There are 84.70 Females per 100 Males in Presho.
What is the Median Population Age in Presho?
Median Population Age in Presho is 54.6 Years.
What is the Average Family Size in Presho
Average Family Size in Presho is 2.7 People.
What is the Average Household Size in Presho
Average Household Size in Presho is 2.0 People.
How Large is the Labor Force in Presho?
There are 240 People in the Labor Forcein in Presho.
What is the Percentage of People in the Labor Force in Presho?
75.9% of People are in the Labor Force in Presho.
What is the Unemployment Rate in Presho?
Unemployment Rate in Presho is 2.1%.