Whitehorse, SD Map & Demographics
Whitehorse Map
Whitehorse Overview
$14,815
PER CAPITA INCOME
$60,357
AVG FAMILY INCOME
$62,917
AVG HOUSEHOLD INCOME
6.2%
WAGE / INCOME GAP [ % ]
93.8¢/ $1
WAGE / INCOME GAP [ $ ]
0.21
INEQUALITY / GINI INDEX
147
TOTAL POPULATION
76
MALE POPULATION
71
FEMALE POPULATION
107.04
MALES / 100 FEMALES
93.42
FEMALES / 100 MALES
23.9
MEDIAN AGE
4.0
AVG FAMILY SIZE
4.1
AVG HOUSEHOLD SIZE
89
LABOR FORCE [ PEOPLE ]
87.3%
PERCENT IN LABOR FORCE
30.3%
UNEMPLOYMENT RATE
Whitehorse Zip Codes
Whitehorse Area Codes
Income in Whitehorse
Income Overview in Whitehorse
Per Capita Income in Whitehorse is $14,815, while median incomes of families and households are $60,357 and $62,917 respectively.
| Characteristic | Number | Measure |
| Per Capita Income | 147 | $14,815 |
| Median Family Income | 34 | $60,357 |
| Mean Family Income | 34 | $45,241 |
| Median Household Income | 36 | $62,917 |
| Mean Household Income | 36 | $57,206 |
| Income Deficit | 34 | $0 |
| Wage / Income Gap (%) | 147 | 6.16% |
| Wage / Income Gap ($) | 147 | 93.84¢ per $1 |
| Gini / Inequality Index | 147 | 0.21 |
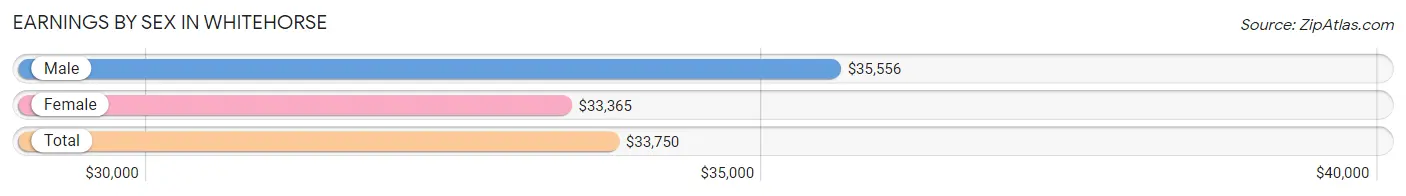
Earnings by Sex in Whitehorse
Average Earnings in Whitehorse are $33,750, $35,556 for men and $33,365 for women, a difference of 6.2%.
| Sex | Number | Average Earnings |
| Male | 40 (58.0%) | $35,556 |
| Female | 29 (42.0%) | $33,365 |
| Total | 69 (100.0%) | $33,750 |
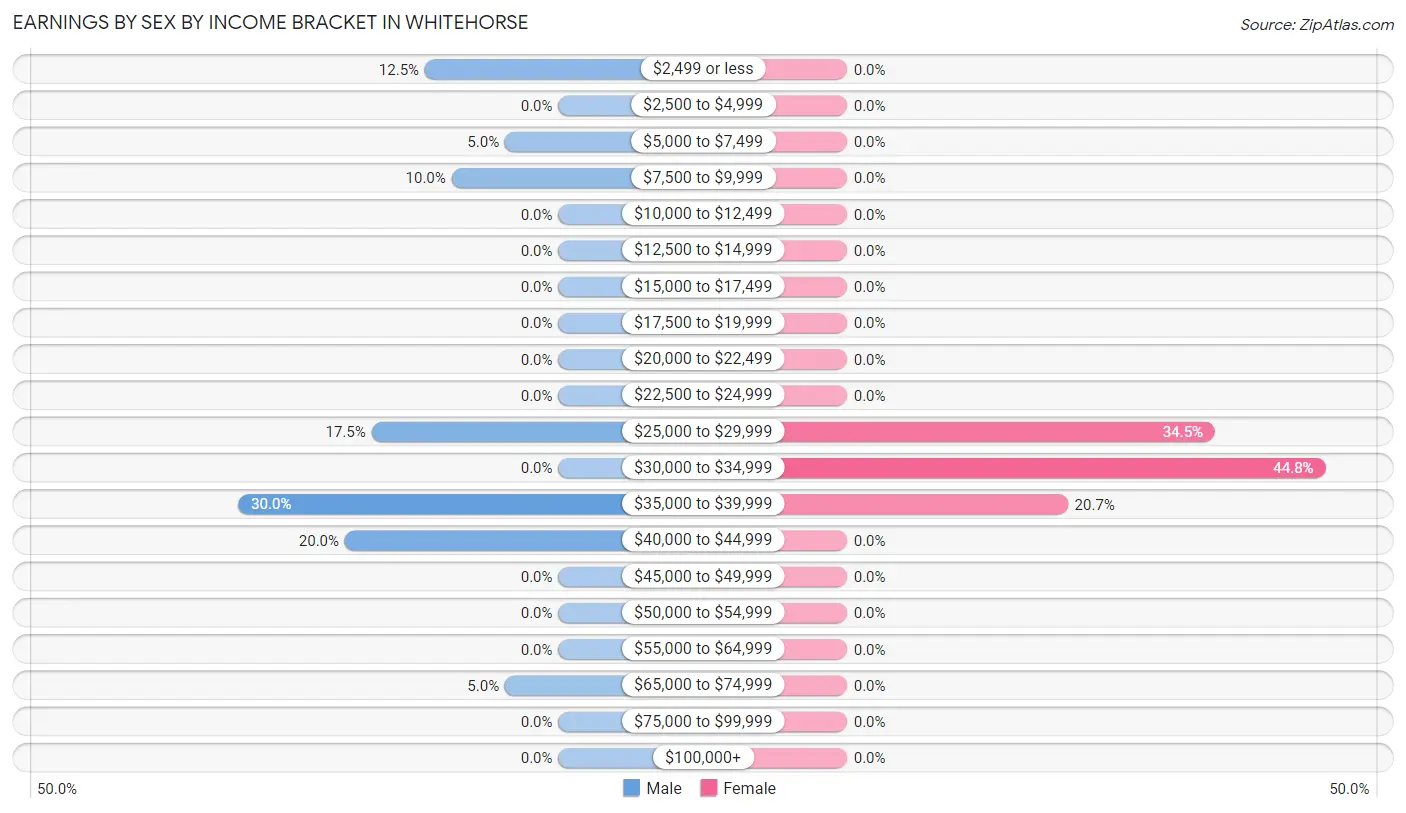
Earnings by Sex by Income Bracket in Whitehorse
The most common earnings brackets in Whitehorse are $35,000 to $39,999 for men (12 | 30.0%) and $30,000 to $34,999 for women (13 | 44.8%).
| Income | Male | Female |
| $2,499 or less | 5 (12.5%) | 0 (0.0%) |
| $2,500 to $4,999 | 0 (0.0%) | 0 (0.0%) |
| $5,000 to $7,499 | 2 (5.0%) | 0 (0.0%) |
| $7,500 to $9,999 | 4 (10.0%) | 0 (0.0%) |
| $10,000 to $12,499 | 0 (0.0%) | 0 (0.0%) |
| $12,500 to $14,999 | 0 (0.0%) | 0 (0.0%) |
| $15,000 to $17,499 | 0 (0.0%) | 0 (0.0%) |
| $17,500 to $19,999 | 0 (0.0%) | 0 (0.0%) |
| $20,000 to $22,499 | 0 (0.0%) | 0 (0.0%) |
| $22,500 to $24,999 | 0 (0.0%) | 0 (0.0%) |
| $25,000 to $29,999 | 7 (17.5%) | 10 (34.5%) |
| $30,000 to $34,999 | 0 (0.0%) | 13 (44.8%) |
| $35,000 to $39,999 | 12 (30.0%) | 6 (20.7%) |
| $40,000 to $44,999 | 8 (20.0%) | 0 (0.0%) |
| $45,000 to $49,999 | 0 (0.0%) | 0 (0.0%) |
| $50,000 to $54,999 | 0 (0.0%) | 0 (0.0%) |
| $55,000 to $64,999 | 0 (0.0%) | 0 (0.0%) |
| $65,000 to $74,999 | 2 (5.0%) | 0 (0.0%) |
| $75,000 to $99,999 | 0 (0.0%) | 0 (0.0%) |
| $100,000+ | 0 (0.0%) | 0 (0.0%) |
| Total | 40 (100.0%) | 29 (100.0%) |
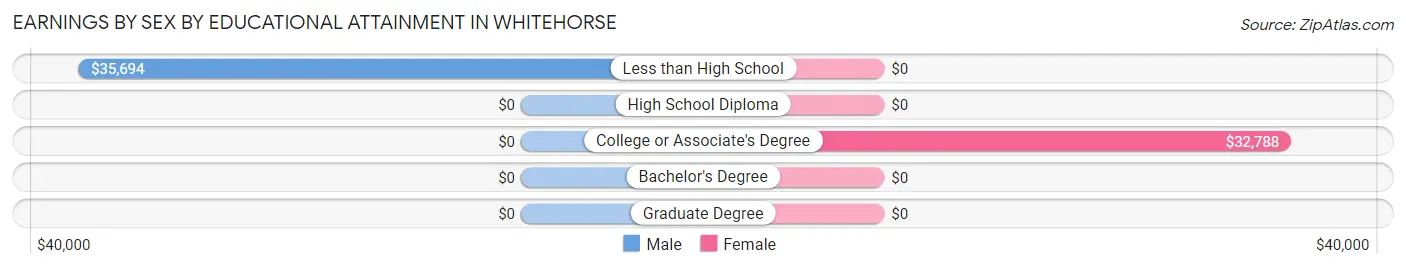
Earnings by Sex by Educational Attainment in Whitehorse
Average earnings in Whitehorse are $36,250 for men and $33,365 for women, a difference of 8.0%. Men with an educational attainment of less than high school enjoy the highest average annual earnings of $35,694, while those with less than high school education earn the least with $35,694. Women with an educational attainment of college or associate's degree earn the most with the average annual earnings of $32,788, while those with college or associate's degree education have the smallest earnings of $32,788.
| Educational Attainment | Male Income | Female Income |
| Less than High School | $35,694 | $0 |
| High School Diploma | - | - |
| College or Associate's Degree | - | - |
| Bachelor's Degree | - | - |
| Graduate Degree | - | - |
| Total | $36,250 | $33,365 |
Family Income in Whitehorse
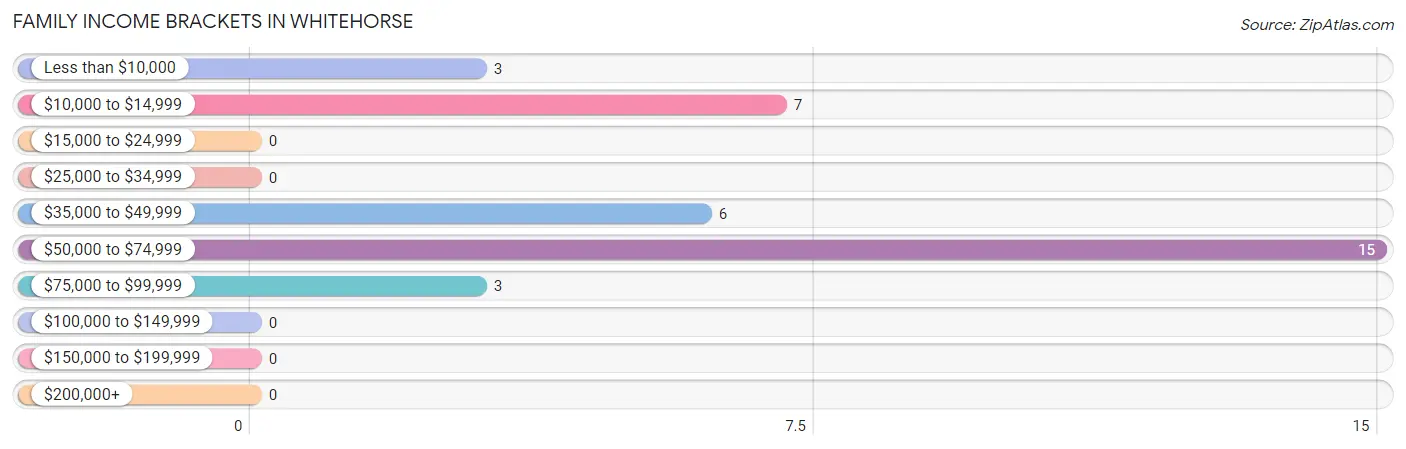
Family Income Brackets in Whitehorse
According to the Whitehorse family income data, there are 15 families falling into the $50,000 to $74,999 income range, which is the most common income bracket and makes up 44.1% of all families.
| Income Bracket | # Families | % Families |
| Less than $10,000 | 3 | 8.8% |
| $10,000 to $14,999 | 7 | 20.6% |
| $15,000 to $24,999 | 0 | 0.0% |
| $25,000 to $34,999 | 0 | 0.0% |
| $35,000 to $49,999 | 6 | 17.6% |
| $50,000 to $74,999 | 15 | 44.1% |
| $75,000 to $99,999 | 3 | 8.8% |
| $100,000 to $149,999 | 0 | 0.0% |
| $150,000 to $199,999 | 0 | 0.0% |
| $200,000+ | 0 | 0.0% |
Family Income by Famaliy Size in Whitehorse
| Income Bracket | # Families | Median Income |
| 2-Person Families | 3 (8.8%) | $0 |
| 3-Person Families | 17 (50.0%) | $0 |
| 4-Person Families | 6 (17.6%) | $0 |
| 5-Person Families | 8 (23.5%) | $0 |
| 6-Person Families | 0 (0.0%) | $0 |
| 7+ Person Families | 0 (0.0%) | $0 |
| Total | 34 (100.0%) | $60,357 |
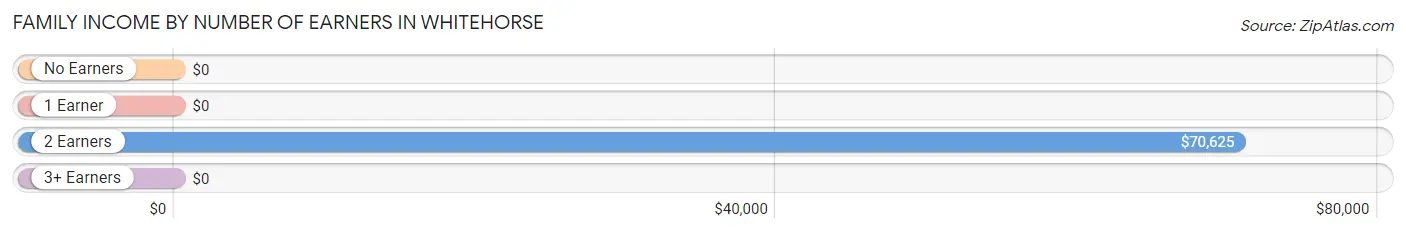
Family Income by Number of Earners in Whitehorse
| Number of Earners | # Families | Median Income |
| No Earners | 6 (17.6%) | $0 |
| 1 Earner | 6 (17.6%) | $0 |
| 2 Earners | 18 (52.9%) | $70,625 |
| 3+ Earners | 4 (11.8%) | $0 |
| Total | 34 (100.0%) | $60,357 |
Household Income in Whitehorse
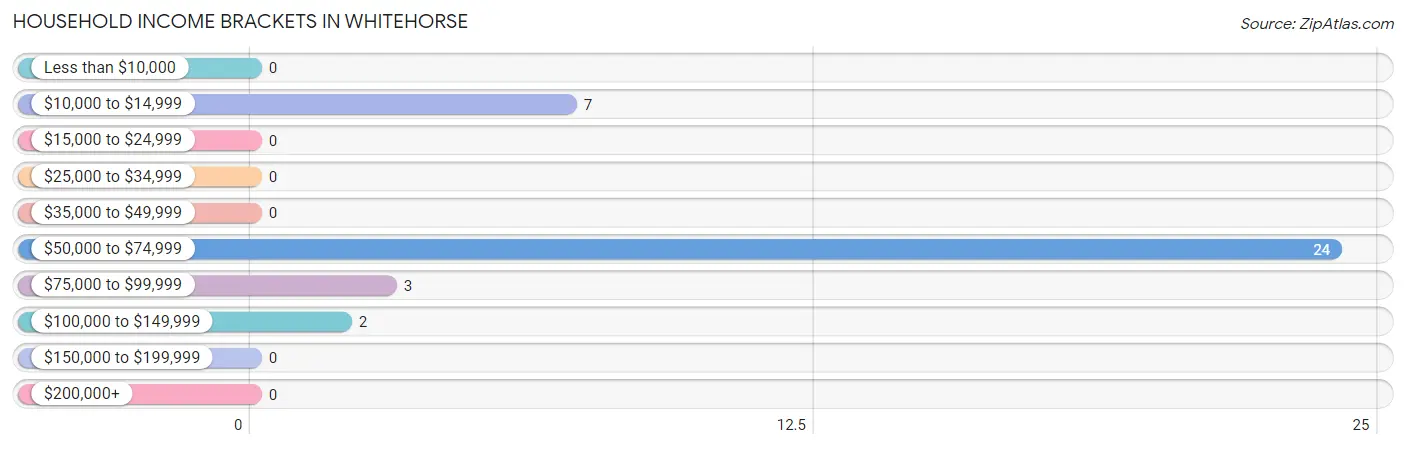
Household Income Brackets in Whitehorse
With 24 households falling in the category, the $50,000 to $74,999 income range is the most frequent in Whitehorse, accounting for 66.7% of all households.
| Income Bracket | # Households | % Households |
| Less than $10,000 | 0 | 0.0% |
| $10,000 to $14,999 | 7 | 19.4% |
| $15,000 to $24,999 | 0 | 0.0% |
| $25,000 to $34,999 | 0 | 0.0% |
| $35,000 to $49,999 | 0 | 0.0% |
| $50,000 to $74,999 | 24 | 66.7% |
| $75,000 to $99,999 | 3 | 8.3% |
| $100,000 to $149,999 | 2 | 5.6% |
| $150,000 to $199,999 | 0 | 0.0% |
| $200,000+ | 0 | 0.0% |
Household Income by Householder Age in Whitehorse
The median household income in Whitehorse is $62,917, with the highest median household income of $64,792 found in the 25 to 44 years age bracket for the primary householder. A total of 17 households (47.2%) fall into this category.
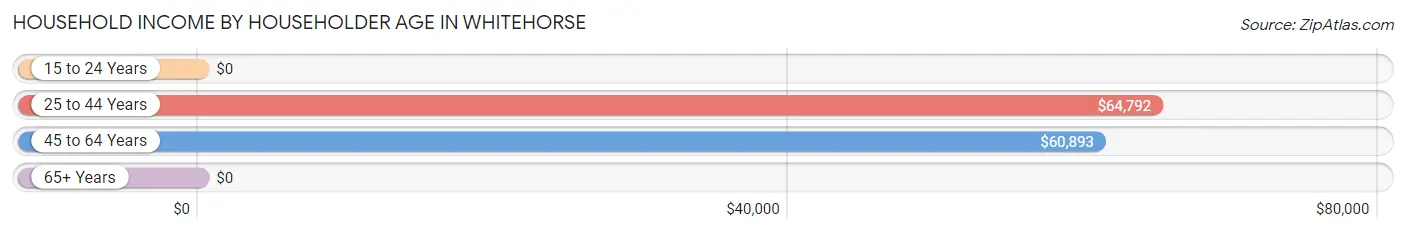
| Income Bracket | # Households | Median Income |
| 15 to 24 Years | 0 (0.0%) | $0 |
| 25 to 44 Years | 17 (47.2%) | $64,792 |
| 45 to 64 Years | 19 (52.8%) | $60,893 |
| 65+ Years | 0 (0.0%) | $0 |
| Total | 36 (100.0%) | $62,917 |
Poverty in Whitehorse
Income Below Poverty by Sex and Age in Whitehorse
With 22.4% poverty level for males and 12.7% for females among the residents of Whitehorse, 55 to 64 year old males and 16 and 17 year old females are the most vulnerable to poverty, with 6 males (54.5%) and 3 females (100.0%) in their respective age groups living below the poverty level.
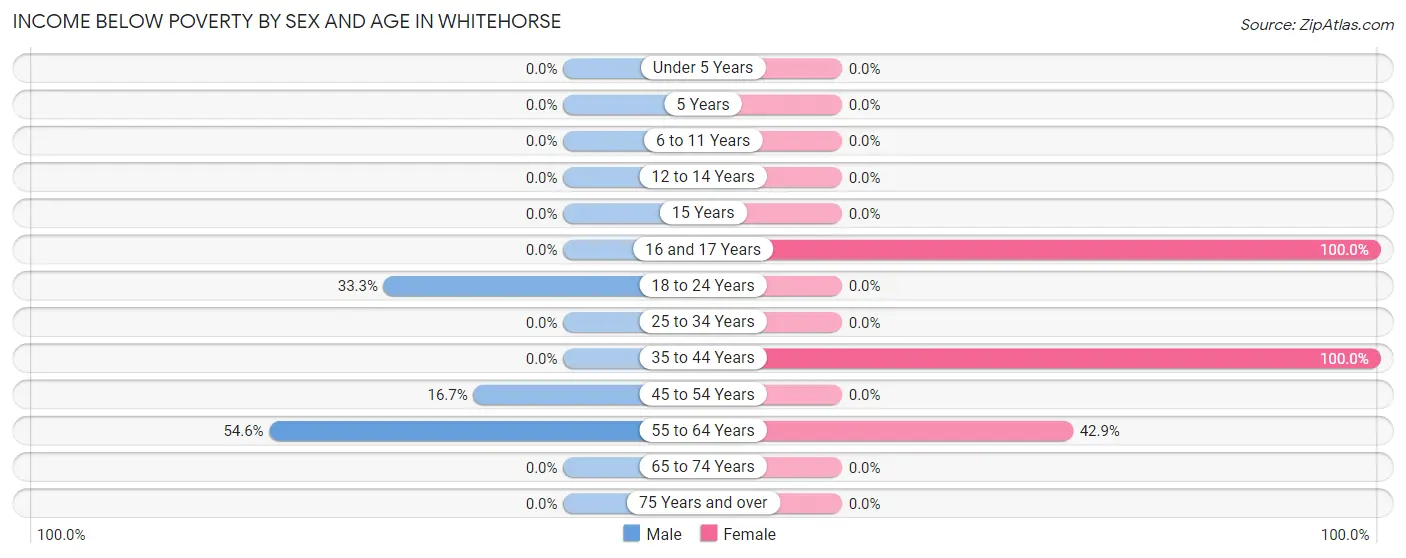
| Age Bracket | Male | Female |
| Under 5 Years | 0 (0.0%) | 0 (0.0%) |
| 5 Years | 0 (0.0%) | 0 (0.0%) |
| 6 to 11 Years | 0 (0.0%) | 0 (0.0%) |
| 12 to 14 Years | 0 (0.0%) | 0 (0.0%) |
| 15 Years | 0 (0.0%) | 0 (0.0%) |
| 16 and 17 Years | 0 (0.0%) | 3 (100.0%) |
| 18 to 24 Years | 9 (33.3%) | 0 (0.0%) |
| 25 to 34 Years | 0 (0.0%) | 0 (0.0%) |
| 35 to 44 Years | 0 (0.0%) | 3 (100.0%) |
| 45 to 54 Years | 2 (16.7%) | 0 (0.0%) |
| 55 to 64 Years | 6 (54.5%) | 3 (42.9%) |
| 65 to 74 Years | 0 (0.0%) | 0 (0.0%) |
| 75 Years and over | 0 (0.0%) | 0 (0.0%) |
| Total | 17 (22.4%) | 9 (12.7%) |
Income Above Poverty by Sex and Age in Whitehorse
According to the poverty statistics in Whitehorse, males aged 6 to 11 years and females aged under 5 years are the age groups that are most secure financially, with 100.0% of males and 100.0% of females in these age groups living above the poverty line.
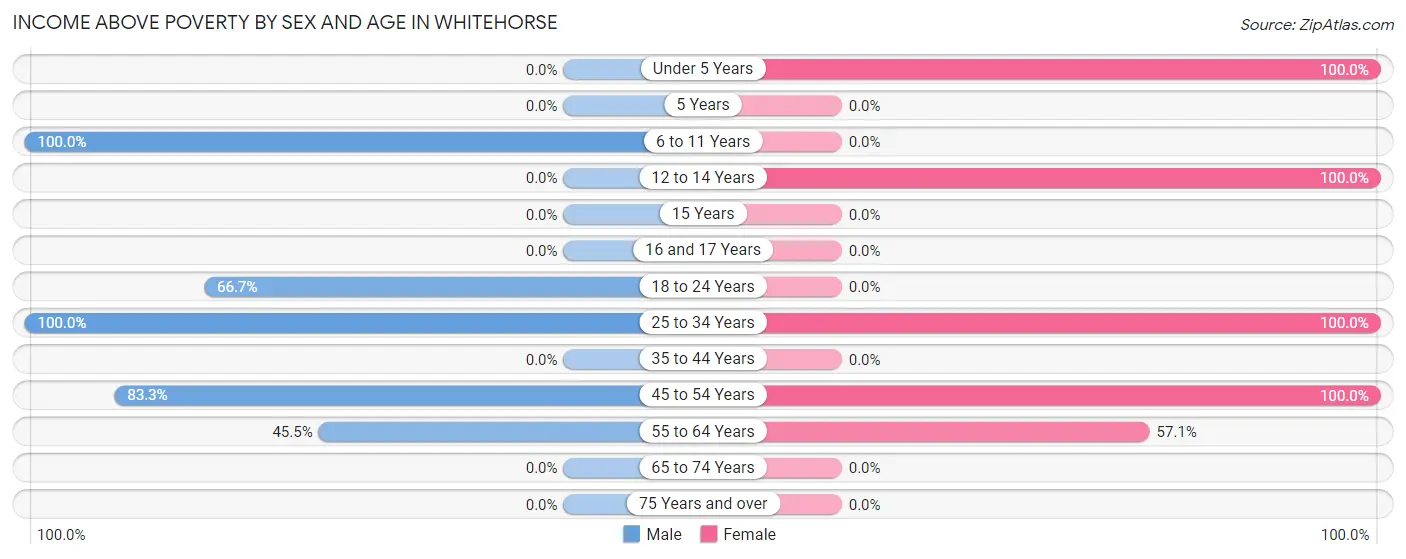
| Age Bracket | Male | Female |
| Under 5 Years | 0 (0.0%) | 28 (100.0%) |
| 5 Years | 0 (0.0%) | 0 (0.0%) |
| 6 to 11 Years | 12 (100.0%) | 0 (0.0%) |
| 12 to 14 Years | 0 (0.0%) | 5 (100.0%) |
| 15 Years | 0 (0.0%) | 0 (0.0%) |
| 16 and 17 Years | 0 (0.0%) | 0 (0.0%) |
| 18 to 24 Years | 18 (66.7%) | 0 (0.0%) |
| 25 to 34 Years | 14 (100.0%) | 10 (100.0%) |
| 35 to 44 Years | 0 (0.0%) | 0 (0.0%) |
| 45 to 54 Years | 10 (83.3%) | 15 (100.0%) |
| 55 to 64 Years | 5 (45.5%) | 4 (57.1%) |
| 65 to 74 Years | 0 (0.0%) | 0 (0.0%) |
| 75 Years and over | 0 (0.0%) | 0 (0.0%) |
| Total | 59 (77.6%) | 62 (87.3%) |
Income Below Poverty Among Married-Couple Families in Whitehorse
The poverty statistics for married-couple families in Whitehorse show that 14.3% or 3 of the total 21 families live below the poverty line. Families with no children have the highest poverty rate of 30.0%, comprising of 3 families. On the other hand, families with 1 or 2 children have the lowest poverty rate of 0.0%, which includes 0 families.
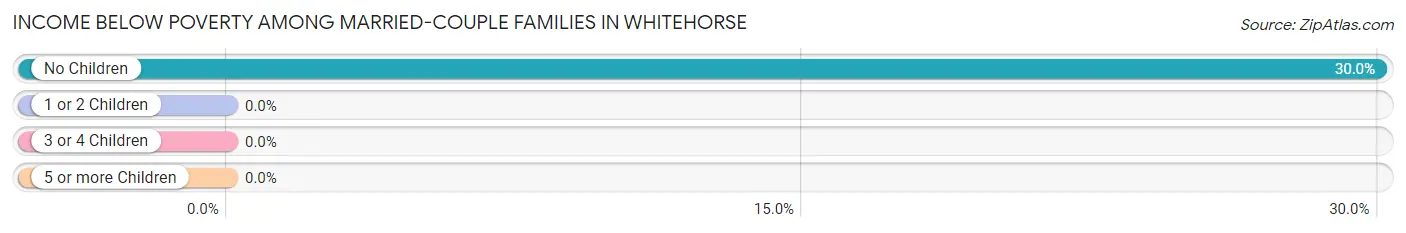
| Children | Above Poverty | Below Poverty |
| No Children | 7 (70.0%) | 3 (30.0%) |
| 1 or 2 Children | 3 (100.0%) | 0 (0.0%) |
| 3 or 4 Children | 8 (100.0%) | 0 (0.0%) |
| 5 or more Children | 0 (0.0%) | 0 (0.0%) |
| Total | 18 (85.7%) | 3 (14.3%) |
Income Below Poverty Among Single-Parent Households in Whitehorse
According to the poverty data in Whitehorse, 40.0% or 4 single-father households and 100.0% or 3 single-mother households are living below the poverty line. Among single-father households, those with no children have the highest poverty rate, with 4 households (100.0%) experiencing poverty. Likewise, among single-mother households, those with 1 or 2 children have the highest poverty rate, with 3 households (100.0%) falling below the poverty line.
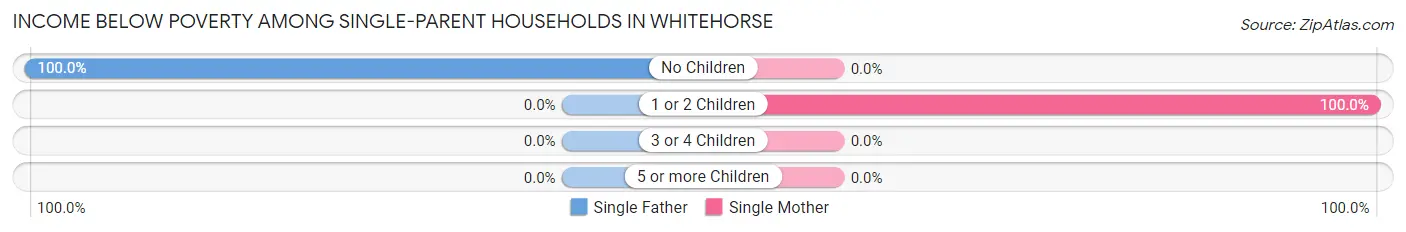
| Children | Single Father | Single Mother |
| No Children | 4 (100.0%) | 0 (0.0%) |
| 1 or 2 Children | 0 (0.0%) | 3 (100.0%) |
| 3 or 4 Children | 0 (0.0%) | 0 (0.0%) |
| 5 or more Children | 0 (0.0%) | 0 (0.0%) |
| Total | 4 (40.0%) | 3 (100.0%) |
Income Below Poverty Among Married-Couple vs Single-Parent Households in Whitehorse
The poverty data for Whitehorse shows that 3 of the married-couple family households (14.3%) and 7 of the single-parent households (53.8%) are living below the poverty level. Within the married-couple family households, those with no children have the highest poverty rate, with 3 households (30.0%) falling below the poverty line. Among the single-parent households, those with no children have the highest poverty rate, with 4 household (100.0%) living below poverty.
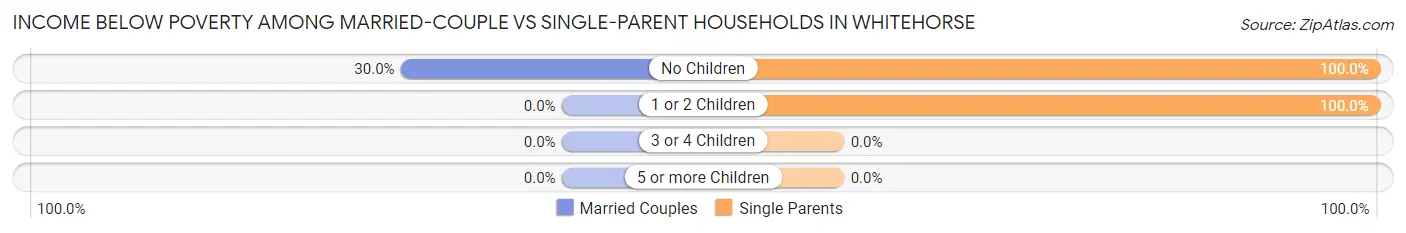
| Children | Married-Couple Families | Single-Parent Households |
| No Children | 3 (30.0%) | 4 (100.0%) |
| 1 or 2 Children | 0 (0.0%) | 3 (100.0%) |
| 3 or 4 Children | 0 (0.0%) | 0 (0.0%) |
| 5 or more Children | 0 (0.0%) | 0 (0.0%) |
| Total | 3 (14.3%) | 7 (53.8%) |
Race in Whitehorse
The most populous races in Whitehorse are Native / Alaskan (145 | 98.6%), Hispanic or Latino (2 | 1.4%), and Two or more Races (2 | 1.4%).
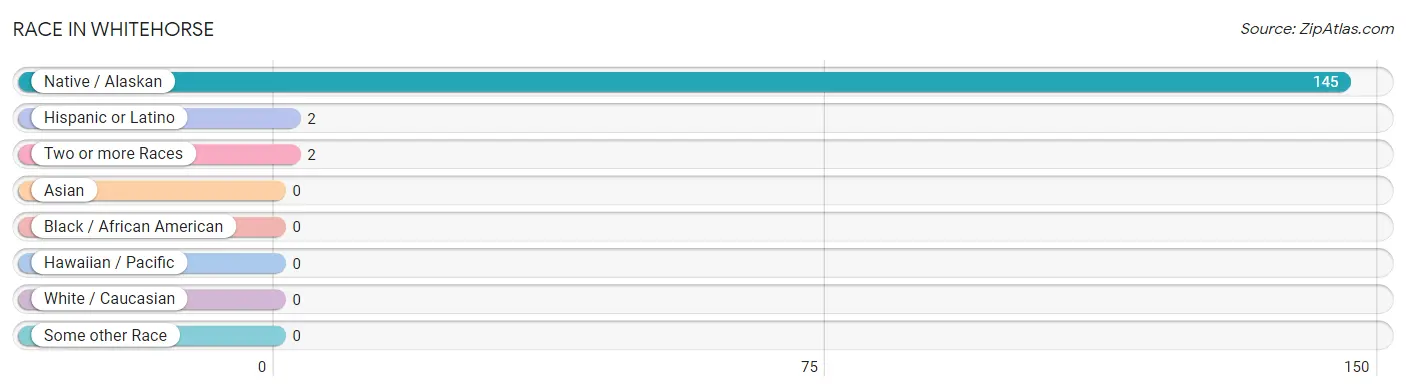
| Race | # Population | % Population |
| Asian | 0 | 0.0% |
| Black / African American | 0 | 0.0% |
| Hawaiian / Pacific | 0 | 0.0% |
| Hispanic or Latino | 2 | 1.4% |
| Native / Alaskan | 145 | 98.6% |
| White / Caucasian | 0 | 0.0% |
| Two or more Races | 2 | 1.4% |
| Some other Race | 0 | 0.0% |
| Total | 147 | 100.0% |
Ancestry in Whitehorse
The most populous ancestries reported in Whitehorse are Sioux (133 | 90.5%), Mexican (2 | 1.4%), and Mexican American Indian (2 | 1.4%), together accounting for 93.2% of all Whitehorse residents.
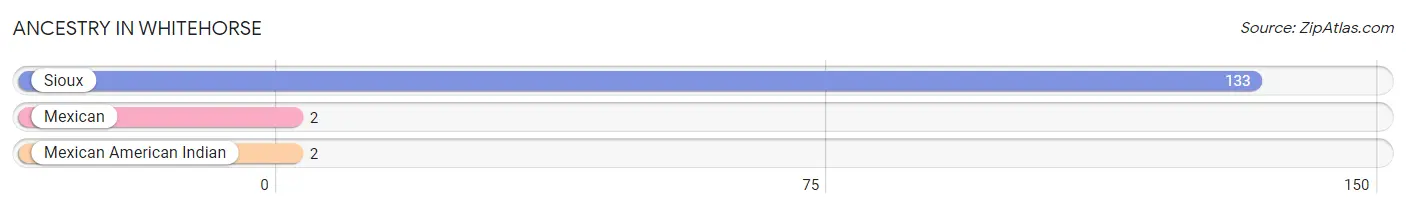
| Ancestry | # Population | % Population |
| Mexican | 2 | 1.4% |
| Mexican American Indian | 2 | 1.4% |
| Sioux | 133 | 90.5% | View All 3 Rows |
Immigrants in Whitehorse

| Immigration Origin | # Population | % Population | View All 0 Rows |
Sex and Age in Whitehorse
Sex and Age in Whitehorse
The most populous age groups in Whitehorse are 20 to 24 Years (23 | 30.3%) for men and Under 5 Years (28 | 39.4%) for women.
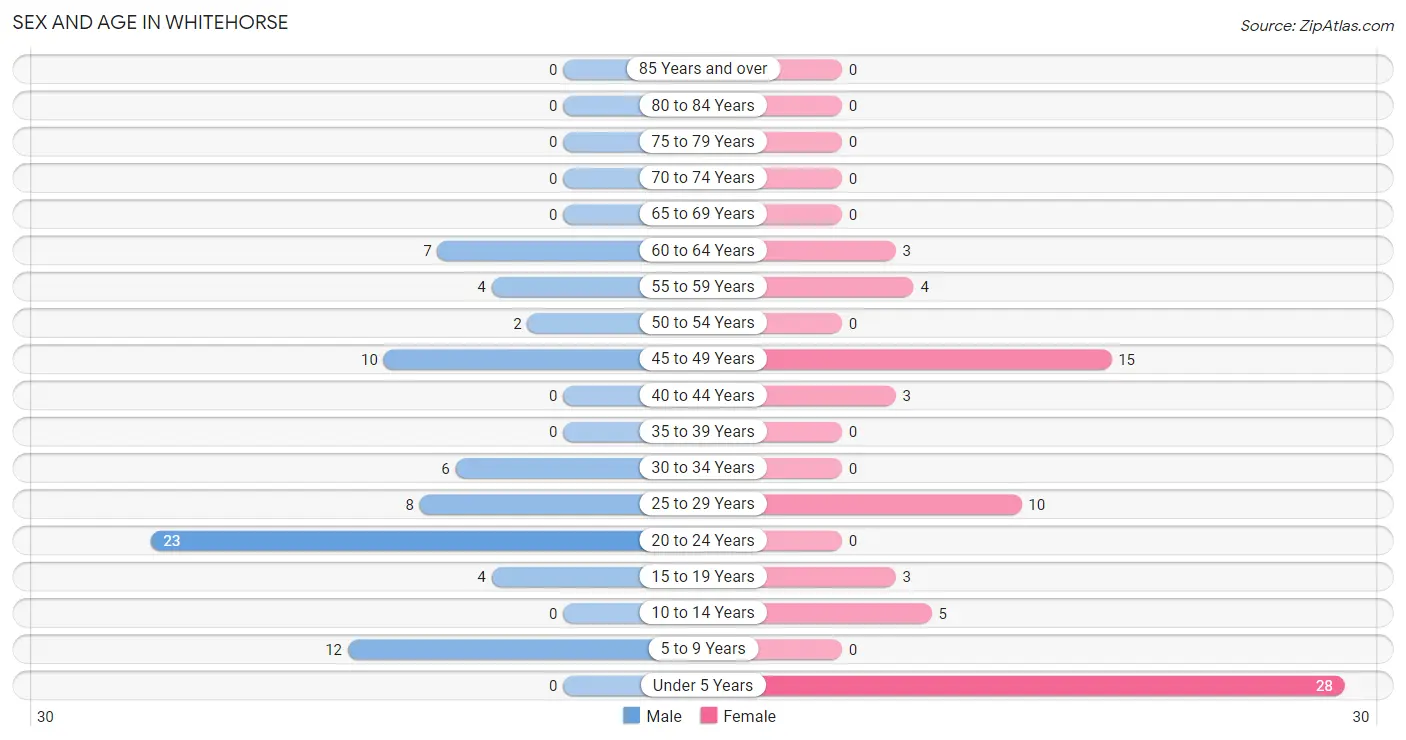
| Age Bracket | Male | Female |
| Under 5 Years | 0 (0.0%) | 28 (39.4%) |
| 5 to 9 Years | 12 (15.8%) | 0 (0.0%) |
| 10 to 14 Years | 0 (0.0%) | 5 (7.0%) |
| 15 to 19 Years | 4 (5.3%) | 3 (4.2%) |
| 20 to 24 Years | 23 (30.3%) | 0 (0.0%) |
| 25 to 29 Years | 8 (10.5%) | 10 (14.1%) |
| 30 to 34 Years | 6 (7.9%) | 0 (0.0%) |
| 35 to 39 Years | 0 (0.0%) | 0 (0.0%) |
| 40 to 44 Years | 0 (0.0%) | 3 (4.2%) |
| 45 to 49 Years | 10 (13.2%) | 15 (21.1%) |
| 50 to 54 Years | 2 (2.6%) | 0 (0.0%) |
| 55 to 59 Years | 4 (5.3%) | 4 (5.6%) |
| 60 to 64 Years | 7 (9.2%) | 3 (4.2%) |
| 65 to 69 Years | 0 (0.0%) | 0 (0.0%) |
| 70 to 74 Years | 0 (0.0%) | 0 (0.0%) |
| 75 to 79 Years | 0 (0.0%) | 0 (0.0%) |
| 80 to 84 Years | 0 (0.0%) | 0 (0.0%) |
| 85 Years and over | 0 (0.0%) | 0 (0.0%) |
| Total | 76 (100.0%) | 71 (100.0%) |
Families and Households in Whitehorse
Median Family Size in Whitehorse
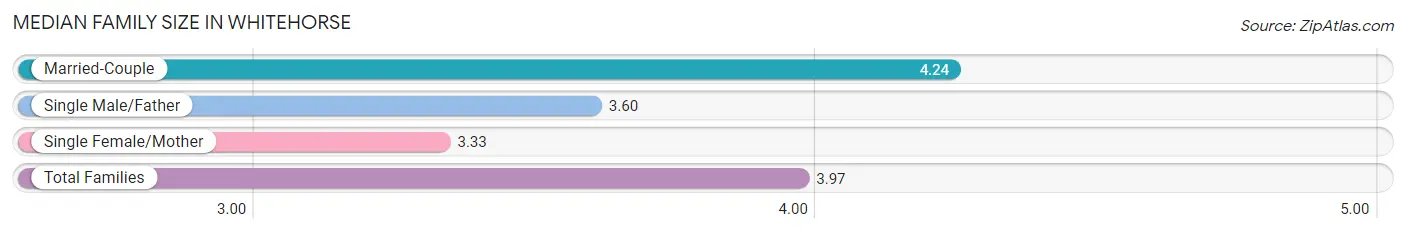
The median family size in Whitehorse is 3.97 persons per family, with married-couple families (21 | 61.8%) accounting for the largest median family size of 4.24 persons per family. On the other hand, single female/mother families (3 | 8.8%) represent the smallest median family size with 3.33 persons per family.
| Family Type | # Families | Family Size |
| Married-Couple | 21 (61.8%) | 4.24 |
| Single Male/Father | 10 (29.4%) | 3.60 |
| Single Female/Mother | 3 (8.8%) | 3.33 |
| Total Families | 34 (100.0%) | 3.97 |
Median Household Size in Whitehorse
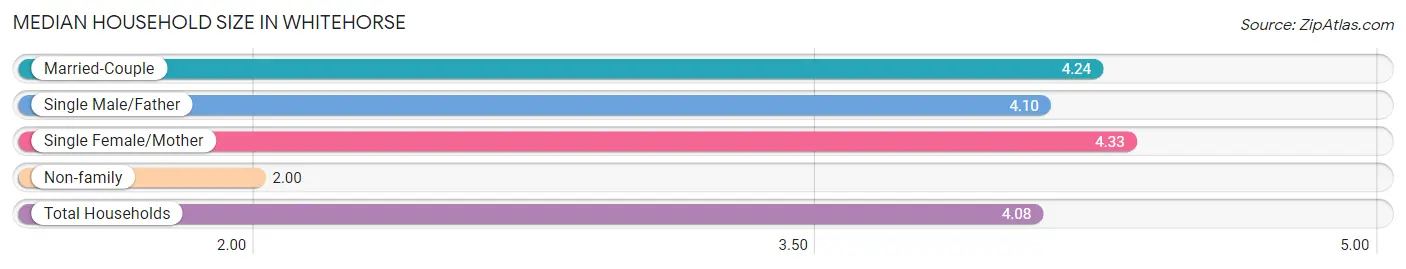
The median household size in Whitehorse is 4.08 persons per household, with single female/mother households (3 | 8.3%) accounting for the largest median household size of 4.33 persons per household. non-family households (2 | 5.6%) represent the smallest median household size with 2.00 persons per household.
| Household Type | # Households | Household Size |
| Married-Couple | 21 (58.3%) | 4.24 |
| Single Male/Father | 10 (27.8%) | 4.10 |
| Single Female/Mother | 3 (8.3%) | 4.33 |
| Non-family | 2 (5.6%) | 2.00 |
| Total Households | 36 (100.0%) | 4.08 |
Household Size by Marriage Status in Whitehorse
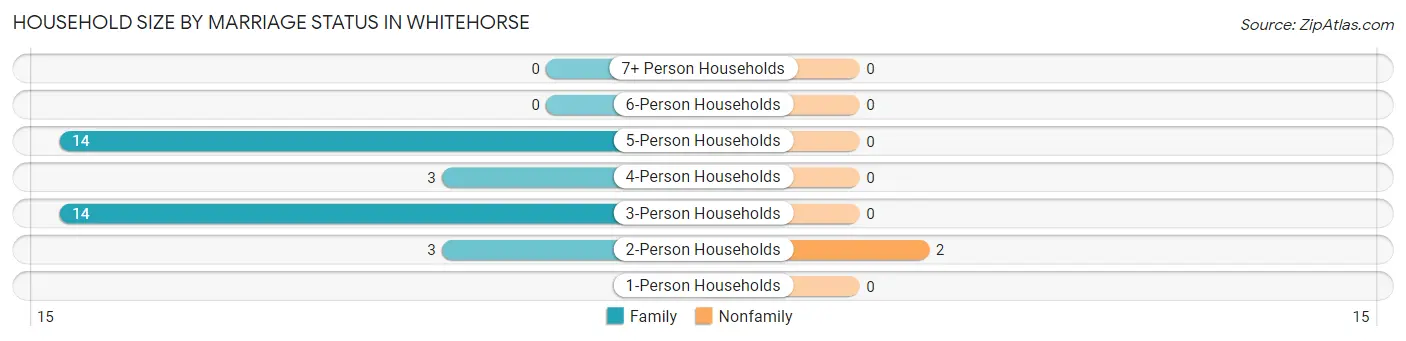
Out of a total of 36 households in Whitehorse, 34 (94.4%) are family households, while 2 (5.6%) are nonfamily households. The most numerous type of family households are 3-person households, comprising 14, and the most common type of nonfamily households are 2-person households, comprising 2.
| Household Size | Family Households | Nonfamily Households |
| 1-Person Households | - | 0 (0.0%) |
| 2-Person Households | 3 (8.3%) | 2 (5.6%) |
| 3-Person Households | 14 (38.9%) | 0 (0.0%) |
| 4-Person Households | 3 (8.3%) | 0 (0.0%) |
| 5-Person Households | 14 (38.9%) | 0 (0.0%) |
| 6-Person Households | 0 (0.0%) | 0 (0.0%) |
| 7+ Person Households | 0 (0.0%) | 0 (0.0%) |
| Total | 34 (94.4%) | 2 (5.6%) |
Female Fertility in Whitehorse
Fertility by Age in Whitehorse
Average fertility rate in Whitehorse is 161.0 births per 1,000 women. Women in the age bracket of 20 to 34 years have the highest fertility rate with 500.0 births per 1,000 women. Women in the age bracket of 20 to 34 years acount for 100.0% of all women with births.
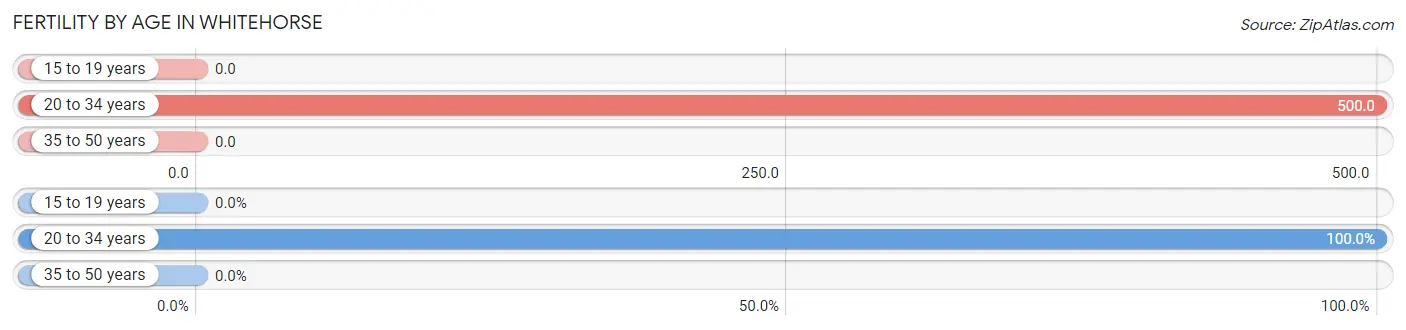
| Age Bracket | Women with Births | Births / 1,000 Women |
| 15 to 19 years | 0 (0.0%) | 0.0 |
| 20 to 34 years | 5 (100.0%) | 500.0 |
| 35 to 50 years | 0 (0.0%) | 0.0 |
| Total | 5 (100.0%) | 161.0 |
Fertility by Age by Marriage Status in Whitehorse
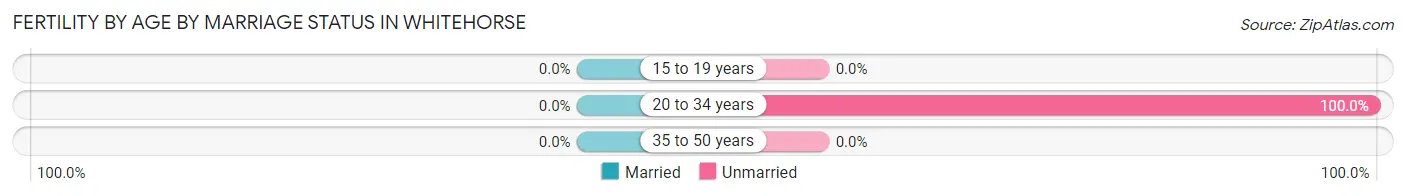
| Age Bracket | Married | Unmarried |
| 15 to 19 years | 0 (0.0%) | 0 (0.0%) |
| 20 to 34 years | 0 (0.0%) | 5 (100.0%) |
| 35 to 50 years | 0 (0.0%) | 0 (0.0%) |
| Total | 0 (0.0%) | 5 (100.0%) |
Fertility by Education in Whitehorse
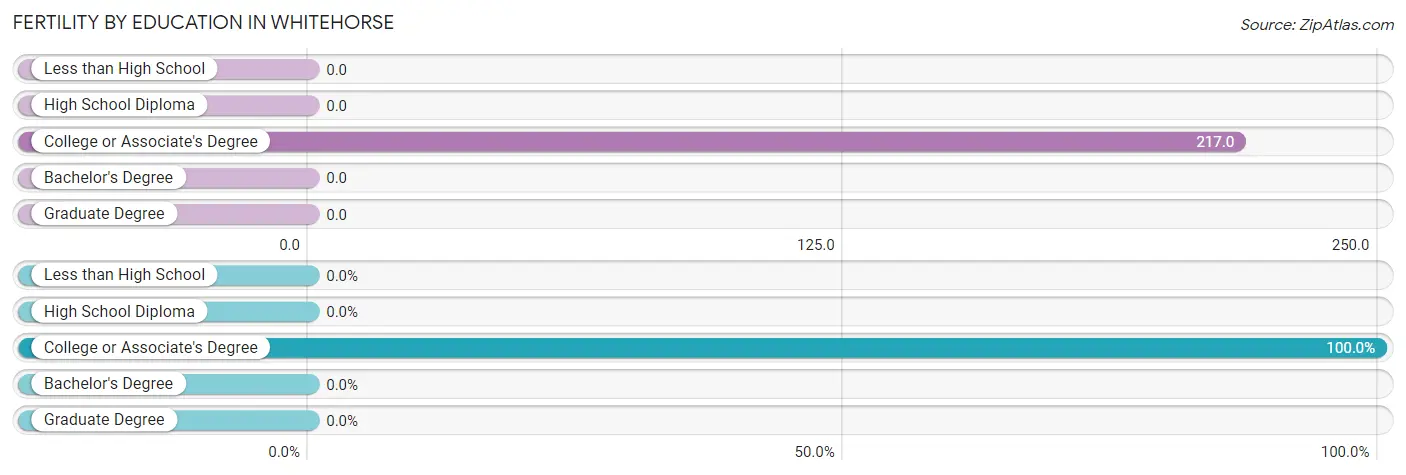
| Educational Attainment | Women with Births | Births / 1,000 Women |
| Less than High School | 0 (0.0%) | 0.0 |
| High School Diploma | 0 (0.0%) | 0.0 |
| College or Associate's Degree | 5 (100.0%) | 217.0 |
| Bachelor's Degree | 0 (0.0%) | 0.0 |
| Graduate Degree | 0 (0.0%) | 0.0 |
| Total | 5 (100.0%) | 161.0 |
Fertility by Education by Marriage Status in Whitehorse
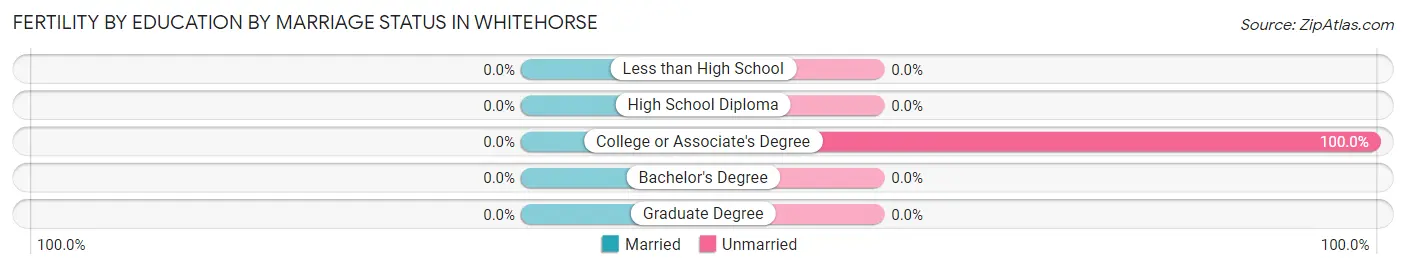
| Educational Attainment | Married | Unmarried |
| Less than High School | 0 (0.0%) | 0 (0.0%) |
| High School Diploma | 0 (0.0%) | 0 (0.0%) |
| College or Associate's Degree | 0 (0.0%) | 5 (100.0%) |
| Bachelor's Degree | 0 (0.0%) | 0 (0.0%) |
| Graduate Degree | 0 (0.0%) | 0 (0.0%) |
| Total | 0 (0.0%) | 5 (100.0%) |
Employment Characteristics in Whitehorse
Employment by Class of Employer in Whitehorse
Among the 62 employed individuals in Whitehorse, local government employees (28 | 45.2%), federal government employees (17 | 27.4%), and private company employees (12 | 19.4%) make up the most common classes of employment.
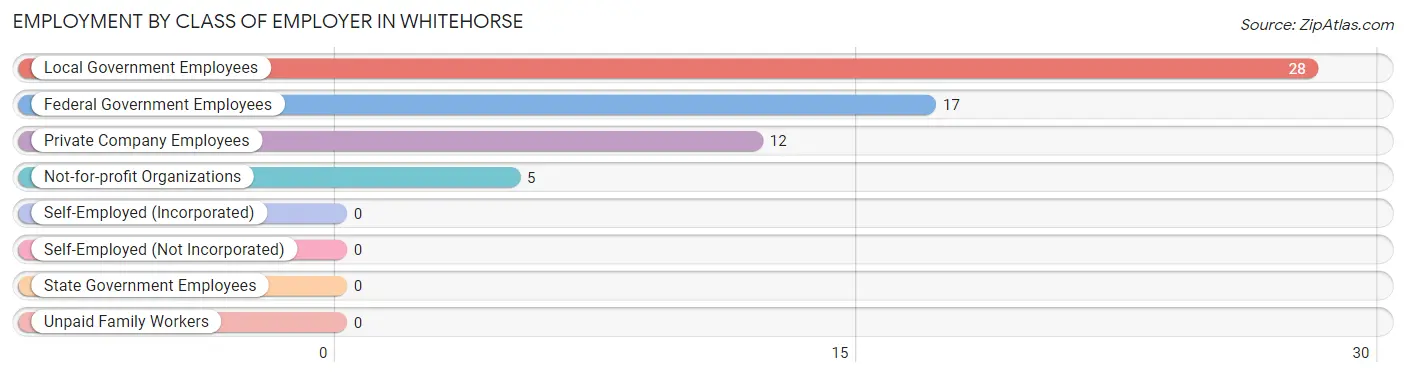
| Employer Class | # Employees | % Employees |
| Private Company Employees | 12 | 19.4% |
| Self-Employed (Incorporated) | 0 | 0.0% |
| Self-Employed (Not Incorporated) | 0 | 0.0% |
| Not-for-profit Organizations | 5 | 8.1% |
| Local Government Employees | 28 | 45.2% |
| State Government Employees | 0 | 0.0% |
| Federal Government Employees | 17 | 27.4% |
| Unpaid Family Workers | 0 | 0.0% |
| Total | 62 | 100.0% |
Employment Status by Age in Whitehorse
According to the labor force statistics for Whitehorse, out of the total population over 16 years of age (102), 87.3% or 89 individuals are in the labor force, with 30.3% or 27 of them unemployed. The age group with the highest labor force participation rate is 20 to 24 years, with 100.0% or 23 individuals in the labor force. Within the labor force, the 20 to 24 years age range has the highest percentage of unemployed individuals, with 100.0% or 23 of them being unemployed.
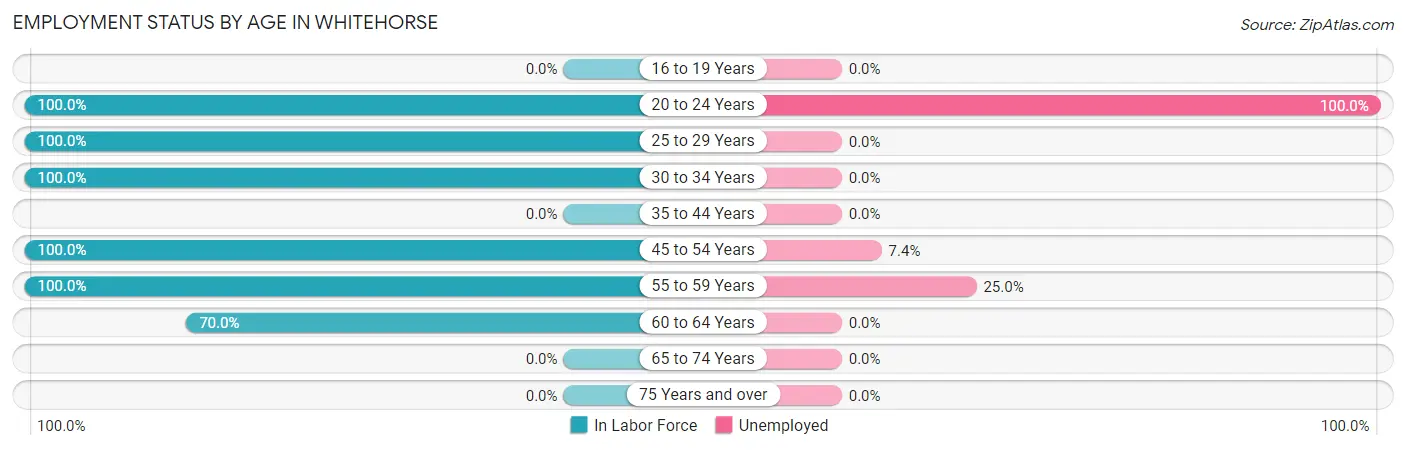
| Age Bracket | In Labor Force | Unemployed |
| 16 to 19 Years | 0 (0.0%) | 0 (0.0%) |
| 20 to 24 Years | 23 (100.0%) | 23 (100.0%) |
| 25 to 29 Years | 18 (100.0%) | 0 (0.0%) |
| 30 to 34 Years | 6 (100.0%) | 0 (0.0%) |
| 35 to 44 Years | 0 (0.0%) | 0 (0.0%) |
| 45 to 54 Years | 27 (100.0%) | 2 (7.4%) |
| 55 to 59 Years | 8 (100.0%) | 2 (25.0%) |
| 60 to 64 Years | 7 (70.0%) | 0 (0.0%) |
| 65 to 74 Years | 0 (0.0%) | 0 (0.0%) |
| 75 Years and over | 0 (0.0%) | 0 (0.0%) |
| Total | 89 (87.3%) | 27 (30.3%) |
Employment Status by Educational Attainment in Whitehorse
According to labor force statistics for Whitehorse, 91.7% of individuals (66) out of the total population between 25 and 64 years of age (72) are in the labor force, with 6.1% or 4 of them being unemployed. The group with the highest labor force participation rate are those with the educational attainment of college / associate degree, with 100.0% or 25 individuals in the labor force. Within the labor force, individuals with high school diploma education have the highest percentage of unemployment, with 9.1% or 2 of them being unemployed.
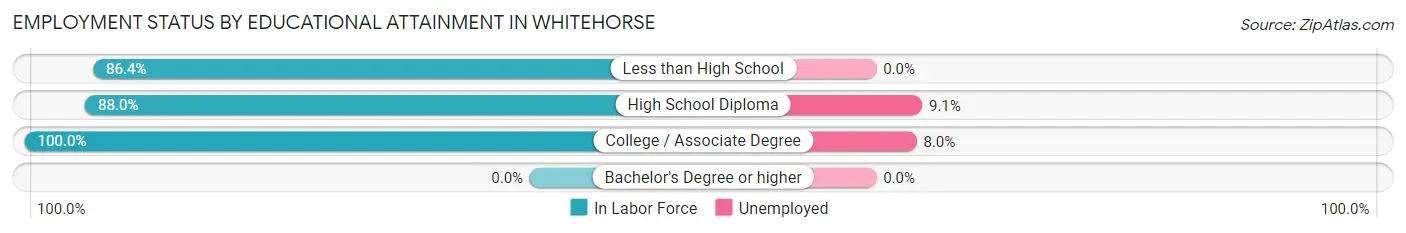
| Educational Attainment | In Labor Force | Unemployed |
| Less than High School | 19 (86.4%) | 0 (0.0%) |
| High School Diploma | 22 (88.0%) | 2 (9.1%) |
| College / Associate Degree | 25 (100.0%) | 2 (8.0%) |
| Bachelor's Degree or higher | 0 (0.0%) | 0 (0.0%) |
| Total | 66 (91.7%) | 4 (6.1%) |
Employment Occupations by Sex in Whitehorse
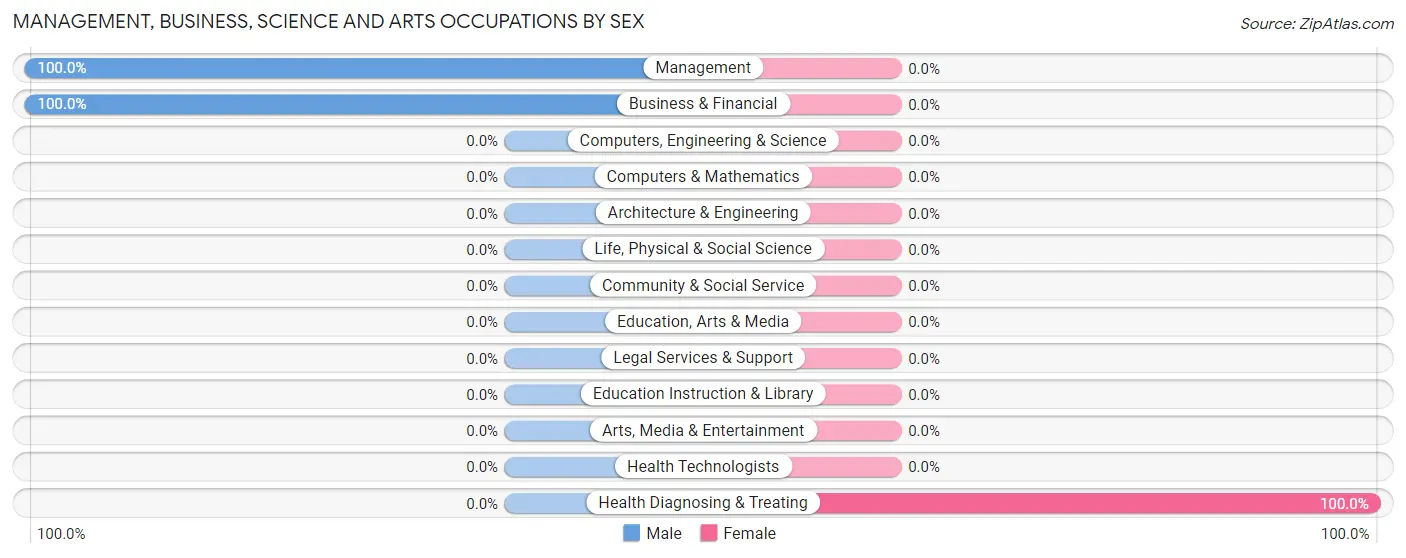
Management, Business, Science and Arts Occupations
The most common Management, Business, Science and Arts occupations in Whitehorse are Management (6 | 9.7%), Business & Financial (2 | 3.2%), and Health Diagnosing & Treating (2 | 3.2%).
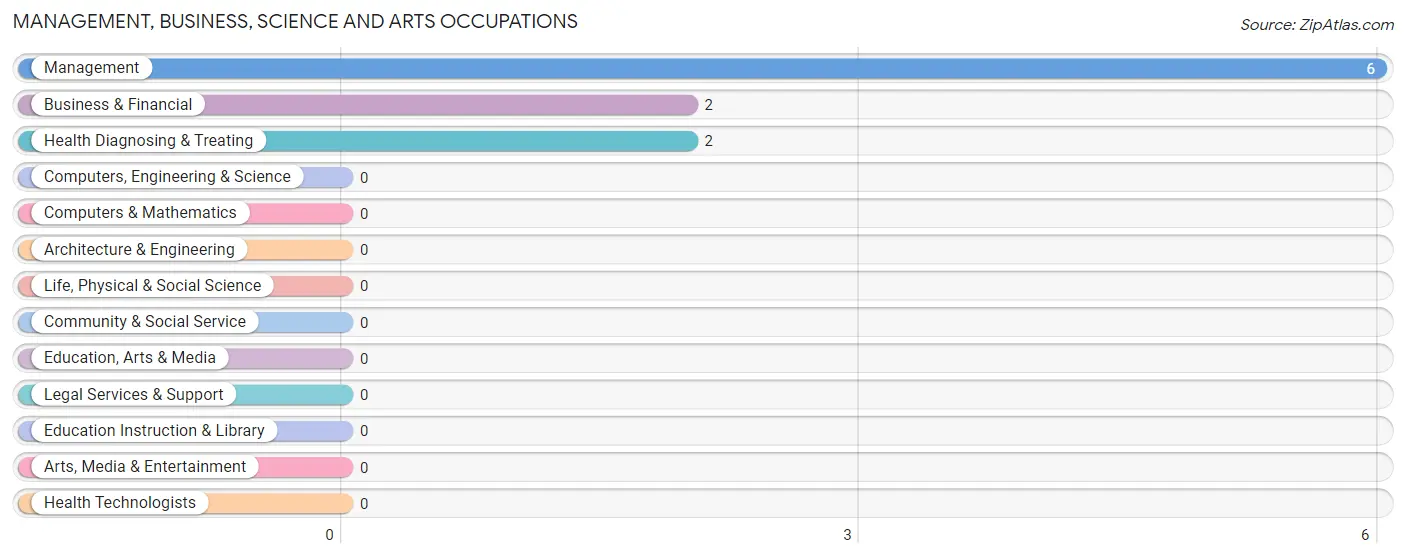
Management, Business, Science and Arts Occupations by Sex
| Occupation | Male | Female |
| Management | 6 (100.0%) | 0 (0.0%) |
| Business & Financial | 2 (100.0%) | 0 (0.0%) |
| Computers, Engineering & Science | 0 (0.0%) | 0 (0.0%) |
| Computers & Mathematics | 0 (0.0%) | 0 (0.0%) |
| Architecture & Engineering | 0 (0.0%) | 0 (0.0%) |
| Life, Physical & Social Science | 0 (0.0%) | 0 (0.0%) |
| Community & Social Service | 0 (0.0%) | 0 (0.0%) |
| Education, Arts & Media | 0 (0.0%) | 0 (0.0%) |
| Legal Services & Support | 0 (0.0%) | 0 (0.0%) |
| Education Instruction & Library | 0 (0.0%) | 0 (0.0%) |
| Arts, Media & Entertainment | 0 (0.0%) | 0 (0.0%) |
| Health Diagnosing & Treating | 0 (0.0%) | 2 (100.0%) |
| Health Technologists | 0 (0.0%) | 0 (0.0%) |
| Total (Category) | 8 (80.0%) | 2 (20.0%) |
| Total (Overall) | 33 (53.2%) | 29 (46.8%) |
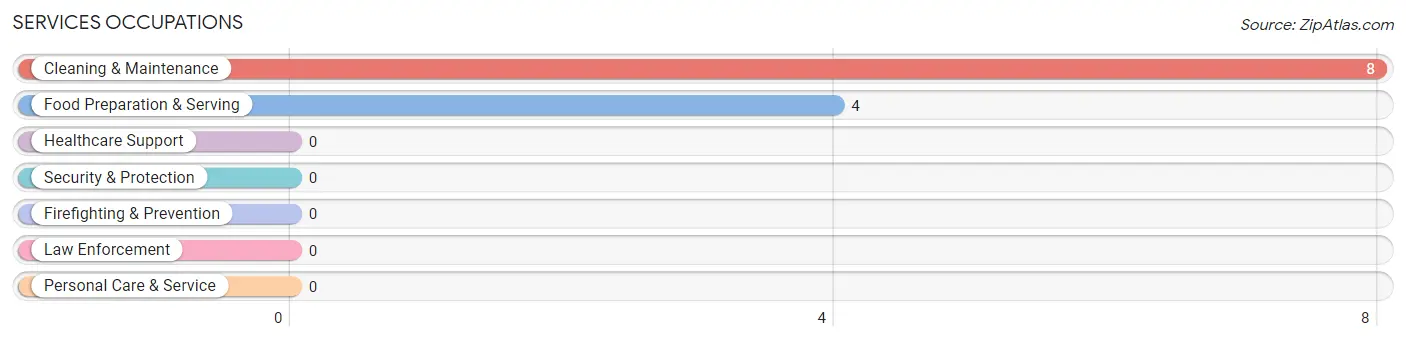
Services Occupations
The most common Services occupations in Whitehorse are Cleaning & Maintenance (8 | 12.9%), and Food Preparation & Serving (4 | 6.5%).
Services Occupations by Sex
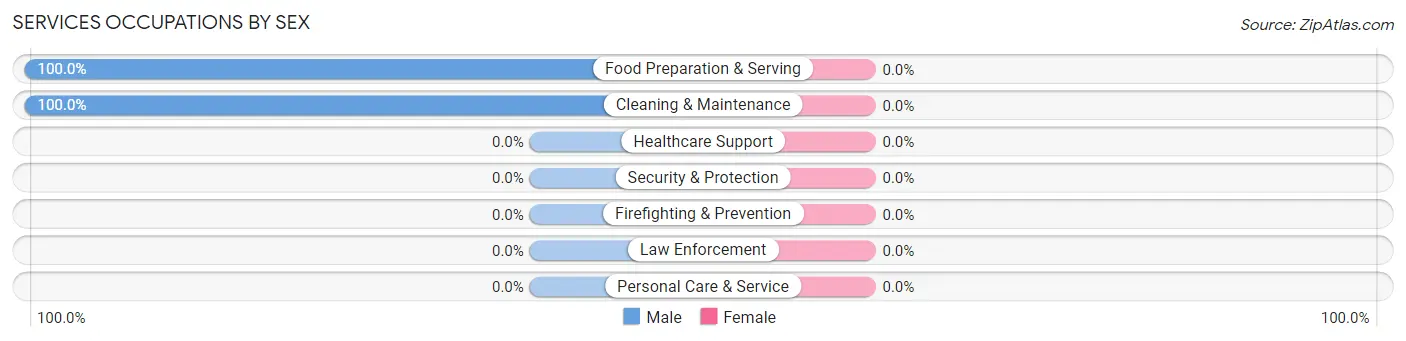
| Occupation | Male | Female |
| Healthcare Support | 0 (0.0%) | 0 (0.0%) |
| Security & Protection | 0 (0.0%) | 0 (0.0%) |
| Firefighting & Prevention | 0 (0.0%) | 0 (0.0%) |
| Law Enforcement | 0 (0.0%) | 0 (0.0%) |
| Food Preparation & Serving | 4 (100.0%) | 0 (0.0%) |
| Cleaning & Maintenance | 8 (100.0%) | 0 (0.0%) |
| Personal Care & Service | 0 (0.0%) | 0 (0.0%) |
| Total (Category) | 12 (100.0%) | 0 (0.0%) |
| Total (Overall) | 33 (53.2%) | 29 (46.8%) |
Sales and Office Occupations
The most common Sales and Office occupations in Whitehorse are , and Office & Administration (27 | 43.5%).
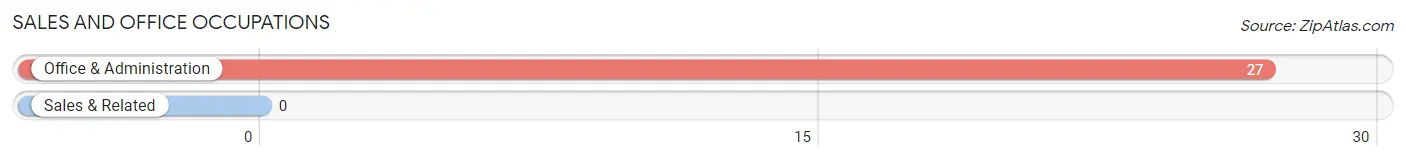
Sales and Office Occupations by Sex
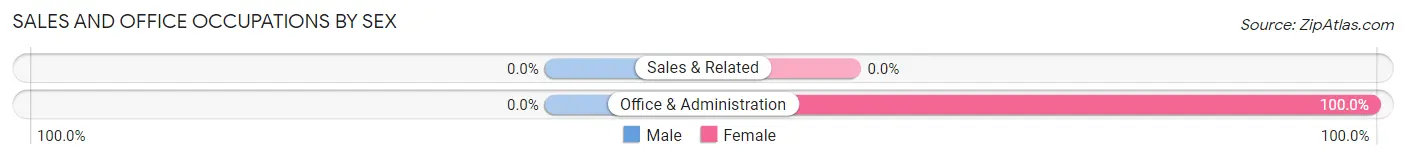
| Occupation | Male | Female |
| Sales & Related | 0 (0.0%) | 0 (0.0%) |
| Office & Administration | 0 (0.0%) | 27 (100.0%) |
| Total (Category) | 0 (0.0%) | 27 (100.0%) |
| Total (Overall) | 33 (53.2%) | 29 (46.8%) |
Natural Resources, Construction and Maintenance Occupations
The most common Natural Resources, Construction and Maintenance occupations in Whitehorse are Farming, Fishing & Forestry (7 | 11.3%), and Installation, Maintenance & Repair (3 | 4.8%).
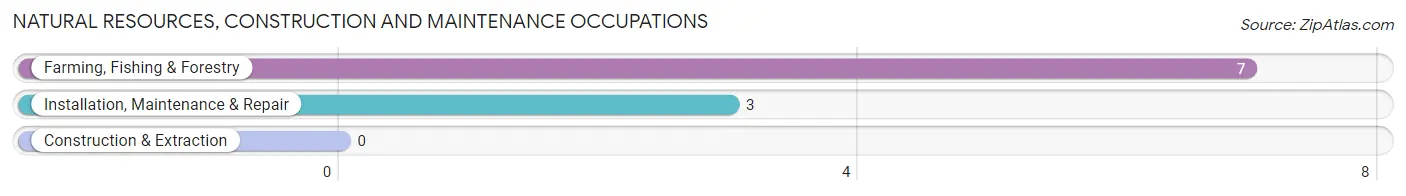
Natural Resources, Construction and Maintenance Occupations by Sex
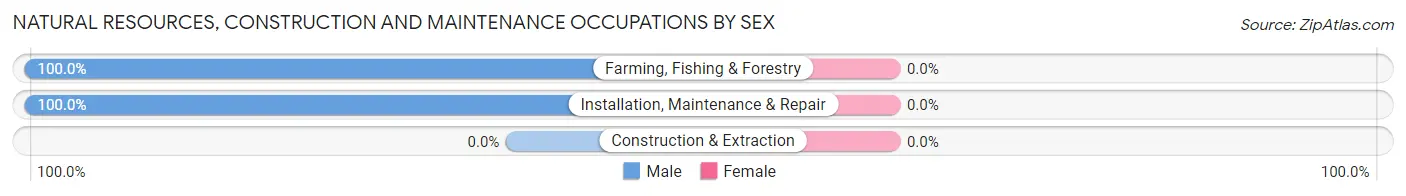
| Occupation | Male | Female |
| Farming, Fishing & Forestry | 7 (100.0%) | 0 (0.0%) |
| Construction & Extraction | 0 (0.0%) | 0 (0.0%) |
| Installation, Maintenance & Repair | 3 (100.0%) | 0 (0.0%) |
| Total (Category) | 10 (100.0%) | 0 (0.0%) |
| Total (Overall) | 33 (53.2%) | 29 (46.8%) |
Production, Transportation and Moving Occupations
The most common Production, Transportation and Moving occupations in Whitehorse are , and Transportation (3 | 4.8%).
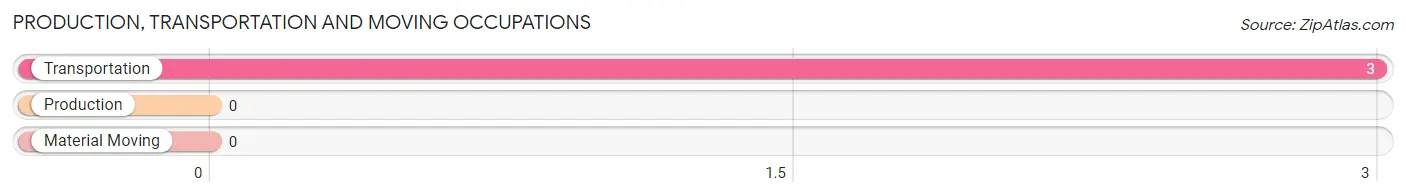
Production, Transportation and Moving Occupations by Sex
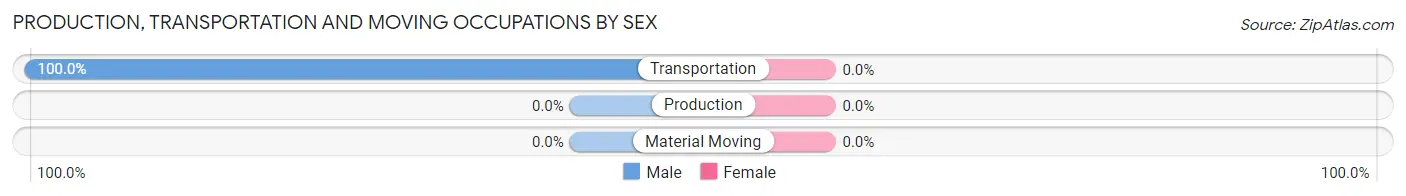
| Occupation | Male | Female |
| Production | 0 (0.0%) | 0 (0.0%) |
| Transportation | 3 (100.0%) | 0 (0.0%) |
| Material Moving | 0 (0.0%) | 0 (0.0%) |
| Total (Category) | 3 (100.0%) | 0 (0.0%) |
| Total (Overall) | 33 (53.2%) | 29 (46.8%) |
Employment Industries by Sex in Whitehorse
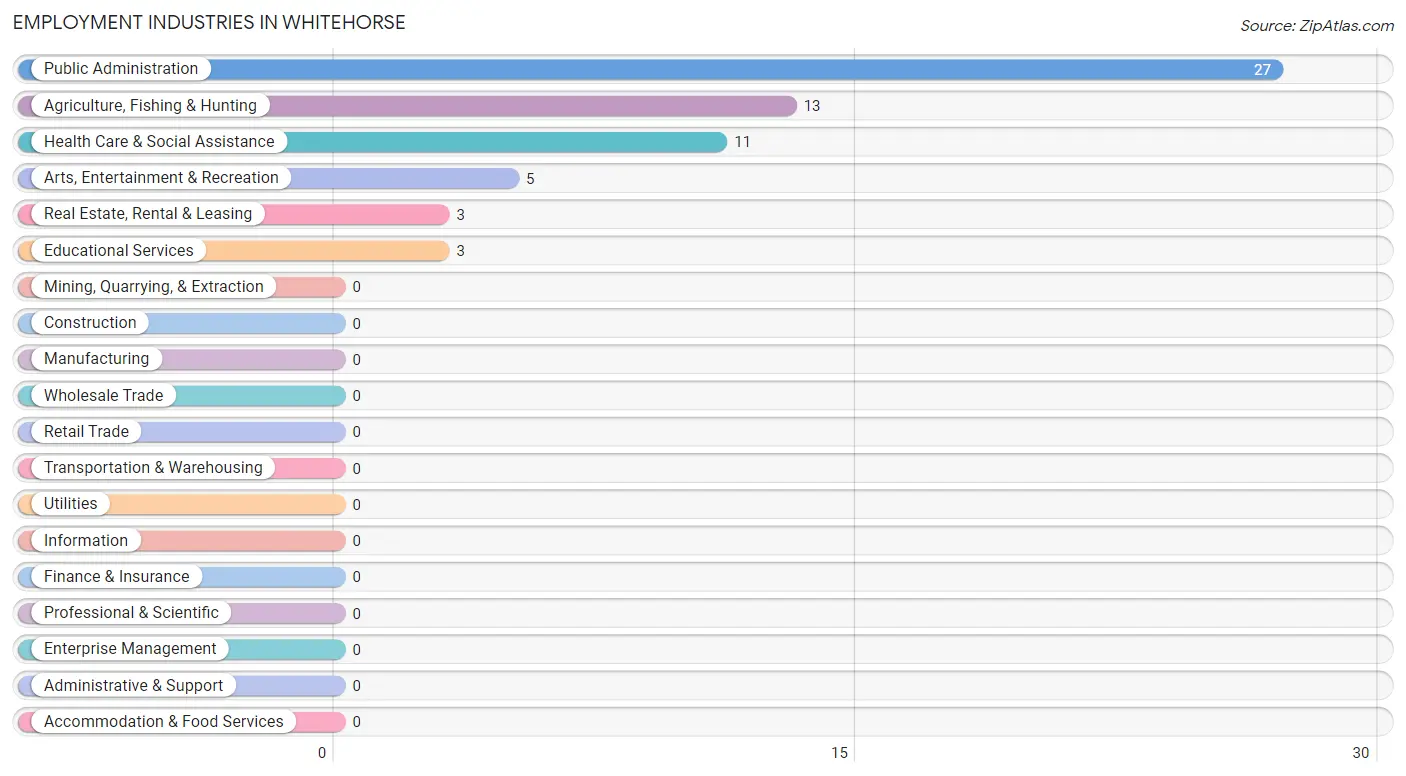
Employment Industries in Whitehorse
The major employment industries in Whitehorse include Public Administration (27 | 43.5%), Agriculture, Fishing & Hunting (13 | 21.0%), Health Care & Social Assistance (11 | 17.7%), Arts, Entertainment & Recreation (5 | 8.1%), and Real Estate, Rental & Leasing (3 | 4.8%).
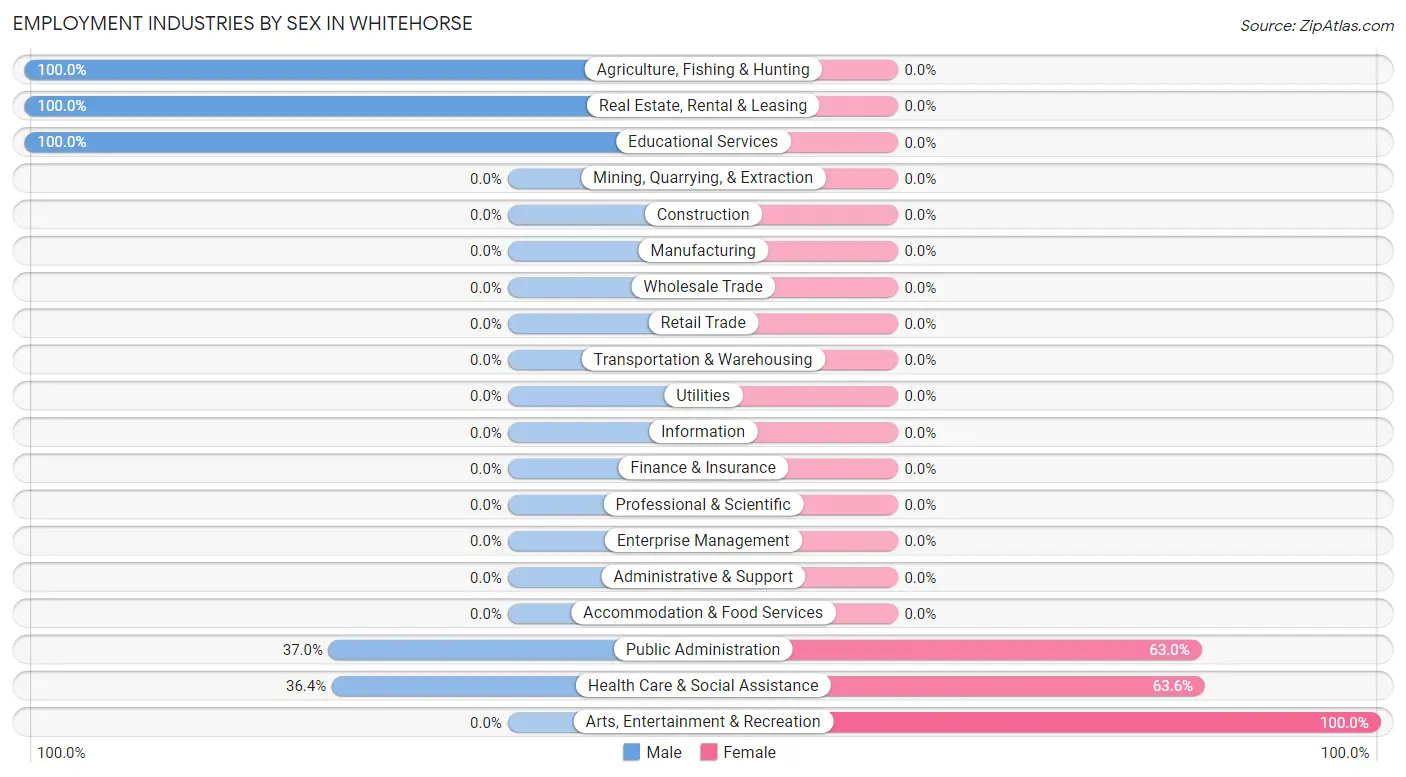
Employment Industries by Sex in Whitehorse
The Whitehorse industries that see more men than women are Agriculture, Fishing & Hunting (100.0%), Real Estate, Rental & Leasing (100.0%), and Educational Services (100.0%), whereas the industries that tend to have a higher number of women are Arts, Entertainment & Recreation (100.0%), Health Care & Social Assistance (63.6%), and Public Administration (63.0%).
| Industry | Male | Female |
| Agriculture, Fishing & Hunting | 13 (100.0%) | 0 (0.0%) |
| Mining, Quarrying, & Extraction | 0 (0.0%) | 0 (0.0%) |
| Construction | 0 (0.0%) | 0 (0.0%) |
| Manufacturing | 0 (0.0%) | 0 (0.0%) |
| Wholesale Trade | 0 (0.0%) | 0 (0.0%) |
| Retail Trade | 0 (0.0%) | 0 (0.0%) |
| Transportation & Warehousing | 0 (0.0%) | 0 (0.0%) |
| Utilities | 0 (0.0%) | 0 (0.0%) |
| Information | 0 (0.0%) | 0 (0.0%) |
| Finance & Insurance | 0 (0.0%) | 0 (0.0%) |
| Real Estate, Rental & Leasing | 3 (100.0%) | 0 (0.0%) |
| Professional & Scientific | 0 (0.0%) | 0 (0.0%) |
| Enterprise Management | 0 (0.0%) | 0 (0.0%) |
| Administrative & Support | 0 (0.0%) | 0 (0.0%) |
| Educational Services | 3 (100.0%) | 0 (0.0%) |
| Health Care & Social Assistance | 4 (36.4%) | 7 (63.6%) |
| Arts, Entertainment & Recreation | 0 (0.0%) | 5 (100.0%) |
| Accommodation & Food Services | 0 (0.0%) | 0 (0.0%) |
| Public Administration | 10 (37.0%) | 17 (63.0%) |
| Total | 33 (53.2%) | 29 (46.8%) |
Education in Whitehorse
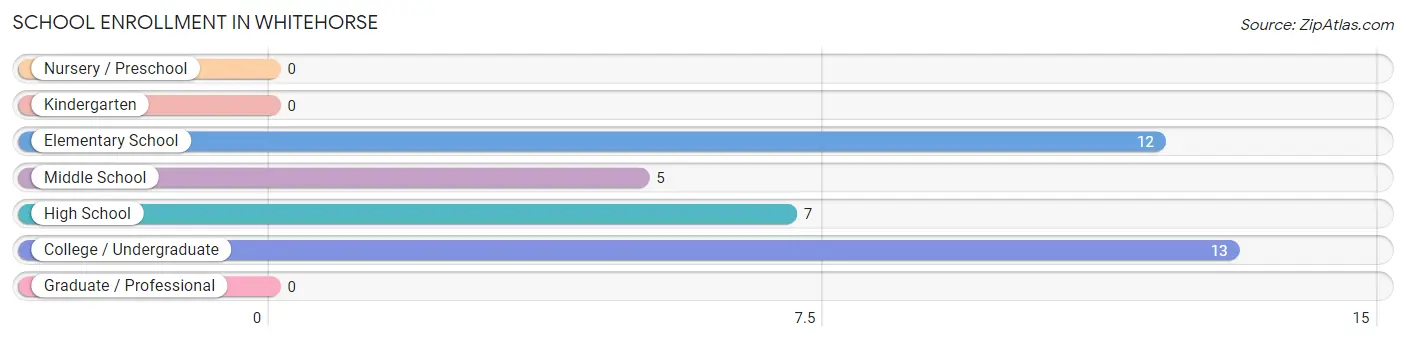
School Enrollment in Whitehorse
The most common levels of schooling among the 37 students in Whitehorse are college / undergraduate (13 | 35.1%), elementary school (12 | 32.4%), and high school (7 | 18.9%).
| School Level | # Students | % Students |
| Nursery / Preschool | 0 | 0.0% |
| Kindergarten | 0 | 0.0% |
| Elementary School | 12 | 32.4% |
| Middle School | 5 | 13.5% |
| High School | 7 | 18.9% |
| College / Undergraduate | 13 | 35.1% |
| Graduate / Professional | 0 | 0.0% |
| Total | 37 | 100.0% |
School Enrollment by Age by Funding Source in Whitehorse
Out of a total of 37 students who are enrolled in schools in Whitehorse, 13 (35.1%) attend a private institution, while the remaining 24 (64.9%) are enrolled in public schools. The age group of 35 years and over has the highest likelihood of being enrolled in private schools, with 13 (100.0% in the age bracket) enrolled. Conversely, the age group of 5 to 9 year old has the lowest likelihood of being enrolled in a private school, with 12 (100.0% in the age bracket) attending a public institution.
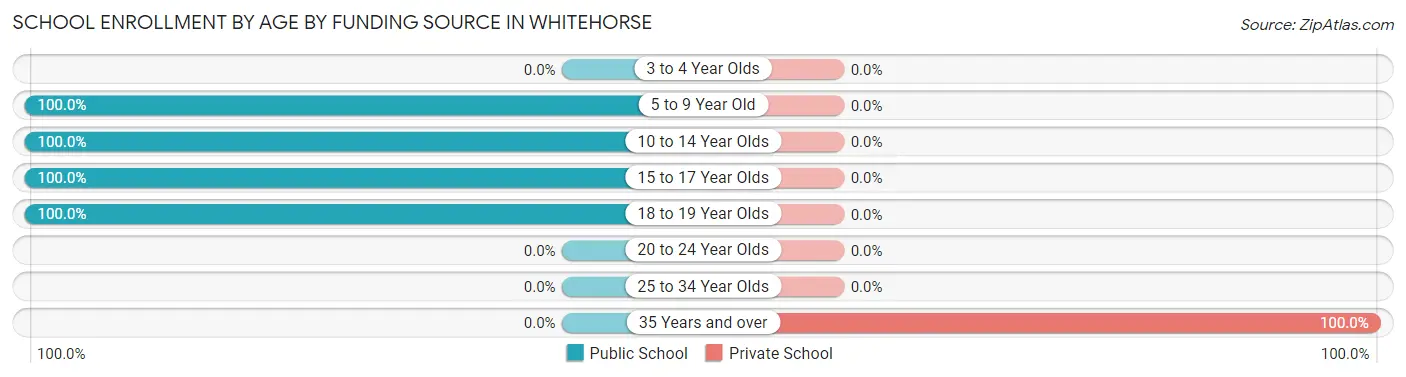
| Age Bracket | Public School | Private School |
| 3 to 4 Year Olds | 0 (0.0%) | 0 (0.0%) |
| 5 to 9 Year Old | 12 (100.0%) | 0 (0.0%) |
| 10 to 14 Year Olds | 5 (100.0%) | 0 (0.0%) |
| 15 to 17 Year Olds | 3 (100.0%) | 0 (0.0%) |
| 18 to 19 Year Olds | 4 (100.0%) | 0 (0.0%) |
| 20 to 24 Year Olds | 0 (0.0%) | 0 (0.0%) |
| 25 to 34 Year Olds | 0 (0.0%) | 0 (0.0%) |
| 35 Years and over | 0 (0.0%) | 13 (100.0%) |
| Total | 24 (64.9%) | 13 (35.1%) |
Educational Attainment by Field of Study in Whitehorse
| Field of Study | # Graduates | % Graduates |
| Computers & Mathematics | 0 | 0.0% |
| Bio, Nature & Agricultural | 0 | 0.0% |
| Physical & Health Sciences | 0 | 0.0% |
| Psychology | 0 | 0.0% |
| Social Sciences | 0 | 0.0% |
| Engineering | 0 | 0.0% |
| Multidisciplinary Studies | 0 | 0.0% |
| Science & Technology | 0 | 0.0% |
| Business | 0 | 0.0% |
| Education | 0 | 0.0% |
| Literature & Languages | 0 | 0.0% |
| Liberal Arts & History | 0 | 0.0% |
| Visual & Performing Arts | 0 | 0.0% |
| Communications | 0 | 0.0% |
| Arts & Humanities | 0 | 0.0% |
| Total | 0 | 0.0% |
Transportation & Commute in Whitehorse
Vehicle Availability by Sex in Whitehorse
The most prevalent vehicle ownership categories in Whitehorse are males with 1 vehicle (22, accounting for 66.7%) and females with 1 vehicle (18, making up 75.9%).
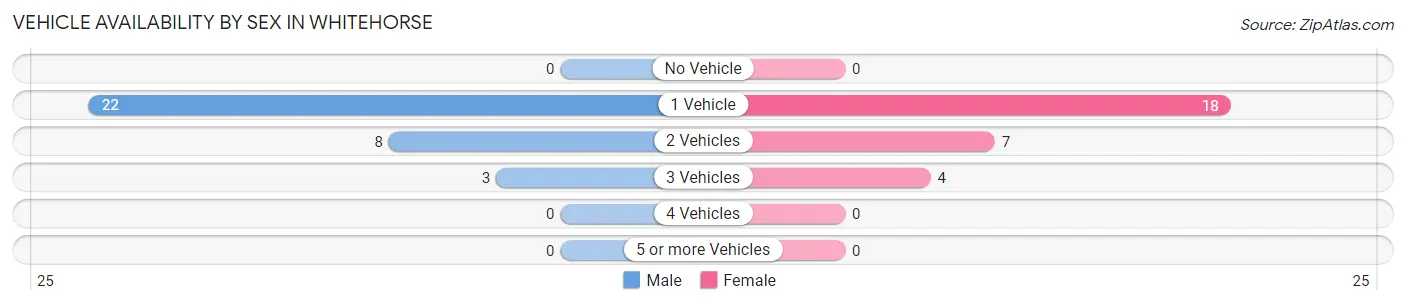
| Vehicles Available | Male | Female |
| No Vehicle | 0 (0.0%) | 0 (0.0%) |
| 1 Vehicle | 22 (66.7%) | 18 (62.1%) |
| 2 Vehicles | 8 (24.2%) | 7 (24.1%) |
| 3 Vehicles | 3 (9.1%) | 4 (13.8%) |
| 4 Vehicles | 0 (0.0%) | 0 (0.0%) |
| 5 or more Vehicles | 0 (0.0%) | 0 (0.0%) |
| Total | 33 (100.0%) | 29 (100.0%) |
Commute Time in Whitehorse
The most frequently occuring commute durations in Whitehorse are 45 to 59 minutes (21 commuters, 33.9%), 40 to 44 minutes (13 commuters, 21.0%), and 5 to 9 minutes (7 commuters, 11.3%).
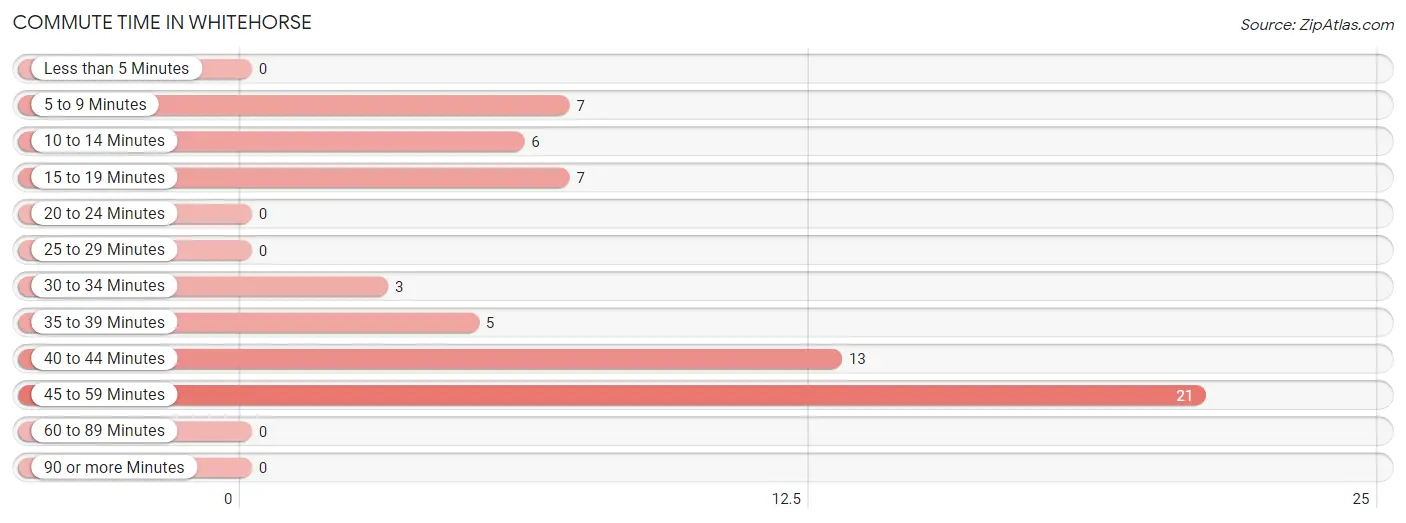
| Commute Time | # Commuters | % Commuters |
| Less than 5 Minutes | 0 | 0.0% |
| 5 to 9 Minutes | 7 | 11.3% |
| 10 to 14 Minutes | 6 | 9.7% |
| 15 to 19 Minutes | 7 | 11.3% |
| 20 to 24 Minutes | 0 | 0.0% |
| 25 to 29 Minutes | 0 | 0.0% |
| 30 to 34 Minutes | 3 | 4.8% |
| 35 to 39 Minutes | 5 | 8.1% |
| 40 to 44 Minutes | 13 | 21.0% |
| 45 to 59 Minutes | 21 | 33.9% |
| 60 to 89 Minutes | 0 | 0.0% |
| 90 or more Minutes | 0 | 0.0% |
Commute Time by Sex in Whitehorse
The most common commute times in Whitehorse are 40 to 44 minutes (8 commuters, 24.2%) for males and 45 to 59 minutes (19 commuters, 65.5%) for females.
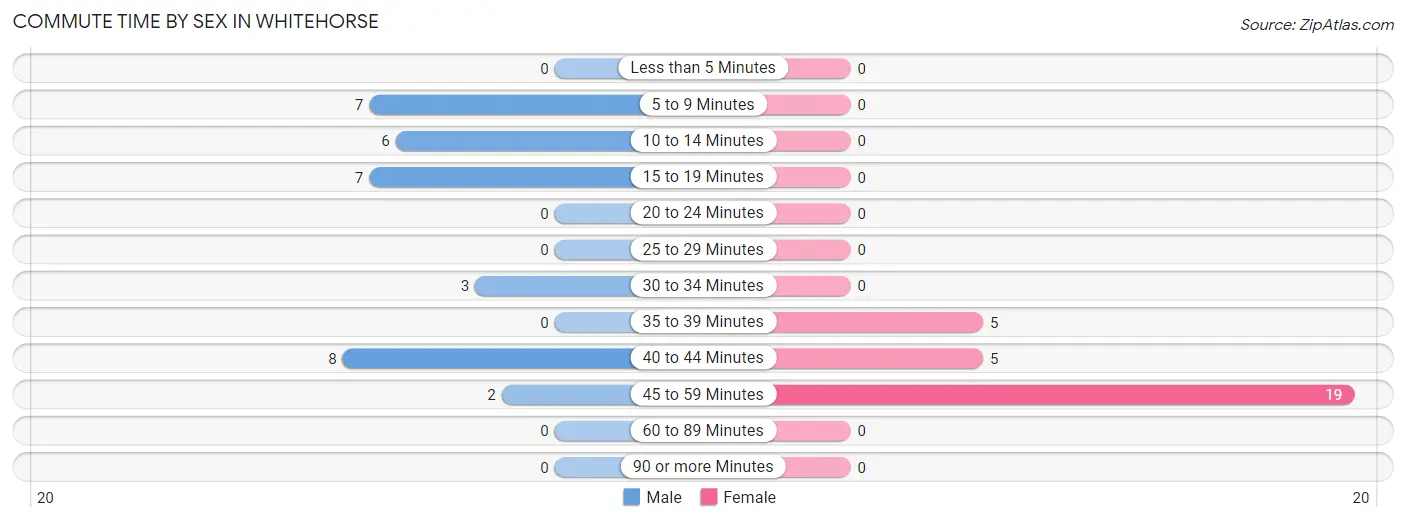
| Commute Time | Male | Female |
| Less than 5 Minutes | 0 (0.0%) | 0 (0.0%) |
| 5 to 9 Minutes | 7 (21.2%) | 0 (0.0%) |
| 10 to 14 Minutes | 6 (18.2%) | 0 (0.0%) |
| 15 to 19 Minutes | 7 (21.2%) | 0 (0.0%) |
| 20 to 24 Minutes | 0 (0.0%) | 0 (0.0%) |
| 25 to 29 Minutes | 0 (0.0%) | 0 (0.0%) |
| 30 to 34 Minutes | 3 (9.1%) | 0 (0.0%) |
| 35 to 39 Minutes | 0 (0.0%) | 5 (17.2%) |
| 40 to 44 Minutes | 8 (24.2%) | 5 (17.2%) |
| 45 to 59 Minutes | 2 (6.1%) | 19 (65.5%) |
| 60 to 89 Minutes | 0 (0.0%) | 0 (0.0%) |
| 90 or more Minutes | 0 (0.0%) | 0 (0.0%) |
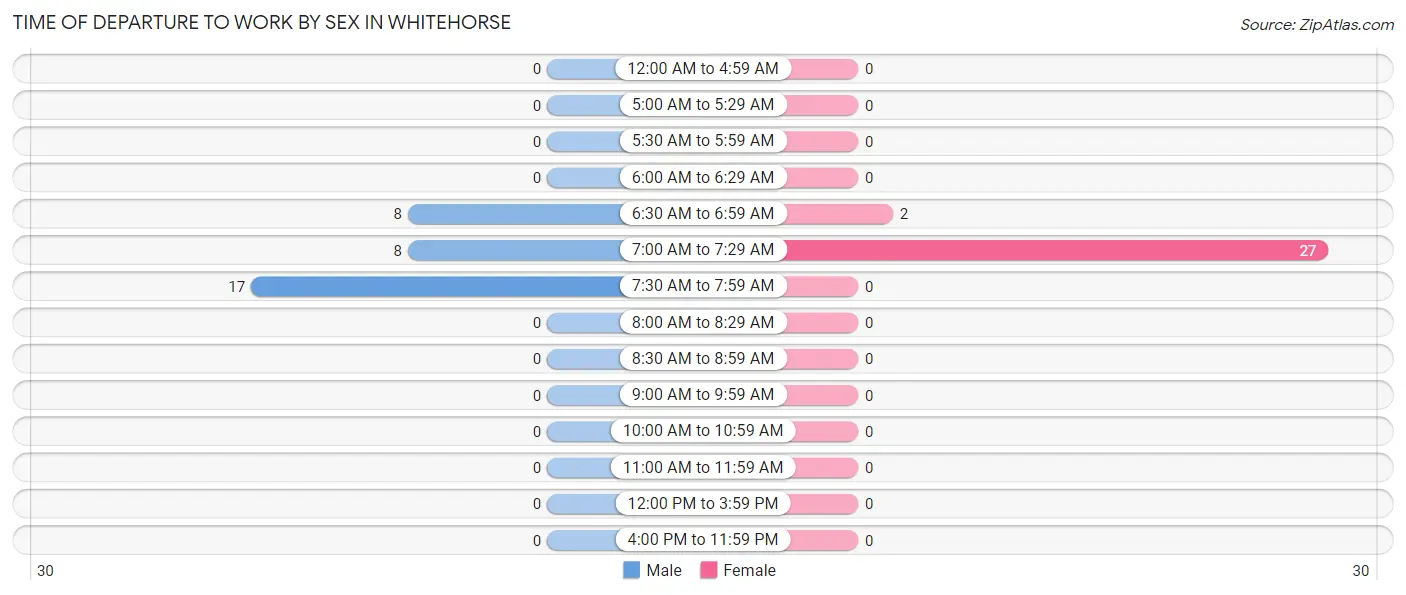
Time of Departure to Work by Sex in Whitehorse
The most frequent times of departure to work in Whitehorse are 7:30 AM to 7:59 AM (17, 51.5%) for males and 7:00 AM to 7:29 AM (27, 93.1%) for females.
| Time of Departure | Male | Female |
| 12:00 AM to 4:59 AM | 0 (0.0%) | 0 (0.0%) |
| 5:00 AM to 5:29 AM | 0 (0.0%) | 0 (0.0%) |
| 5:30 AM to 5:59 AM | 0 (0.0%) | 0 (0.0%) |
| 6:00 AM to 6:29 AM | 0 (0.0%) | 0 (0.0%) |
| 6:30 AM to 6:59 AM | 8 (24.2%) | 2 (6.9%) |
| 7:00 AM to 7:29 AM | 8 (24.2%) | 27 (93.1%) |
| 7:30 AM to 7:59 AM | 17 (51.5%) | 0 (0.0%) |
| 8:00 AM to 8:29 AM | 0 (0.0%) | 0 (0.0%) |
| 8:30 AM to 8:59 AM | 0 (0.0%) | 0 (0.0%) |
| 9:00 AM to 9:59 AM | 0 (0.0%) | 0 (0.0%) |
| 10:00 AM to 10:59 AM | 0 (0.0%) | 0 (0.0%) |
| 11:00 AM to 11:59 AM | 0 (0.0%) | 0 (0.0%) |
| 12:00 PM to 3:59 PM | 0 (0.0%) | 0 (0.0%) |
| 4:00 PM to 11:59 PM | 0 (0.0%) | 0 (0.0%) |
| Total | 33 (100.0%) | 29 (100.0%) |
Housing Occupancy in Whitehorse
Occupancy by Ownership in Whitehorse
Of the total 36 dwellings in Whitehorse, owner-occupied units account for 7 (19.4%), while renter-occupied units make up 29 (80.6%).
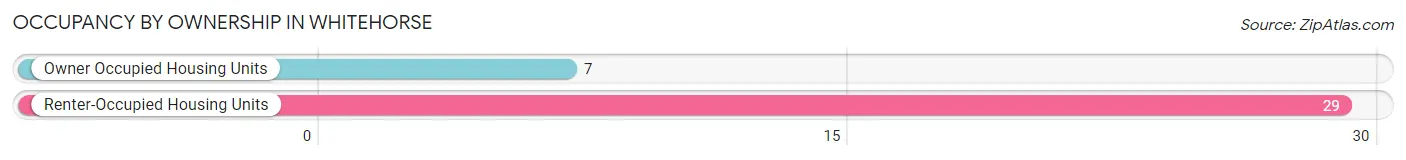
| Occupancy | # Housing Units | % Housing Units |
| Owner Occupied Housing Units | 7 | 19.4% |
| Renter-Occupied Housing Units | 29 | 80.6% |
| Total Occupied Housing Units | 36 | 100.0% |
Occupancy by Household Size in Whitehorse
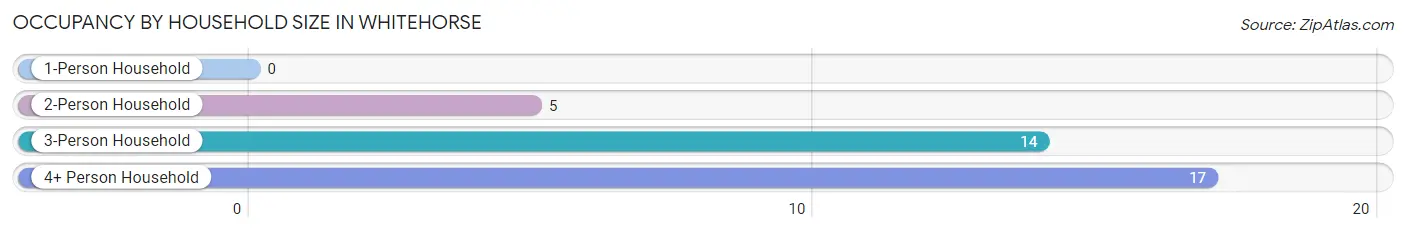
| Household Size | # Housing Units | % Housing Units |
| 1-Person Household | 0 | 0.0% |
| 2-Person Household | 5 | 13.9% |
| 3-Person Household | 14 | 38.9% |
| 4+ Person Household | 17 | 47.2% |
| Total Housing Units | 36 | 100.0% |
Occupancy by Ownership by Household Size in Whitehorse
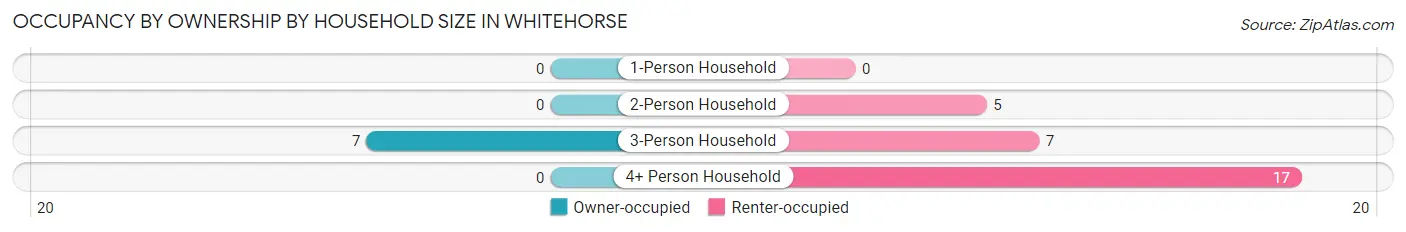
| Household Size | Owner-occupied | Renter-occupied |
| 1-Person Household | 0 (0.0%) | 0 (0.0%) |
| 2-Person Household | 0 (0.0%) | 5 (100.0%) |
| 3-Person Household | 7 (50.0%) | 7 (50.0%) |
| 4+ Person Household | 0 (0.0%) | 17 (100.0%) |
| Total Housing Units | 7 (19.4%) | 29 (80.6%) |
Occupancy by Educational Attainment in Whitehorse
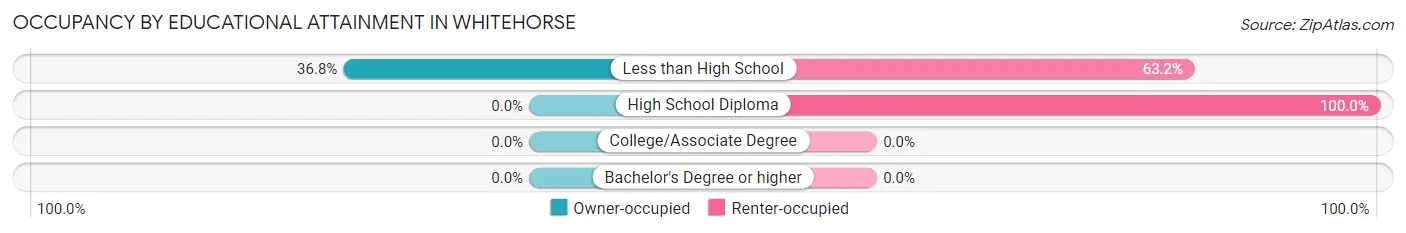
| Household Size | Owner-occupied | Renter-occupied |
| Less than High School | 7 (36.8%) | 12 (63.2%) |
| High School Diploma | 0 (0.0%) | 17 (100.0%) |
| College/Associate Degree | 0 (0.0%) | 0 (0.0%) |
| Bachelor's Degree or higher | 0 (0.0%) | 0 (0.0%) |
Occupancy by Age of Householder in Whitehorse
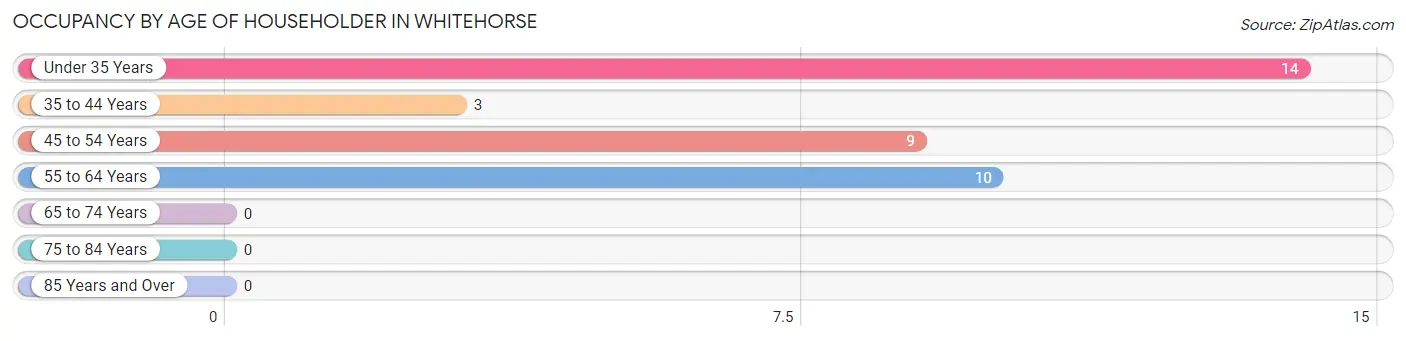
| Age Bracket | # Households | % Households |
| Under 35 Years | 14 | 38.9% |
| 35 to 44 Years | 3 | 8.3% |
| 45 to 54 Years | 9 | 25.0% |
| 55 to 64 Years | 10 | 27.8% |
| 65 to 74 Years | 0 | 0.0% |
| 75 to 84 Years | 0 | 0.0% |
| 85 Years and Over | 0 | 0.0% |
| Total | 36 | 100.0% |
Housing Finances in Whitehorse
Median Income by Occupancy in Whitehorse
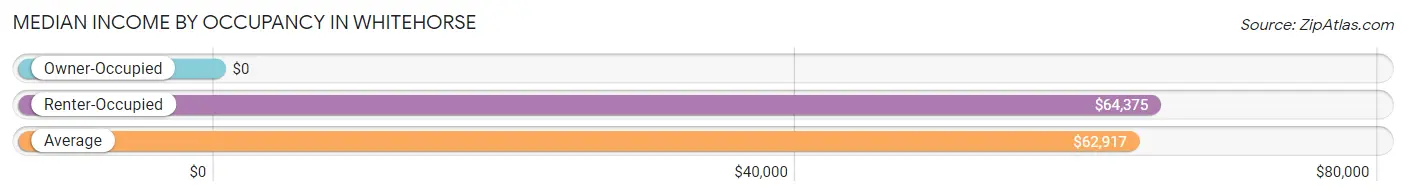
| Occupancy Type | # Households | Median Income |
| Owner-Occupied | 7 (19.4%) | $0 |
| Renter-Occupied | 29 (80.6%) | $64,375 |
| Average | 36 (100.0%) | $62,917 |
Occupancy by Householder Income Bracket in Whitehorse
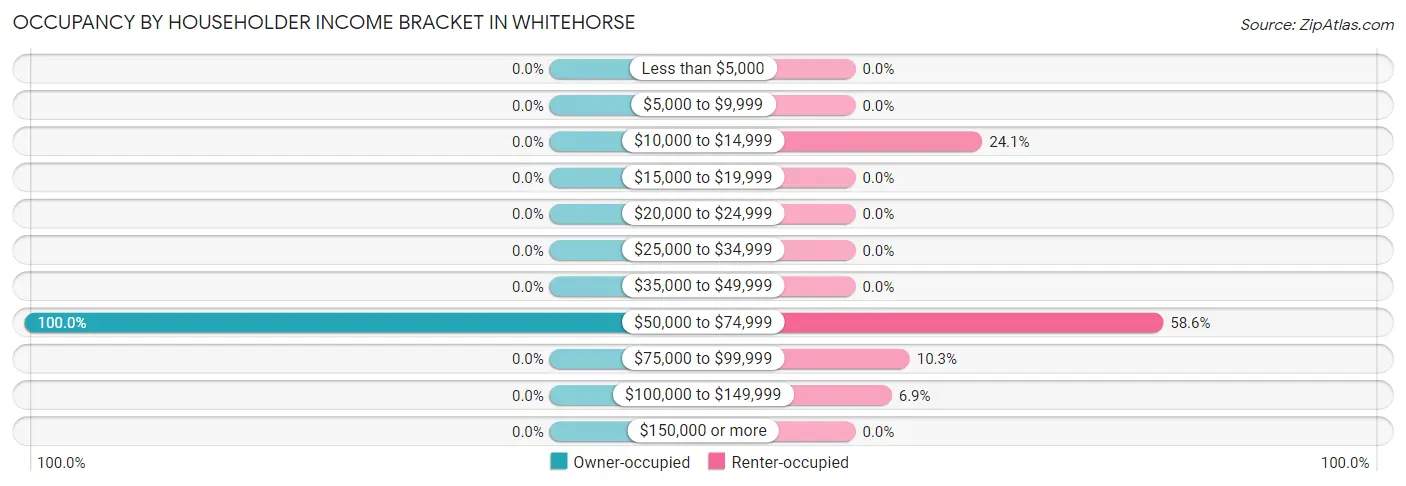
| Income Bracket | Owner-occupied | Renter-occupied |
| Less than $5,000 | 0 (0.0%) | 0 (0.0%) |
| $5,000 to $9,999 | 0 (0.0%) | 0 (0.0%) |
| $10,000 to $14,999 | 0 (0.0%) | 7 (24.1%) |
| $15,000 to $19,999 | 0 (0.0%) | 0 (0.0%) |
| $20,000 to $24,999 | 0 (0.0%) | 0 (0.0%) |
| $25,000 to $34,999 | 0 (0.0%) | 0 (0.0%) |
| $35,000 to $49,999 | 0 (0.0%) | 0 (0.0%) |
| $50,000 to $74,999 | 7 (100.0%) | 17 (58.6%) |
| $75,000 to $99,999 | 0 (0.0%) | 3 (10.3%) |
| $100,000 to $149,999 | 0 (0.0%) | 2 (6.9%) |
| $150,000 or more | 0 (0.0%) | 0 (0.0%) |
| Total | 7 (100.0%) | 29 (100.0%) |
Monthly Housing Cost Tiers in Whitehorse
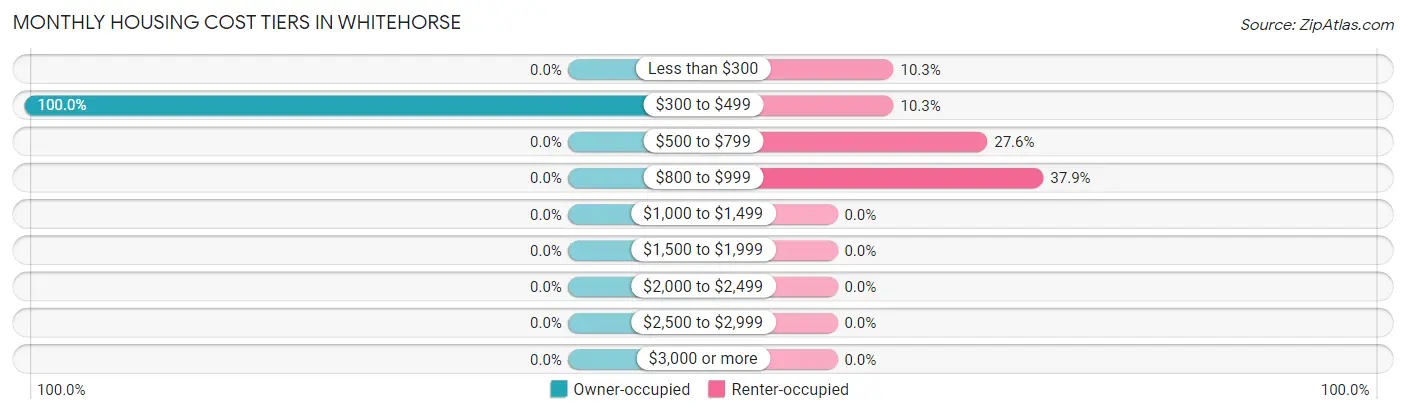
| Monthly Cost | Owner-occupied | Renter-occupied |
| Less than $300 | 0 (0.0%) | 3 (10.3%) |
| $300 to $499 | 7 (100.0%) | 3 (10.3%) |
| $500 to $799 | 0 (0.0%) | 8 (27.6%) |
| $800 to $999 | 0 (0.0%) | 11 (37.9%) |
| $1,000 to $1,499 | 0 (0.0%) | 0 (0.0%) |
| $1,500 to $1,999 | 0 (0.0%) | 0 (0.0%) |
| $2,000 to $2,499 | 0 (0.0%) | 0 (0.0%) |
| $2,500 to $2,999 | 0 (0.0%) | 0 (0.0%) |
| $3,000 or more | 0 (0.0%) | 0 (0.0%) |
| Total | 7 (100.0%) | 29 (100.0%) |
Physical Housing Characteristics in Whitehorse
Housing Structures in Whitehorse
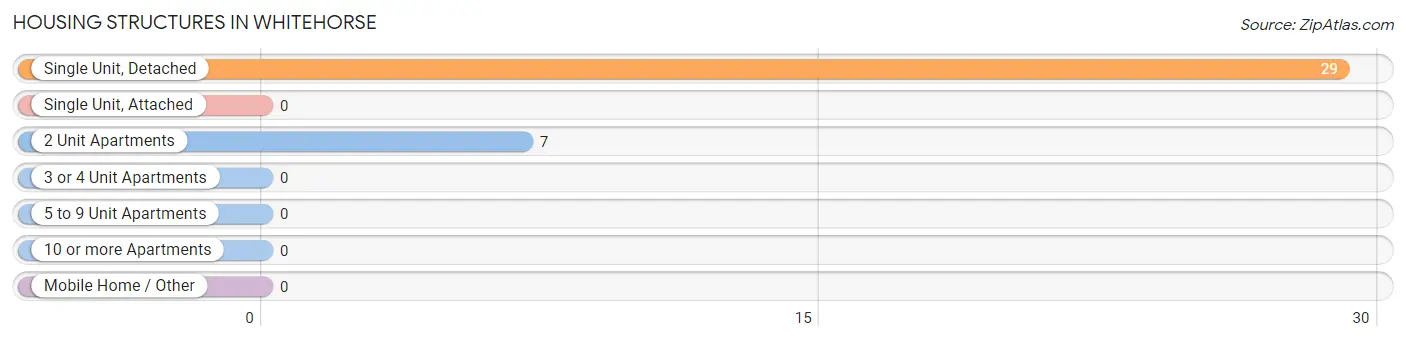
| Structure Type | # Housing Units | % Housing Units |
| Single Unit, Detached | 29 | 80.6% |
| Single Unit, Attached | 0 | 0.0% |
| 2 Unit Apartments | 7 | 19.4% |
| 3 or 4 Unit Apartments | 0 | 0.0% |
| 5 to 9 Unit Apartments | 0 | 0.0% |
| 10 or more Apartments | 0 | 0.0% |
| Mobile Home / Other | 0 | 0.0% |
| Total | 36 | 100.0% |
Housing Structures by Occupancy in Whitehorse
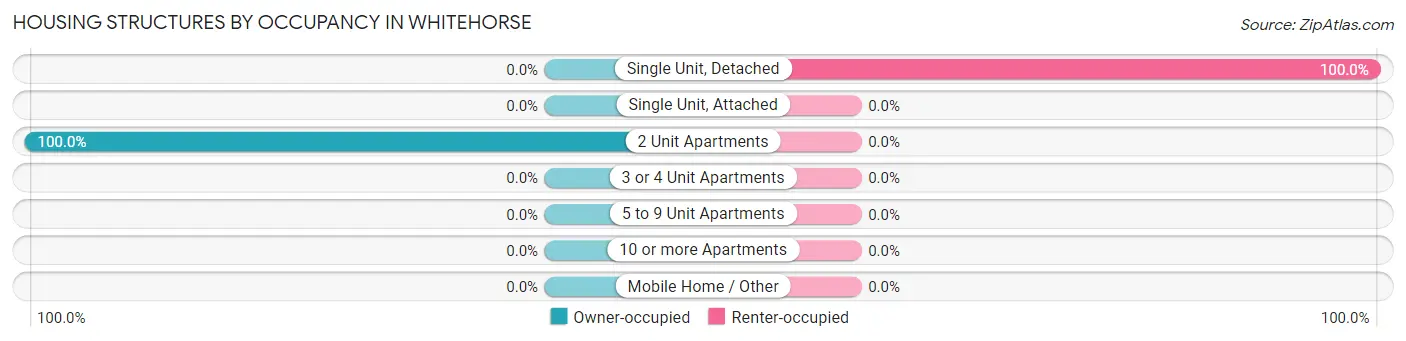
| Structure Type | Owner-occupied | Renter-occupied |
| Single Unit, Detached | 0 (0.0%) | 29 (100.0%) |
| Single Unit, Attached | 0 (0.0%) | 0 (0.0%) |
| 2 Unit Apartments | 7 (100.0%) | 0 (0.0%) |
| 3 or 4 Unit Apartments | 0 (0.0%) | 0 (0.0%) |
| 5 to 9 Unit Apartments | 0 (0.0%) | 0 (0.0%) |
| 10 or more Apartments | 0 (0.0%) | 0 (0.0%) |
| Mobile Home / Other | 0 (0.0%) | 0 (0.0%) |
| Total | 7 (19.4%) | 29 (80.6%) |
Housing Structures by Number of Rooms in Whitehorse
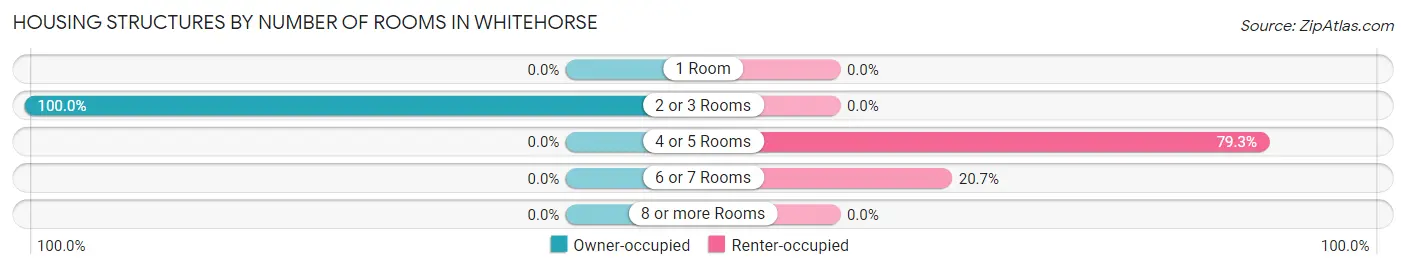
| Number of Rooms | Owner-occupied | Renter-occupied |
| 1 Room | 0 (0.0%) | 0 (0.0%) |
| 2 or 3 Rooms | 7 (100.0%) | 0 (0.0%) |
| 4 or 5 Rooms | 0 (0.0%) | 23 (79.3%) |
| 6 or 7 Rooms | 0 (0.0%) | 6 (20.7%) |
| 8 or more Rooms | 0 (0.0%) | 0 (0.0%) |
| Total | 7 (100.0%) | 29 (100.0%) |
Housing Structure by Heating Type in Whitehorse
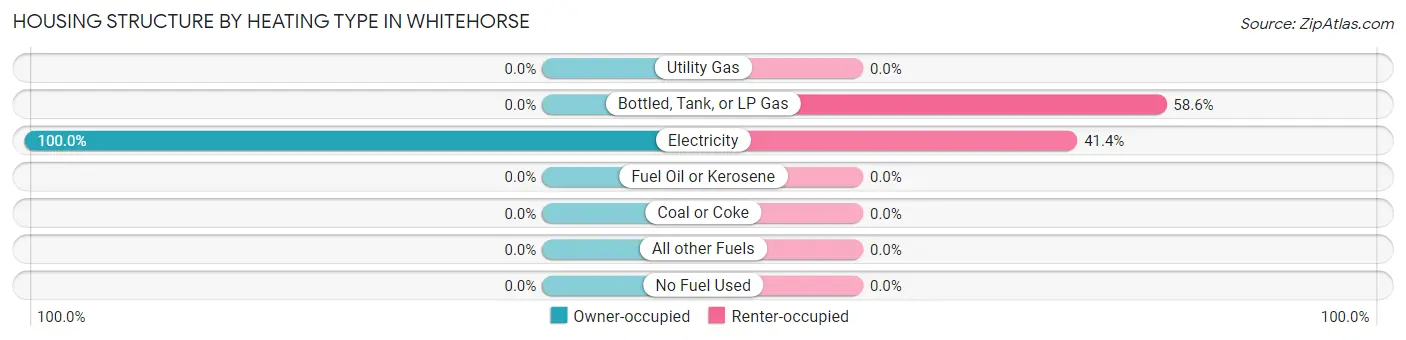
| Heating Type | Owner-occupied | Renter-occupied |
| Utility Gas | 0 (0.0%) | 0 (0.0%) |
| Bottled, Tank, or LP Gas | 0 (0.0%) | 17 (58.6%) |
| Electricity | 7 (100.0%) | 12 (41.4%) |
| Fuel Oil or Kerosene | 0 (0.0%) | 0 (0.0%) |
| Coal or Coke | 0 (0.0%) | 0 (0.0%) |
| All other Fuels | 0 (0.0%) | 0 (0.0%) |
| No Fuel Used | 0 (0.0%) | 0 (0.0%) |
| Total | 7 (100.0%) | 29 (100.0%) |
Household Vehicle Usage in Whitehorse
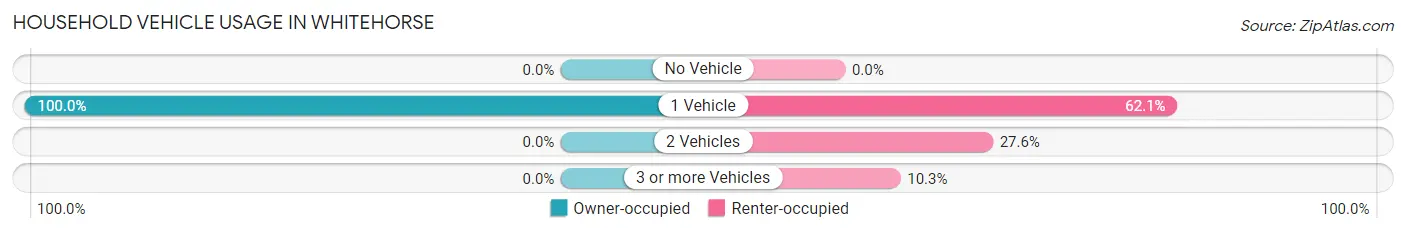
| Vehicles per Household | Owner-occupied | Renter-occupied |
| No Vehicle | 0 (0.0%) | 0 (0.0%) |
| 1 Vehicle | 7 (100.0%) | 18 (62.1%) |
| 2 Vehicles | 0 (0.0%) | 8 (27.6%) |
| 3 or more Vehicles | 0 (0.0%) | 3 (10.3%) |
| Total | 7 (100.0%) | 29 (100.0%) |
Real Estate & Mortgages in Whitehorse
Real Estate and Mortgage Overview in Whitehorse
| Characteristic | Without Mortgage | With Mortgage |
| Housing Units | 7 | 0 |
| Median Property Value | - | - |
| Median Household Income | - | - |
| Monthly Housing Costs | - | - |
| Real Estate Taxes | - | - |
Property Value by Mortgage Status in Whitehorse
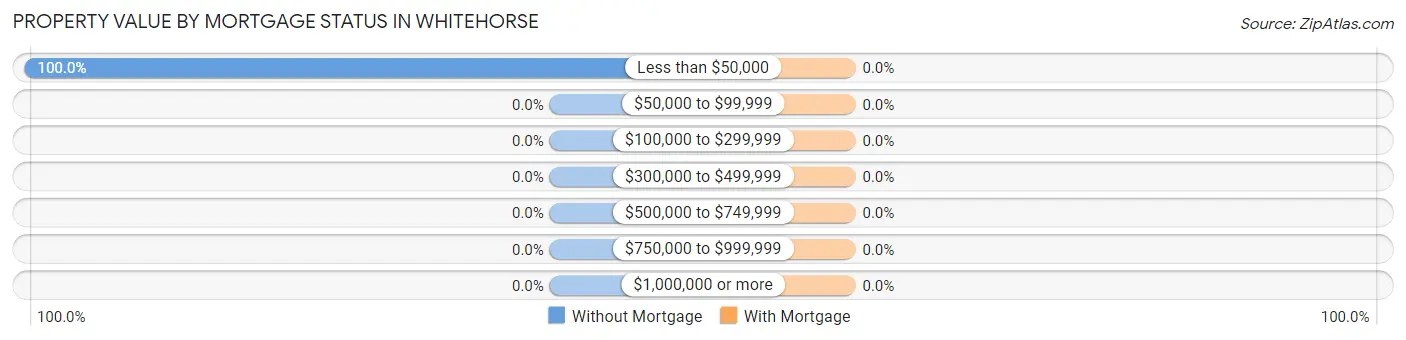
| Property Value | Without Mortgage | With Mortgage |
| Less than $50,000 | 7 (100.0%) | 0 (0.0%) |
| $50,000 to $99,999 | 0 (0.0%) | 0 (0.0%) |
| $100,000 to $299,999 | 0 (0.0%) | 0 (0.0%) |
| $300,000 to $499,999 | 0 (0.0%) | 0 (0.0%) |
| $500,000 to $749,999 | 0 (0.0%) | 0 (0.0%) |
| $750,000 to $999,999 | 0 (0.0%) | 0 (0.0%) |
| $1,000,000 or more | 0 (0.0%) | 0 (0.0%) |
| Total | 7 (100.0%) | 0 (0.0%) |
Household Income by Mortgage Status in Whitehorse
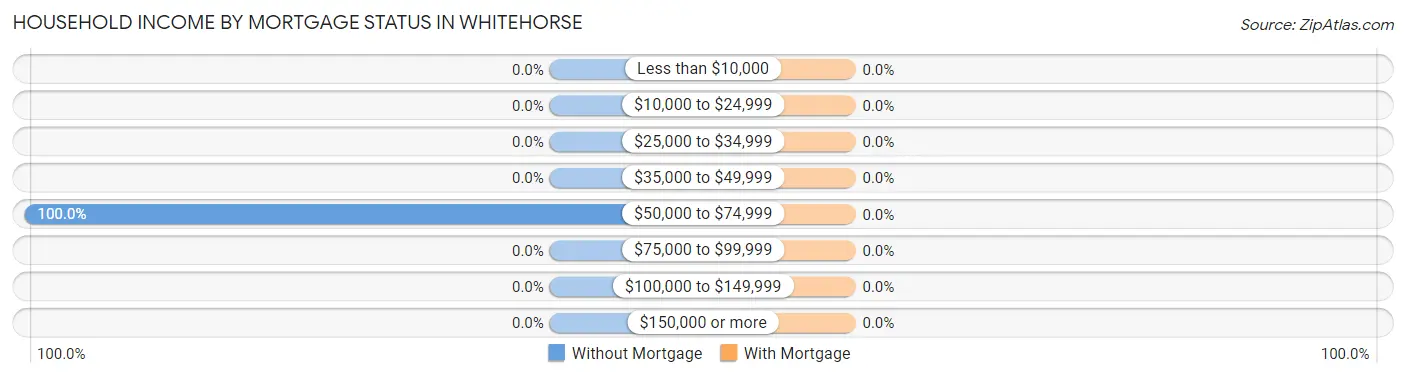
| Household Income | Without Mortgage | With Mortgage |
| Less than $10,000 | 0 (0.0%) | 0 (0.0%) |
| $10,000 to $24,999 | 0 (0.0%) | 0 (0.0%) |
| $25,000 to $34,999 | 0 (0.0%) | 0 (0.0%) |
| $35,000 to $49,999 | 0 (0.0%) | 0 (0.0%) |
| $50,000 to $74,999 | 7 (100.0%) | 0 (0.0%) |
| $75,000 to $99,999 | 0 (0.0%) | 0 (0.0%) |
| $100,000 to $149,999 | 0 (0.0%) | 0 (0.0%) |
| $150,000 or more | 0 (0.0%) | 0 (0.0%) |
| Total | 7 (100.0%) | 0 (0.0%) |
Property Value to Household Income Ratio in Whitehorse
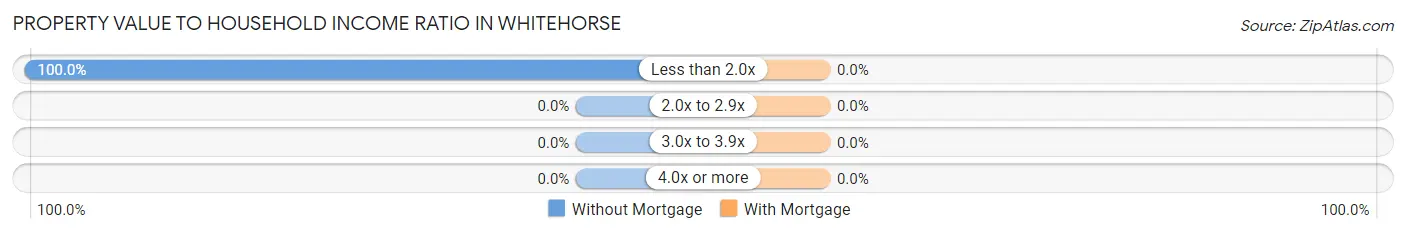
| Value-to-Income Ratio | Without Mortgage | With Mortgage |
| Less than 2.0x | 7 (100.0%) | 0 (0.0%) |
| 2.0x to 2.9x | 0 (0.0%) | 0 (0.0%) |
| 3.0x to 3.9x | 0 (0.0%) | 0 (0.0%) |
| 4.0x or more | 0 (0.0%) | 0 (0.0%) |
| Total | 7 (100.0%) | 0 (0.0%) |
Real Estate Taxes by Mortgage Status in Whitehorse
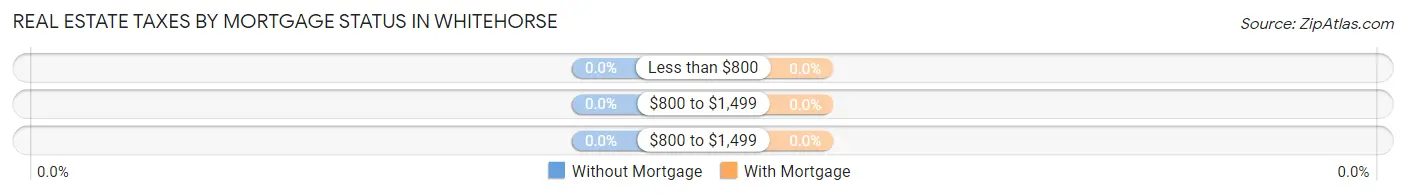
| Property Taxes | Without Mortgage | With Mortgage |
| Less than $800 | 0 (0.0%) | 0 (0.0%) |
| $800 to $1,499 | 0 (0.0%) | 0 (0.0%) |
| $800 to $1,499 | 0 (0.0%) | 0 (0.0%) |
| Total | 7 (100.0%) | 0 (0.0%) |
Health & Disability in Whitehorse
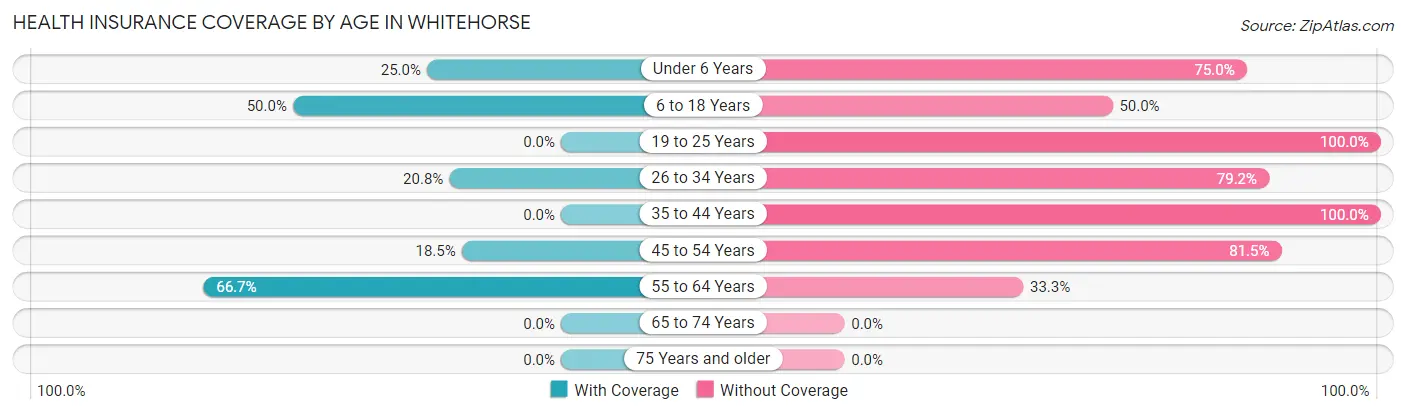
Health Insurance Coverage by Age in Whitehorse
| Age Bracket | With Coverage | Without Coverage |
| Under 6 Years | 7 (25.0%) | 21 (75.0%) |
| 6 to 18 Years | 12 (50.0%) | 12 (50.0%) |
| 19 to 25 Years | 0 (0.0%) | 23 (100.0%) |
| 26 to 34 Years | 5 (20.8%) | 19 (79.2%) |
| 35 to 44 Years | 0 (0.0%) | 3 (100.0%) |
| 45 to 54 Years | 5 (18.5%) | 22 (81.5%) |
| 55 to 64 Years | 12 (66.7%) | 6 (33.3%) |
| 65 to 74 Years | 0 (0.0%) | 0 (0.0%) |
| 75 Years and older | 0 (0.0%) | 0 (0.0%) |
| Total | 41 (27.9%) | 106 (72.1%) |
Health Insurance Coverage by Citizenship Status in Whitehorse
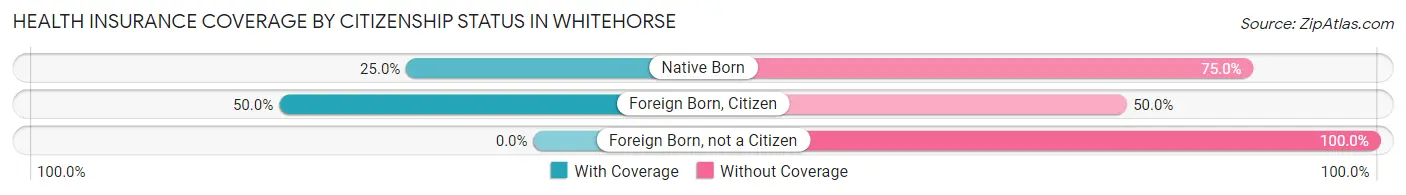
| Citizenship Status | With Coverage | Without Coverage |
| Native Born | 7 (25.0%) | 21 (75.0%) |
| Foreign Born, Citizen | 12 (50.0%) | 12 (50.0%) |
| Foreign Born, not a Citizen | 0 (0.0%) | 23 (100.0%) |
Health Insurance Coverage by Household Income in Whitehorse
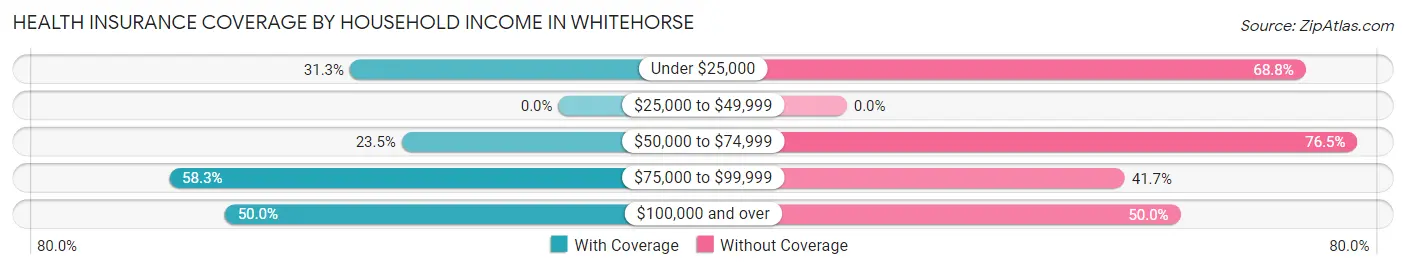
| Household Income | With Coverage | Without Coverage |
| Under $25,000 | 5 (31.2%) | 11 (68.8%) |
| $25,000 to $49,999 | 0 (0.0%) | 0 (0.0%) |
| $50,000 to $74,999 | 27 (23.5%) | 88 (76.5%) |
| $75,000 to $99,999 | 7 (58.3%) | 5 (41.7%) |
| $100,000 and over | 2 (50.0%) | 2 (50.0%) |
Public vs Private Health Insurance Coverage by Age in Whitehorse
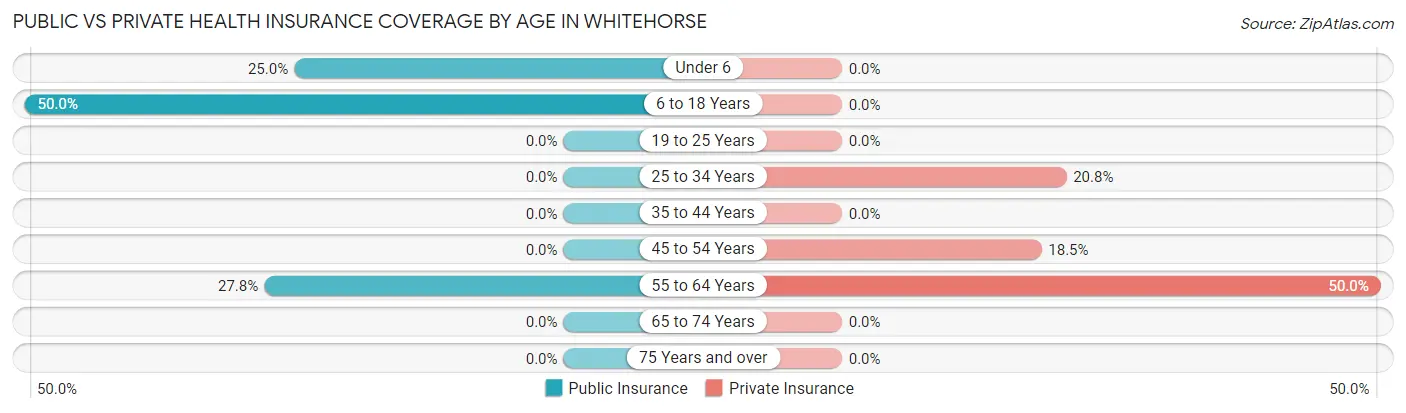
| Age Bracket | Public Insurance | Private Insurance |
| Under 6 | 7 (25.0%) | 0 (0.0%) |
| 6 to 18 Years | 12 (50.0%) | 0 (0.0%) |
| 19 to 25 Years | 0 (0.0%) | 0 (0.0%) |
| 25 to 34 Years | 0 (0.0%) | 5 (20.8%) |
| 35 to 44 Years | 0 (0.0%) | 0 (0.0%) |
| 45 to 54 Years | 0 (0.0%) | 5 (18.5%) |
| 55 to 64 Years | 5 (27.8%) | 9 (50.0%) |
| 65 to 74 Years | 0 (0.0%) | 0 (0.0%) |
| 75 Years and over | 0 (0.0%) | 0 (0.0%) |
| Total | 24 (16.3%) | 19 (12.9%) |
Disability Status by Sex by Age in Whitehorse
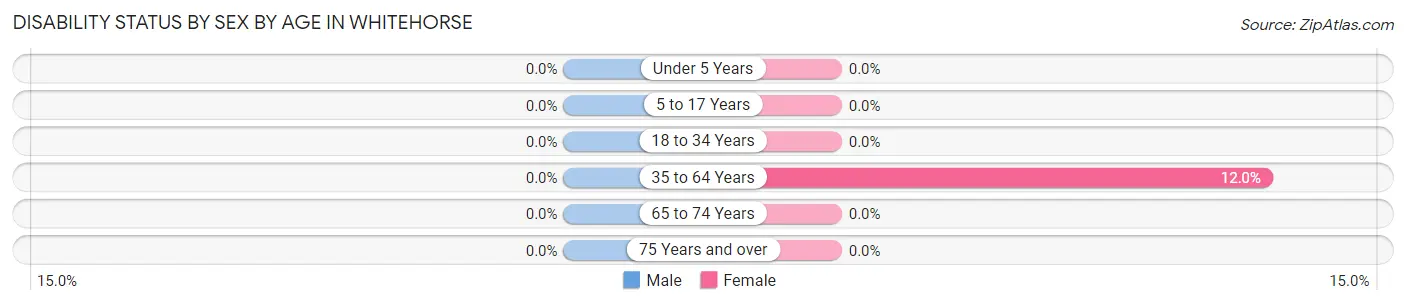
| Age Bracket | Male | Female |
| Under 5 Years | 0 (0.0%) | 0 (0.0%) |
| 5 to 17 Years | 0 (0.0%) | 0 (0.0%) |
| 18 to 34 Years | 0 (0.0%) | 0 (0.0%) |
| 35 to 64 Years | 0 (0.0%) | 3 (12.0%) |
| 65 to 74 Years | 0 (0.0%) | 0 (0.0%) |
| 75 Years and over | 0 (0.0%) | 0 (0.0%) |
Disability Class by Sex by Age in Whitehorse
Disability Class: Hearing Difficulty
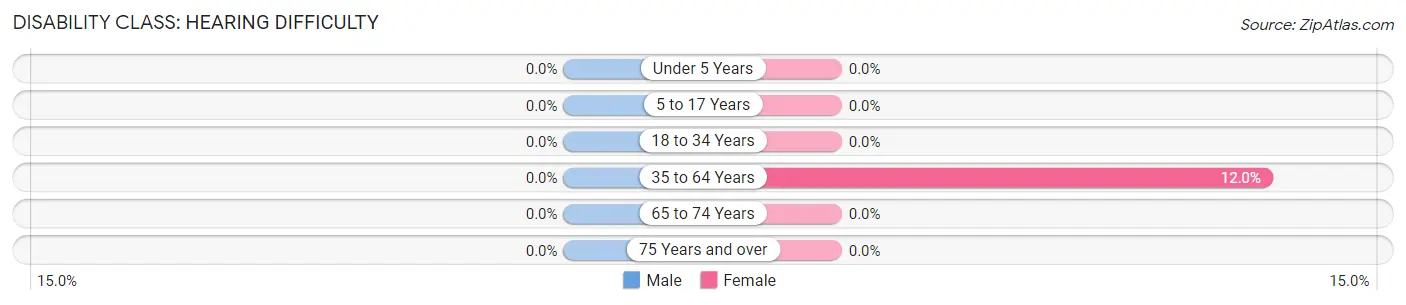
| Age Bracket | Male | Female |
| Under 5 Years | 0 (0.0%) | 0 (0.0%) |
| 5 to 17 Years | 0 (0.0%) | 0 (0.0%) |
| 18 to 34 Years | 0 (0.0%) | 0 (0.0%) |
| 35 to 64 Years | 0 (0.0%) | 3 (12.0%) |
| 65 to 74 Years | 0 (0.0%) | 0 (0.0%) |
| 75 Years and over | 0 (0.0%) | 0 (0.0%) |
Disability Class: Vision Difficulty
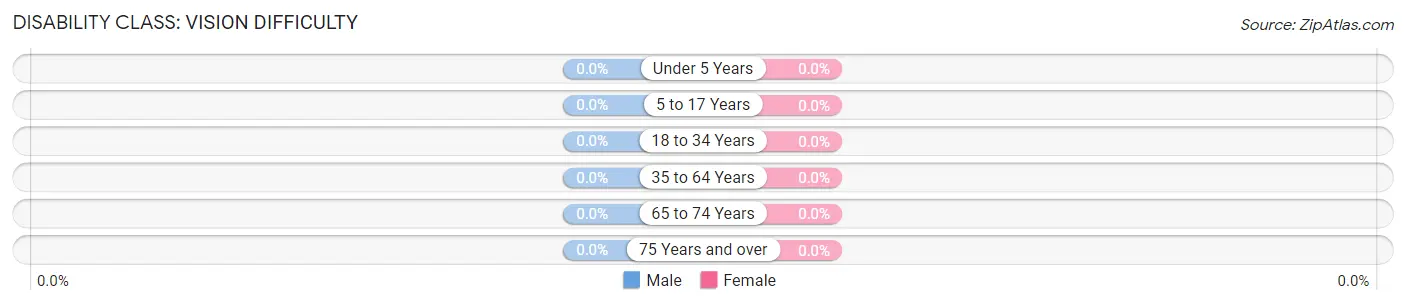
| Age Bracket | Male | Female |
| Under 5 Years | 0 (0.0%) | 0 (0.0%) |
| 5 to 17 Years | 0 (0.0%) | 0 (0.0%) |
| 18 to 34 Years | 0 (0.0%) | 0 (0.0%) |
| 35 to 64 Years | 0 (0.0%) | 0 (0.0%) |
| 65 to 74 Years | 0 (0.0%) | 0 (0.0%) |
| 75 Years and over | 0 (0.0%) | 0 (0.0%) |
Disability Class: Cognitive Difficulty
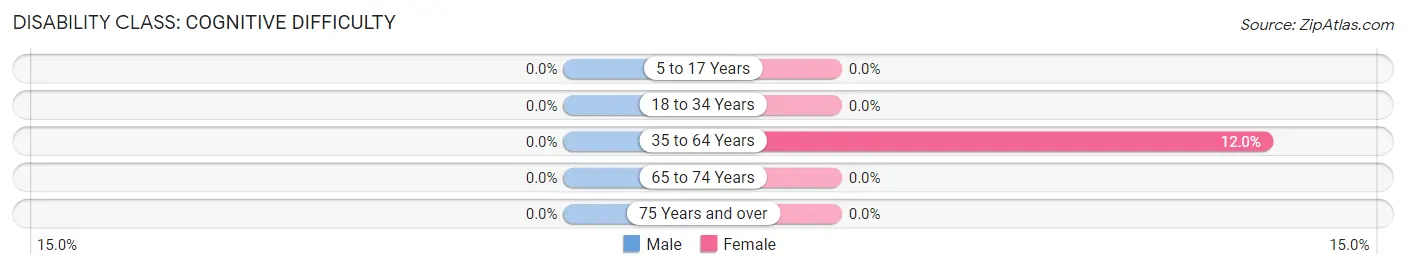
| Age Bracket | Male | Female |
| 5 to 17 Years | 0 (0.0%) | 0 (0.0%) |
| 18 to 34 Years | 0 (0.0%) | 0 (0.0%) |
| 35 to 64 Years | 0 (0.0%) | 3 (12.0%) |
| 65 to 74 Years | 0 (0.0%) | 0 (0.0%) |
| 75 Years and over | 0 (0.0%) | 0 (0.0%) |
Disability Class: Ambulatory Difficulty
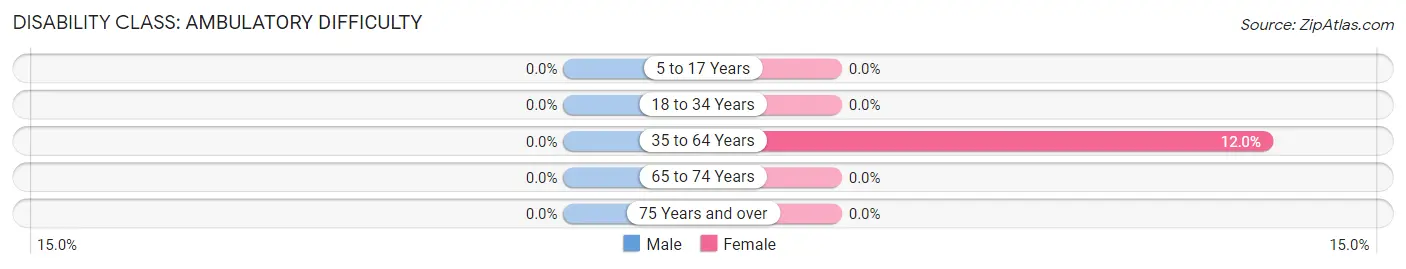
| Age Bracket | Male | Female |
| 5 to 17 Years | 0 (0.0%) | 0 (0.0%) |
| 18 to 34 Years | 0 (0.0%) | 0 (0.0%) |
| 35 to 64 Years | 0 (0.0%) | 3 (12.0%) |
| 65 to 74 Years | 0 (0.0%) | 0 (0.0%) |
| 75 Years and over | 0 (0.0%) | 0 (0.0%) |
Disability Class: Self-Care Difficulty
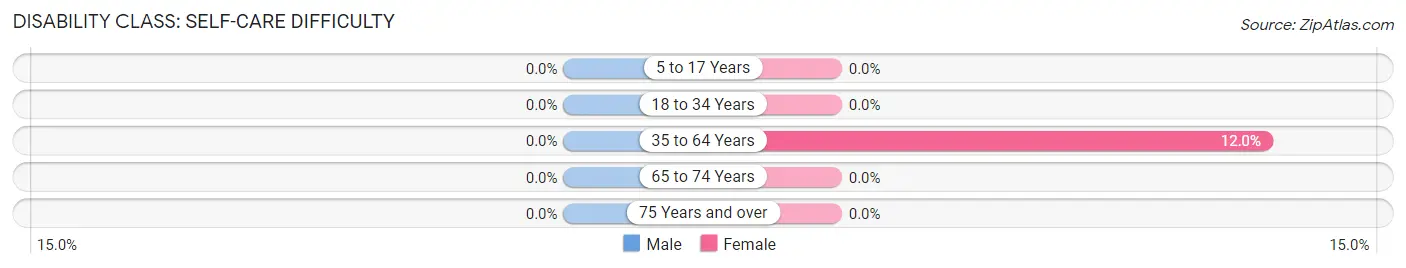
| Age Bracket | Male | Female |
| 5 to 17 Years | 0 (0.0%) | 0 (0.0%) |
| 18 to 34 Years | 0 (0.0%) | 0 (0.0%) |
| 35 to 64 Years | 0 (0.0%) | 3 (12.0%) |
| 65 to 74 Years | 0 (0.0%) | 0 (0.0%) |
| 75 Years and over | 0 (0.0%) | 0 (0.0%) |
Technology Access in Whitehorse
Computing Device Access in Whitehorse
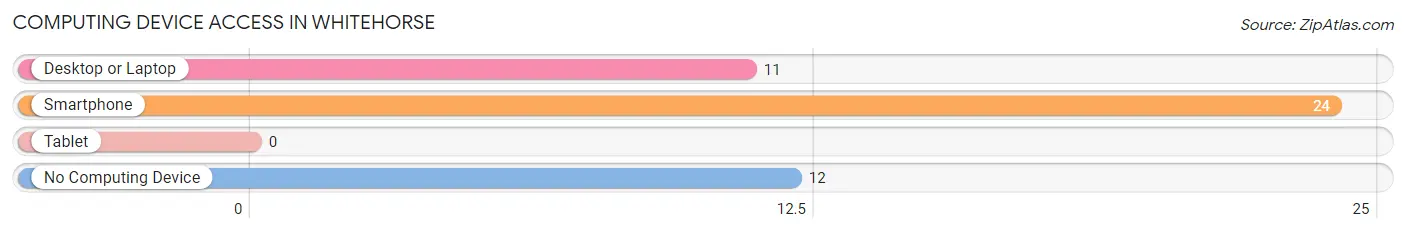
| Device Type | # Households | % Households |
| Desktop or Laptop | 11 | 30.6% |
| Smartphone | 24 | 66.7% |
| Tablet | 0 | 0.0% |
| No Computing Device | 12 | 33.3% |
| Total | 36 | 100.0% |
Internet Access in Whitehorse
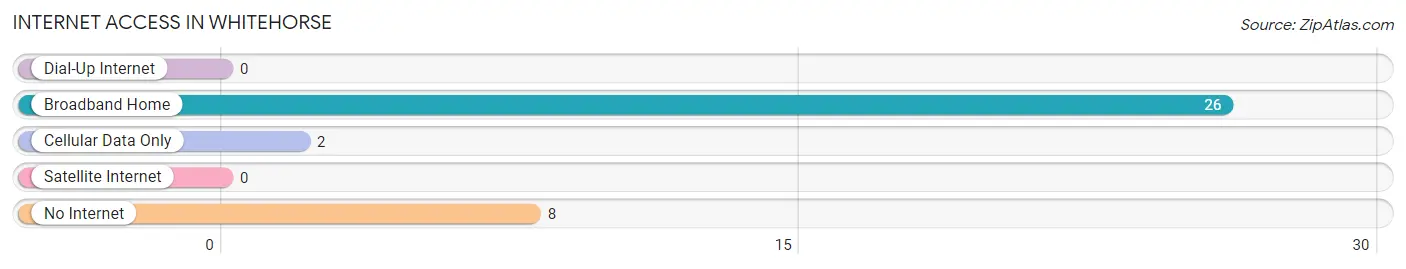
| Internet Type | # Households | % Households |
| Dial-Up Internet | 0 | 0.0% |
| Broadband Home | 26 | 72.2% |
| Cellular Data Only | 2 | 5.6% |
| Satellite Internet | 0 | 0.0% |
| No Internet | 8 | 22.2% |
| Total | 36 | 100.0% |
Whitehorse Summary
History
Whitehorse is a small town located in the southeastern corner of South Dakota, in the United States. It is situated in the extreme southeastern corner of the state, near the border with Nebraska. The town was founded in 1883 by a group of settlers from the nearby town of Yankton. The town was named after the White Horse Creek, which runs through the area.
The town was originally a farming community, and the main crops grown were wheat, corn, and oats. The town also had a small sawmill, which provided lumber for the local area. In the early 1900s, the town began to grow and develop, and the population increased from around 200 in 1900 to over 500 by 1910.
In the 1920s, the town began to experience a period of growth and prosperity. The population increased to over 1,000 by 1930, and the town had several businesses, including a bank, a hotel, a general store, and a movie theater.
The Great Depression of the 1930s hit the town hard, and the population declined to around 500 by 1940. The town was able to recover, however, and the population increased to over 1,000 by 1950.
The town continued to grow and develop throughout the 1950s and 1960s, and the population increased to over 1,500 by 1970. The town also experienced a period of industrial growth, with several factories being built in the area.
The town experienced a period of decline in the 1970s and 1980s, as many of the factories closed and the population decreased to around 1,000 by 1990. The town has since experienced a period of growth and development, and the population has increased to over 1,500 by 2020.
Geography
Whitehorse is located in the extreme southeastern corner of South Dakota, near the border with Nebraska. The town is situated in the Missouri River Valley, and is surrounded by rolling hills and prairies. The town is located at an elevation of 1,845 feet above sea level.
The climate in Whitehorse is classified as humid continental, with hot summers and cold winters. The average annual temperature is around 50 degrees Fahrenheit, and the average annual precipitation is around 25 inches.
Economy
The economy of Whitehorse is largely based on agriculture and tourism. The town is home to several farms, which produce a variety of crops, including wheat, corn, oats, and soybeans. The town also has several small businesses, including restaurants, retail stores, and a movie theater.
The town is also a popular tourist destination, and is home to several attractions, including the White Horse Creek State Park, the White Horse Creek Golf Course, and the White Horse Creek Museum.
Demographics
As of the 2020 census, the population of Whitehorse was 1,541. The racial makeup of the town was 94.3% White, 0.7% African American, 0.3% Native American, 0.2% Asian, 0.1% Pacific Islander, 0.2% from other races, and 4.2% from two or more races. Hispanic or Latino of any race were 1.2% of the population.
The median household income in Whitehorse was $41,250, and the median family income was $50,000. The per capita income was $20,845. About 11.3% of the population was below the poverty line.
Common Questions
What is Per Capita Income in Whitehorse?
Per Capita income in Whitehorse is $14,815.
What is the Median Family Income in Whitehorse?
Median Family Income in Whitehorse is $60,357.
What is the Median Household income in Whitehorse?
Median Household Income in Whitehorse is $62,917.
What is Income or Wage Gap in Whitehorse?
Income or Wage Gap in Whitehorse is 6.2%.
Women in Whitehorse earn 93.8 cents for every dollar earned by a man.
What is Inequality or Gini Index in Whitehorse?
Inequality or Gini Index in Whitehorse is 0.21.
What is the Total Population of Whitehorse?
Total Population of Whitehorse is 147.
What is the Total Male Population of Whitehorse?
Total Male Population of Whitehorse is 76.
What is the Total Female Population of Whitehorse?
Total Female Population of Whitehorse is 71.
What is the Ratio of Males per 100 Females in Whitehorse?
There are 107.04 Males per 100 Females in Whitehorse.
What is the Ratio of Females per 100 Males in Whitehorse?
There are 93.42 Females per 100 Males in Whitehorse.
What is the Median Population Age in Whitehorse?
Median Population Age in Whitehorse is 23.9 Years.
What is the Average Family Size in Whitehorse
Average Family Size in Whitehorse is 4.0 People.
What is the Average Household Size in Whitehorse
Average Household Size in Whitehorse is 4.1 People.
How Large is the Labor Force in Whitehorse?
There are 89 People in the Labor Forcein in Whitehorse.
What is the Percentage of People in the Labor Force in Whitehorse?
87.3% of People are in the Labor Force in Whitehorse.
What is the Unemployment Rate in Whitehorse?
Unemployment Rate in Whitehorse is 30.3%.