Zip Codes with the Highest Percentage of Population Employed in Farming, Fishing & Forestry in Sioux Falls, SD
RELATED REPORTS & OPTIONS
Farming, Fishing & Forestry
Sioux Falls
Compare Zip Codes
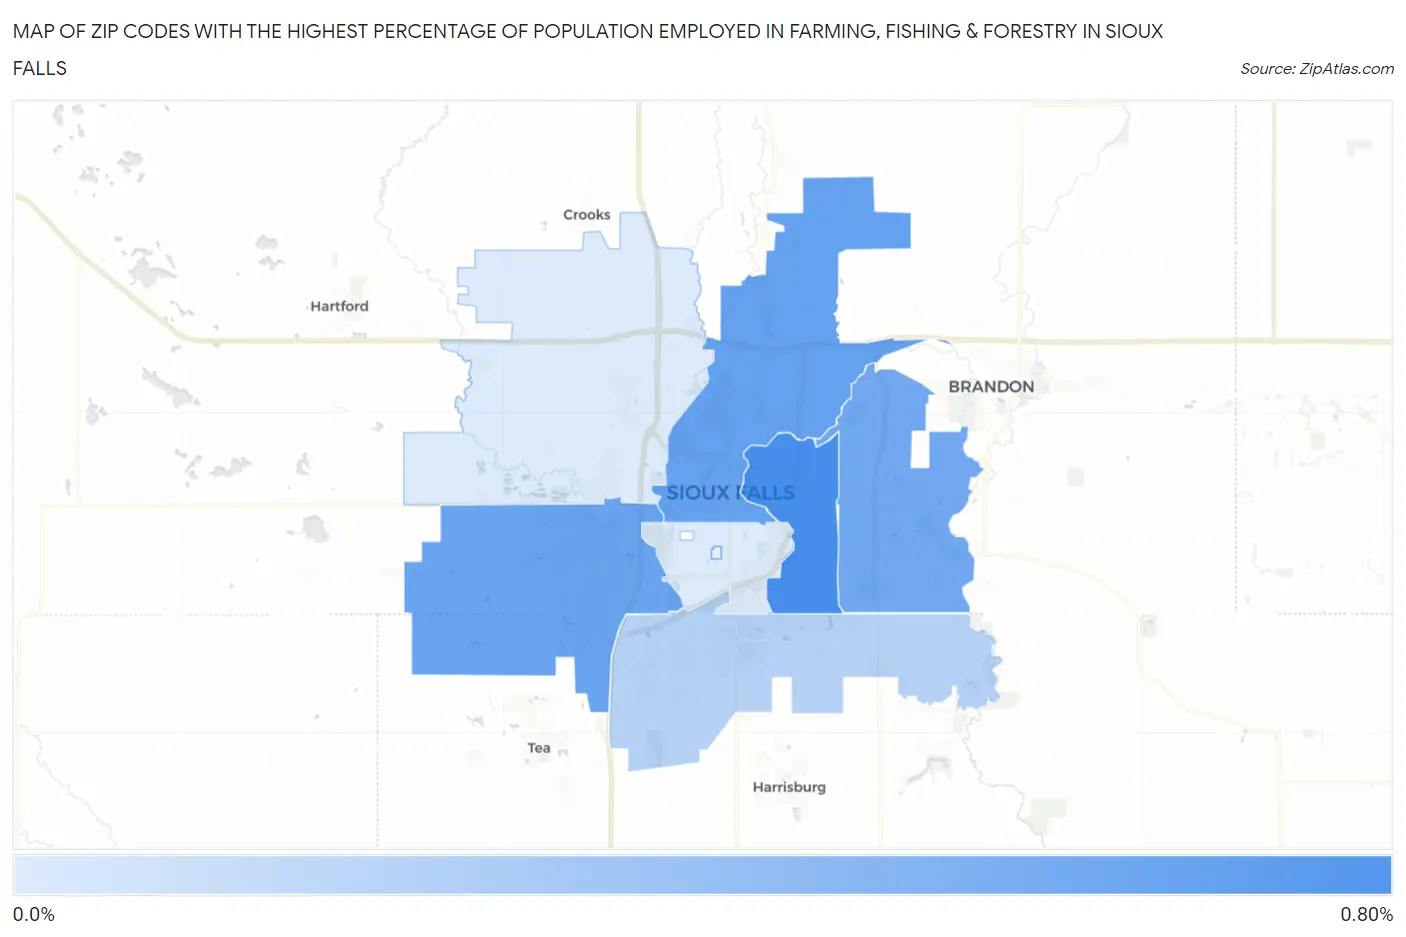
Map of Zip Codes with the Highest Percentage of Population Employed in Farming, Fishing & Forestry in Sioux Falls
0.061%
0.70%
Zip Codes with the Highest Percentage of Population Employed in Farming, Fishing & Forestry in Sioux Falls, SD
| Zip Code | % Employed | vs State | vs National | |
| 1. | 57103 | 0.70% | 1.7%(-1.04)#254 | 0.61%(+0.096)#11,366 |
| 2. | 57104 | 0.57% | 1.7%(-1.17)#262 | 0.61%(-0.032)#12,261 |
| 3. | 57106 | 0.55% | 1.7%(-1.19)#265 | 0.61%(-0.056)#12,448 |
| 4. | 57110 | 0.52% | 1.7%(-1.22)#266 | 0.61%(-0.082)#12,654 |
| 5. | 57108 | 0.23% | 1.7%(-1.51)#277 | 0.61%(-0.377)#15,716 |
| 6. | 57107 | 0.062% | 1.7%(-1.68)#282 | 0.61%(-0.543)#18,436 |
| 7. | 57105 | 0.061% | 1.7%(-1.68)#283 | 0.61%(-0.544)#18,455 |
1
Common Questions
What are the Top 5 Zip Codes with the Highest Percentage of Population Employed in Farming, Fishing & Forestry in Sioux Falls, SD?
Top 5 Zip Codes with the Highest Percentage of Population Employed in Farming, Fishing & Forestry in Sioux Falls, SD are:
What zip code has the Highest Percentage of Population Employed in Farming, Fishing & Forestry in Sioux Falls, SD?
57103 has the Highest Percentage of Population Employed in Farming, Fishing & Forestry in Sioux Falls, SD with 0.70%.
What is the Percentage of Population Employed in Farming, Fishing & Forestry in Sioux Falls, SD?
Percentage of Population Employed in Farming, Fishing & Forestry in Sioux Falls is 0.45%.
What is the Percentage of Population Employed in Farming, Fishing & Forestry in South Dakota?
Percentage of Population Employed in Farming, Fishing & Forestry in South Dakota is 1.7%.
What is the Percentage of Population Employed in Farming, Fishing & Forestry in the United States?
Percentage of Population Employed in Farming, Fishing & Forestry in the United States is 0.61%.