Porcupine, SD Map & Demographics
Porcupine Map
Porcupine Overview
$5,070
PER CAPITA INCOME
$21,849
AVG FAMILY INCOME
$18,750
AVG HOUSEHOLD INCOME
0.38
INEQUALITY / GINI INDEX
1,021
TOTAL POPULATION
518
MALE POPULATION
503
FEMALE POPULATION
102.98
MALES / 100 FEMALES
97.10
FEMALES / 100 MALES
23.0
MEDIAN AGE
4.3
AVG FAMILY SIZE
3.6
AVG HOUSEHOLD SIZE
114
LABOR FORCE [ PEOPLE ]
16.6%
PERCENT IN LABOR FORCE
35.1%
UNEMPLOYMENT RATE
Porcupine Zip Codes
Porcupine Area Codes
Income in Porcupine
Income Overview in Porcupine
Per Capita Income in Porcupine is $5,070, while median incomes of families and households are $21,849 and $18,750 respectively.
| Characteristic | Number | Measure |
| Per Capita Income | 1,021 | $5,070 |
| Median Family Income | 205 | $21,849 |
| Mean Family Income | 205 | $19,500 |
| Median Household Income | 278 | $18,750 |
| Mean Household Income | 278 | $18,055 |
| Income Deficit | 205 | $0 |
| Wage / Income Gap (%) | 1,021 | 0.00% |
| Wage / Income Gap ($) | 1,021 | 100.00¢ per $1 |
| Gini / Inequality Index | 1,021 | 0.38 |
Earnings by Sex in Porcupine
| Sex | Number | Average Earnings |
| Male | 70 (67.3%) | $0 |
| Female | 34 (32.7%) | $0 |
| Total | 104 (100.0%) | $0 |
Earnings by Sex by Income Bracket in Porcupine
The most common earnings brackets in Porcupine are $2,499 or less for men (27 | 38.6%) and $35,000 to $39,999 for women (21 | 61.8%).
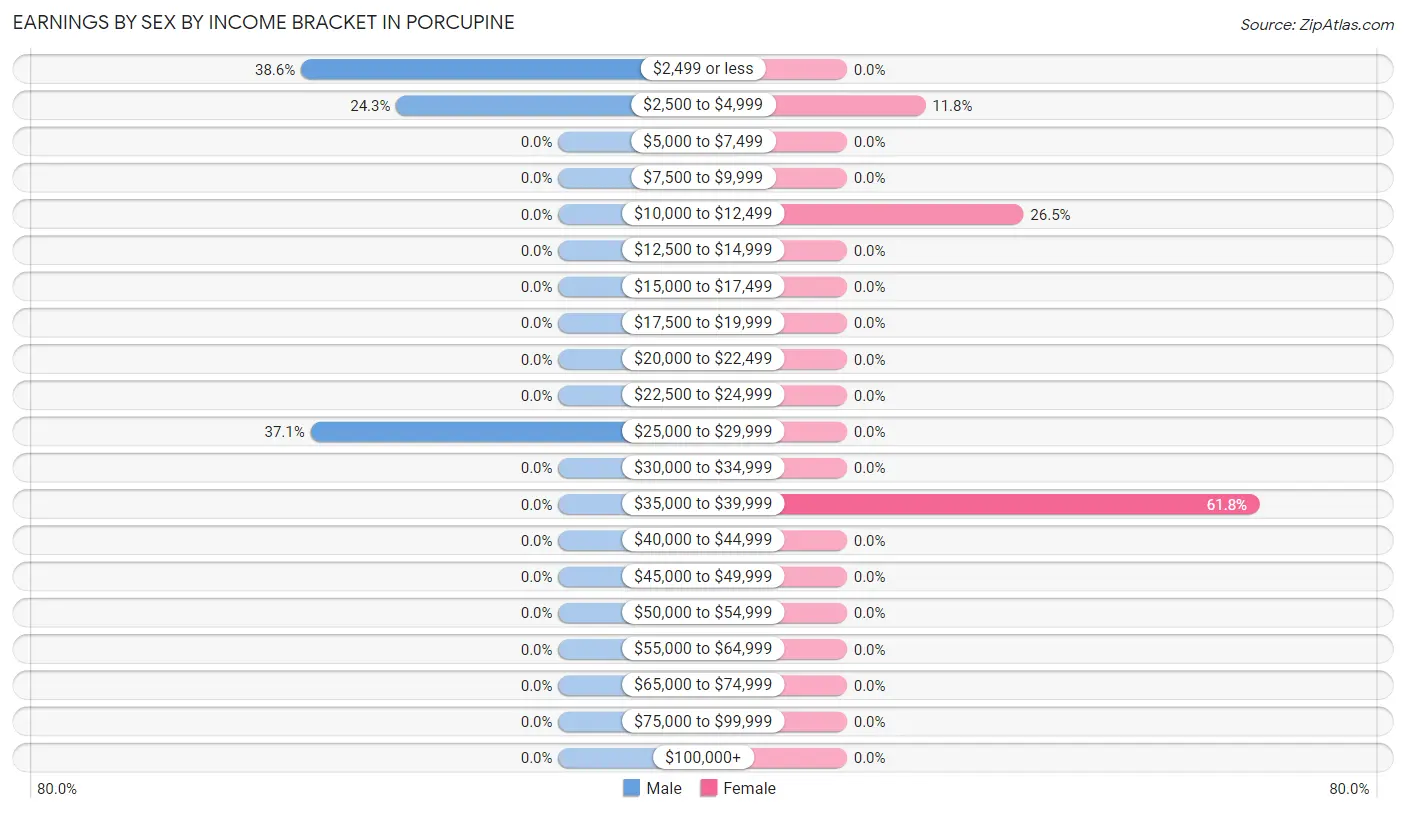
| Income | Male | Female |
| $2,499 or less | 27 (38.6%) | 0 (0.0%) |
| $2,500 to $4,999 | 17 (24.3%) | 4 (11.8%) |
| $5,000 to $7,499 | 0 (0.0%) | 0 (0.0%) |
| $7,500 to $9,999 | 0 (0.0%) | 0 (0.0%) |
| $10,000 to $12,499 | 0 (0.0%) | 9 (26.5%) |
| $12,500 to $14,999 | 0 (0.0%) | 0 (0.0%) |
| $15,000 to $17,499 | 0 (0.0%) | 0 (0.0%) |
| $17,500 to $19,999 | 0 (0.0%) | 0 (0.0%) |
| $20,000 to $22,499 | 0 (0.0%) | 0 (0.0%) |
| $22,500 to $24,999 | 0 (0.0%) | 0 (0.0%) |
| $25,000 to $29,999 | 26 (37.1%) | 0 (0.0%) |
| $30,000 to $34,999 | 0 (0.0%) | 0 (0.0%) |
| $35,000 to $39,999 | 0 (0.0%) | 21 (61.8%) |
| $40,000 to $44,999 | 0 (0.0%) | 0 (0.0%) |
| $45,000 to $49,999 | 0 (0.0%) | 0 (0.0%) |
| $50,000 to $54,999 | 0 (0.0%) | 0 (0.0%) |
| $55,000 to $64,999 | 0 (0.0%) | 0 (0.0%) |
| $65,000 to $74,999 | 0 (0.0%) | 0 (0.0%) |
| $75,000 to $99,999 | 0 (0.0%) | 0 (0.0%) |
| $100,000+ | 0 (0.0%) | 0 (0.0%) |
| Total | 70 (100.0%) | 34 (100.0%) |
Earnings by Sex by Educational Attainment in Porcupine
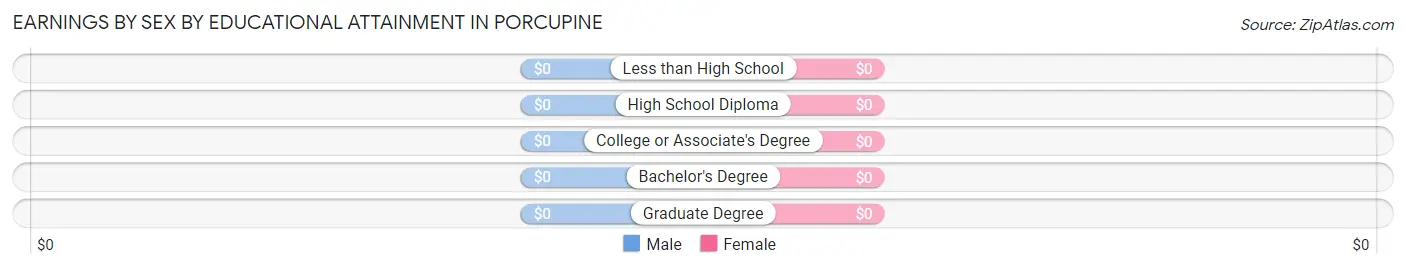
| Educational Attainment | Male Income | Female Income |
| Less than High School | - | - |
| High School Diploma | - | - |
| College or Associate's Degree | - | - |
| Bachelor's Degree | - | - |
| Graduate Degree | - | - |
| Total | - | - |
Family Income in Porcupine
Family Income Brackets in Porcupine
According to the Porcupine family income data, there are 69 families falling into the $25,000 to $34,999 income range, which is the most common income bracket and makes up 33.7% of all families.
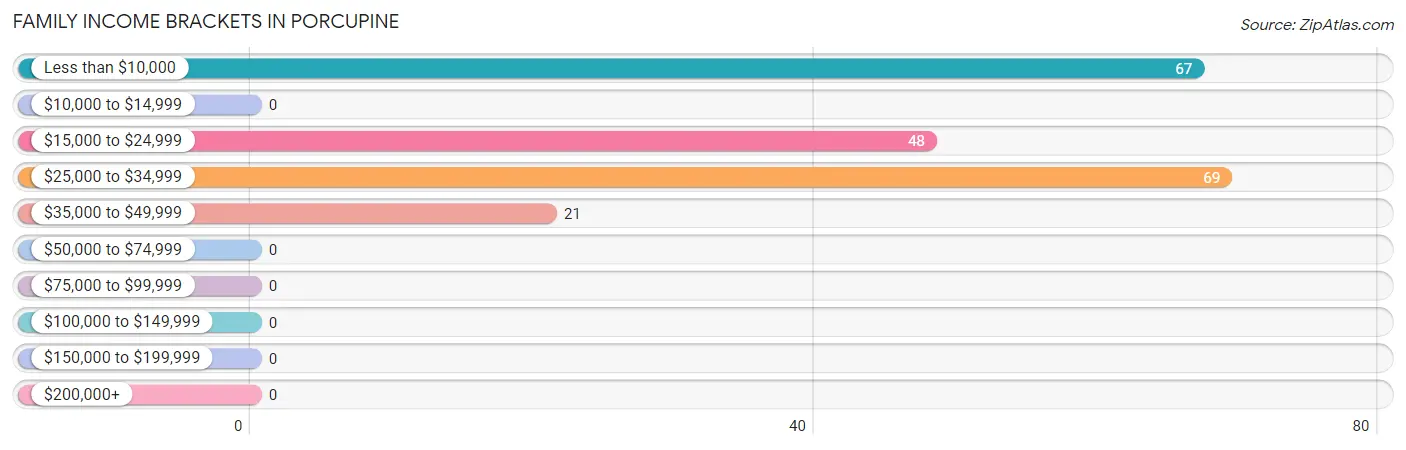
| Income Bracket | # Families | % Families |
| Less than $10,000 | 67 | 32.7% |
| $10,000 to $14,999 | 0 | 0.0% |
| $15,000 to $24,999 | 48 | 23.4% |
| $25,000 to $34,999 | 69 | 33.7% |
| $35,000 to $49,999 | 21 | 10.2% |
| $50,000 to $74,999 | 0 | 0.0% |
| $75,000 to $99,999 | 0 | 0.0% |
| $100,000 to $149,999 | 0 | 0.0% |
| $150,000 to $199,999 | 0 | 0.0% |
| $200,000+ | 0 | 0.0% |
Family Income by Famaliy Size in Porcupine
| Income Bracket | # Families | Median Income |
| 2-Person Families | 69 (33.7%) | $0 |
| 3-Person Families | 0 (0.0%) | $0 |
| 4-Person Families | 51 (24.9%) | $0 |
| 5-Person Families | 43 (21.0%) | $0 |
| 6-Person Families | 4 (1.9%) | $0 |
| 7+ Person Families | 38 (18.5%) | $0 |
| Total | 205 (100.0%) | $21,849 |
Family Income by Number of Earners in Porcupine
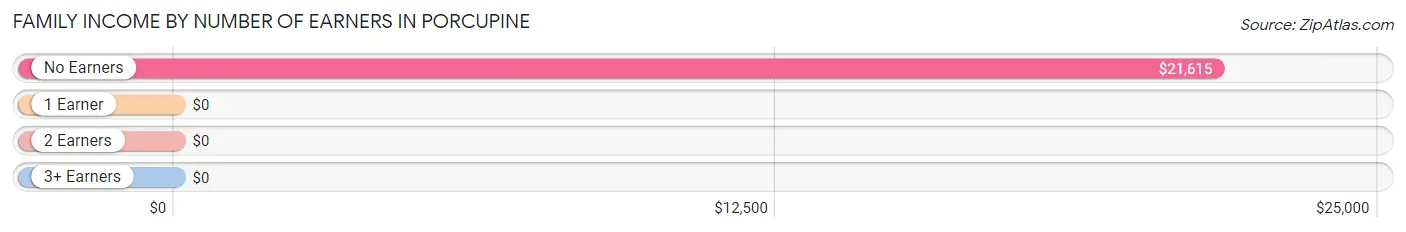
| Number of Earners | # Families | Median Income |
| No Earners | 120 (58.5%) | $21,615 |
| 1 Earner | 85 (41.5%) | $0 |
| 2 Earners | 0 (0.0%) | $0 |
| 3+ Earners | 0 (0.0%) | $0 |
| Total | 205 (100.0%) | $21,849 |
Household Income in Porcupine
Household Income Brackets in Porcupine
With 70 households falling in the category, the $15,000 to $24,999 income range is the most frequent in Porcupine, accounting for 25.2% of all households.
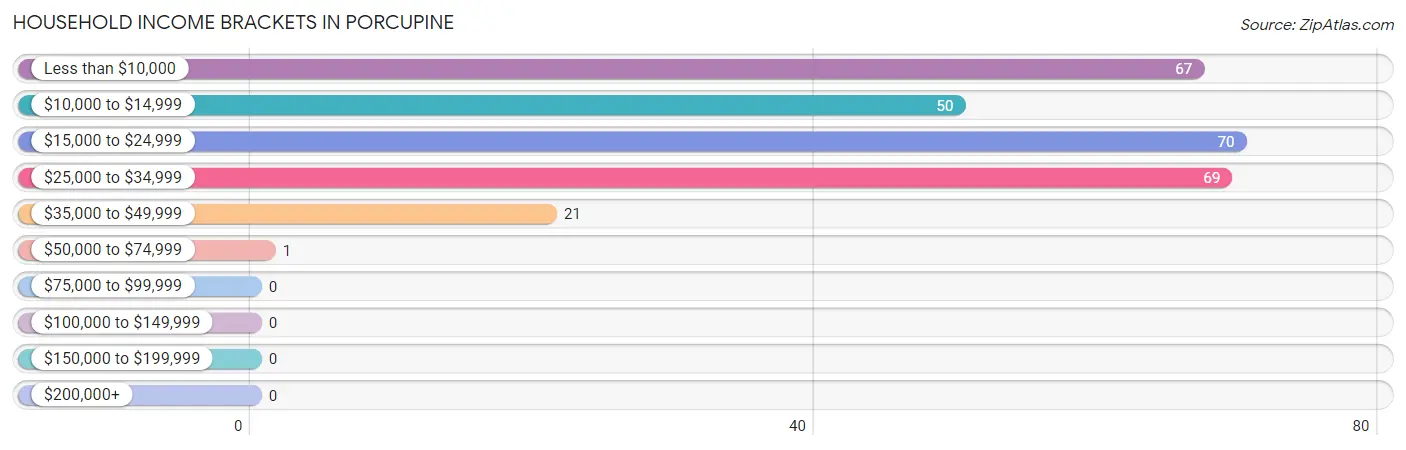
| Income Bracket | # Households | % Households |
| Less than $10,000 | 67 | 24.1% |
| $10,000 to $14,999 | 50 | 18.0% |
| $15,000 to $24,999 | 70 | 25.2% |
| $25,000 to $34,999 | 69 | 24.8% |
| $35,000 to $49,999 | 21 | 7.6% |
| $50,000 to $74,999 | 1 | 0.4% |
| $75,000 to $99,999 | 0 | 0.0% |
| $100,000 to $149,999 | 0 | 0.0% |
| $150,000 to $199,999 | 0 | 0.0% |
| $200,000+ | 0 | 0.0% |
Household Income by Householder Age in Porcupine
The median household income in Porcupine is $18,750, with the highest median household income of $21,797 found in the 65+ years age bracket for the primary householder. A total of 115 households (41.4%) fall into this category.
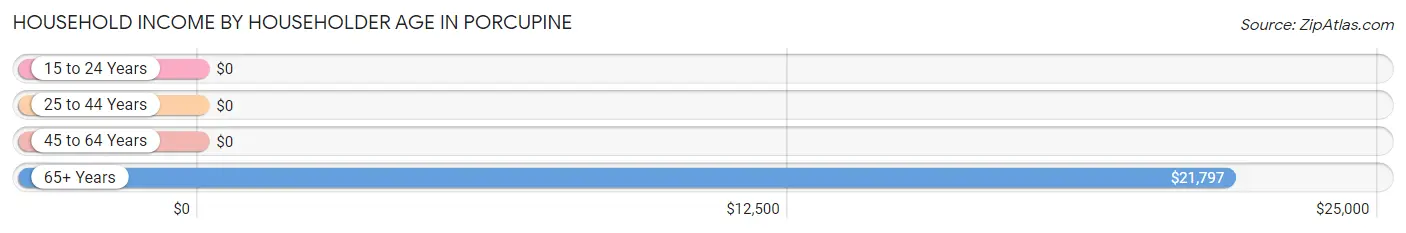
| Income Bracket | # Households | Median Income |
| 15 to 24 Years | 0 (0.0%) | $0 |
| 25 to 44 Years | 46 (16.6%) | $0 |
| 45 to 64 Years | 117 (42.1%) | $0 |
| 65+ Years | 115 (41.4%) | $21,797 |
| Total | 278 (100.0%) | $18,750 |
Poverty in Porcupine
Income Below Poverty by Sex and Age in Porcupine
With 85.9% poverty level for males and 97.1% for females among the residents of Porcupine, under 5 year old males and under 5 year old females are the most vulnerable to poverty, with 65 males (100.0%) and 33 females (100.0%) in their respective age groups living below the poverty level.
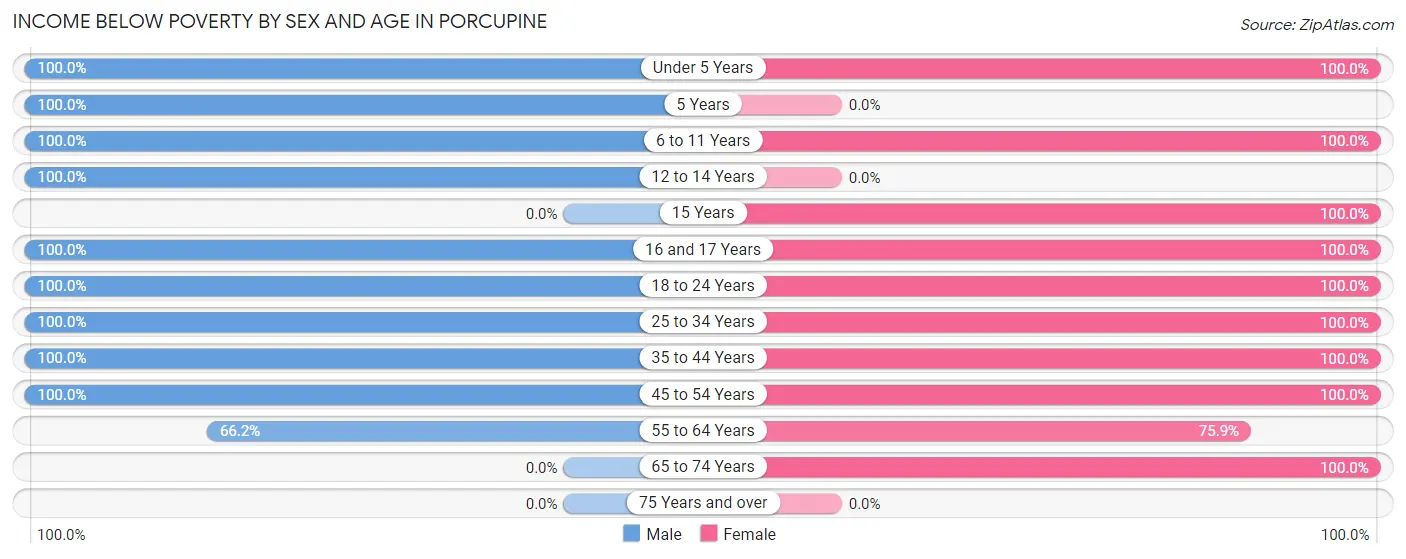
| Age Bracket | Male | Female |
| Under 5 Years | 65 (100.0%) | 33 (100.0%) |
| 5 Years | 12 (100.0%) | 0 (0.0%) |
| 6 to 11 Years | 58 (100.0%) | 97 (100.0%) |
| 12 to 14 Years | 35 (100.0%) | 0 (0.0%) |
| 15 Years | 0 (0.0%) | 19 (100.0%) |
| 16 and 17 Years | 57 (100.0%) | 36 (100.0%) |
| 18 to 24 Years | 55 (100.0%) | 63 (100.0%) |
| 25 to 34 Years | 58 (100.0%) | 28 (100.0%) |
| 35 to 44 Years | 21 (100.0%) | 25 (100.0%) |
| 45 to 54 Years | 23 (100.0%) | 68 (100.0%) |
| 55 to 64 Years | 43 (66.1%) | 41 (75.9%) |
| 65 to 74 Years | 0 (0.0%) | 66 (100.0%) |
| 75 Years and over | 0 (0.0%) | 0 (0.0%) |
| Total | 427 (85.9%) | 476 (97.1%) |
Income Above Poverty by Sex and Age in Porcupine
According to the poverty statistics in Porcupine, males aged 65 to 74 years and females aged 75 years and over are the age groups that are most secure financially, with 100.0% of males and 100.0% of females in these age groups living above the poverty line.
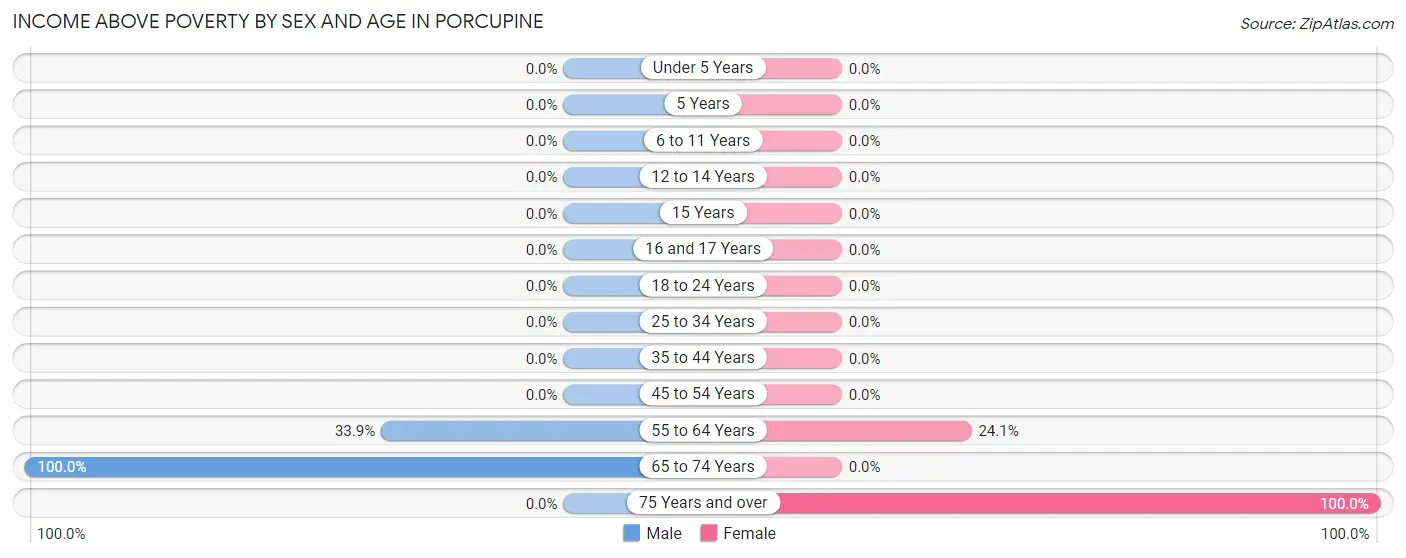
| Age Bracket | Male | Female |
| Under 5 Years | 0 (0.0%) | 0 (0.0%) |
| 5 Years | 0 (0.0%) | 0 (0.0%) |
| 6 to 11 Years | 0 (0.0%) | 0 (0.0%) |
| 12 to 14 Years | 0 (0.0%) | 0 (0.0%) |
| 15 Years | 0 (0.0%) | 0 (0.0%) |
| 16 and 17 Years | 0 (0.0%) | 0 (0.0%) |
| 18 to 24 Years | 0 (0.0%) | 0 (0.0%) |
| 25 to 34 Years | 0 (0.0%) | 0 (0.0%) |
| 35 to 44 Years | 0 (0.0%) | 0 (0.0%) |
| 45 to 54 Years | 0 (0.0%) | 0 (0.0%) |
| 55 to 64 Years | 22 (33.9%) | 13 (24.1%) |
| 65 to 74 Years | 48 (100.0%) | 0 (0.0%) |
| 75 Years and over | 0 (0.0%) | 1 (100.0%) |
| Total | 70 (14.1%) | 14 (2.9%) |
Income Below Poverty Among Married-Couple Families in Porcupine
The poverty statistics for married-couple families in Porcupine show that 47.2% or 43 of the total 91 families live below the poverty line. Families with 1 or 2 children have the highest poverty rate of 100.0%, comprising of 26 families. On the other hand, families with no children have the lowest poverty rate of 0.0%, which includes 0 families.
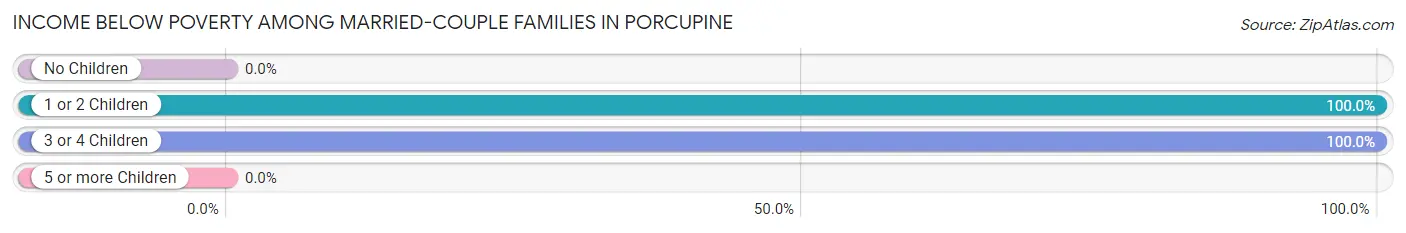
| Children | Above Poverty | Below Poverty |
| No Children | 48 (100.0%) | 0 (0.0%) |
| 1 or 2 Children | 0 (0.0%) | 26 (100.0%) |
| 3 or 4 Children | 0 (0.0%) | 17 (100.0%) |
| 5 or more Children | 0 (0.0%) | 0 (0.0%) |
| Total | 48 (52.7%) | 43 (47.2%) |
Income Below Poverty Among Single-Parent Households in Porcupine
According to the poverty data in Porcupine, 100.0% or 25 single-father households and 100.0% or 89 single-mother households are living below the poverty line. Among single-father households, those with 1 or 2 children have the highest poverty rate, with 21 households (100.0%) experiencing poverty. Likewise, among single-mother households, those with 1 or 2 children have the highest poverty rate, with 21 households (100.0%) falling below the poverty line.
| Children | Single Father | Single Mother |
| No Children | 0 (0.0%) | 0 (0.0%) |
| 1 or 2 Children | 21 (100.0%) | 21 (100.0%) |
| 3 or 4 Children | 4 (100.0%) | 47 (100.0%) |
| 5 or more Children | 0 (0.0%) | 21 (100.0%) |
| Total | 25 (100.0%) | 89 (100.0%) |
Income Below Poverty Among Married-Couple vs Single-Parent Households in Porcupine
The poverty data for Porcupine shows that 43 of the married-couple family households (47.2%) and 114 of the single-parent households (100.0%) are living below the poverty level. Within the married-couple family households, those with 1 or 2 children have the highest poverty rate, with 26 households (100.0%) falling below the poverty line. Among the single-parent households, those with 1 or 2 children have the highest poverty rate, with 42 household (100.0%) living below poverty.
| Children | Married-Couple Families | Single-Parent Households |
| No Children | 0 (0.0%) | 0 (0.0%) |
| 1 or 2 Children | 26 (100.0%) | 42 (100.0%) |
| 3 or 4 Children | 17 (100.0%) | 51 (100.0%) |
| 5 or more Children | 0 (0.0%) | 21 (100.0%) |
| Total | 43 (47.2%) | 114 (100.0%) |
Race in Porcupine
The most populous races in Porcupine are Native / Alaskan (954 | 93.4%), Hispanic or Latino (48 | 4.7%), and Some other Race (48 | 4.7%).
| Race | # Population | % Population |
| Asian | 0 | 0.0% |
| Black / African American | 0 | 0.0% |
| Hawaiian / Pacific | 0 | 0.0% |
| Hispanic or Latino | 48 | 4.7% |
| Native / Alaskan | 954 | 93.4% |
| White / Caucasian | 19 | 1.9% |
| Two or more Races | 0 | 0.0% |
| Some other Race | 48 | 4.7% |
| Total | 1,021 | 100.0% |
Ancestry in Porcupine
The most populous ancestries reported in Porcupine are Sioux (349 | 34.2%), Cheyenne (48 | 4.7%), Arapaho (20 | 2.0%), Chippewa (18 | 1.8%), and German (6 | 0.6%), together accounting for 43.2% of all Porcupine residents.
| Ancestry | # Population | % Population |
| Arapaho | 20 | 2.0% |
| Cheyenne | 48 | 4.7% |
| Chippewa | 18 | 1.8% |
| Dutch | 4 | 0.4% |
| German | 6 | 0.6% |
| Scottish | 6 | 0.6% |
| Sioux | 349 | 34.2% | View All 7 Rows |
Immigrants in Porcupine

| Immigration Origin | # Population | % Population | View All 0 Rows |
Sex and Age in Porcupine
Sex and Age in Porcupine
The most populous age groups in Porcupine are 15 to 19 Years (75 | 14.5%) for men and 15 to 19 Years (99 | 19.7%) for women.
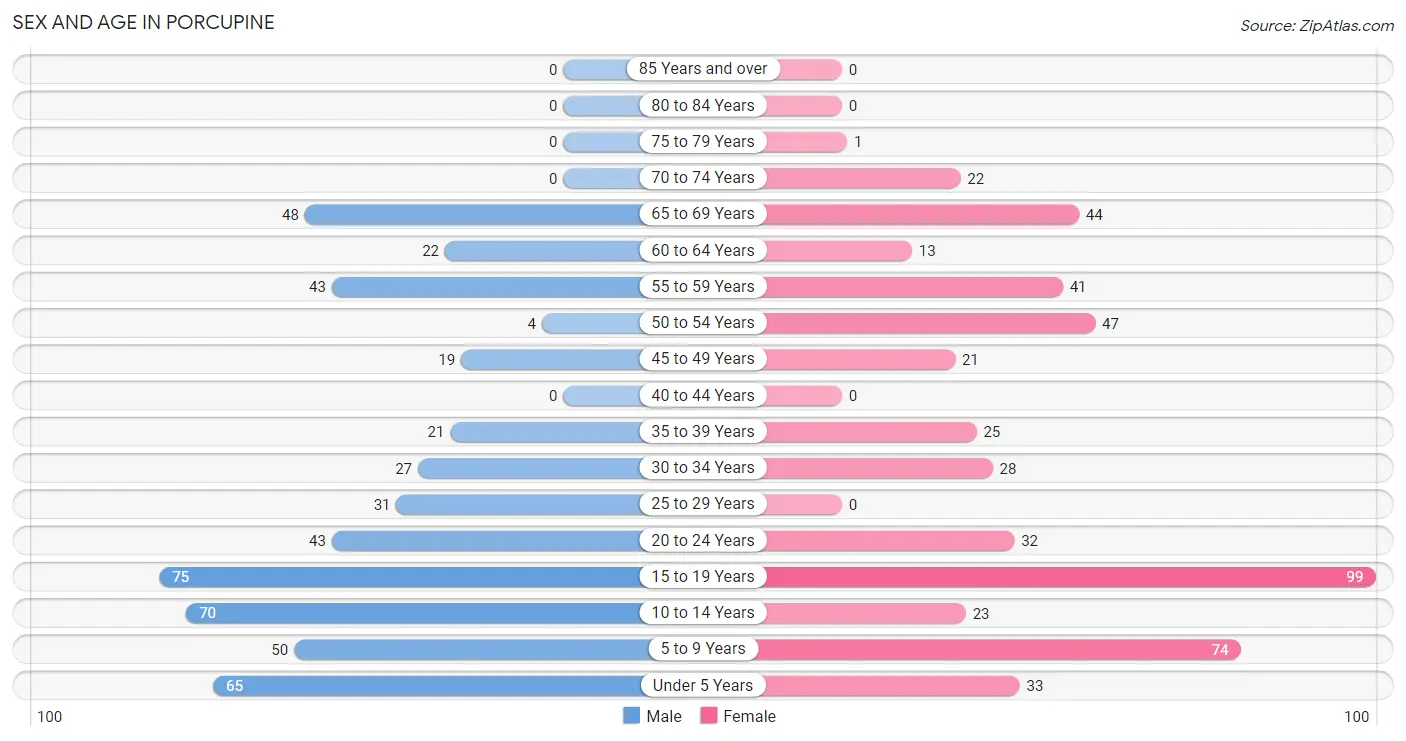
| Age Bracket | Male | Female |
| Under 5 Years | 65 (12.6%) | 33 (6.6%) |
| 5 to 9 Years | 50 (9.7%) | 74 (14.7%) |
| 10 to 14 Years | 70 (13.5%) | 23 (4.6%) |
| 15 to 19 Years | 75 (14.5%) | 99 (19.7%) |
| 20 to 24 Years | 43 (8.3%) | 32 (6.4%) |
| 25 to 29 Years | 31 (6.0%) | 0 (0.0%) |
| 30 to 34 Years | 27 (5.2%) | 28 (5.6%) |
| 35 to 39 Years | 21 (4.1%) | 25 (5.0%) |
| 40 to 44 Years | 0 (0.0%) | 0 (0.0%) |
| 45 to 49 Years | 19 (3.7%) | 21 (4.2%) |
| 50 to 54 Years | 4 (0.8%) | 47 (9.3%) |
| 55 to 59 Years | 43 (8.3%) | 41 (8.2%) |
| 60 to 64 Years | 22 (4.3%) | 13 (2.6%) |
| 65 to 69 Years | 48 (9.3%) | 44 (8.7%) |
| 70 to 74 Years | 0 (0.0%) | 22 (4.4%) |
| 75 to 79 Years | 0 (0.0%) | 1 (0.2%) |
| 80 to 84 Years | 0 (0.0%) | 0 (0.0%) |
| 85 Years and over | 0 (0.0%) | 0 (0.0%) |
| Total | 518 (100.0%) | 503 (100.0%) |
Families and Households in Porcupine
Median Family Size in Porcupine
The median family size in Porcupine is 4.26 persons per family, with single female/mother families (89 | 43.4%) accounting for the largest median family size of 5.54 persons per family. On the other hand, married-couple families (91 | 44.4%) represent the smallest median family size with 3.16 persons per family.
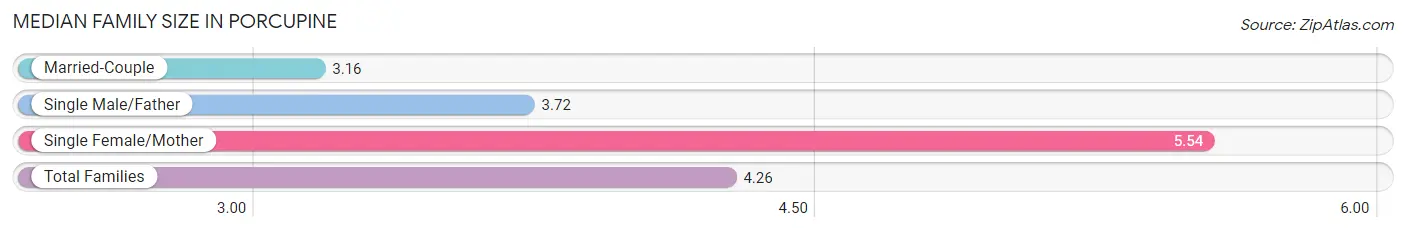
| Family Type | # Families | Family Size |
| Married-Couple | 91 (44.4%) | 3.16 |
| Single Male/Father | 25 (12.2%) | 3.72 |
| Single Female/Mother | 89 (43.4%) | 5.54 |
| Total Families | 205 (100.0%) | 4.26 |
Median Household Size in Porcupine
The median household size in Porcupine is 3.60 persons per household, with single female/mother households (89 | 32.0%) accounting for the largest median household size of 5.79 persons per household. non-family households (73 | 26.3%) represent the smallest median household size with 1.25 persons per household.
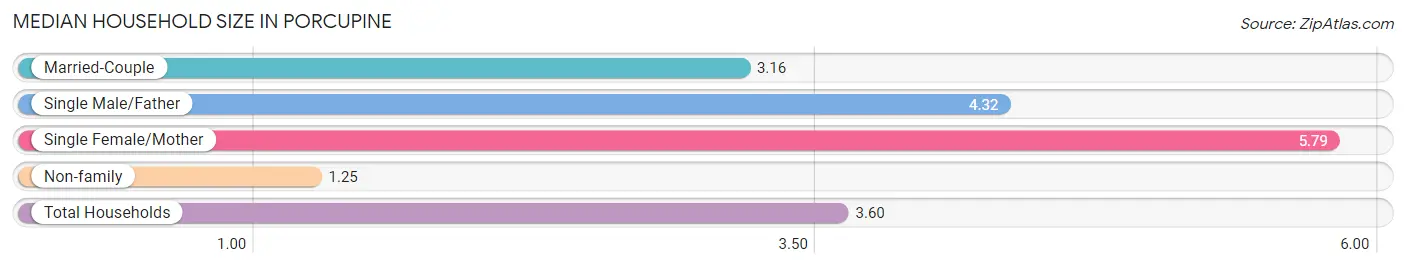
| Household Type | # Households | Household Size |
| Married-Couple | 91 (32.7%) | 3.16 |
| Single Male/Father | 25 (9.0%) | 4.32 |
| Single Female/Mother | 89 (32.0%) | 5.79 |
| Non-family | 73 (26.3%) | 1.25 |
| Total Households | 278 (100.0%) | 3.60 |
Household Size by Marriage Status in Porcupine
Out of a total of 278 households in Porcupine, 205 (73.7%) are family households, while 73 (26.3%) are nonfamily households. The most numerous type of family households are 2-person households, comprising 69, and the most common type of nonfamily households are 1-person households, comprising 50.
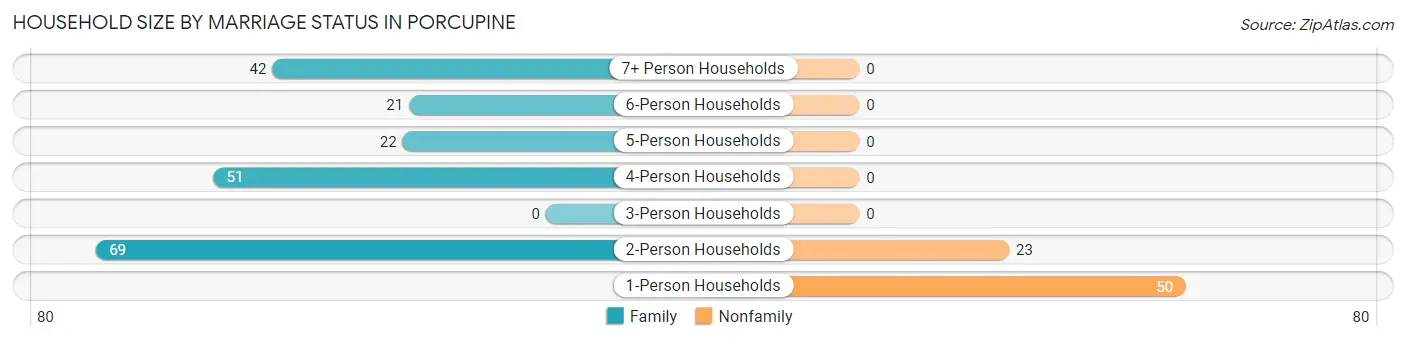
| Household Size | Family Households | Nonfamily Households |
| 1-Person Households | - | 50 (18.0%) |
| 2-Person Households | 69 (24.8%) | 23 (8.3%) |
| 3-Person Households | 0 (0.0%) | 0 (0.0%) |
| 4-Person Households | 51 (18.3%) | 0 (0.0%) |
| 5-Person Households | 22 (7.9%) | 0 (0.0%) |
| 6-Person Households | 21 (7.5%) | 0 (0.0%) |
| 7+ Person Households | 42 (15.1%) | 0 (0.0%) |
| Total | 205 (73.7%) | 73 (26.3%) |
Female Fertility in Porcupine
Fertility by Age in Porcupine
Average fertility rate in Porcupine is 151.0 births per 1,000 women. Women in the age bracket of 15 to 19 years have the highest fertility rate with 313.0 births per 1,000 women. Women in the age bracket of 15 to 19 years acount for 100.0% of all women with births.
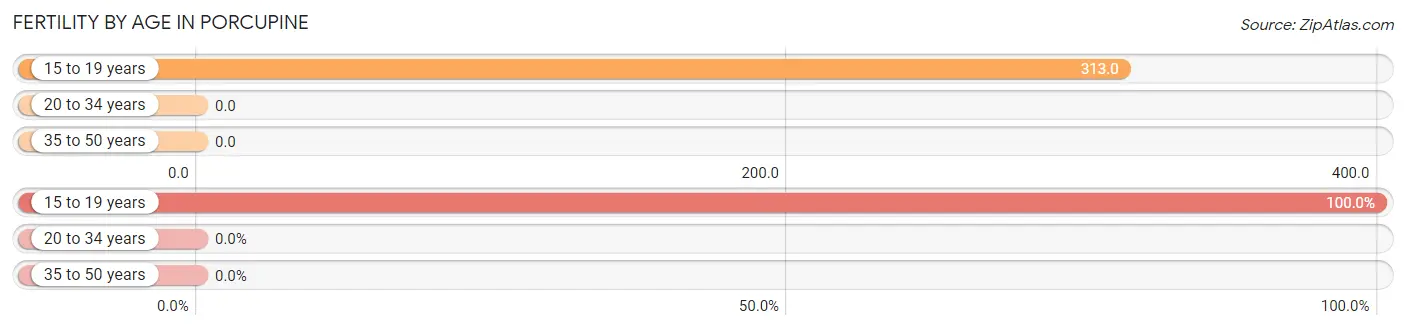
| Age Bracket | Women with Births | Births / 1,000 Women |
| 15 to 19 years | 31 (100.0%) | 313.0 |
| 20 to 34 years | 0 (0.0%) | 0.0 |
| 35 to 50 years | 0 (0.0%) | 0.0 |
| Total | 31 (100.0%) | 151.0 |
Fertility by Age by Marriage Status in Porcupine
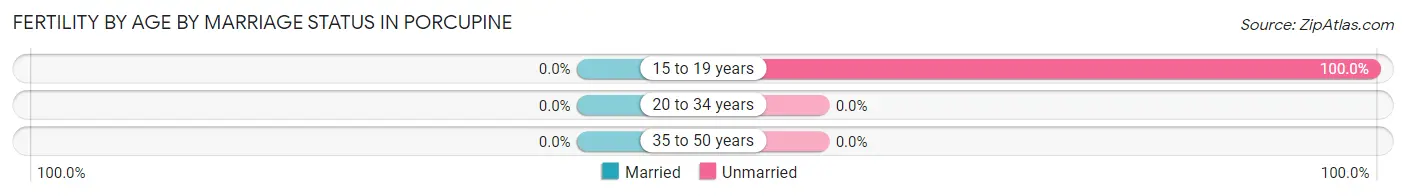
| Age Bracket | Married | Unmarried |
| 15 to 19 years | 0 (0.0%) | 31 (100.0%) |
| 20 to 34 years | 0 (0.0%) | 0 (0.0%) |
| 35 to 50 years | 0 (0.0%) | 0 (0.0%) |
| Total | 0 (0.0%) | 31 (100.0%) |
Fertility by Education in Porcupine
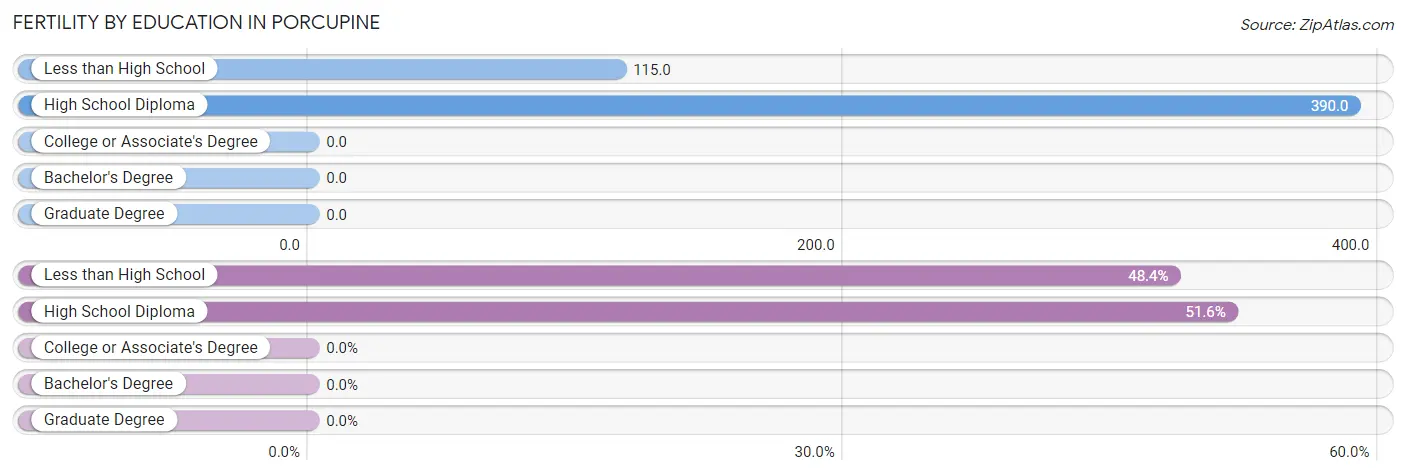
| Educational Attainment | Women with Births | Births / 1,000 Women |
| Less than High School | 15 (48.4%) | 115.0 |
| High School Diploma | 16 (51.6%) | 390.0 |
| College or Associate's Degree | 0 (0.0%) | 0.0 |
| Bachelor's Degree | 0 (0.0%) | 0.0 |
| Graduate Degree | 0 (0.0%) | 0.0 |
| Total | 31 (100.0%) | 151.0 |
Fertility by Education by Marriage Status in Porcupine
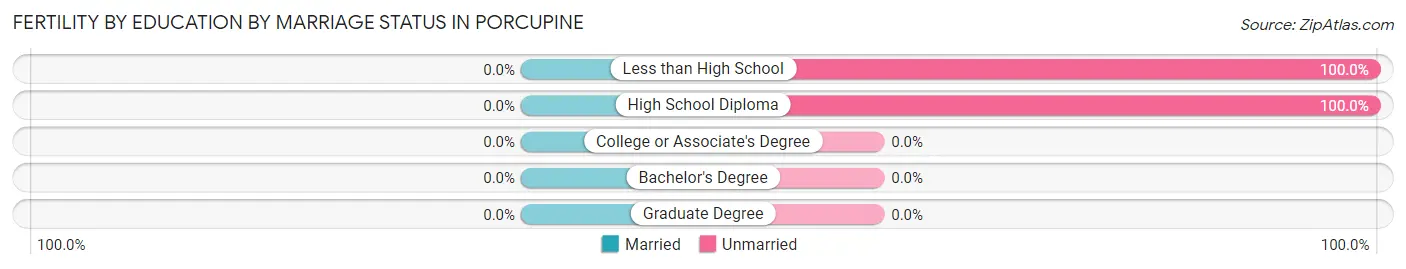
| Educational Attainment | Married | Unmarried |
| Less than High School | 0 (0.0%) | 15 (100.0%) |
| High School Diploma | 0 (0.0%) | 16 (100.0%) |
| College or Associate's Degree | 0 (0.0%) | 0 (0.0%) |
| Bachelor's Degree | 0 (0.0%) | 0 (0.0%) |
| Graduate Degree | 0 (0.0%) | 0 (0.0%) |
| Total | 0 (0.0%) | 31 (100.0%) |
Employment Characteristics in Porcupine
Employment by Class of Employer in Porcupine
Among the 70 employed individuals in Porcupine, local government employees (43 | 61.4%), self-employed (not incorporated) (21 | 30.0%), and private company employees (6 | 8.6%) make up the most common classes of employment.
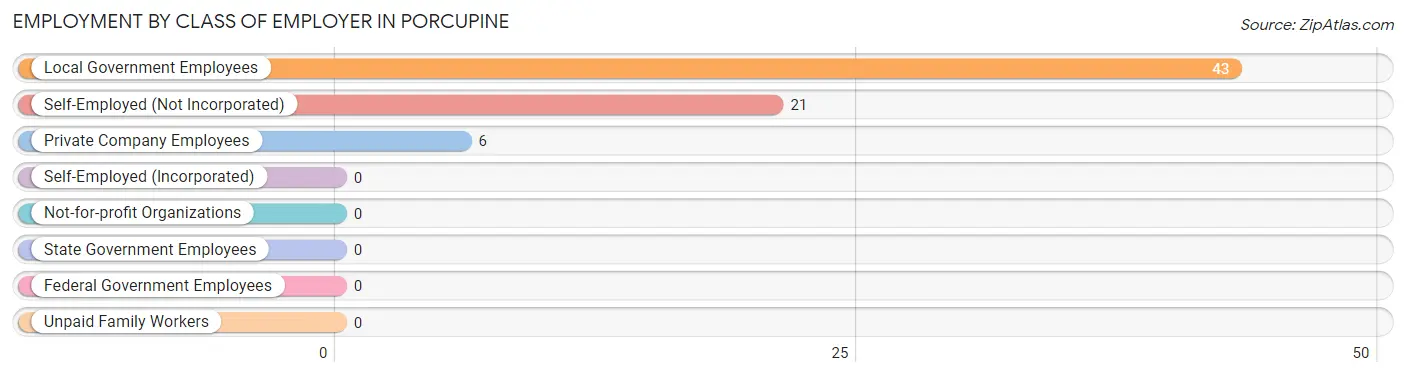
| Employer Class | # Employees | % Employees |
| Private Company Employees | 6 | 8.6% |
| Self-Employed (Incorporated) | 0 | 0.0% |
| Self-Employed (Not Incorporated) | 21 | 30.0% |
| Not-for-profit Organizations | 0 | 0.0% |
| Local Government Employees | 43 | 61.4% |
| State Government Employees | 0 | 0.0% |
| Federal Government Employees | 0 | 0.0% |
| Unpaid Family Workers | 0 | 0.0% |
| Total | 70 | 100.0% |
Employment Status by Age in Porcupine
According to the labor force statistics for Porcupine, out of the total population over 16 years of age (687), 16.6% or 114 individuals are in the labor force, with 35.1% or 40 of them unemployed. The age group with the highest labor force participation rate is 25 to 29 years, with 67.7% or 21 individuals in the labor force. Within the labor force, the 25 to 29 years age range has the highest percentage of unemployed individuals, with 100.0% or 21 of them being unemployed.
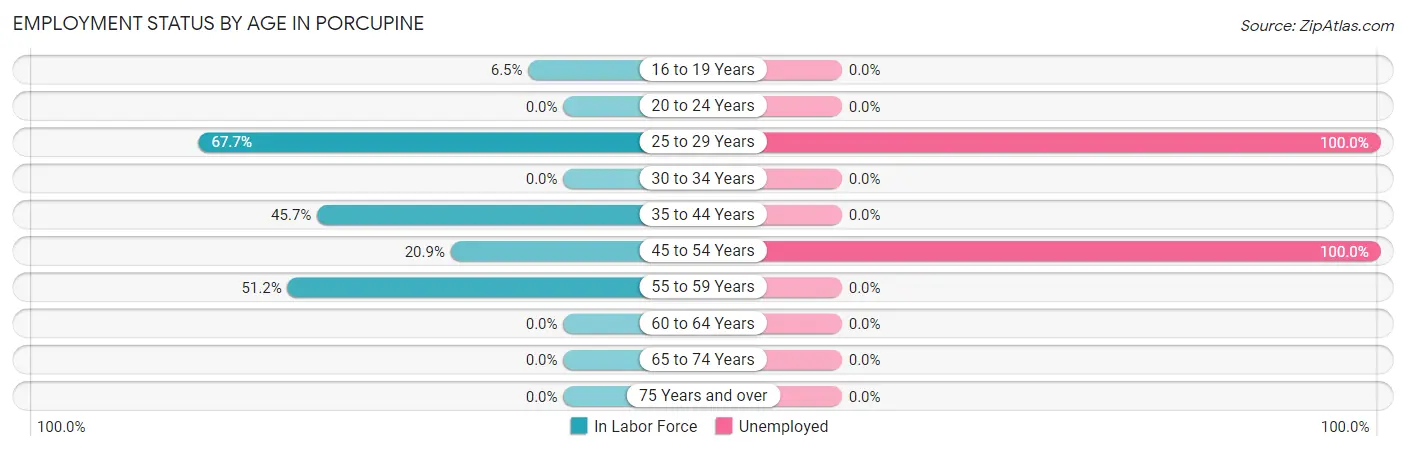
| Age Bracket | In Labor Force | Unemployed |
| 16 to 19 Years | 10 (6.5%) | 0 (0.0%) |
| 20 to 24 Years | 0 (0.0%) | 0 (0.0%) |
| 25 to 29 Years | 21 (67.7%) | 21 (100.0%) |
| 30 to 34 Years | 0 (0.0%) | 0 (0.0%) |
| 35 to 44 Years | 21 (45.7%) | 0 (0.0%) |
| 45 to 54 Years | 19 (20.9%) | 19 (100.0%) |
| 55 to 59 Years | 43 (51.2%) | 0 (0.0%) |
| 60 to 64 Years | 0 (0.0%) | 0 (0.0%) |
| 65 to 74 Years | 0 (0.0%) | 0 (0.0%) |
| 75 Years and over | 0 (0.0%) | 0 (0.0%) |
| Total | 114 (16.6%) | 40 (35.1%) |
Employment Status by Educational Attainment in Porcupine
According to labor force statistics for Porcupine, 30.4% of individuals (104) out of the total population between 25 and 64 years of age (342) are in the labor force, with 38.5% or 40 of them being unemployed. The group with the highest labor force participation rate are those with the educational attainment of college / associate degree, with 57.1% or 36 individuals in the labor force. Within the labor force, individuals with college / associate degree education have the highest percentage of unemployment, with 52.8% or 19 of them being unemployed.
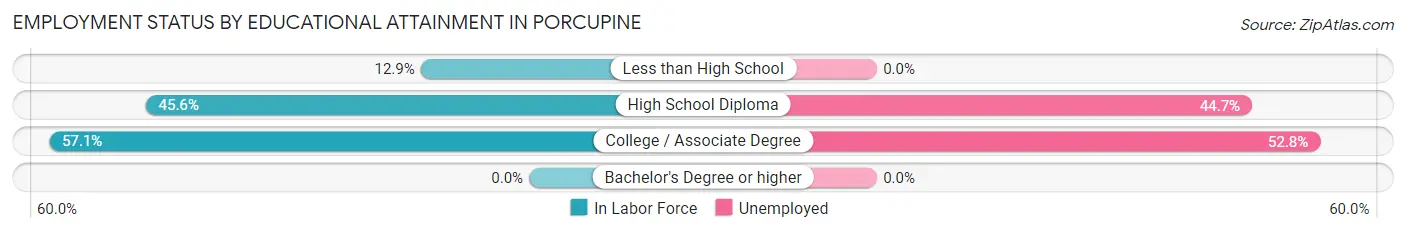
| Educational Attainment | In Labor Force | Unemployed |
| Less than High School | 21 (12.9%) | 0 (0.0%) |
| High School Diploma | 47 (45.6%) | 46 (44.7%) |
| College / Associate Degree | 36 (57.1%) | 33 (52.8%) |
| Bachelor's Degree or higher | 0 (0.0%) | 0 (0.0%) |
| Total | 104 (30.4%) | 132 (38.5%) |
Employment Occupations by Sex in Porcupine
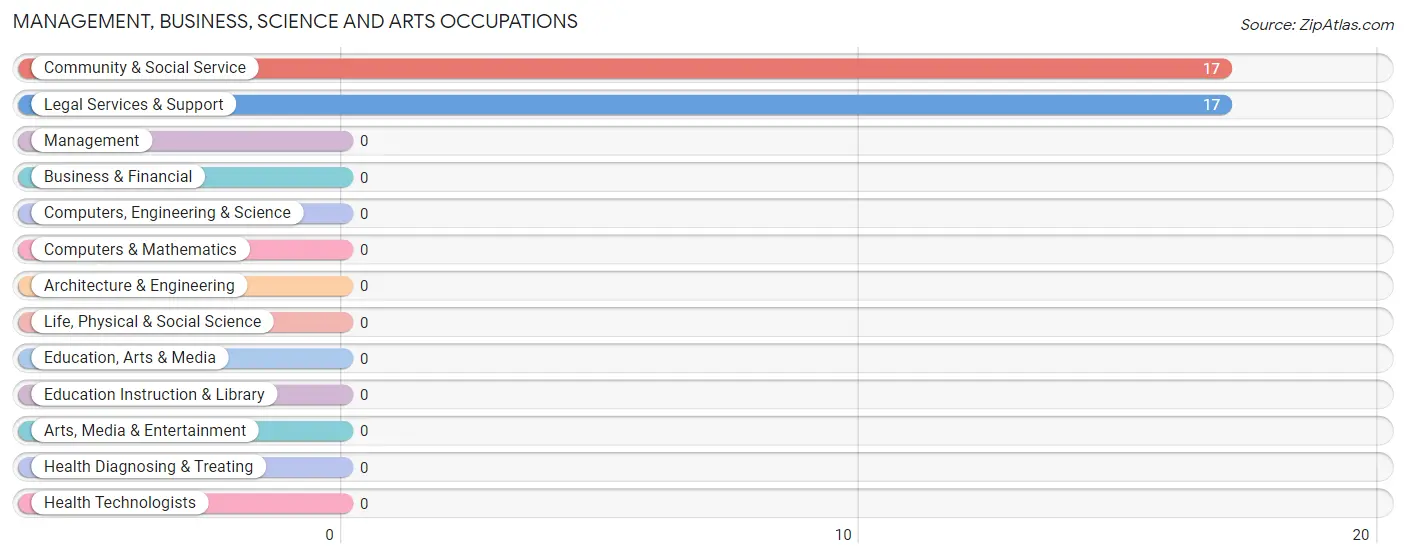
Management, Business, Science and Arts Occupations
The most common Management, Business, Science and Arts occupations in Porcupine are Community & Social Service (17 | 23.0%), and Legal Services & Support (17 | 23.0%).
Management, Business, Science and Arts Occupations by Sex
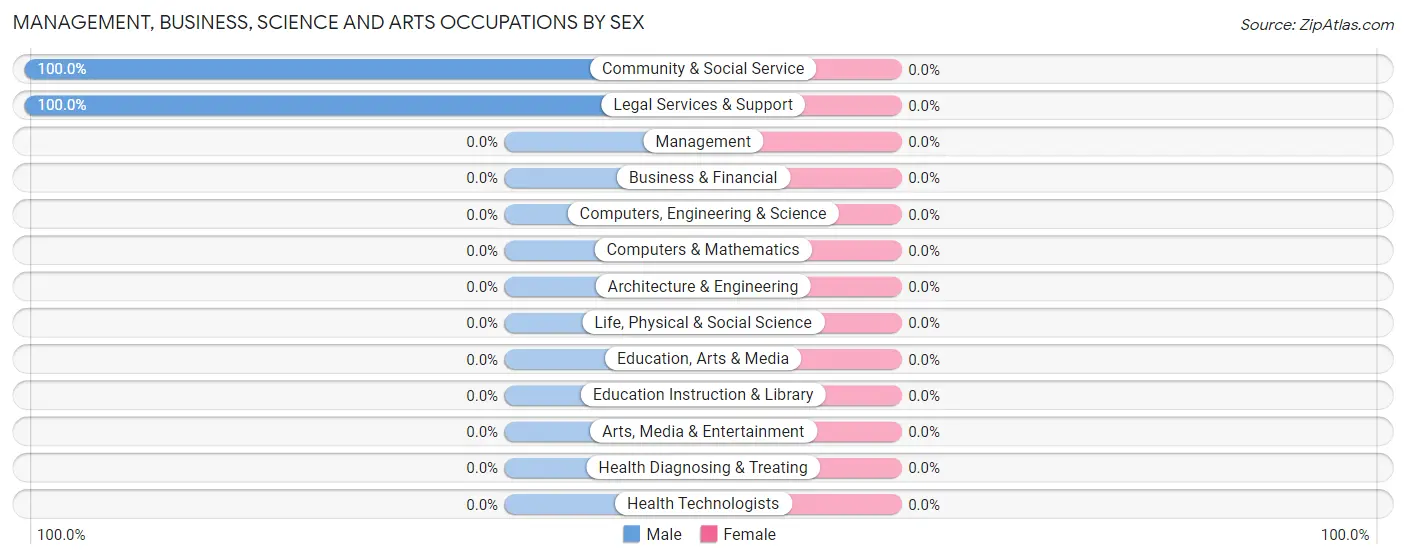
| Occupation | Male | Female |
| Management | 0 (0.0%) | 0 (0.0%) |
| Business & Financial | 0 (0.0%) | 0 (0.0%) |
| Computers, Engineering & Science | 0 (0.0%) | 0 (0.0%) |
| Computers & Mathematics | 0 (0.0%) | 0 (0.0%) |
| Architecture & Engineering | 0 (0.0%) | 0 (0.0%) |
| Life, Physical & Social Science | 0 (0.0%) | 0 (0.0%) |
| Community & Social Service | 17 (100.0%) | 0 (0.0%) |
| Education, Arts & Media | 0 (0.0%) | 0 (0.0%) |
| Legal Services & Support | 17 (100.0%) | 0 (0.0%) |
| Education Instruction & Library | 0 (0.0%) | 0 (0.0%) |
| Arts, Media & Entertainment | 0 (0.0%) | 0 (0.0%) |
| Health Diagnosing & Treating | 0 (0.0%) | 0 (0.0%) |
| Health Technologists | 0 (0.0%) | 0 (0.0%) |
| Total (Category) | 17 (100.0%) | 0 (0.0%) |
| Total (Overall) | 70 (94.6%) | 4 (5.4%) |
Services Occupations
Services Occupations by Sex
| Occupation | Male | Female |
| Healthcare Support | 0 (0.0%) | 0 (0.0%) |
| Security & Protection | 0 (0.0%) | 0 (0.0%) |
| Firefighting & Prevention | 0 (0.0%) | 0 (0.0%) |
| Law Enforcement | 0 (0.0%) | 0 (0.0%) |
| Food Preparation & Serving | 0 (0.0%) | 0 (0.0%) |
| Cleaning & Maintenance | 0 (0.0%) | 0 (0.0%) |
| Personal Care & Service | 0 (0.0%) | 0 (0.0%) |
| Total (Category) | 0 (0.0%) | 0 (0.0%) |
| Total (Overall) | 70 (94.6%) | 4 (5.4%) |
Sales and Office Occupations
The most common Sales and Office occupations in Porcupine are , and Office & Administration (4 | 5.4%).
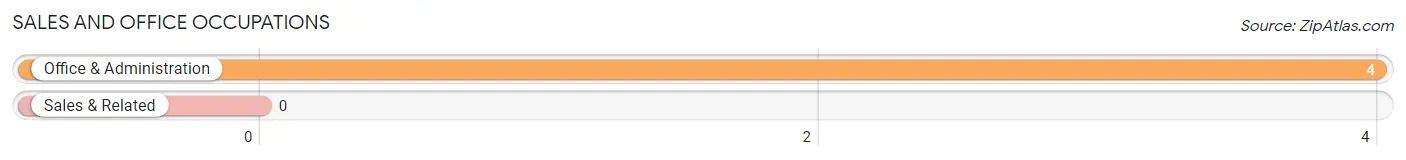
Sales and Office Occupations by Sex
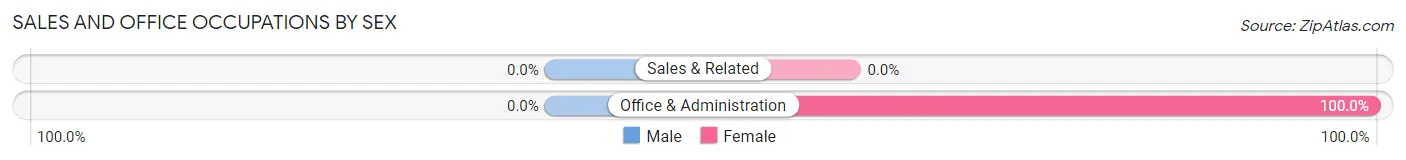
| Occupation | Male | Female |
| Sales & Related | 0 (0.0%) | 0 (0.0%) |
| Office & Administration | 0 (0.0%) | 4 (100.0%) |
| Total (Category) | 0 (0.0%) | 4 (100.0%) |
| Total (Overall) | 70 (94.6%) | 4 (5.4%) |
Natural Resources, Construction and Maintenance Occupations
The most common Natural Resources, Construction and Maintenance occupations in Porcupine are Farming, Fishing & Forestry (26 | 35.1%), and Installation, Maintenance & Repair (21 | 28.4%).
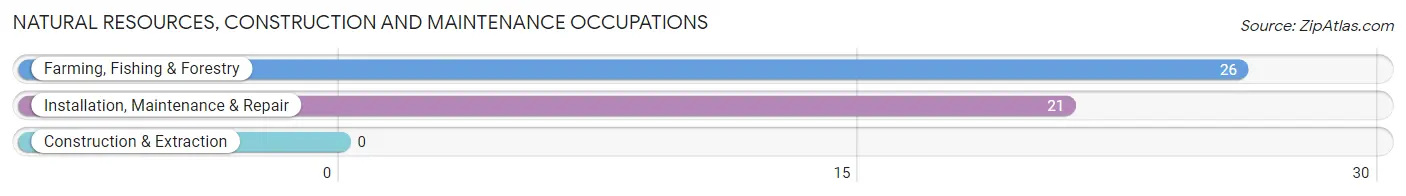
Natural Resources, Construction and Maintenance Occupations by Sex
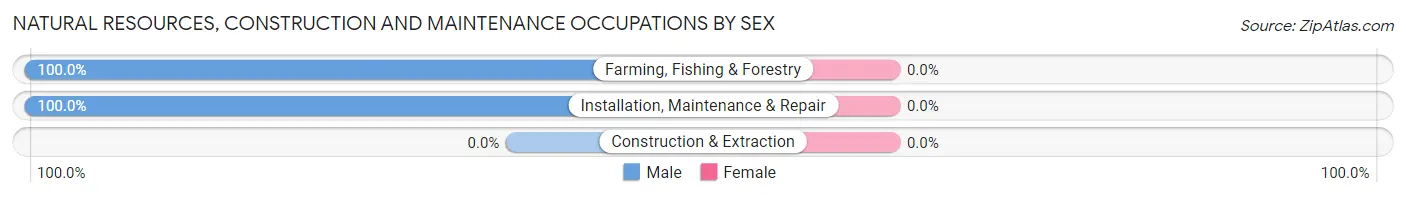
| Occupation | Male | Female |
| Farming, Fishing & Forestry | 26 (100.0%) | 0 (0.0%) |
| Construction & Extraction | 0 (0.0%) | 0 (0.0%) |
| Installation, Maintenance & Repair | 21 (100.0%) | 0 (0.0%) |
| Total (Category) | 47 (100.0%) | 0 (0.0%) |
| Total (Overall) | 70 (94.6%) | 4 (5.4%) |
Production, Transportation and Moving Occupations
The most common Production, Transportation and Moving occupations in Porcupine are , and Material Moving (6 | 8.1%).
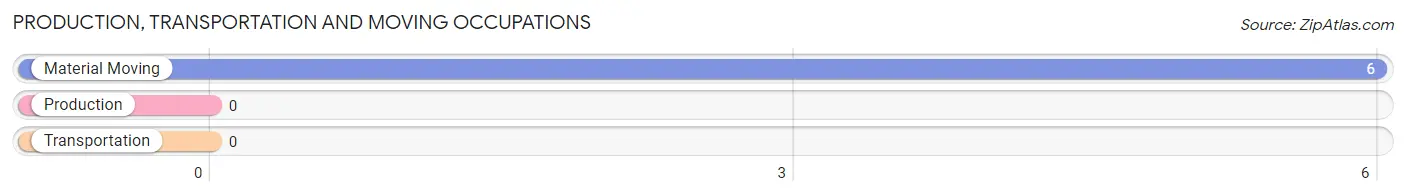
Production, Transportation and Moving Occupations by Sex
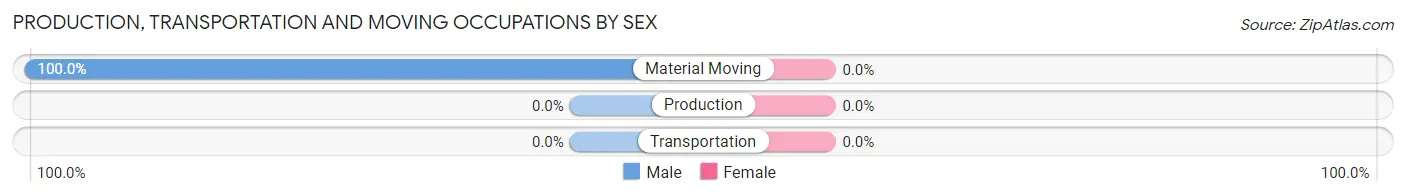
| Occupation | Male | Female |
| Production | 0 (0.0%) | 0 (0.0%) |
| Transportation | 0 (0.0%) | 0 (0.0%) |
| Material Moving | 6 (100.0%) | 0 (0.0%) |
| Total (Category) | 6 (100.0%) | 0 (0.0%) |
| Total (Overall) | 70 (94.6%) | 4 (5.4%) |
Employment Industries by Sex in Porcupine
Employment Industries in Porcupine
The major employment industries in Porcupine include Wholesale Trade (32 | 43.2%), Real Estate, Rental & Leasing (17 | 23.0%), and Administrative & Support (4 | 5.4%).
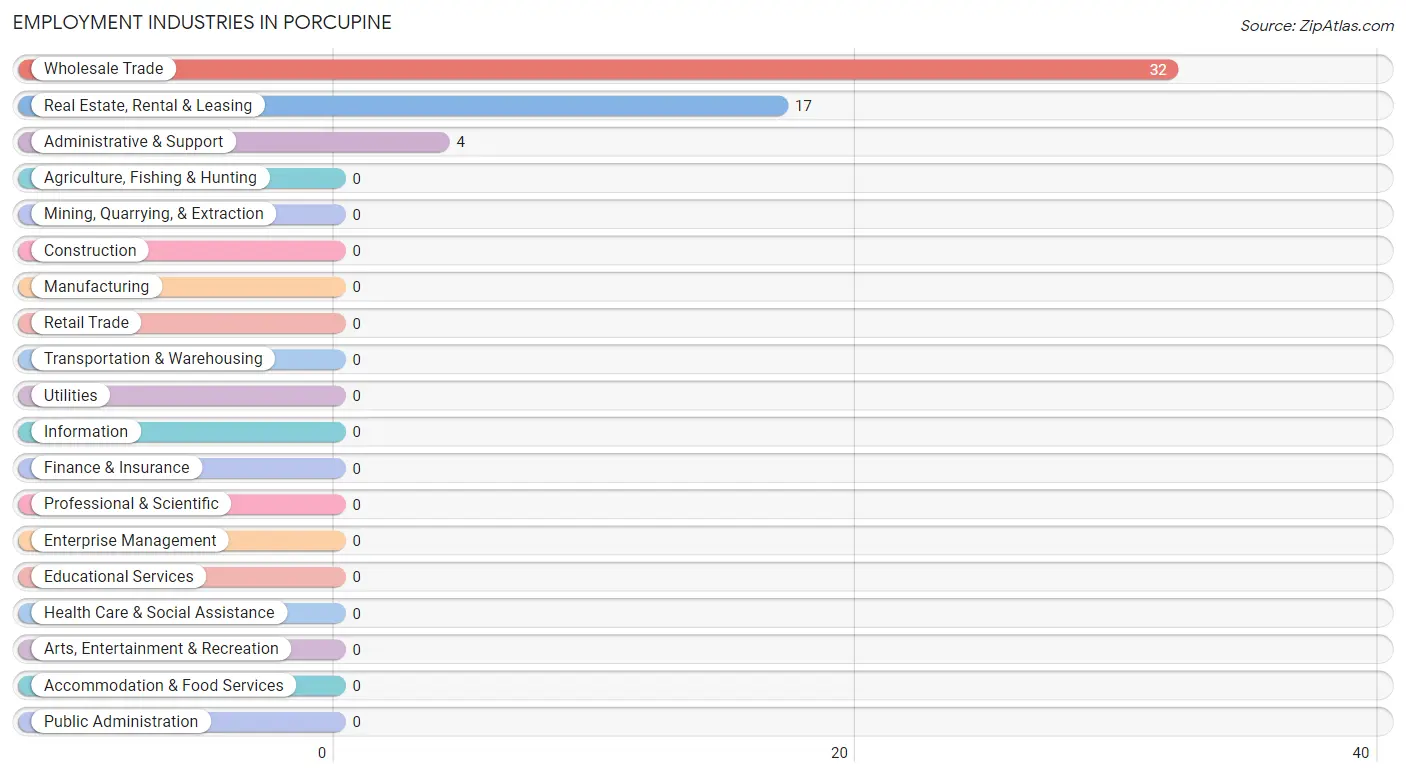
Employment Industries by Sex in Porcupine
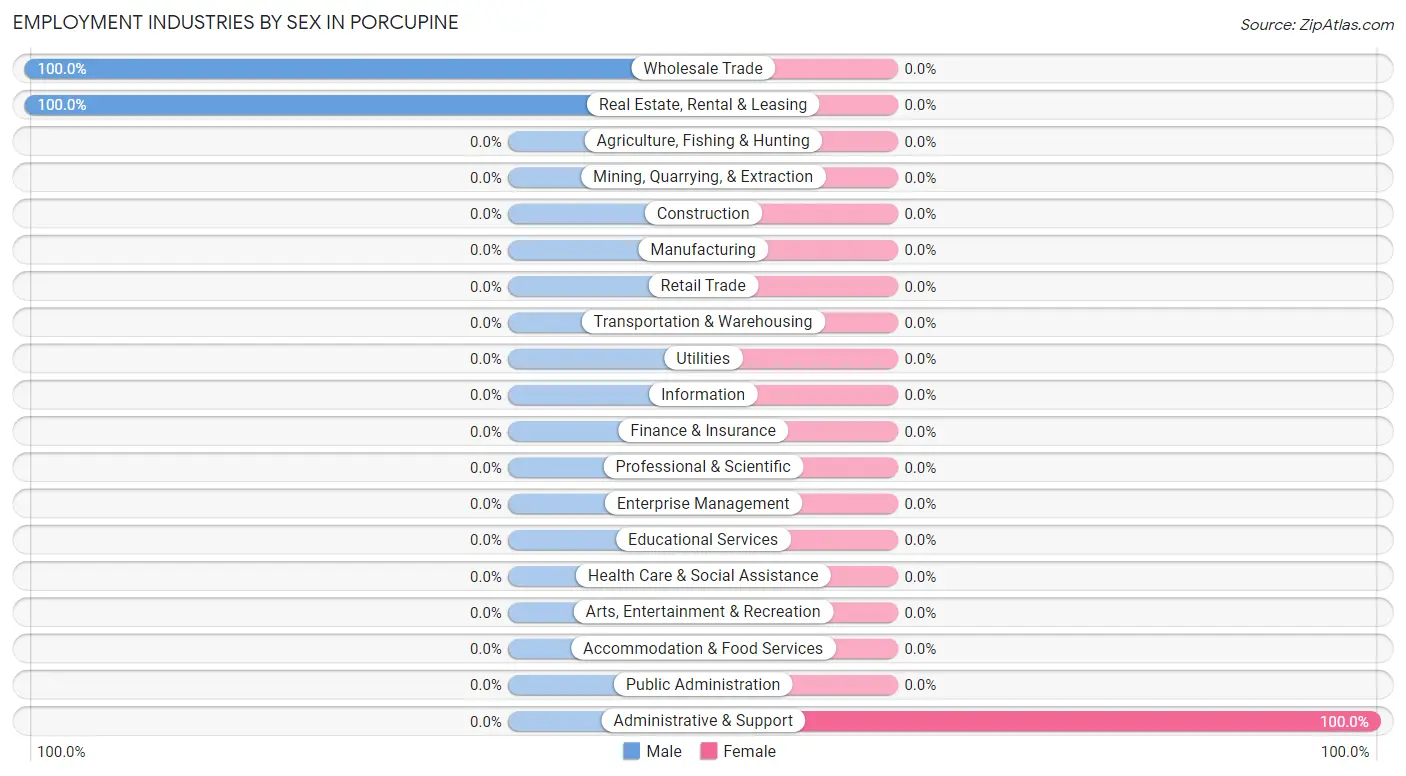
| Industry | Male | Female |
| Agriculture, Fishing & Hunting | 0 (0.0%) | 0 (0.0%) |
| Mining, Quarrying, & Extraction | 0 (0.0%) | 0 (0.0%) |
| Construction | 0 (0.0%) | 0 (0.0%) |
| Manufacturing | 0 (0.0%) | 0 (0.0%) |
| Wholesale Trade | 32 (100.0%) | 0 (0.0%) |
| Retail Trade | 0 (0.0%) | 0 (0.0%) |
| Transportation & Warehousing | 0 (0.0%) | 0 (0.0%) |
| Utilities | 0 (0.0%) | 0 (0.0%) |
| Information | 0 (0.0%) | 0 (0.0%) |
| Finance & Insurance | 0 (0.0%) | 0 (0.0%) |
| Real Estate, Rental & Leasing | 17 (100.0%) | 0 (0.0%) |
| Professional & Scientific | 0 (0.0%) | 0 (0.0%) |
| Enterprise Management | 0 (0.0%) | 0 (0.0%) |
| Administrative & Support | 0 (0.0%) | 4 (100.0%) |
| Educational Services | 0 (0.0%) | 0 (0.0%) |
| Health Care & Social Assistance | 0 (0.0%) | 0 (0.0%) |
| Arts, Entertainment & Recreation | 0 (0.0%) | 0 (0.0%) |
| Accommodation & Food Services | 0 (0.0%) | 0 (0.0%) |
| Public Administration | 0 (0.0%) | 0 (0.0%) |
| Total | 70 (94.6%) | 4 (5.4%) |
Education in Porcupine
School Enrollment in Porcupine
The most common levels of schooling among the 373 students in Porcupine are high school (127 | 34.1%), elementary school (85 | 22.8%), and middle school (77 | 20.6%).
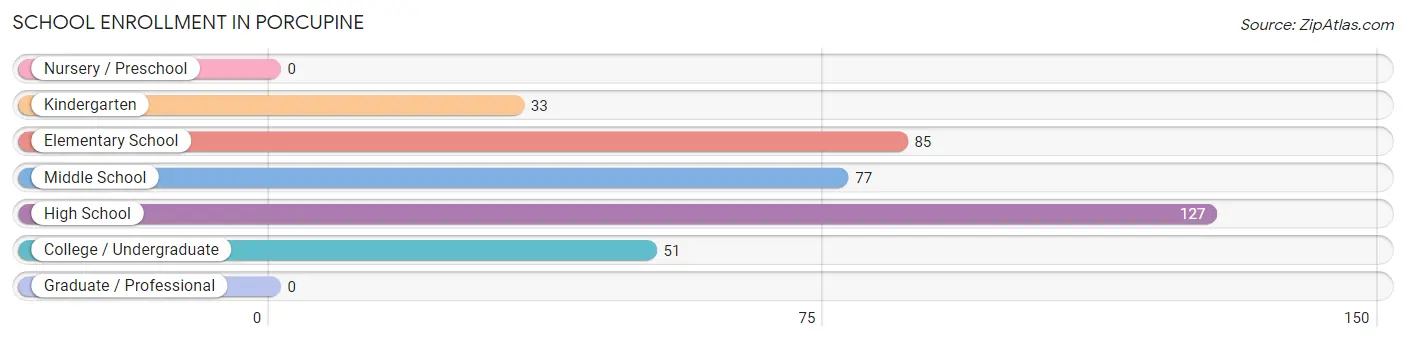
| School Level | # Students | % Students |
| Nursery / Preschool | 0 | 0.0% |
| Kindergarten | 33 | 8.8% |
| Elementary School | 85 | 22.8% |
| Middle School | 77 | 20.6% |
| High School | 127 | 34.1% |
| College / Undergraduate | 51 | 13.7% |
| Graduate / Professional | 0 | 0.0% |
| Total | 373 | 100.0% |
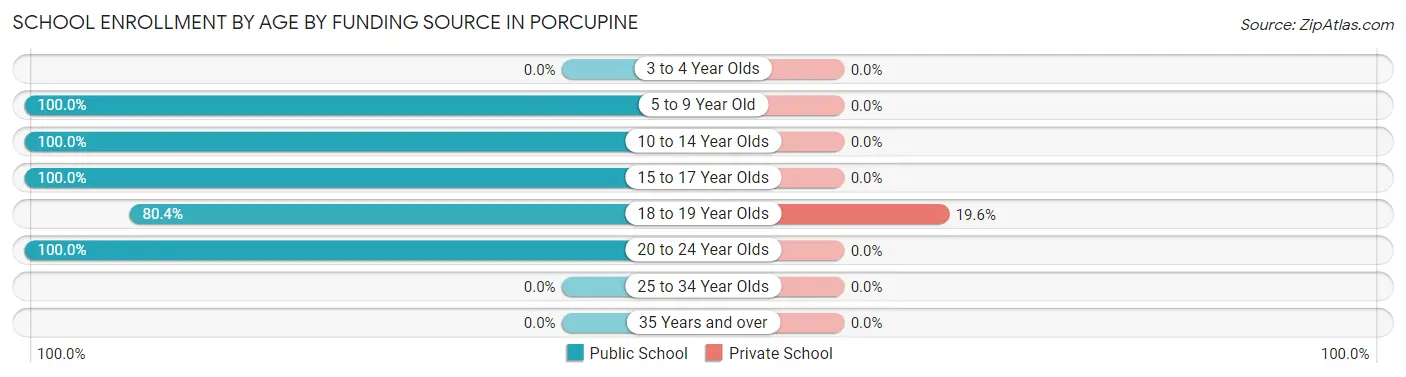
School Enrollment by Age by Funding Source in Porcupine
Out of a total of 373 students who are enrolled in schools in Porcupine, 9 (2.4%) attend a private institution, while the remaining 364 (97.6%) are enrolled in public schools. The age group of 18 to 19 year olds has the highest likelihood of being enrolled in private schools, with 9 (19.6% in the age bracket) enrolled. Conversely, the age group of 5 to 9 year old has the lowest likelihood of being enrolled in a private school, with 102 (100.0% in the age bracket) attending a public institution.
| Age Bracket | Public School | Private School |
| 3 to 4 Year Olds | 0 (0.0%) | 0 (0.0%) |
| 5 to 9 Year Old | 102 (100.0%) | 0 (0.0%) |
| 10 to 14 Year Olds | 93 (100.0%) | 0 (0.0%) |
| 15 to 17 Year Olds | 112 (100.0%) | 0 (0.0%) |
| 18 to 19 Year Olds | 37 (80.4%) | 9 (19.6%) |
| 20 to 24 Year Olds | 20 (100.0%) | 0 (0.0%) |
| 25 to 34 Year Olds | 0 (0.0%) | 0 (0.0%) |
| 35 Years and over | 0 (0.0%) | 0 (0.0%) |
| Total | 364 (97.6%) | 9 (2.4%) |
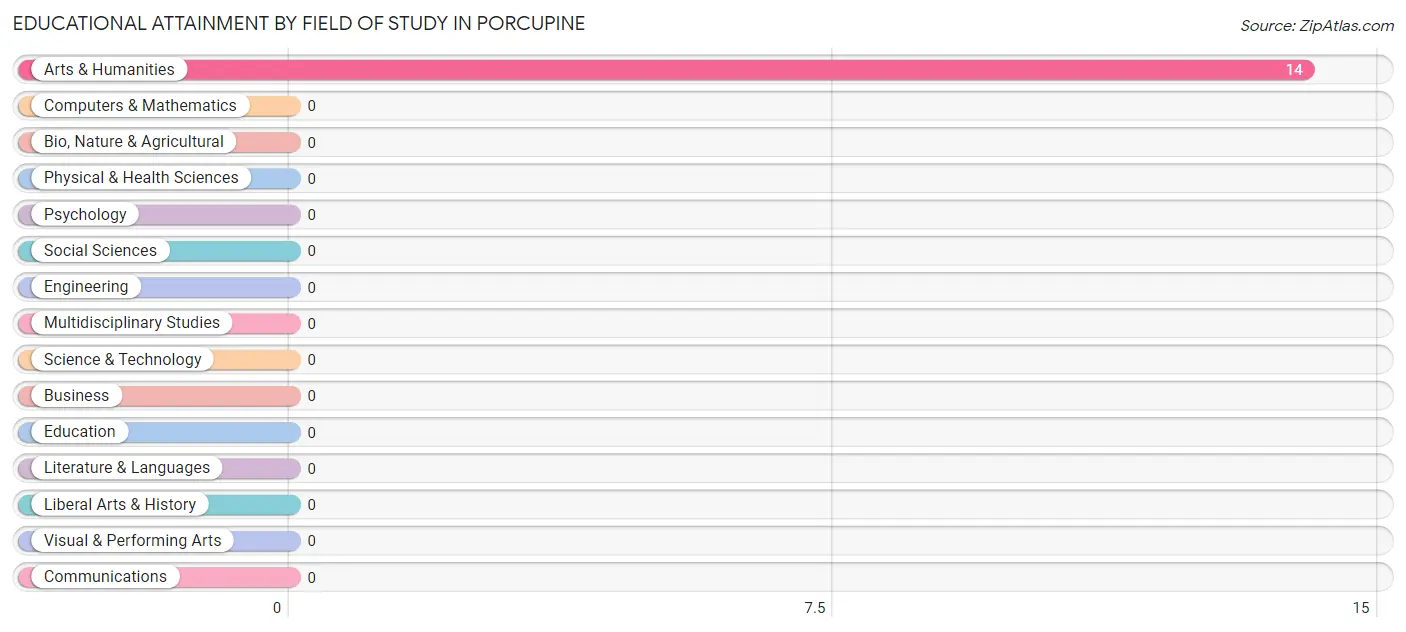
Educational Attainment by Field of Study in Porcupine
, and arts & humanities (14 | 100.0%) are the most common fields of study among 14 individuals in Porcupine who have obtained a bachelor's degree or higher.
| Field of Study | # Graduates | % Graduates |
| Computers & Mathematics | 0 | 0.0% |
| Bio, Nature & Agricultural | 0 | 0.0% |
| Physical & Health Sciences | 0 | 0.0% |
| Psychology | 0 | 0.0% |
| Social Sciences | 0 | 0.0% |
| Engineering | 0 | 0.0% |
| Multidisciplinary Studies | 0 | 0.0% |
| Science & Technology | 0 | 0.0% |
| Business | 0 | 0.0% |
| Education | 0 | 0.0% |
| Literature & Languages | 0 | 0.0% |
| Liberal Arts & History | 0 | 0.0% |
| Visual & Performing Arts | 0 | 0.0% |
| Communications | 0 | 0.0% |
| Arts & Humanities | 14 | 100.0% |
| Total | 14 | 100.0% |
Transportation & Commute in Porcupine
Vehicle Availability by Sex in Porcupine
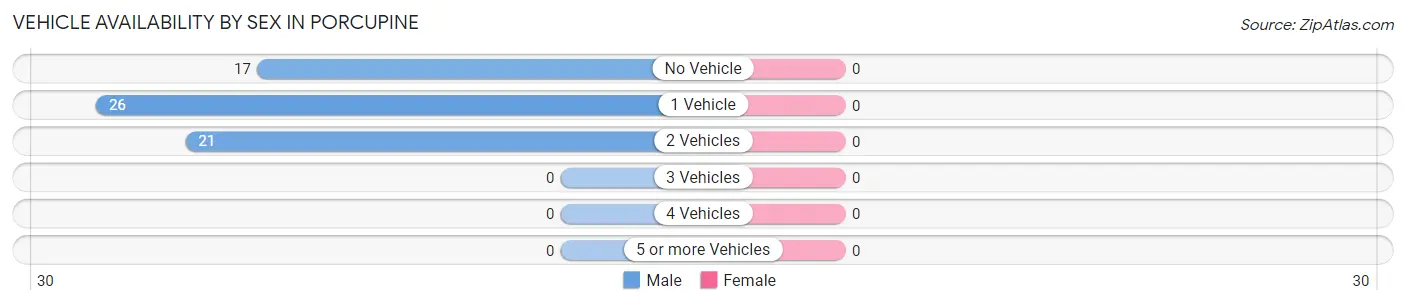
| Vehicles Available | Male | Female |
| No Vehicle | 17 (26.6%) | 0 (0.0%) |
| 1 Vehicle | 26 (40.6%) | 0 (0.0%) |
| 2 Vehicles | 21 (32.8%) | 0 (0.0%) |
| 3 Vehicles | 0 (0.0%) | 0 (0.0%) |
| 4 Vehicles | 0 (0.0%) | 0 (0.0%) |
| 5 or more Vehicles | 0 (0.0%) | 0 (0.0%) |
| Total | 64 (100.0%) | 0 (0.0%) |
Commute Time in Porcupine
The most frequently occuring commute durations in Porcupine are 45 to 59 minutes (43 commuters, 61.4%), 5 to 9 minutes (27 commuters, 38.6%), and less than 5 minutes (0 commuters, 0.0%).
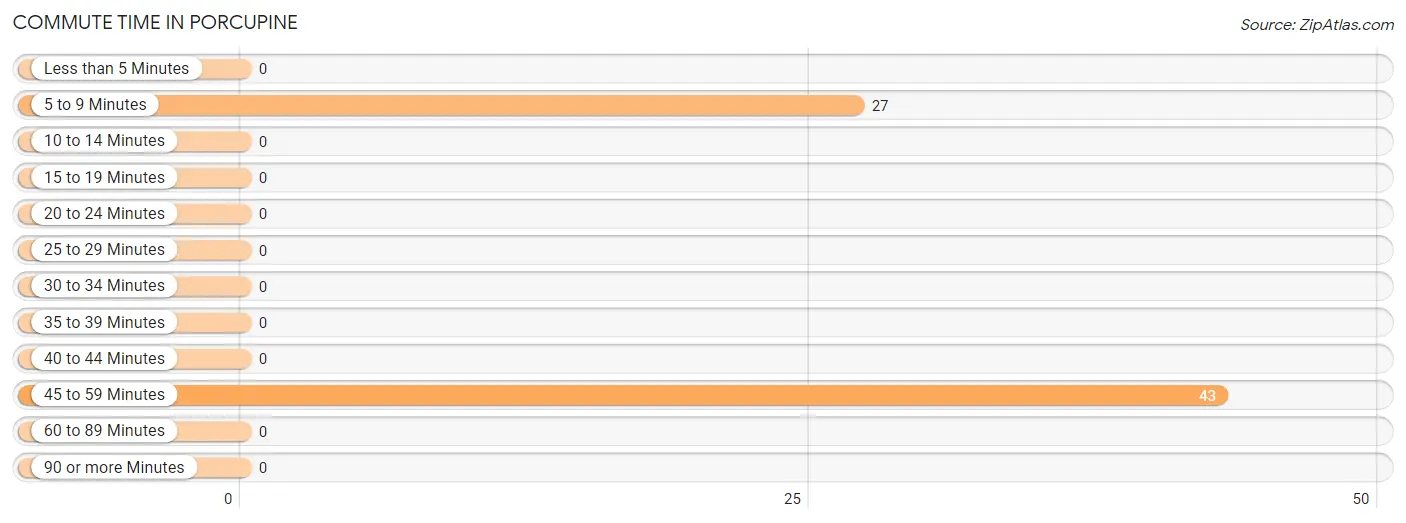
| Commute Time | # Commuters | % Commuters |
| Less than 5 Minutes | 0 | 0.0% |
| 5 to 9 Minutes | 27 | 38.6% |
| 10 to 14 Minutes | 0 | 0.0% |
| 15 to 19 Minutes | 0 | 0.0% |
| 20 to 24 Minutes | 0 | 0.0% |
| 25 to 29 Minutes | 0 | 0.0% |
| 30 to 34 Minutes | 0 | 0.0% |
| 35 to 39 Minutes | 0 | 0.0% |
| 40 to 44 Minutes | 0 | 0.0% |
| 45 to 59 Minutes | 43 | 61.4% |
| 60 to 89 Minutes | 0 | 0.0% |
| 90 or more Minutes | 0 | 0.0% |
Commute Time by Sex in Porcupine
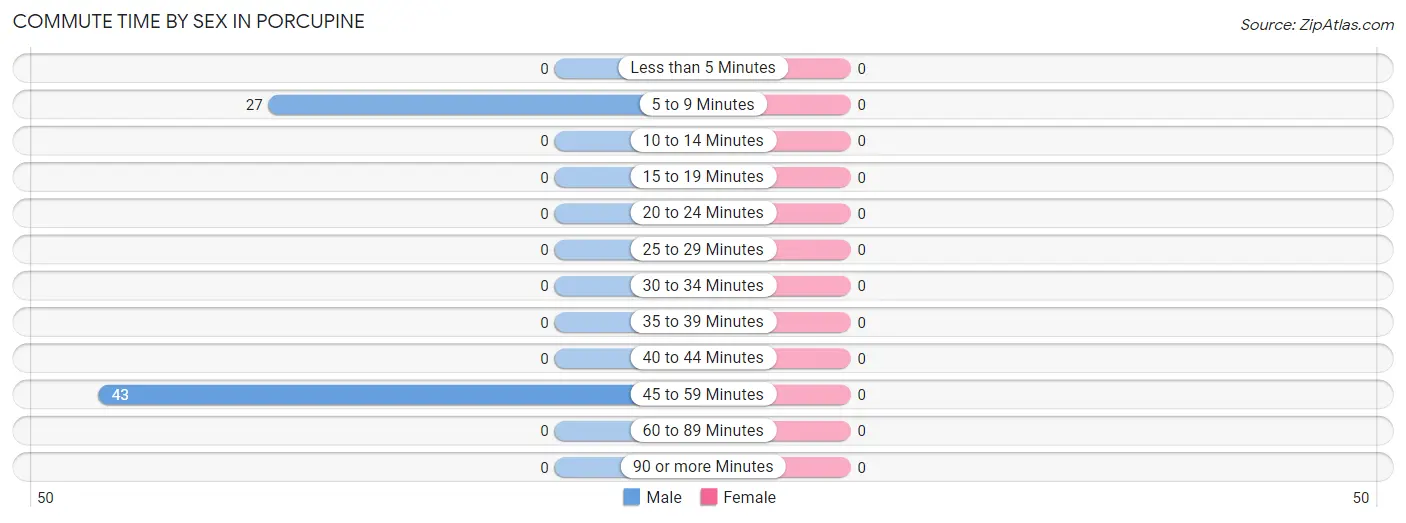
| Commute Time | Male | Female |
| Less than 5 Minutes | 0 (0.0%) | 0 (0.0%) |
| 5 to 9 Minutes | 27 (38.6%) | 0 (0.0%) |
| 10 to 14 Minutes | 0 (0.0%) | 0 (0.0%) |
| 15 to 19 Minutes | 0 (0.0%) | 0 (0.0%) |
| 20 to 24 Minutes | 0 (0.0%) | 0 (0.0%) |
| 25 to 29 Minutes | 0 (0.0%) | 0 (0.0%) |
| 30 to 34 Minutes | 0 (0.0%) | 0 (0.0%) |
| 35 to 39 Minutes | 0 (0.0%) | 0 (0.0%) |
| 40 to 44 Minutes | 0 (0.0%) | 0 (0.0%) |
| 45 to 59 Minutes | 43 (61.4%) | 0 (0.0%) |
| 60 to 89 Minutes | 0 (0.0%) | 0 (0.0%) |
| 90 or more Minutes | 0 (0.0%) | 0 (0.0%) |
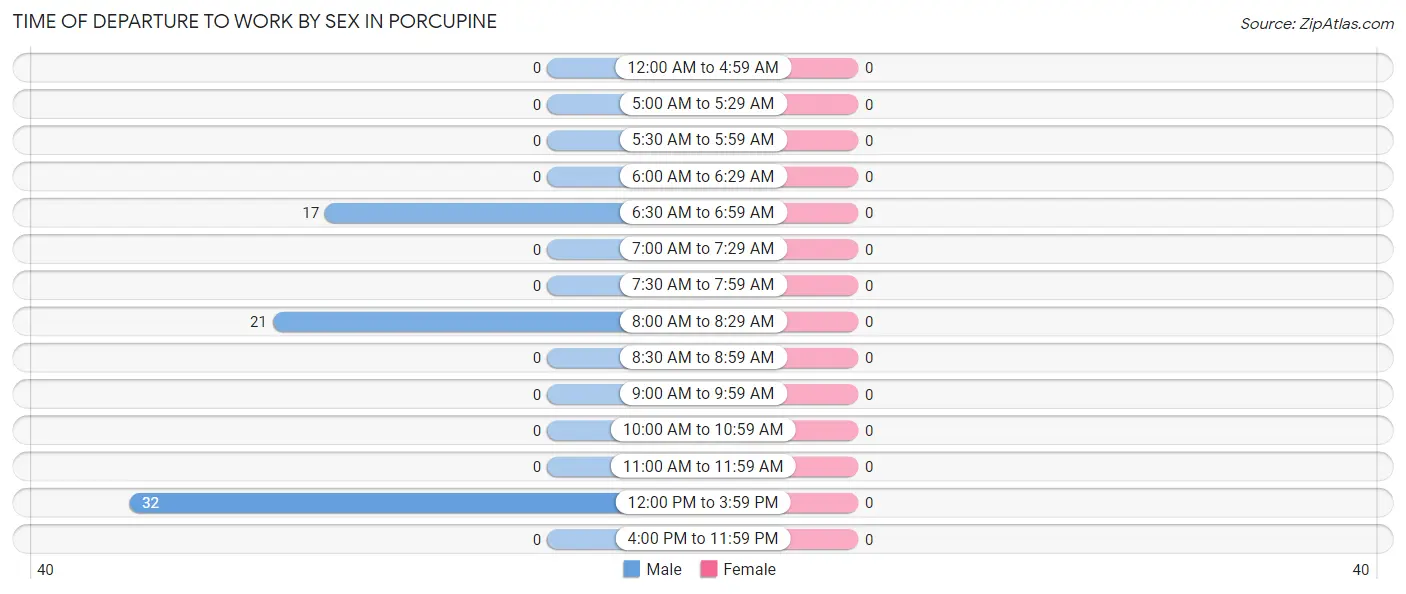
Time of Departure to Work by Sex in Porcupine
| Time of Departure | Male | Female |
| 12:00 AM to 4:59 AM | 0 (0.0%) | 0 (0.0%) |
| 5:00 AM to 5:29 AM | 0 (0.0%) | 0 (0.0%) |
| 5:30 AM to 5:59 AM | 0 (0.0%) | 0 (0.0%) |
| 6:00 AM to 6:29 AM | 0 (0.0%) | 0 (0.0%) |
| 6:30 AM to 6:59 AM | 17 (24.3%) | 0 (0.0%) |
| 7:00 AM to 7:29 AM | 0 (0.0%) | 0 (0.0%) |
| 7:30 AM to 7:59 AM | 0 (0.0%) | 0 (0.0%) |
| 8:00 AM to 8:29 AM | 21 (30.0%) | 0 (0.0%) |
| 8:30 AM to 8:59 AM | 0 (0.0%) | 0 (0.0%) |
| 9:00 AM to 9:59 AM | 0 (0.0%) | 0 (0.0%) |
| 10:00 AM to 10:59 AM | 0 (0.0%) | 0 (0.0%) |
| 11:00 AM to 11:59 AM | 0 (0.0%) | 0 (0.0%) |
| 12:00 PM to 3:59 PM | 32 (45.7%) | 0 (0.0%) |
| 4:00 PM to 11:59 PM | 0 (0.0%) | 0 (0.0%) |
| Total | 70 (100.0%) | 0 (0.0%) |
Housing Occupancy in Porcupine
Occupancy by Ownership in Porcupine
Of the total 278 dwellings in Porcupine, owner-occupied units account for 206 (74.1%), while renter-occupied units make up 72 (25.9%).
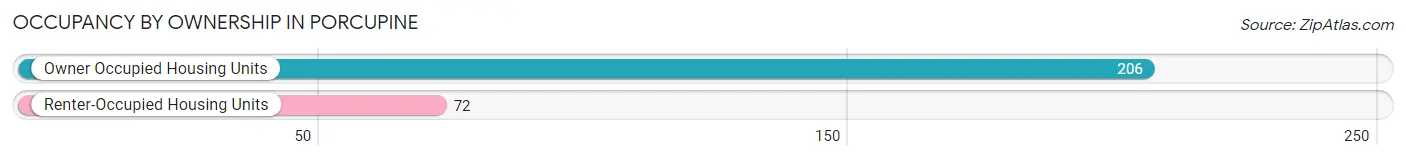
| Occupancy | # Housing Units | % Housing Units |
| Owner Occupied Housing Units | 206 | 74.1% |
| Renter-Occupied Housing Units | 72 | 25.9% |
| Total Occupied Housing Units | 278 | 100.0% |
Occupancy by Household Size in Porcupine
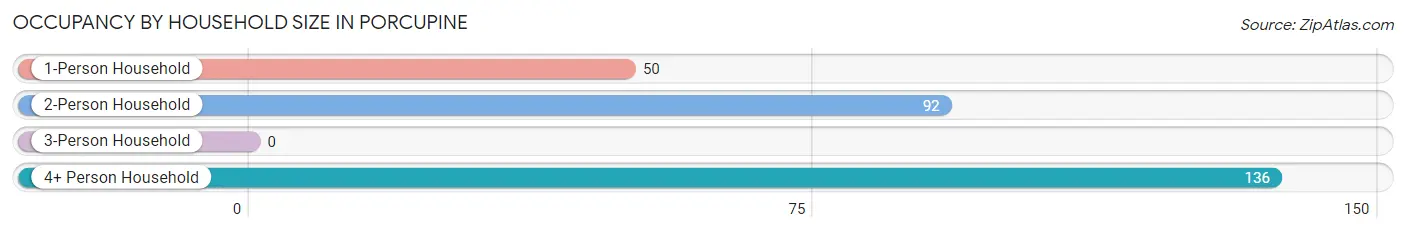
| Household Size | # Housing Units | % Housing Units |
| 1-Person Household | 50 | 18.0% |
| 2-Person Household | 92 | 33.1% |
| 3-Person Household | 0 | 0.0% |
| 4+ Person Household | 136 | 48.9% |
| Total Housing Units | 278 | 100.0% |
Occupancy by Ownership by Household Size in Porcupine
| Household Size | Owner-occupied | Renter-occupied |
| 1-Person Household | 50 (100.0%) | 0 (0.0%) |
| 2-Person Household | 92 (100.0%) | 0 (0.0%) |
| 3-Person Household | 0 (0.0%) | 0 (0.0%) |
| 4+ Person Household | 64 (47.1%) | 72 (52.9%) |
| Total Housing Units | 206 (74.1%) | 72 (25.9%) |
Occupancy by Educational Attainment in Porcupine
| Household Size | Owner-occupied | Renter-occupied |
| Less than High School | 43 (67.2%) | 21 (32.8%) |
| High School Diploma | 96 (76.2%) | 30 (23.8%) |
| College/Associate Degree | 66 (75.9%) | 21 (24.1%) |
| Bachelor's Degree or higher | 1 (100.0%) | 0 (0.0%) |
Occupancy by Age of Householder in Porcupine
| Age Bracket | # Households | % Households |
| Under 35 Years | 0 | 0.0% |
| 35 to 44 Years | 46 | 16.6% |
| 45 to 54 Years | 52 | 18.7% |
| 55 to 64 Years | 65 | 23.4% |
| 65 to 74 Years | 114 | 41.0% |
| 75 to 84 Years | 1 | 0.4% |
| 85 Years and Over | 0 | 0.0% |
| Total | 278 | 100.0% |
Housing Finances in Porcupine
Median Income by Occupancy in Porcupine
| Occupancy Type | # Households | Median Income |
| Owner-Occupied | 206 (74.1%) | $13,913 |
| Renter-Occupied | 72 (25.9%) | $33,214 |
| Average | 278 (100.0%) | $18,750 |
Occupancy by Householder Income Bracket in Porcupine
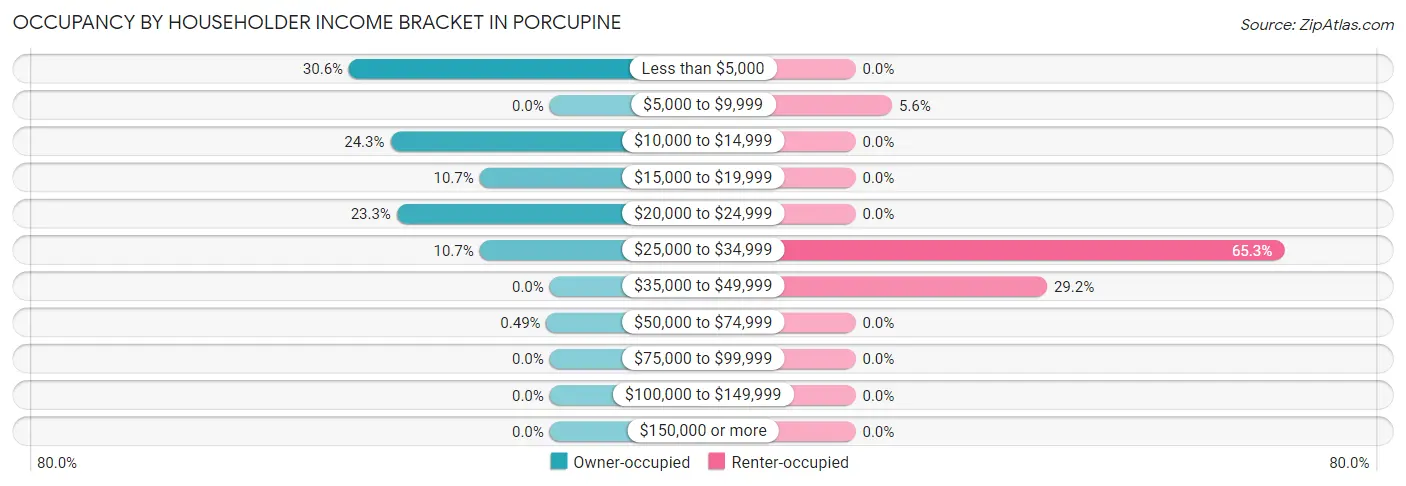
| Income Bracket | Owner-occupied | Renter-occupied |
| Less than $5,000 | 63 (30.6%) | 0 (0.0%) |
| $5,000 to $9,999 | 0 (0.0%) | 4 (5.6%) |
| $10,000 to $14,999 | 50 (24.3%) | 0 (0.0%) |
| $15,000 to $19,999 | 22 (10.7%) | 0 (0.0%) |
| $20,000 to $24,999 | 48 (23.3%) | 0 (0.0%) |
| $25,000 to $34,999 | 22 (10.7%) | 47 (65.3%) |
| $35,000 to $49,999 | 0 (0.0%) | 21 (29.2%) |
| $50,000 to $74,999 | 1 (0.5%) | 0 (0.0%) |
| $75,000 to $99,999 | 0 (0.0%) | 0 (0.0%) |
| $100,000 to $149,999 | 0 (0.0%) | 0 (0.0%) |
| $150,000 or more | 0 (0.0%) | 0 (0.0%) |
| Total | 206 (100.0%) | 72 (100.0%) |
Monthly Housing Cost Tiers in Porcupine
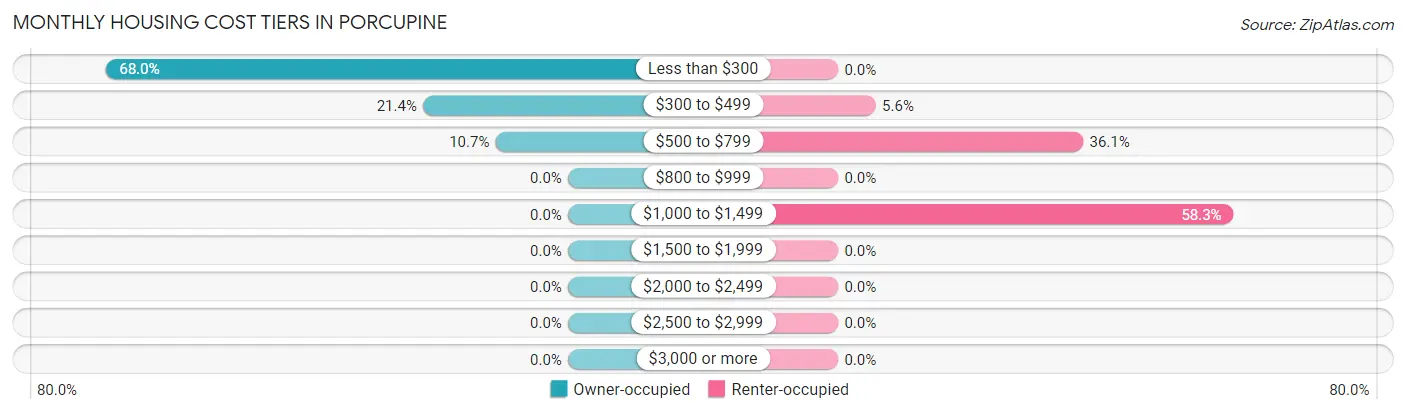
| Monthly Cost | Owner-occupied | Renter-occupied |
| Less than $300 | 140 (68.0%) | 0 (0.0%) |
| $300 to $499 | 44 (21.4%) | 4 (5.6%) |
| $500 to $799 | 22 (10.7%) | 26 (36.1%) |
| $800 to $999 | 0 (0.0%) | 0 (0.0%) |
| $1,000 to $1,499 | 0 (0.0%) | 42 (58.3%) |
| $1,500 to $1,999 | 0 (0.0%) | 0 (0.0%) |
| $2,000 to $2,499 | 0 (0.0%) | 0 (0.0%) |
| $2,500 to $2,999 | 0 (0.0%) | 0 (0.0%) |
| $3,000 or more | 0 (0.0%) | 0 (0.0%) |
| Total | 206 (100.0%) | 72 (100.0%) |
Physical Housing Characteristics in Porcupine
Housing Structures in Porcupine
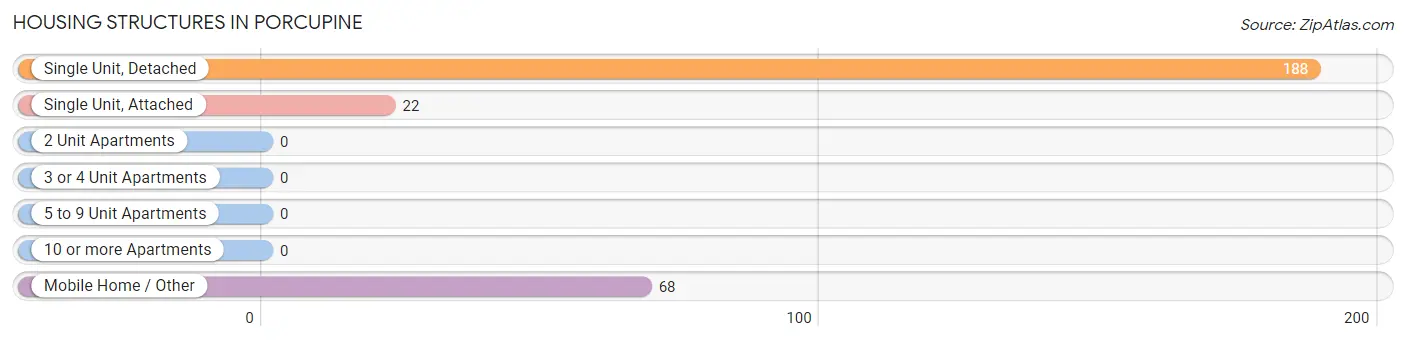
| Structure Type | # Housing Units | % Housing Units |
| Single Unit, Detached | 188 | 67.6% |
| Single Unit, Attached | 22 | 7.9% |
| 2 Unit Apartments | 0 | 0.0% |
| 3 or 4 Unit Apartments | 0 | 0.0% |
| 5 to 9 Unit Apartments | 0 | 0.0% |
| 10 or more Apartments | 0 | 0.0% |
| Mobile Home / Other | 68 | 24.5% |
| Total | 278 | 100.0% |
Housing Structures by Occupancy in Porcupine
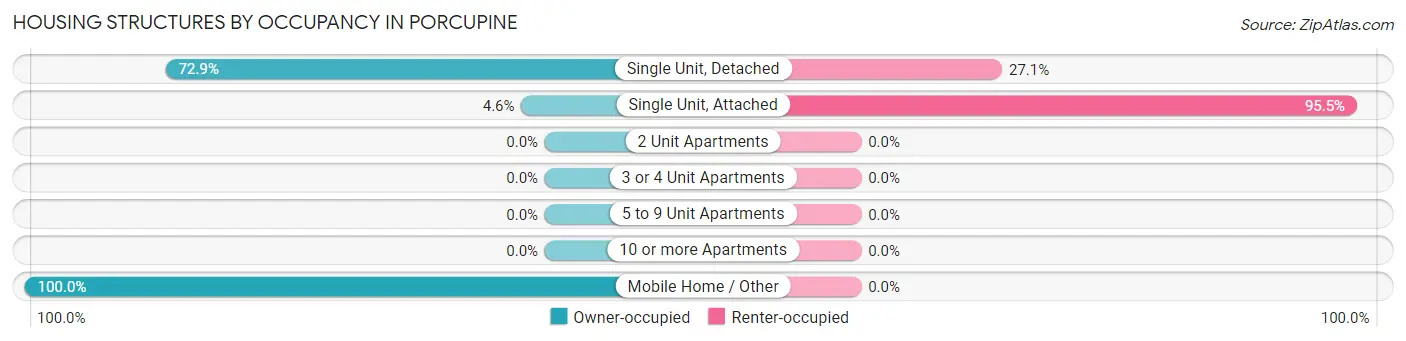
| Structure Type | Owner-occupied | Renter-occupied |
| Single Unit, Detached | 137 (72.9%) | 51 (27.1%) |
| Single Unit, Attached | 1 (4.5%) | 21 (95.5%) |
| 2 Unit Apartments | 0 (0.0%) | 0 (0.0%) |
| 3 or 4 Unit Apartments | 0 (0.0%) | 0 (0.0%) |
| 5 to 9 Unit Apartments | 0 (0.0%) | 0 (0.0%) |
| 10 or more Apartments | 0 (0.0%) | 0 (0.0%) |
| Mobile Home / Other | 68 (100.0%) | 0 (0.0%) |
| Total | 206 (74.1%) | 72 (25.9%) |
Housing Structures by Number of Rooms in Porcupine
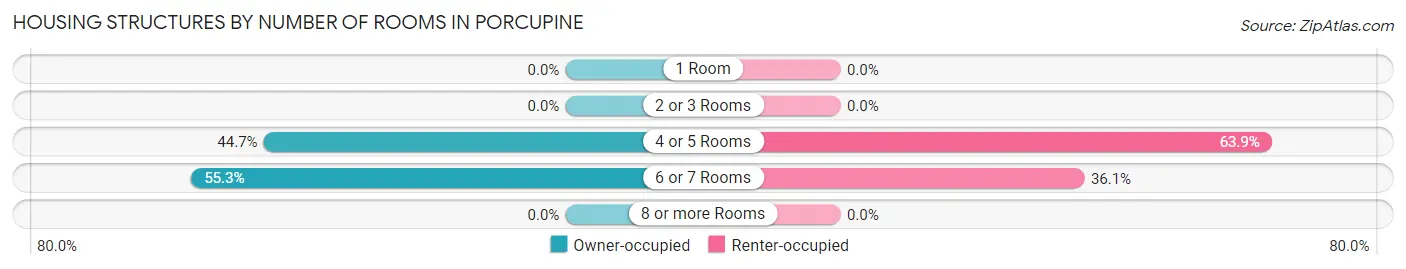
| Number of Rooms | Owner-occupied | Renter-occupied |
| 1 Room | 0 (0.0%) | 0 (0.0%) |
| 2 or 3 Rooms | 0 (0.0%) | 0 (0.0%) |
| 4 or 5 Rooms | 92 (44.7%) | 46 (63.9%) |
| 6 or 7 Rooms | 114 (55.3%) | 26 (36.1%) |
| 8 or more Rooms | 0 (0.0%) | 0 (0.0%) |
| Total | 206 (100.0%) | 72 (100.0%) |
Housing Structure by Heating Type in Porcupine
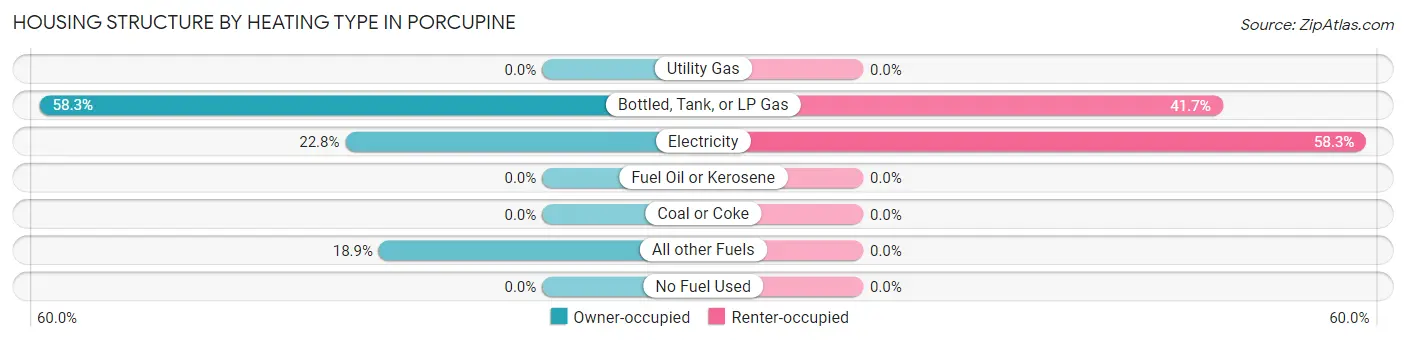
| Heating Type | Owner-occupied | Renter-occupied |
| Utility Gas | 0 (0.0%) | 0 (0.0%) |
| Bottled, Tank, or LP Gas | 120 (58.3%) | 30 (41.7%) |
| Electricity | 47 (22.8%) | 42 (58.3%) |
| Fuel Oil or Kerosene | 0 (0.0%) | 0 (0.0%) |
| Coal or Coke | 0 (0.0%) | 0 (0.0%) |
| All other Fuels | 39 (18.9%) | 0 (0.0%) |
| No Fuel Used | 0 (0.0%) | 0 (0.0%) |
| Total | 206 (100.0%) | 72 (100.0%) |
Household Vehicle Usage in Porcupine
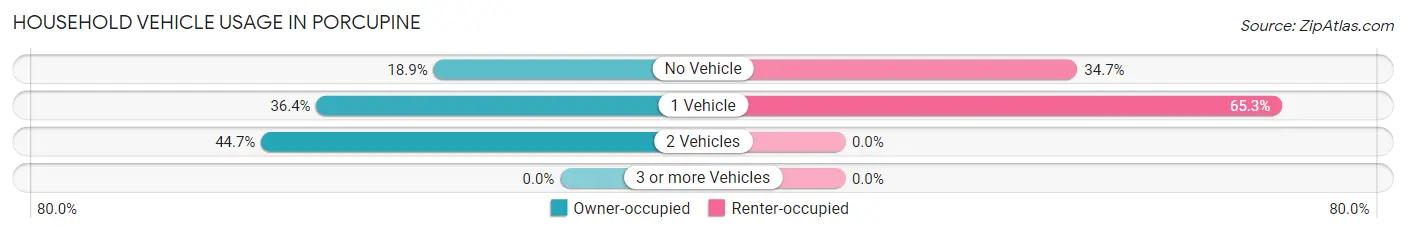
| Vehicles per Household | Owner-occupied | Renter-occupied |
| No Vehicle | 39 (18.9%) | 25 (34.7%) |
| 1 Vehicle | 75 (36.4%) | 47 (65.3%) |
| 2 Vehicles | 92 (44.7%) | 0 (0.0%) |
| 3 or more Vehicles | 0 (0.0%) | 0 (0.0%) |
| Total | 206 (100.0%) | 72 (100.0%) |
Real Estate & Mortgages in Porcupine
Real Estate and Mortgage Overview in Porcupine
| Characteristic | Without Mortgage | With Mortgage |
| Housing Units | 206 | 0 |
| Median Property Value | - | - |
| Median Household Income | $13,913 | $0 |
| Monthly Housing Costs | $240 | $0 |
| Real Estate Taxes | - | - |
Property Value by Mortgage Status in Porcupine
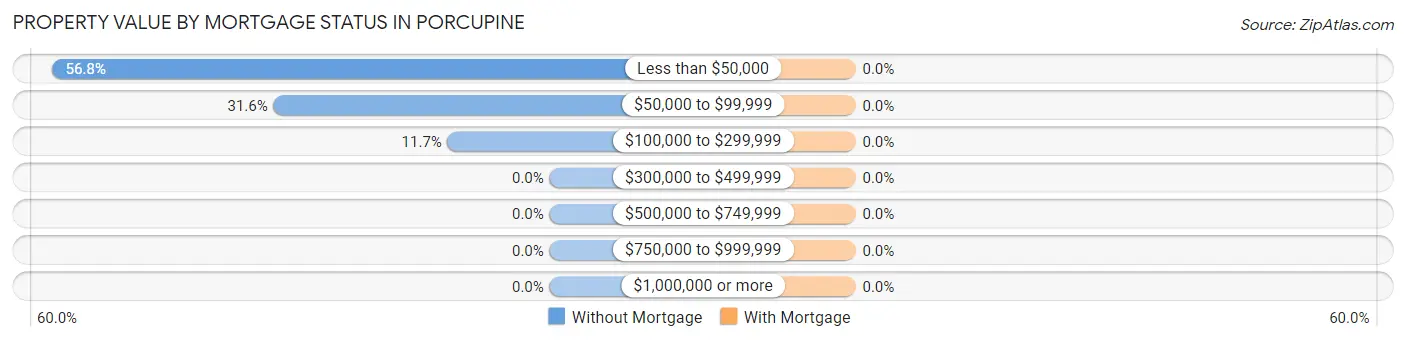
| Property Value | Without Mortgage | With Mortgage |
| Less than $50,000 | 117 (56.8%) | 0 (0.0%) |
| $50,000 to $99,999 | 65 (31.6%) | 0 (0.0%) |
| $100,000 to $299,999 | 24 (11.7%) | 0 (0.0%) |
| $300,000 to $499,999 | 0 (0.0%) | 0 (0.0%) |
| $500,000 to $749,999 | 0 (0.0%) | 0 (0.0%) |
| $750,000 to $999,999 | 0 (0.0%) | 0 (0.0%) |
| $1,000,000 or more | 0 (0.0%) | 0 (0.0%) |
| Total | 206 (100.0%) | 0 (0.0%) |
Household Income by Mortgage Status in Porcupine
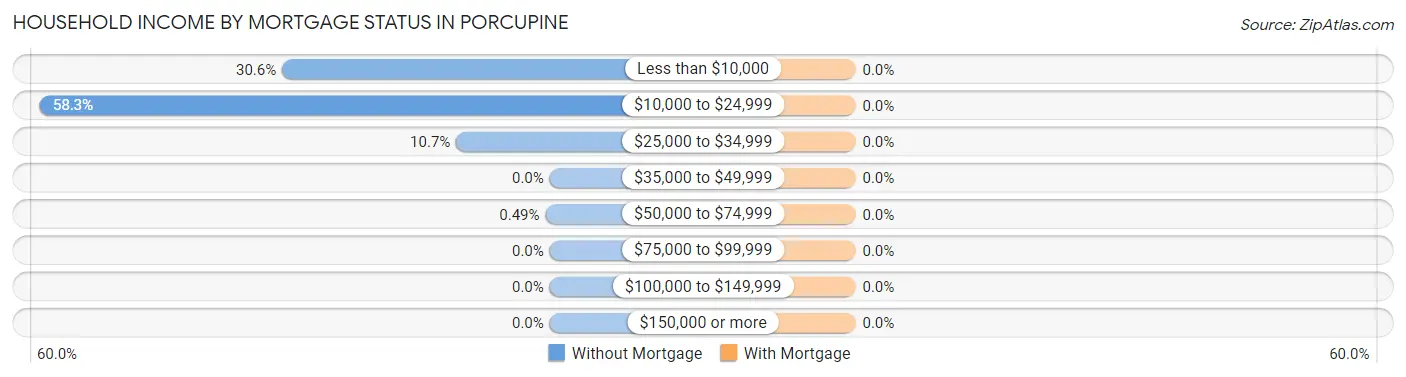
| Household Income | Without Mortgage | With Mortgage |
| Less than $10,000 | 63 (30.6%) | 0 (0.0%) |
| $10,000 to $24,999 | 120 (58.3%) | 0 (0.0%) |
| $25,000 to $34,999 | 22 (10.7%) | 0 (0.0%) |
| $35,000 to $49,999 | 0 (0.0%) | 0 (0.0%) |
| $50,000 to $74,999 | 1 (0.5%) | 0 (0.0%) |
| $75,000 to $99,999 | 0 (0.0%) | 0 (0.0%) |
| $100,000 to $149,999 | 0 (0.0%) | 0 (0.0%) |
| $150,000 or more | 0 (0.0%) | 0 (0.0%) |
| Total | 206 (100.0%) | 0 (0.0%) |
Property Value to Household Income Ratio in Porcupine
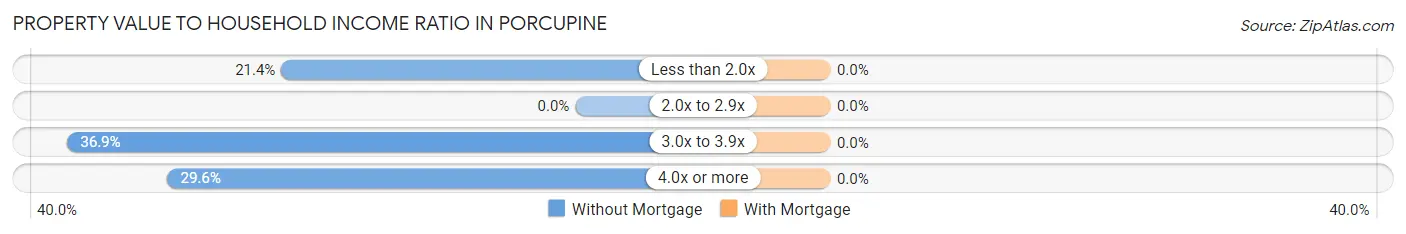
| Value-to-Income Ratio | Without Mortgage | With Mortgage |
| Less than 2.0x | 44 (21.4%) | 0 (0.0%) |
| 2.0x to 2.9x | 0 (0.0%) | 0 (0.0%) |
| 3.0x to 3.9x | 76 (36.9%) | 0 (0.0%) |
| 4.0x or more | 61 (29.6%) | 0 (0.0%) |
| Total | 206 (100.0%) | 0 (0.0%) |
Real Estate Taxes by Mortgage Status in Porcupine
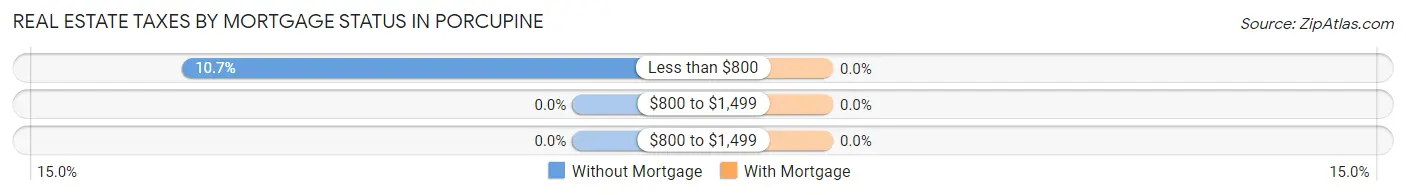
| Property Taxes | Without Mortgage | With Mortgage |
| Less than $800 | 22 (10.7%) | 0 (0.0%) |
| $800 to $1,499 | 0 (0.0%) | 0 (0.0%) |
| $800 to $1,499 | 0 (0.0%) | 0 (0.0%) |
| Total | 206 (100.0%) | 0 (0.0%) |
Health & Disability in Porcupine
Health Insurance Coverage by Age in Porcupine
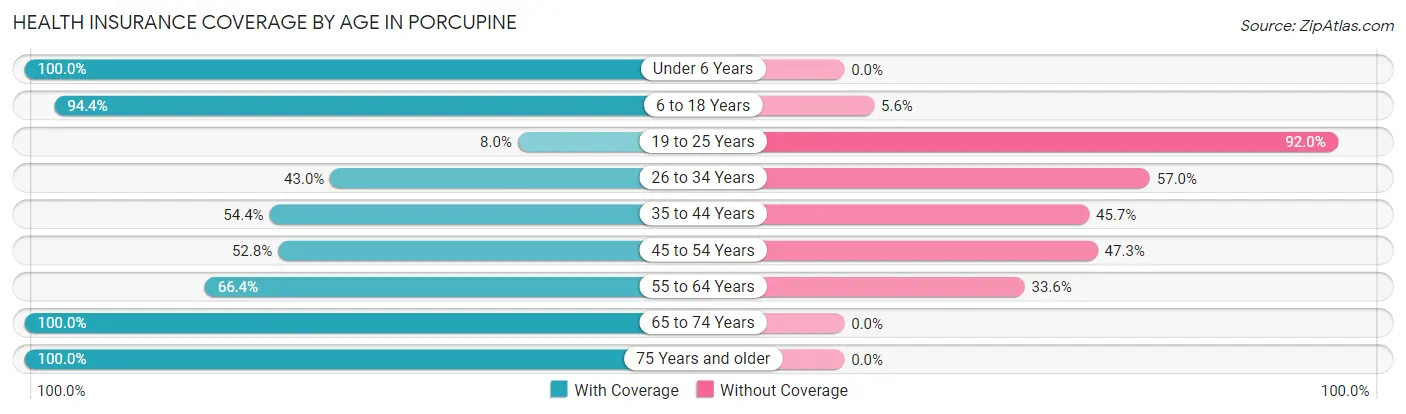
| Age Bracket | With Coverage | Without Coverage |
| Under 6 Years | 110 (100.0%) | 0 (0.0%) |
| 6 to 18 Years | 323 (94.4%) | 19 (5.6%) |
| 19 to 25 Years | 9 (8.0%) | 103 (92.0%) |
| 26 to 34 Years | 37 (43.0%) | 49 (57.0%) |
| 35 to 44 Years | 25 (54.3%) | 21 (45.7%) |
| 45 to 54 Years | 48 (52.7%) | 43 (47.2%) |
| 55 to 64 Years | 79 (66.4%) | 40 (33.6%) |
| 65 to 74 Years | 114 (100.0%) | 0 (0.0%) |
| 75 Years and older | 1 (100.0%) | 0 (0.0%) |
| Total | 746 (73.1%) | 275 (26.9%) |
Health Insurance Coverage by Citizenship Status in Porcupine
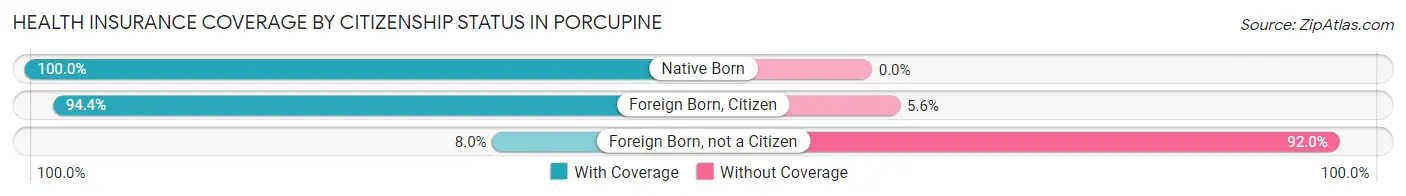
| Citizenship Status | With Coverage | Without Coverage |
| Native Born | 110 (100.0%) | 0 (0.0%) |
| Foreign Born, Citizen | 323 (94.4%) | 19 (5.6%) |
| Foreign Born, not a Citizen | 9 (8.0%) | 103 (92.0%) |
Health Insurance Coverage by Household Income in Porcupine
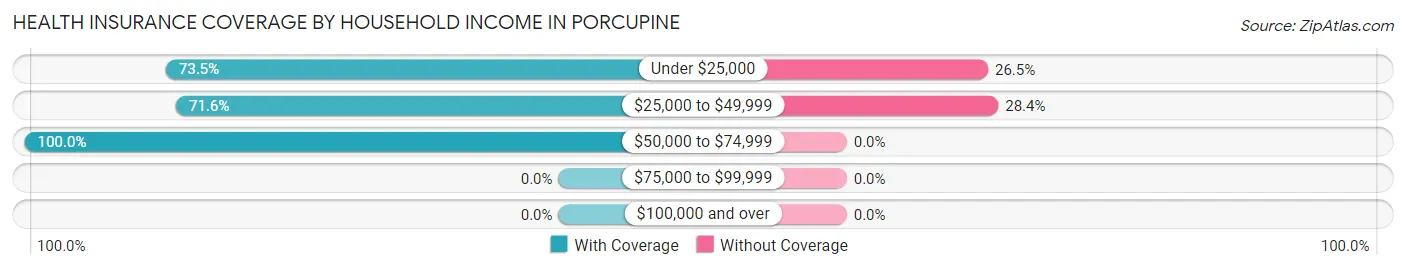
| Household Income | With Coverage | Without Coverage |
| Under $25,000 | 350 (73.5%) | 126 (26.5%) |
| $25,000 to $49,999 | 376 (71.6%) | 149 (28.4%) |
| $50,000 to $74,999 | 1 (100.0%) | 0 (0.0%) |
| $75,000 to $99,999 | 0 (0.0%) | 0 (0.0%) |
| $100,000 and over | 0 (0.0%) | 0 (0.0%) |
Public vs Private Health Insurance Coverage by Age in Porcupine
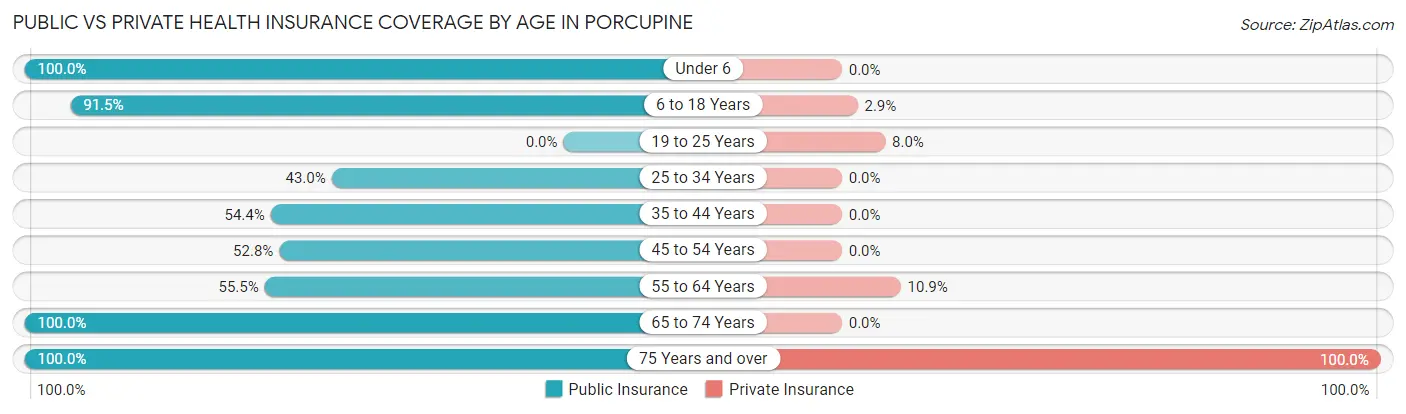
| Age Bracket | Public Insurance | Private Insurance |
| Under 6 | 110 (100.0%) | 0 (0.0%) |
| 6 to 18 Years | 313 (91.5%) | 10 (2.9%) |
| 19 to 25 Years | 0 (0.0%) | 9 (8.0%) |
| 25 to 34 Years | 37 (43.0%) | 0 (0.0%) |
| 35 to 44 Years | 25 (54.3%) | 0 (0.0%) |
| 45 to 54 Years | 48 (52.7%) | 0 (0.0%) |
| 55 to 64 Years | 66 (55.5%) | 13 (10.9%) |
| 65 to 74 Years | 114 (100.0%) | 0 (0.0%) |
| 75 Years and over | 1 (100.0%) | 1 (100.0%) |
| Total | 714 (69.9%) | 33 (3.2%) |
Disability Status by Sex by Age in Porcupine
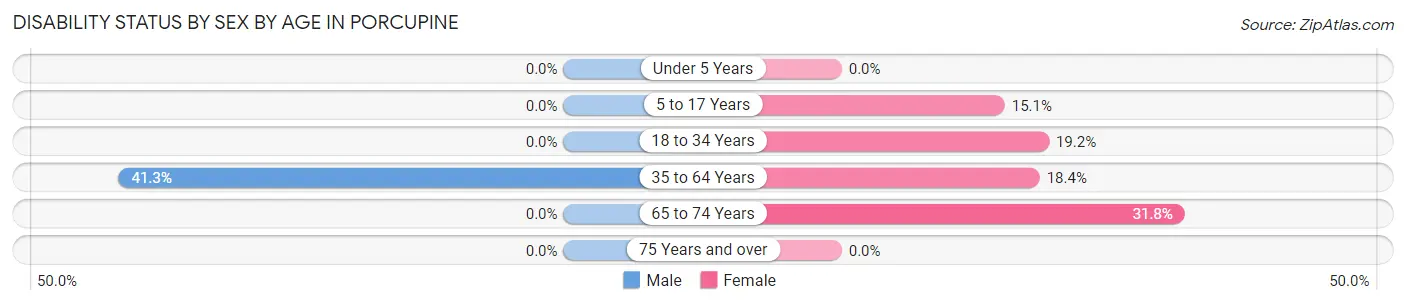
| Age Bracket | Male | Female |
| Under 5 Years | 0 (0.0%) | 0 (0.0%) |
| 5 to 17 Years | 0 (0.0%) | 23 (15.1%) |
| 18 to 34 Years | 0 (0.0%) | 20 (19.2%) |
| 35 to 64 Years | 45 (41.3%) | 27 (18.4%) |
| 65 to 74 Years | 0 (0.0%) | 21 (31.8%) |
| 75 Years and over | 0 (0.0%) | 0 (0.0%) |
Disability Class by Sex by Age in Porcupine
Disability Class: Hearing Difficulty
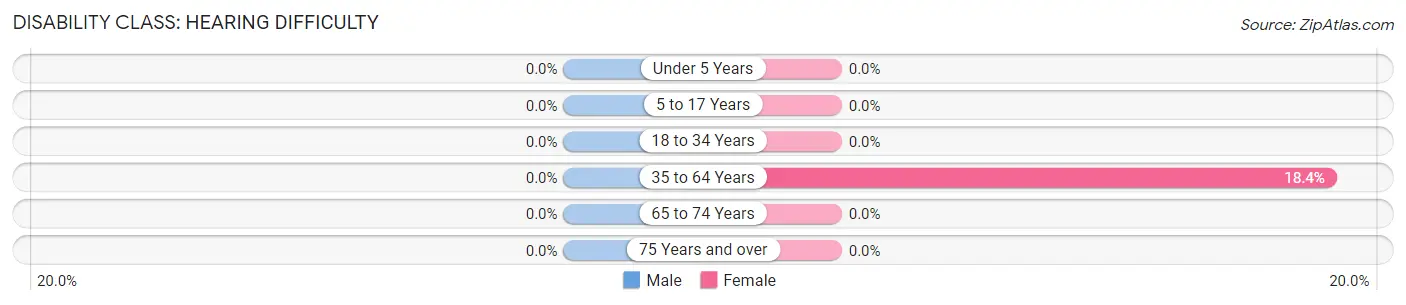
| Age Bracket | Male | Female |
| Under 5 Years | 0 (0.0%) | 0 (0.0%) |
| 5 to 17 Years | 0 (0.0%) | 0 (0.0%) |
| 18 to 34 Years | 0 (0.0%) | 0 (0.0%) |
| 35 to 64 Years | 0 (0.0%) | 27 (18.4%) |
| 65 to 74 Years | 0 (0.0%) | 0 (0.0%) |
| 75 Years and over | 0 (0.0%) | 0 (0.0%) |
Disability Class: Vision Difficulty
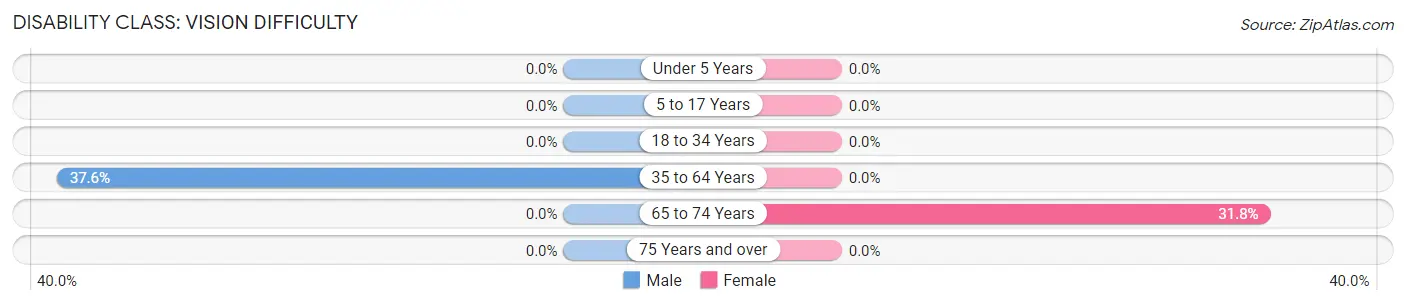
| Age Bracket | Male | Female |
| Under 5 Years | 0 (0.0%) | 0 (0.0%) |
| 5 to 17 Years | 0 (0.0%) | 0 (0.0%) |
| 18 to 34 Years | 0 (0.0%) | 0 (0.0%) |
| 35 to 64 Years | 41 (37.6%) | 0 (0.0%) |
| 65 to 74 Years | 0 (0.0%) | 21 (31.8%) |
| 75 Years and over | 0 (0.0%) | 0 (0.0%) |
Disability Class: Cognitive Difficulty
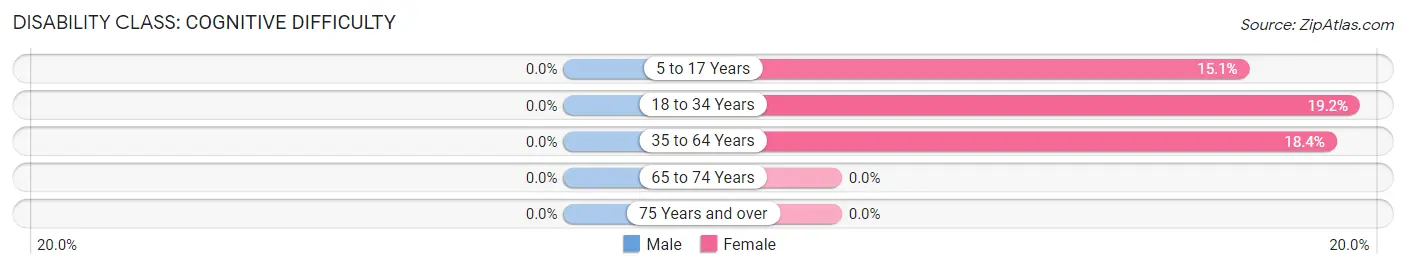
| Age Bracket | Male | Female |
| 5 to 17 Years | 0 (0.0%) | 23 (15.1%) |
| 18 to 34 Years | 0 (0.0%) | 20 (19.2%) |
| 35 to 64 Years | 0 (0.0%) | 27 (18.4%) |
| 65 to 74 Years | 0 (0.0%) | 0 (0.0%) |
| 75 Years and over | 0 (0.0%) | 0 (0.0%) |
Disability Class: Ambulatory Difficulty
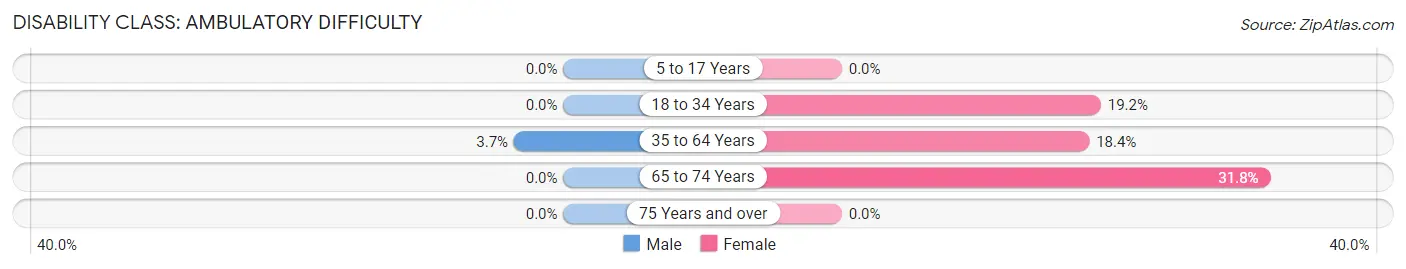
| Age Bracket | Male | Female |
| 5 to 17 Years | 0 (0.0%) | 0 (0.0%) |
| 18 to 34 Years | 0 (0.0%) | 20 (19.2%) |
| 35 to 64 Years | 4 (3.7%) | 27 (18.4%) |
| 65 to 74 Years | 0 (0.0%) | 21 (31.8%) |
| 75 Years and over | 0 (0.0%) | 0 (0.0%) |
Disability Class: Self-Care Difficulty
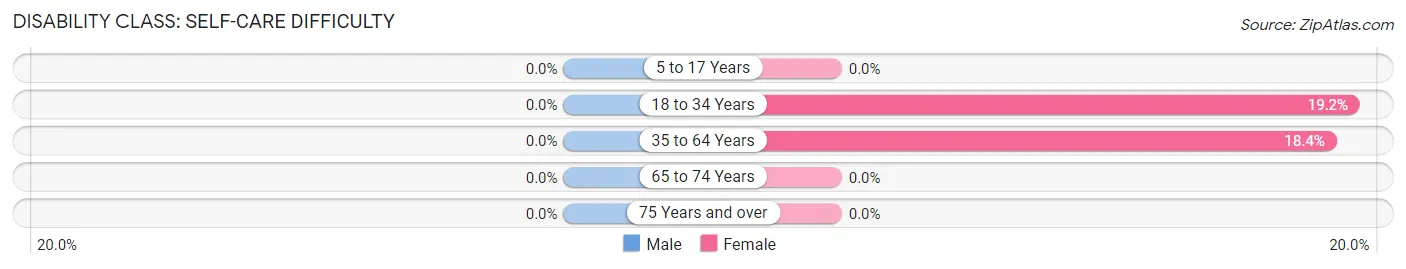
| Age Bracket | Male | Female |
| 5 to 17 Years | 0 (0.0%) | 0 (0.0%) |
| 18 to 34 Years | 0 (0.0%) | 20 (19.2%) |
| 35 to 64 Years | 0 (0.0%) | 27 (18.4%) |
| 65 to 74 Years | 0 (0.0%) | 0 (0.0%) |
| 75 Years and over | 0 (0.0%) | 0 (0.0%) |
Technology Access in Porcupine
Computing Device Access in Porcupine
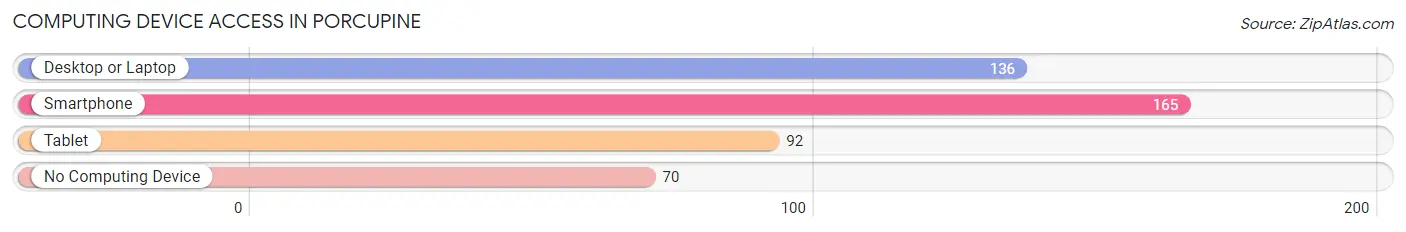
| Device Type | # Households | % Households |
| Desktop or Laptop | 136 | 48.9% |
| Smartphone | 165 | 59.4% |
| Tablet | 92 | 33.1% |
| No Computing Device | 70 | 25.2% |
| Total | 278 | 100.0% |
Internet Access in Porcupine
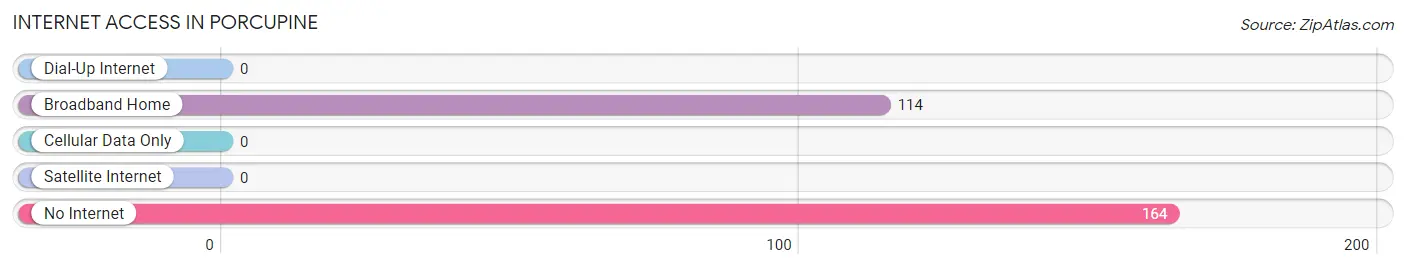
| Internet Type | # Households | % Households |
| Dial-Up Internet | 0 | 0.0% |
| Broadband Home | 114 | 41.0% |
| Cellular Data Only | 0 | 0.0% |
| Satellite Internet | 0 | 0.0% |
| No Internet | 164 | 59.0% |
| Total | 278 | 100.0% |
Porcupine Summary
Porcupine, South Dakota is a small town located in the southwestern corner of the state. It is situated in the heart of the Great Plains, and is surrounded by rolling hills and prairies. The town is located in Shannon County, and is part of the Pine Ridge Indian Reservation. The population of Porcupine was estimated to be around 1,000 people in 2000.
History
The town of Porcupine was founded in 1887 by a group of settlers from the nearby Pine Ridge Indian Reservation. The town was named after the porcupine, which was a common sight in the area. The settlers were attracted to the area due to its abundance of natural resources, including timber, water, and fertile soil.
The town quickly grew, and by the early 1900s, it had become a bustling community. The town was home to a variety of businesses, including a general store, a blacksmith, a hotel, and a saloon. The town also had a school, a post office, and a church.
In the early 1900s, the town was also home to a large number of Native Americans. The town was a popular destination for Native Americans from the nearby Pine Ridge Indian Reservation, who would come to town to trade and socialize.
Geography
Porcupine is located in the southwestern corner of South Dakota, in Shannon County. The town is situated in the heart of the Great Plains, and is surrounded by rolling hills and prairies. The town is located near the White River, which is a tributary of the Missouri River.
The town is located at an elevation of 3,400 feet, and has a total area of 0.7 square miles. The town has a semi-arid climate, with hot summers and cold winters. The average annual temperature is around 50 degrees Fahrenheit.
Economy
The economy of Porcupine is largely based on agriculture. The town is home to a variety of farms, which produce a variety of crops, including wheat, corn, and hay. The town is also home to a number of small businesses, including a general store, a hotel, and a saloon.
The town is also home to a number of Native American businesses, including a casino, a gas station, and a convenience store. The town is also home to a number of government offices, including a post office, a courthouse, and a police station.
Demographics
The population of Porcupine was estimated to be around 1,000 people in 2000. The town is predominantly white, with a small Native American population. The median household income in the town is around $30,000, and the median home value is around $50,000. The town has a high poverty rate, with around 25% of the population living below the poverty line.
Common Questions
What is Per Capita Income in Porcupine?
Per Capita income in Porcupine is $5,070.
What is the Median Family Income in Porcupine?
Median Family Income in Porcupine is $21,849.
What is the Median Household income in Porcupine?
Median Household Income in Porcupine is $18,750.
What is Inequality or Gini Index in Porcupine?
Inequality or Gini Index in Porcupine is 0.38.
What is the Total Population of Porcupine?
Total Population of Porcupine is 1,021.
What is the Total Male Population of Porcupine?
Total Male Population of Porcupine is 518.
What is the Total Female Population of Porcupine?
Total Female Population of Porcupine is 503.
What is the Ratio of Males per 100 Females in Porcupine?
There are 102.98 Males per 100 Females in Porcupine.
What is the Ratio of Females per 100 Males in Porcupine?
There are 97.10 Females per 100 Males in Porcupine.
What is the Median Population Age in Porcupine?
Median Population Age in Porcupine is 23.0 Years.
What is the Average Family Size in Porcupine
Average Family Size in Porcupine is 4.3 People.
What is the Average Household Size in Porcupine
Average Household Size in Porcupine is 3.6 People.
How Large is the Labor Force in Porcupine?
There are 114 People in the Labor Forcein in Porcupine.
What is the Percentage of People in the Labor Force in Porcupine?
16.6% of People are in the Labor Force in Porcupine.
What is the Unemployment Rate in Porcupine?
Unemployment Rate in Porcupine is 35.1%.