Zip Codes with the Highest Percentage of Population Employed in Security & Protection in Allentown, PA

RELATED REPORTS & OPTIONS

Security & Protection
Population
Families and Households
Female Fertility
Female Fertility (Unmarried)
Race (Community Size)
Race (Percentage)
Ancestry (Community Size)
AfricanAlaskan AthabascanAlbanianAlsatianAmericanArabArgentineanAustrianBarbadianBasqueBelgianBhutaneseBrazilianBritishBurmeseCanadianCelticCentral AmericanCentral American IndianCherokeeChileanColombianCosta RicanCreekCroatianCubanCzechCzechoslovakianDanishDelawareDominicanDutchEastern EuropeanEcuadorianEgyptianEnglishEuropeanFinnishFrenchFrench American IndianFrench CanadianGermanGreekGuatemalanGuyaneseHaitianHonduranHungarianIndian (Asian)IndonesianIrishIroquoisItalianJamaicanJapaneseJordanianKenyanKoreanLatvianLebaneseLithuanianMexicanMexican American IndianMoroccanNative HawaiianNavajoNicaraguanNigerianNorthern EuropeanNorwegianPakistaniPanamanianPennsylvania GermanPeruvianPolishPortuguesePuerto RicanRussianSalvadoranScandinavianScotch-IrishScottishSerbianSlavicSlovakSloveneSouth AmericanSouth American IndianSpaniardSpanishSri LankanSubsaharan AfricanSwedishSwissSyrianThaiTrinidadian and TobagonianTurkishUgandanUkrainianVenezuelanVietnameseWelshWest IndianYugoslavian
Ancestry (Percentage)
AfricanAlaskan AthabascanAlbanianAlsatianAmericanArabArgentineanAustrianBarbadianBasqueBelgianBhutaneseBrazilianBritishBurmeseCanadianCelticCentral AmericanCentral American IndianCherokeeChileanColombianCosta RicanCreekCroatianCubanCzechCzechoslovakianDanishDelawareDominicanDutchEastern EuropeanEcuadorianEgyptianEnglishEuropeanFinnishFrenchFrench American IndianFrench CanadianGermanGreekGuatemalanGuyaneseHaitianHonduranHungarianIndian (Asian)IndonesianIrishIroquoisItalianJamaicanJapaneseJordanianKenyanKoreanLatvianLebaneseLithuanianMexicanMexican American IndianMoroccanNative HawaiianNavajoNicaraguanNigerianNorthern EuropeanNorwegianPakistaniPanamanianPennsylvania GermanPeruvianPolishPortuguesePuerto RicanRussianSalvadoranScandinavianScotch-IrishScottishSerbianSlavicSlovakSloveneSouth AmericanSouth American IndianSpaniardSpanishSri LankanSubsaharan AfricanSwedishSwissSyrianThaiTrinidadian and TobagonianTurkishUgandanUkrainianVenezuelanVietnameseWelshWest IndianYugoslavian
Immigrant Origin (Total)
Immigrant Origin (Percentage)
Income
Income (Families)
Income (Households)
Poverty
Poverty (Families)
Unemployment
Employment Occupations
Employment Industries
Employer Class
Commute Time
Commute Means
School Enrollment
Education by Degree Field
Occupancy
Finances
Physical Characteristics
Allentown
Compare Zip Codes
Comparison Subject

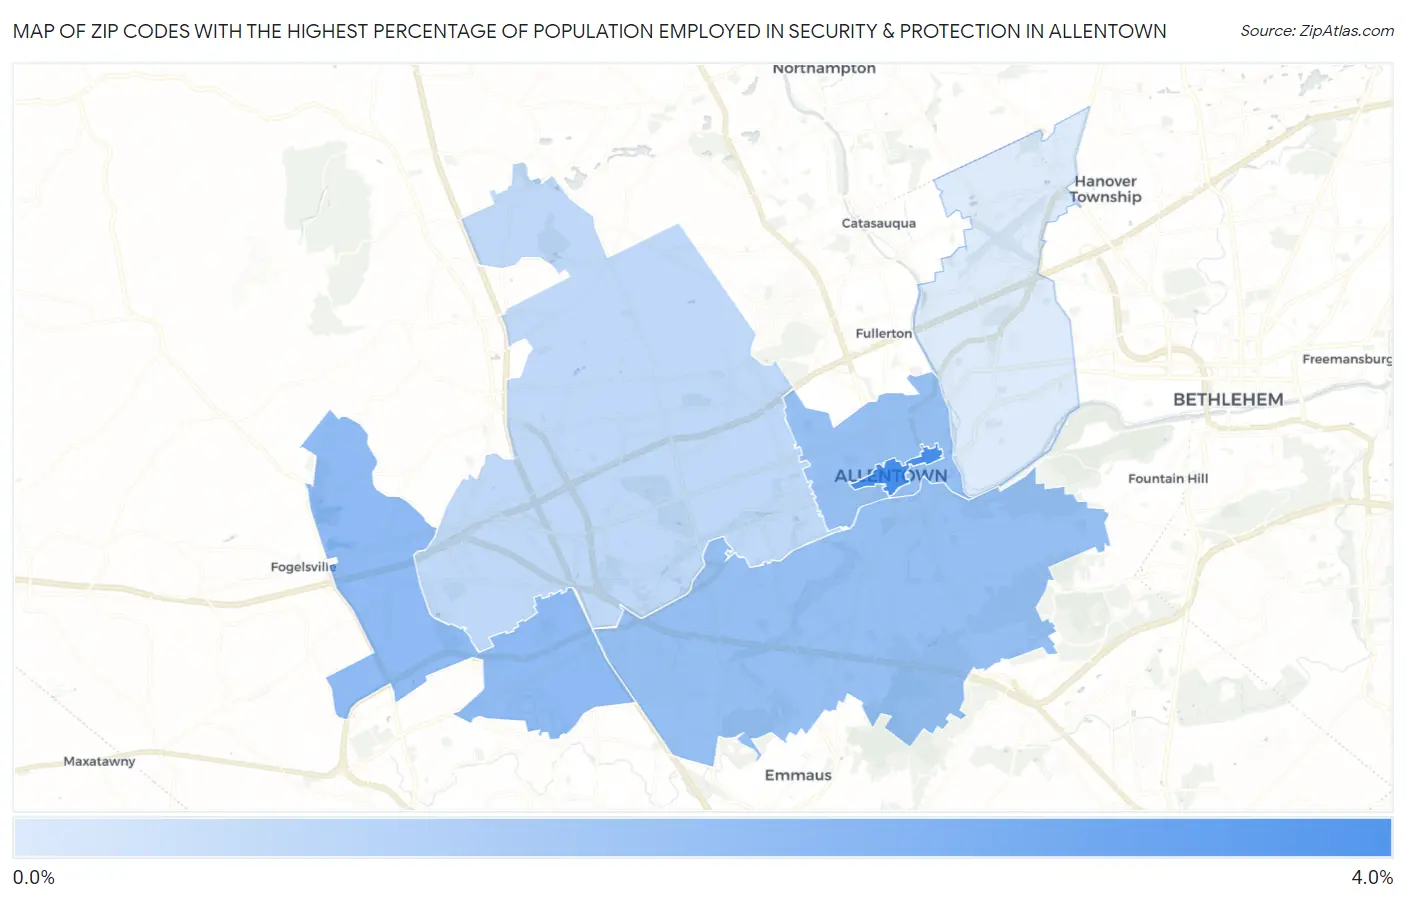
Map of Zip Codes with the Highest Percentage of Population Employed in Security & Protection in Allentown

0.0%
4.0%
Zip Codes with the Highest Percentage of Population Employed in Security & Protection in Allentown Map

Zip Codes with the Highest Percentage of Population Employed in Security & Protection in Allentown, PA

Zip Code % Employed vs State vs National
1.181013.7%2.0%(+1.68)#2272.1%(+1.55)#5,144
2.181062.1%2.0%(+0.043)#6022.1%(-0.086)#12,164
3.181031.9%2.0%(-0.113)#6552.1%(-0.242)#13,177
4.181021.9%2.0%(-0.133)#6692.1%(-0.262)#13,336
5.181040.96%2.0%(-1.06)#1,0622.1%(-1.18)#20,337
6.181090.30%2.0%(-1.72)#1,2712.1%(-1.85)#24,167

Common Questions

What are the Top 5 Zip Codes with the Highest Percentage of Population Employed in Security & Protection in Allentown, PA?
Top 5 Zip Codes with the Highest Percentage of Population Employed in Security & Protection in Allentown, PA are:
#1
3.7%
#2
2.1%
#3
1.9%
#4
1.9%
#5
0.96%
What zip code has the Highest Percentage of Population Employed in Security & Protection in Allentown, PA?
18101 has the Highest Percentage of Population Employed in Security & Protection in Allentown, PA with 3.7%.
What is the Percentage of Population Employed in Security & Protection in Allentown, PA?
Percentage of Population Employed in Security & Protection in Allentown is 1.8%.
What is the Percentage of Population Employed in Security & Protection in Pennsylvania?
Percentage of Population Employed in Security & Protection in Pennsylvania is 2.0%.
What is the Percentage of Population Employed in Security & Protection in the United States?
Percentage of Population Employed in Security & Protection in the United States is 2.1%.