Zip Codes with the Highest Percentage of Population Employed in Security & Protection in Warren, OH
RELATED REPORTS & OPTIONS
Security & Protection
Warren
Compare Zip Codes
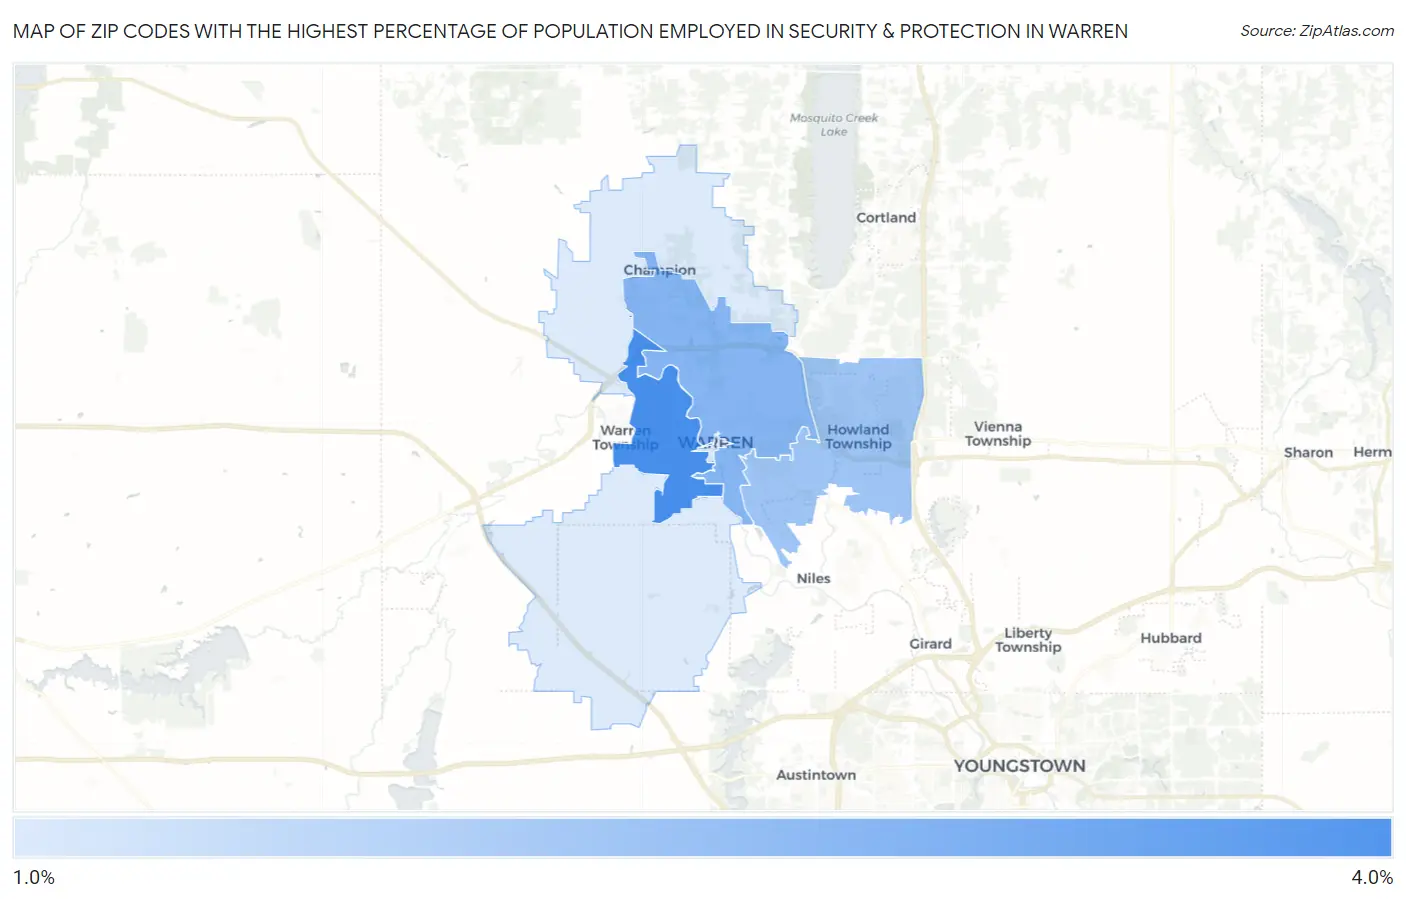
Map of Zip Codes with the Highest Percentage of Population Employed in Security & Protection in Warren
1.6%
3.1%
Zip Codes with the Highest Percentage of Population Employed in Security & Protection in Warren, OH
| Zip Code | % Employed | vs State | vs National | |
| 1. | 44485 | 3.1% | 1.9%(+1.24)#169 | 2.1%(+0.997)#6,715 |
| 2. | 44483 | 2.5% | 1.9%(+0.582)#279 | 2.1%(+0.344)#9,551 |
| 3. | 44484 | 2.2% | 1.9%(+0.336)#338 | 2.1%(+0.098)#10,968 |
| 4. | 44481 | 1.6% | 1.9%(-0.308)#520 | 2.1%(-0.546)#15,402 |
1
Common Questions
What are the Top 3 Zip Codes with the Highest Percentage of Population Employed in Security & Protection in Warren, OH?
Top 3 Zip Codes with the Highest Percentage of Population Employed in Security & Protection in Warren, OH are:
What zip code has the Highest Percentage of Population Employed in Security & Protection in Warren, OH?
44485 has the Highest Percentage of Population Employed in Security & Protection in Warren, OH with 3.1%.
What is the Percentage of Population Employed in Security & Protection in Warren, OH?
Percentage of Population Employed in Security & Protection in Warren is 2.3%.
What is the Percentage of Population Employed in Security & Protection in Ohio?
Percentage of Population Employed in Security & Protection in Ohio is 1.9%.
What is the Percentage of Population Employed in Security & Protection in the United States?
Percentage of Population Employed in Security & Protection in the United States is 2.1%.