Cities with the Highest Percentage of Self-Employed / Incorporated in New York
RELATED REPORTS & OPTIONS
Self-Employed / Incorporated
New York
Compare Cities
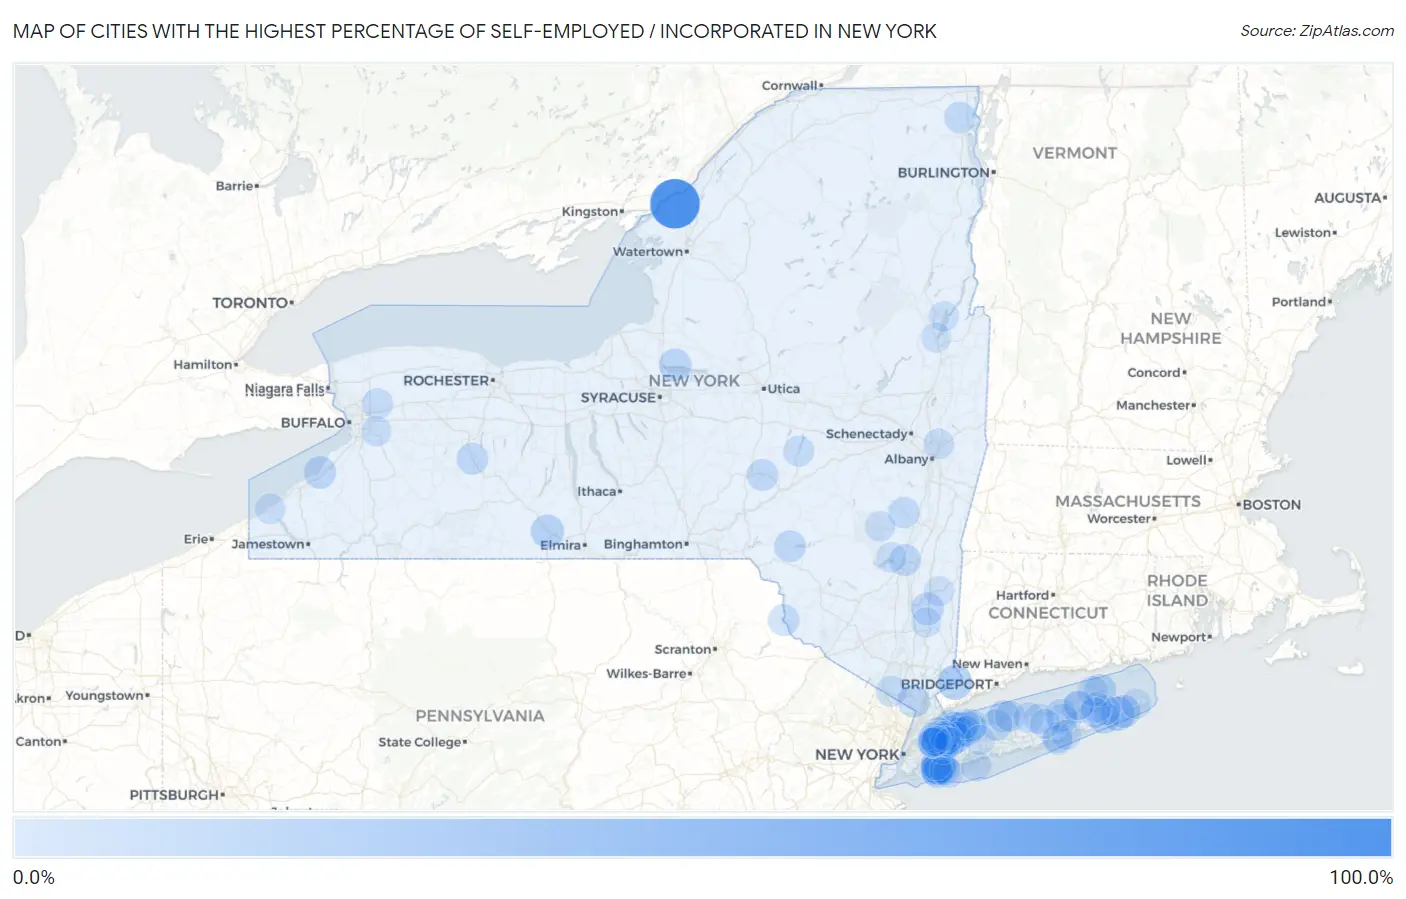
Map of Cities with the Highest Percentage of Self-Employed / Incorporated in New York
0.0%
100.0%
Cities with the Highest Percentage of Self-Employed / Incorporated in New York
| City | % Self-Employed / Incorporated | vs State | vs National | |
| 1. | Fishers Landing | 100.0% | 3.9%(+96.1)#1 | 3.8%(+96.2)#11 |
| 2. | Eagle Bay | 50.0% | 3.9%(+46.1)#2 | 3.8%(+46.2)#98 |
| 3. | Hewlett Bay Park | 42.1% | 3.9%(+38.2)#3 | 3.8%(+38.2)#142 |
| 4. | Barrytown | 39.0% | 3.9%(+35.1)#4 | 3.8%(+35.2)#163 |
| 5. | Westernville | 38.2% | 3.9%(+34.3)#5 | 3.8%(+34.4)#171 |
| 6. | Otter Lake | 33.3% | 3.9%(+29.4)#6 | 3.8%(+29.5)#206 |
| 7. | Scotts Corners | 31.7% | 3.9%(+27.8)#7 | 3.8%(+27.9)#228 |
| 8. | Amagansett | 29.3% | 3.9%(+25.4)#8 | 3.8%(+25.5)#269 |
| 9. | Lake Success | 25.7% | 3.9%(+21.8)#9 | 3.8%(+21.9)#360 |
| 10. | Hewlett Neck | 25.6% | 3.9%(+21.7)#10 | 3.8%(+21.8)#364 |
| 11. | Napeague | 25.3% | 3.9%(+21.4)#11 | 3.8%(+21.5)#372 |
| 12. | Coopers Plains | 25.2% | 3.9%(+21.3)#12 | 3.8%(+21.4)#376 |
| 13. | Roslyn Harbor | 24.2% | 3.9%(+20.3)#13 | 3.8%(+20.3)#410 |
| 14. | Woodsburgh | 23.9% | 3.9%(+20.1)#14 | 3.8%(+20.1)#416 |
| 15. | Cove Neck | 23.7% | 3.9%(+19.8)#15 | 3.8%(+19.8)#425 |
| 16. | Brookville | 23.6% | 3.9%(+19.7)#16 | 3.8%(+19.7)#428 |
| 17. | Freedom Plains | 22.7% | 3.9%(+18.9)#17 | 3.8%(+18.9)#460 |
| 18. | Constantia | 22.6% | 3.9%(+18.7)#18 | 3.8%(+18.8)#466 |
| 19. | Upper Brookville | 22.4% | 3.9%(+18.5)#19 | 3.8%(+18.6)#475 |
| 20. | Wainscott | 21.4% | 3.9%(+17.5)#20 | 3.8%(+17.6)#518 |
| 21. | Hewlett Harbor | 21.3% | 3.9%(+17.4)#21 | 3.8%(+17.5)#526 |
| 22. | Grand View On Hudson | 21.2% | 3.9%(+17.4)#22 | 3.8%(+17.4)#532 |
| 23. | Sunset Bay | 21.2% | 3.9%(+17.3)#23 | 3.8%(+17.4)#536 |
| 24. | Orient | 21.0% | 3.9%(+17.1)#24 | 3.8%(+17.2)#547 |
| 25. | Old Brookville | 20.5% | 3.9%(+16.6)#25 | 3.8%(+16.7)#584 |
| 26. | Lattingtown | 20.4% | 3.9%(+16.6)#26 | 3.8%(+16.6)#586 |
| 27. | Old Field | 20.1% | 3.9%(+16.2)#27 | 3.8%(+16.3)#607 |
| 28. | Searingtown | 20.1% | 3.9%(+16.2)#28 | 3.8%(+16.3)#609 |
| 29. | Northville | 19.9% | 3.9%(+16.0)#29 | 3.8%(+16.1)#632 |
| 30. | Saddle Rock | 19.5% | 3.9%(+15.6)#30 | 3.8%(+15.7)#658 |
| 31. | South Lansing | 19.4% | 3.9%(+15.6)#31 | 3.8%(+15.6)#665 |
| 32. | Lawrence | 19.3% | 3.9%(+15.4)#32 | 3.8%(+15.5)#671 |
| 33. | Downsville | 19.1% | 3.9%(+15.2)#33 | 3.8%(+15.3)#689 |
| 34. | Nissequogue | 19.1% | 3.9%(+15.2)#34 | 3.8%(+15.3)#692 |
| 35. | Kysorville | 19.0% | 3.9%(+15.2)#35 | 3.8%(+15.2)#699 |
| 36. | Morris | 18.8% | 3.9%(+14.9)#36 | 3.8%(+15.0)#711 |
| 37. | Lake Katrine | 18.6% | 3.9%(+14.7)#37 | 3.8%(+14.8)#734 |
| 38. | Cutchogue | 18.6% | 3.9%(+14.7)#38 | 3.8%(+14.8)#736 |
| 39. | Narrowsburg | 18.4% | 3.9%(+14.5)#39 | 3.8%(+14.6)#750 |
| 40. | West Chazy | 18.4% | 3.9%(+14.5)#40 | 3.8%(+14.6)#754 |
| 41. | Mill Neck | 18.3% | 3.9%(+14.4)#41 | 3.8%(+14.5)#761 |
| 42. | Huntington Bay | 18.3% | 3.9%(+14.4)#42 | 3.8%(+14.4)#764 |
| 43. | Matinecock | 18.2% | 3.9%(+14.3)#43 | 3.8%(+14.4)#768 |
| 44. | Roslyn Heights | 18.1% | 3.9%(+14.2)#44 | 3.8%(+14.3)#781 |
| 45. | Oyster Bay Cove | 17.7% | 3.9%(+13.8)#45 | 3.8%(+13.9)#804 |
| 46. | Cairo | 17.7% | 3.9%(+13.8)#46 | 3.8%(+13.8)#807 |
| 47. | Greenvale | 17.5% | 3.9%(+13.6)#47 | 3.8%(+13.7)#817 |
| 48. | East Atlantic Beach | 17.3% | 3.9%(+13.4)#48 | 3.8%(+13.5)#833 |
| 49. | Montebello | 16.7% | 3.9%(+12.8)#49 | 3.8%(+12.9)#876 |
| 50. | Muttontown | 16.1% | 3.9%(+12.2)#50 | 3.8%(+12.3)#938 |
| 51. | Clarence Center | 15.5% | 3.9%(+11.6)#51 | 3.8%(+11.7)#1,004 |
| 52. | Belle Terre | 15.3% | 3.9%(+11.4)#52 | 3.8%(+11.5)#1,026 |
| 53. | Cooperstown | 15.2% | 3.9%(+11.3)#53 | 3.8%(+11.4)#1,047 |
| 54. | Plandome Manor | 15.1% | 3.9%(+11.2)#54 | 3.8%(+11.3)#1,055 |
| 55. | Roslyn Estates | 15.1% | 3.9%(+11.2)#55 | 3.8%(+11.3)#1,056 |
| 56. | Kensington | 15.1% | 3.9%(+11.2)#56 | 3.8%(+11.2)#1,067 |
| 57. | North Hills | 14.9% | 3.9%(+11.0)#57 | 3.8%(+11.1)#1,098 |
| 58. | Cold Spring Harbor | 14.6% | 3.9%(+10.7)#58 | 3.8%(+10.8)#1,131 |
| 59. | Sands Point | 14.3% | 3.9%(+10.4)#59 | 3.8%(+10.5)#1,166 |
| 60. | Green Island | 14.1% | 3.9%(+10.3)#60 | 3.8%(+10.3)#1,210 |
| 61. | Baxter Estates | 14.1% | 3.9%(+10.2)#61 | 3.8%(+10.3)#1,215 |
| 62. | Northwest Harbor | 14.1% | 3.9%(+10.2)#62 | 3.8%(+10.3)#1,216 |
| 63. | North Haven | 14.1% | 3.9%(+10.2)#63 | 3.8%(+10.2)#1,224 |
| 64. | Lido Beach | 14.0% | 3.9%(+10.1)#64 | 3.8%(+10.2)#1,242 |
| 65. | Aquebogue | 14.0% | 3.9%(+10.1)#65 | 3.8%(+10.2)#1,243 |
| 66. | Westfield | 13.9% | 3.9%(+10.0)#66 | 3.8%(+10.1)#1,251 |
| 67. | East Marion | 13.9% | 3.9%(+10.0)#67 | 3.8%(+10.1)#1,252 |
| 68. | Gilgo | 13.5% | 3.9%(+9.65)#68 | 3.8%(+9.72)#1,317 |
| 69. | Shoreham | 13.5% | 3.9%(+9.63)#69 | 3.8%(+9.70)#1,321 |
| 70. | Wading River | 13.5% | 3.9%(+9.59)#70 | 3.8%(+9.66)#1,329 |
| 71. | Garden City Park | 13.3% | 3.9%(+9.36)#71 | 3.8%(+9.43)#1,375 |
| 72. | Saddle Rock Estates | 13.2% | 3.9%(+9.33)#72 | 3.8%(+9.40)#1,380 |
| 73. | Halesite | 13.1% | 3.9%(+9.23)#73 | 3.8%(+9.30)#1,406 |
| 74. | West Hurley | 13.0% | 3.9%(+9.09)#74 | 3.8%(+9.16)#1,429 |
| 75. | Elma Center | 13.0% | 3.9%(+9.07)#75 | 3.8%(+9.14)#1,431 |
| 76. | Noyack | 12.9% | 3.9%(+9.06)#76 | 3.8%(+9.13)#1,434 |
| 77. | Bolton Landing | 12.8% | 3.9%(+8.93)#77 | 3.8%(+9.00)#1,463 |
| 78. | Westhampton | 12.8% | 3.9%(+8.90)#78 | 3.8%(+8.97)#1,469 |
| 79. | Hunter | 12.6% | 3.9%(+8.72)#79 | 3.8%(+8.79)#1,509 |
| 80. | Westhampton Beach | 12.5% | 3.9%(+8.66)#80 | 3.8%(+8.73)#1,518 |
| 81. | Milton Cdp Ulster County | 12.4% | 3.9%(+8.55)#81 | 3.8%(+8.62)#1,548 |
| 82. | Great Neck | 12.4% | 3.9%(+8.52)#82 | 3.8%(+8.59)#1,556 |
| 83. | Woodmere | 12.4% | 3.9%(+8.49)#83 | 3.8%(+8.56)#1,563 |
| 84. | East Quogue | 12.3% | 3.9%(+8.41)#84 | 3.8%(+8.48)#1,580 |
| 85. | Great Neck Estates | 12.3% | 3.9%(+8.38)#85 | 3.8%(+8.45)#1,586 |
| 86. | Lloyd Harbor | 12.2% | 3.9%(+8.35)#86 | 3.8%(+8.42)#1,594 |
| 87. | Glenwood Landing | 12.2% | 3.9%(+8.32)#87 | 3.8%(+8.39)#1,598 |
| 88. | Lake George | 12.2% | 3.9%(+8.30)#88 | 3.8%(+8.37)#1,604 |
| 89. | East Hills | 12.2% | 3.9%(+8.30)#89 | 3.8%(+8.37)#1,605 |
| 90. | Calverton | 12.2% | 3.9%(+8.29)#90 | 3.8%(+8.36)#1,608 |
| 91. | Kings Point | 12.2% | 3.9%(+8.28)#91 | 3.8%(+8.35)#1,611 |
| 92. | Peconic | 12.1% | 3.9%(+8.21)#92 | 3.8%(+8.28)#1,631 |
| 93. | Barnum Island | 12.0% | 3.9%(+8.16)#93 | 3.8%(+8.23)#1,650 |
| 94. | Dix Hills | 12.0% | 3.9%(+8.14)#94 | 3.8%(+8.21)#1,654 |
| 95. | Harbor Hills | 12.0% | 3.9%(+8.08)#95 | 3.8%(+8.15)#1,665 |
| 96. | Old Westbury | 11.9% | 3.9%(+8.05)#96 | 3.8%(+8.12)#1,671 |
| 97. | Millbrook | 11.9% | 3.9%(+8.04)#97 | 3.8%(+8.11)#1,675 |
| 98. | Great Neck Gardens | 11.9% | 3.9%(+7.99)#98 | 3.8%(+8.06)#1,693 |
| 99. | Hopewell Junction | 11.9% | 3.9%(+7.99)#99 | 3.8%(+8.06)#1,695 |
| 100. | Montauk | 11.9% | 3.9%(+7.98)#100 | 3.8%(+8.05)#1,698 |
Common Questions
What are the Top 10 Cities with the Highest Percentage of Self-Employed / Incorporated in New York?
Top 10 Cities with the Highest Percentage of Self-Employed / Incorporated in New York are:
#1
100.0%
#2
42.1%
#3
31.7%
#4
29.3%
#5
25.7%
#6
25.6%
#7
25.3%
#8
25.2%
#9
24.2%
#10
23.9%
What city has the Highest Percentage of Self-Employed / Incorporated in New York?
Fishers Landing has the Highest Percentage of Self-Employed / Incorporated in New York with 100.0%.
What is the Percentage of Self-Employed / Incorporated in the State of New York?
Percentage of Self-Employed / Incorporated in New York is 3.9%.
What is the Percentage of Self-Employed / Incorporated in the United States?
Percentage of Self-Employed / Incorporated in the United States is 3.8%.