Morris, NY Map & Demographics
Morris Map
Morris Overview
$51,908
PER CAPITA INCOME
$210,848
AVG FAMILY INCOME
$77,222
AVG HOUSEHOLD INCOME
0.51
INEQUALITY / GINI INDEX
492
TOTAL POPULATION
237
MALE POPULATION
255
FEMALE POPULATION
92.94
MALES / 100 FEMALES
107.59
FEMALES / 100 MALES
48.5
MEDIAN AGE
3.1
AVG FAMILY SIZE
2.3
AVG HOUSEHOLD SIZE
222
LABOR FORCE [ PEOPLE ]
54.8%
PERCENT IN LABOR FORCE
1.8%
UNEMPLOYMENT RATE
Morris Zip Codes
Morris Area Codes
Income in Morris
Income Overview in Morris
Per Capita Income in Morris is $51,908, while median incomes of families and households are $210,848 and $77,222 respectively.
| Characteristic | Number | Measure |
| Per Capita Income | 492 | $51,908 |
| Median Family Income | 119 | $210,848 |
| Mean Family Income | 119 | $197,071 |
| Median Household Income | 212 | $77,222 |
| Mean Household Income | 212 | $126,859 |
| Income Deficit | 119 | $0 |
| Wage / Income Gap (%) | 492 | 0.00% |
| Wage / Income Gap ($) | 492 | 100.00¢ per $1 |
| Gini / Inequality Index | 492 | 0.51 |
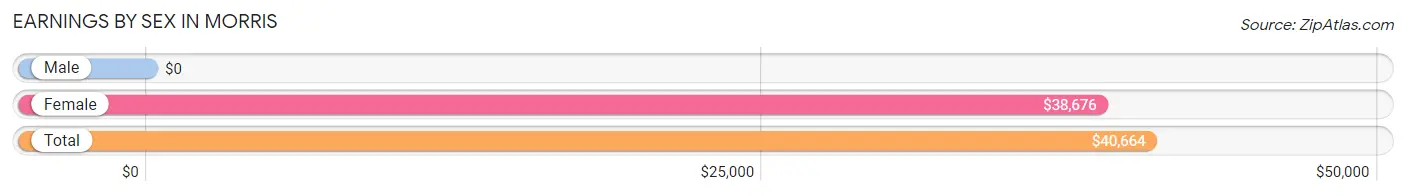
Earnings by Sex in Morris
| Sex | Number | Average Earnings |
| Male | 119 (46.3%) | $0 |
| Female | 138 (53.7%) | $38,676 |
| Total | 257 (100.0%) | $40,664 |
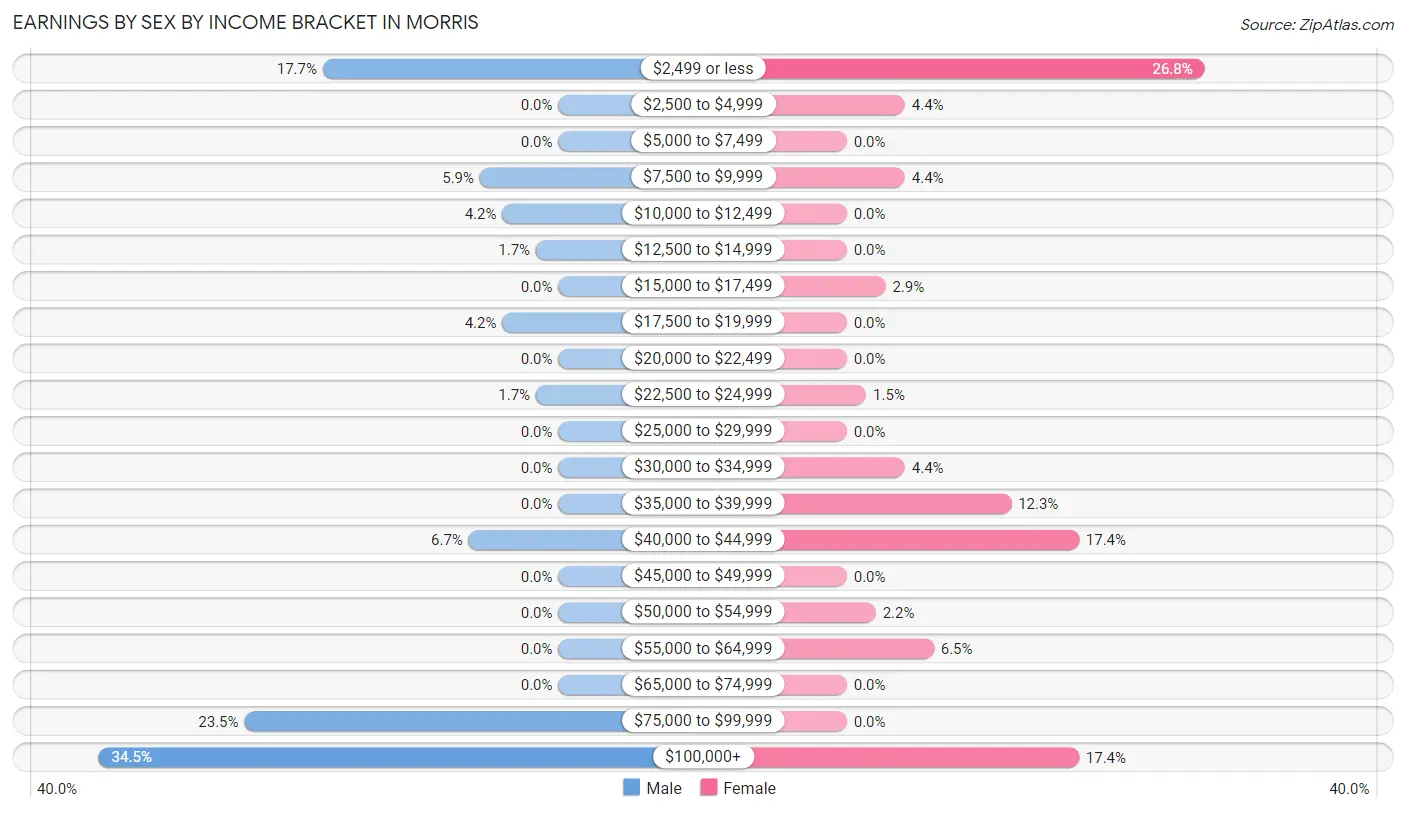
Earnings by Sex by Income Bracket in Morris
The most common earnings brackets in Morris are $100,000+ for men (41 | 34.4%) and $2,499 or less for women (37 | 26.8%).
| Income | Male | Female |
| $2,499 or less | 21 (17.6%) | 37 (26.8%) |
| $2,500 to $4,999 | 0 (0.0%) | 6 (4.3%) |
| $5,000 to $7,499 | 0 (0.0%) | 0 (0.0%) |
| $7,500 to $9,999 | 7 (5.9%) | 6 (4.3%) |
| $10,000 to $12,499 | 5 (4.2%) | 0 (0.0%) |
| $12,500 to $14,999 | 2 (1.7%) | 0 (0.0%) |
| $15,000 to $17,499 | 0 (0.0%) | 4 (2.9%) |
| $17,500 to $19,999 | 5 (4.2%) | 0 (0.0%) |
| $20,000 to $22,499 | 0 (0.0%) | 0 (0.0%) |
| $22,500 to $24,999 | 2 (1.7%) | 2 (1.5%) |
| $25,000 to $29,999 | 0 (0.0%) | 0 (0.0%) |
| $30,000 to $34,999 | 0 (0.0%) | 6 (4.3%) |
| $35,000 to $39,999 | 0 (0.0%) | 17 (12.3%) |
| $40,000 to $44,999 | 8 (6.7%) | 24 (17.4%) |
| $45,000 to $49,999 | 0 (0.0%) | 0 (0.0%) |
| $50,000 to $54,999 | 0 (0.0%) | 3 (2.2%) |
| $55,000 to $64,999 | 0 (0.0%) | 9 (6.5%) |
| $65,000 to $74,999 | 0 (0.0%) | 0 (0.0%) |
| $75,000 to $99,999 | 28 (23.5%) | 0 (0.0%) |
| $100,000+ | 41 (34.4%) | 24 (17.4%) |
| Total | 119 (100.0%) | 138 (100.0%) |
Earnings by Sex by Educational Attainment in Morris
| Educational Attainment | Male Income | Female Income |
| Less than High School | - | - |
| High School Diploma | - | - |
| College or Associate's Degree | - | - |
| Bachelor's Degree | - | - |
| Graduate Degree | - | - |
| Total | - | - |
Family Income in Morris
Family Income Brackets in Morris
According to the Morris family income data, there are 69 families falling into the $200,000+ income range, which is the most common income bracket and makes up 58.0% of all families.
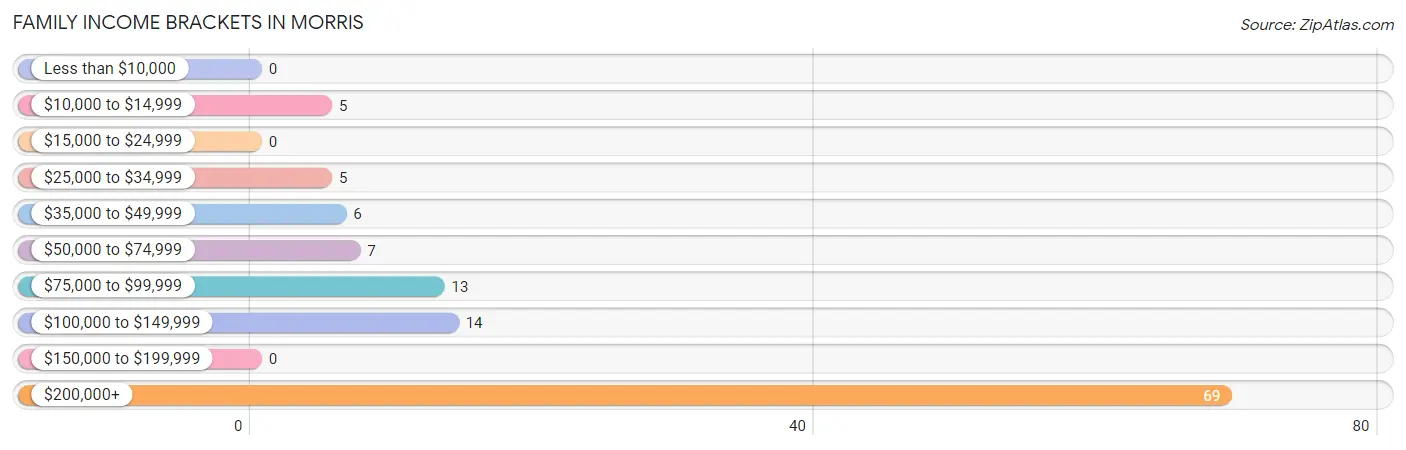
| Income Bracket | # Families | % Families |
| Less than $10,000 | 0 | 0.0% |
| $10,000 to $14,999 | 5 | 4.2% |
| $15,000 to $24,999 | 0 | 0.0% |
| $25,000 to $34,999 | 5 | 4.2% |
| $35,000 to $49,999 | 6 | 5.0% |
| $50,000 to $74,999 | 7 | 5.9% |
| $75,000 to $99,999 | 13 | 10.9% |
| $100,000 to $149,999 | 14 | 11.8% |
| $150,000 to $199,999 | 0 | 0.0% |
| $200,000+ | 69 | 58.0% |
Family Income by Famaliy Size in Morris
2-person families (36 | 30.2%) account for the highest median family income in Morris with $96,071 per family, while 2-person families (36 | 30.2%) have the highest median income of $48,036 per family member.
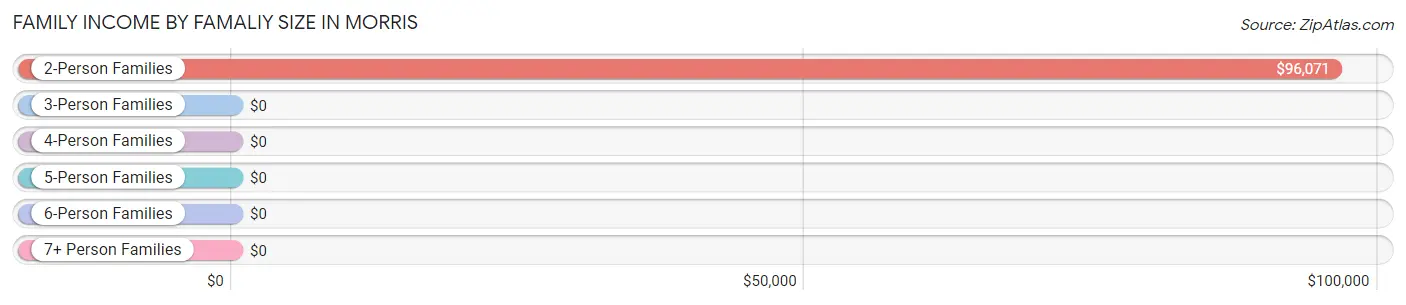
| Income Bracket | # Families | Median Income |
| 2-Person Families | 36 (30.2%) | $96,071 |
| 3-Person Families | 33 (27.7%) | $0 |
| 4-Person Families | 9 (7.6%) | $0 |
| 5-Person Families | 0 (0.0%) | $0 |
| 6-Person Families | 41 (34.4%) | $0 |
| 7+ Person Families | 0 (0.0%) | $0 |
| Total | 119 (100.0%) | $210,848 |
Family Income by Number of Earners in Morris
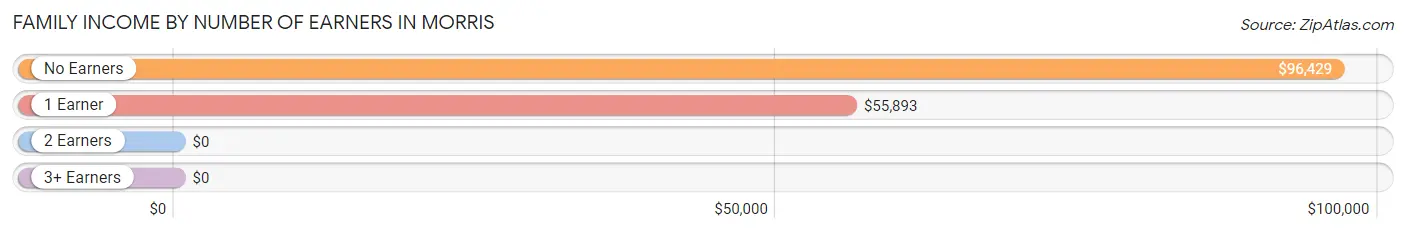
| Number of Earners | # Families | Median Income |
| No Earners | 18 (15.1%) | $96,429 |
| 1 Earner | 27 (22.7%) | $55,893 |
| 2 Earners | 5 (4.2%) | $0 |
| 3+ Earners | 69 (58.0%) | $0 |
| Total | 119 (100.0%) | $210,848 |
Household Income in Morris
Household Income Brackets in Morris
With 69 households falling in the category, the $200,000+ income range is the most frequent in Morris, accounting for 32.6% of all households.
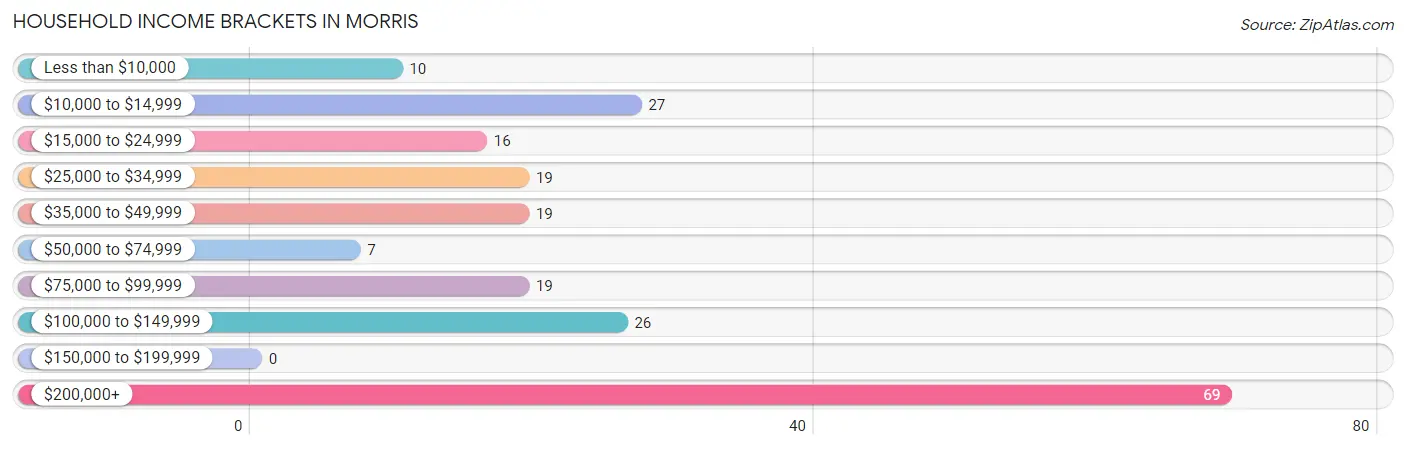
| Income Bracket | # Households | % Households |
| Less than $10,000 | 10 | 4.7% |
| $10,000 to $14,999 | 27 | 12.7% |
| $15,000 to $24,999 | 16 | 7.5% |
| $25,000 to $34,999 | 19 | 9.0% |
| $35,000 to $49,999 | 19 | 9.0% |
| $50,000 to $74,999 | 7 | 3.3% |
| $75,000 to $99,999 | 19 | 9.0% |
| $100,000 to $149,999 | 26 | 12.3% |
| $150,000 to $199,999 | 0 | 0.0% |
| $200,000+ | 69 | 32.5% |
Household Income by Householder Age in Morris
The median household income in Morris is $77,222, with the highest median household income of $211,563 found in the 45 to 64 years age bracket for the primary householder. A total of 103 households (48.6%) fall into this category. Meanwhile, the 15 to 24 years age bracket for the primary householder has the lowest median household income of $0, with 5 households (2.4%) in this group.
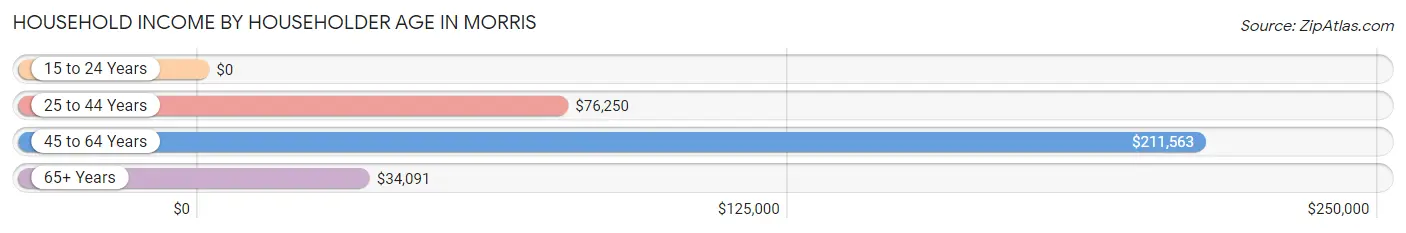
| Income Bracket | # Households | Median Income |
| 15 to 24 Years | 5 (2.4%) | $0 |
| 25 to 44 Years | 22 (10.4%) | $76,250 |
| 45 to 64 Years | 103 (48.6%) | $211,563 |
| 65+ Years | 82 (38.7%) | $34,091 |
| Total | 212 (100.0%) | $77,222 |
Poverty in Morris
Income Below Poverty by Sex and Age in Morris
With 8.4% poverty level for males and 7.1% for females among the residents of Morris, 35 to 44 year old males and under 5 year old females are the most vulnerable to poverty, with 8 males (100.0%) and 10 females (58.8%) in their respective age groups living below the poverty level.
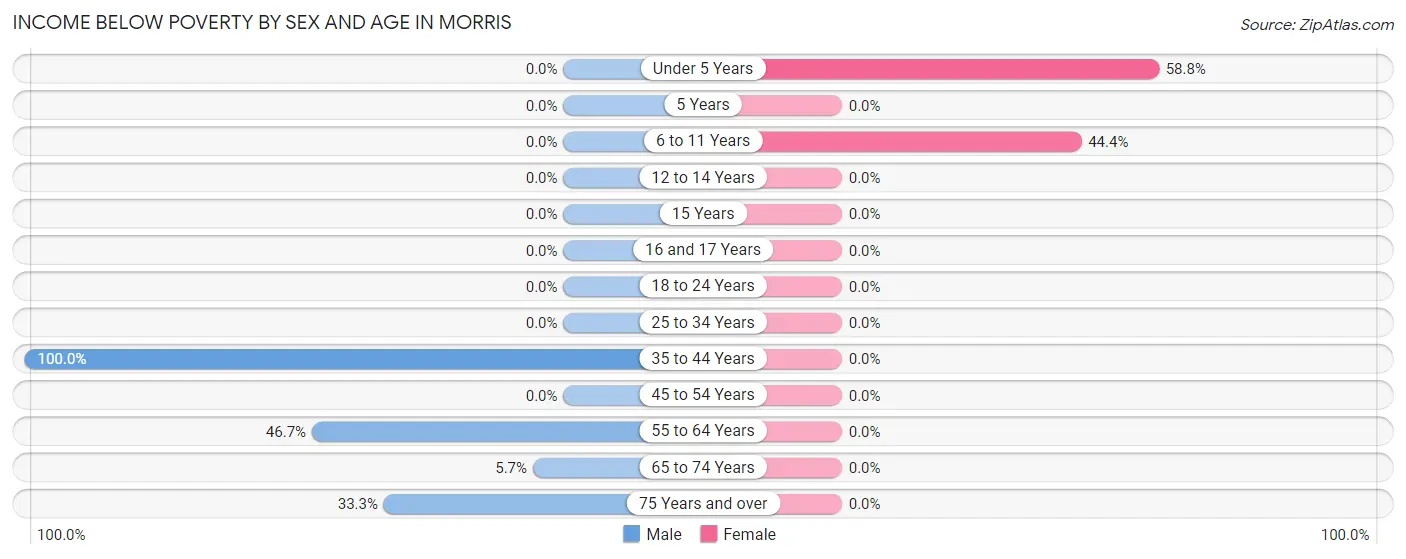
| Age Bracket | Male | Female |
| Under 5 Years | 0 (0.0%) | 10 (58.8%) |
| 5 Years | 0 (0.0%) | 0 (0.0%) |
| 6 to 11 Years | 0 (0.0%) | 8 (44.4%) |
| 12 to 14 Years | 0 (0.0%) | 0 (0.0%) |
| 15 Years | 0 (0.0%) | 0 (0.0%) |
| 16 and 17 Years | 0 (0.0%) | 0 (0.0%) |
| 18 to 24 Years | 0 (0.0%) | 0 (0.0%) |
| 25 to 34 Years | 0 (0.0%) | 0 (0.0%) |
| 35 to 44 Years | 8 (100.0%) | 0 (0.0%) |
| 45 to 54 Years | 0 (0.0%) | 0 (0.0%) |
| 55 to 64 Years | 7 (46.7%) | 0 (0.0%) |
| 65 to 74 Years | 3 (5.7%) | 0 (0.0%) |
| 75 Years and over | 2 (33.3%) | 0 (0.0%) |
| Total | 20 (8.4%) | 18 (7.1%) |
Income Above Poverty by Sex and Age in Morris
According to the poverty statistics in Morris, males aged under 5 years and females aged 16 and 17 years are the age groups that are most secure financially, with 100.0% of males and 100.0% of females in these age groups living above the poverty line.
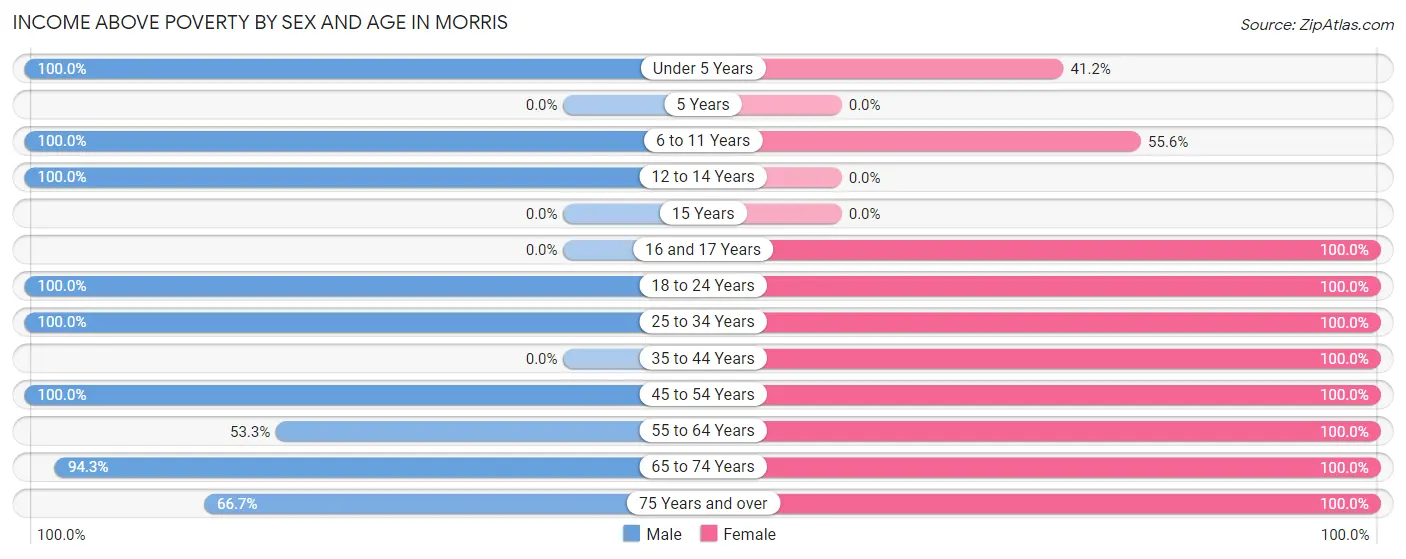
| Age Bracket | Male | Female |
| Under 5 Years | 8 (100.0%) | 7 (41.2%) |
| 5 Years | 0 (0.0%) | 0 (0.0%) |
| 6 to 11 Years | 23 (100.0%) | 10 (55.6%) |
| 12 to 14 Years | 21 (100.0%) | 0 (0.0%) |
| 15 Years | 0 (0.0%) | 0 (0.0%) |
| 16 and 17 Years | 0 (0.0%) | 24 (100.0%) |
| 18 to 24 Years | 26 (100.0%) | 43 (100.0%) |
| 25 to 34 Years | 6 (100.0%) | 28 (100.0%) |
| 35 to 44 Years | 0 (0.0%) | 3 (100.0%) |
| 45 to 54 Years | 71 (100.0%) | 56 (100.0%) |
| 55 to 64 Years | 8 (53.3%) | 15 (100.0%) |
| 65 to 74 Years | 50 (94.3%) | 42 (100.0%) |
| 75 Years and over | 4 (66.7%) | 9 (100.0%) |
| Total | 217 (91.6%) | 237 (92.9%) |
Income Below Poverty Among Married-Couple Families in Morris
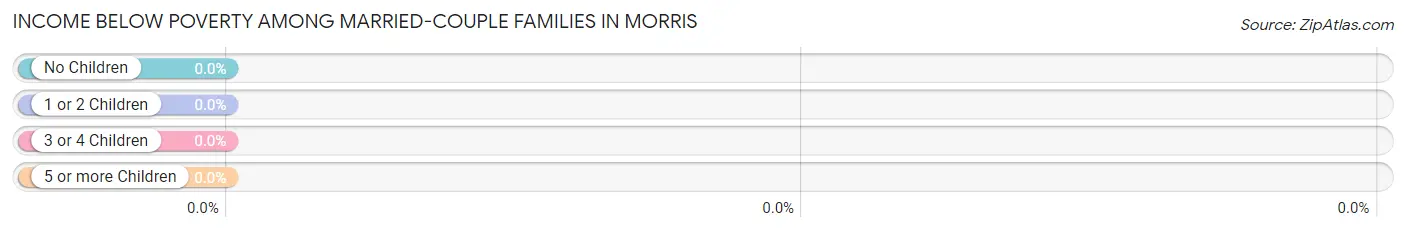
| Children | Above Poverty | Below Poverty |
| No Children | 56 (100.0%) | 0 (0.0%) |
| 1 or 2 Children | 3 (100.0%) | 0 (0.0%) |
| 3 or 4 Children | 41 (100.0%) | 0 (0.0%) |
| 5 or more Children | 0 (0.0%) | 0 (0.0%) |
| Total | 100 (100.0%) | 0 (0.0%) |
Income Below Poverty Among Single-Parent Households in Morris
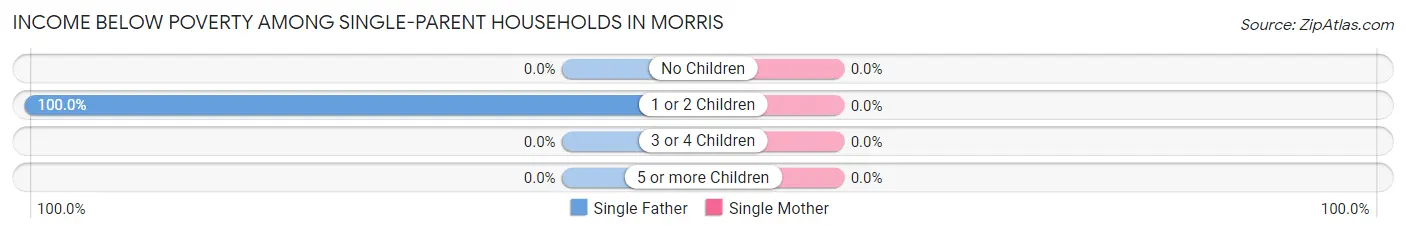
| Children | Single Father | Single Mother |
| No Children | 0 (0.0%) | 0 (0.0%) |
| 1 or 2 Children | 5 (100.0%) | 0 (0.0%) |
| 3 or 4 Children | 0 (0.0%) | 0 (0.0%) |
| 5 or more Children | 0 (0.0%) | 0 (0.0%) |
| Total | 5 (35.7%) | 0 (0.0%) |
Income Below Poverty Among Married-Couple vs Single-Parent Households in Morris
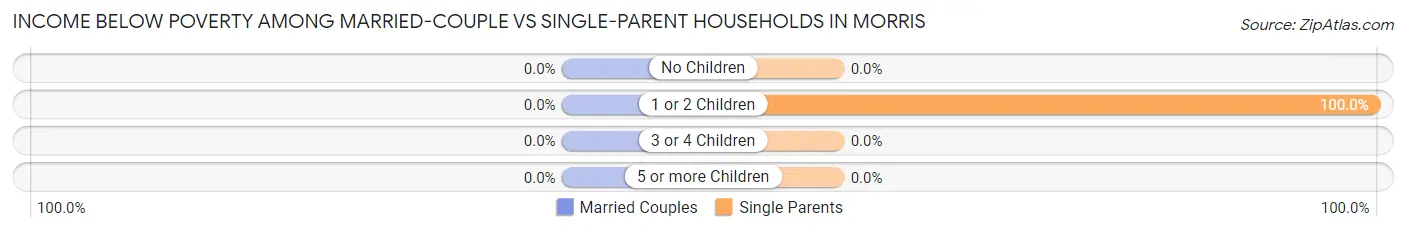
| Children | Married-Couple Families | Single-Parent Households |
| No Children | 0 (0.0%) | 0 (0.0%) |
| 1 or 2 Children | 0 (0.0%) | 5 (100.0%) |
| 3 or 4 Children | 0 (0.0%) | 0 (0.0%) |
| 5 or more Children | 0 (0.0%) | 0 (0.0%) |
| Total | 0 (0.0%) | 5 (26.3%) |
Race in Morris
The most populous races in Morris are White / Caucasian (466 | 94.7%), Hispanic or Latino (23 | 4.7%), and Two or more Races (23 | 4.7%).
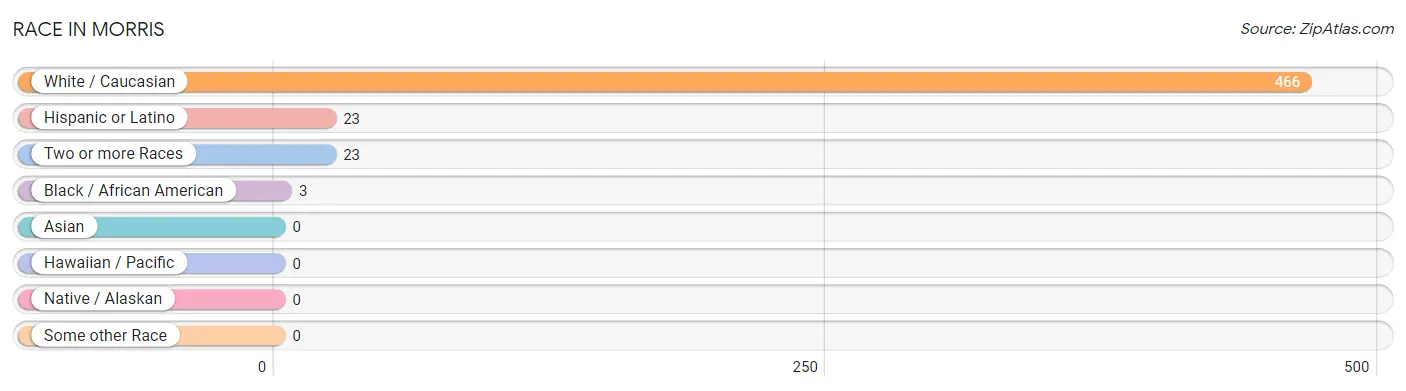
| Race | # Population | % Population |
| Asian | 0 | 0.0% |
| Black / African American | 3 | 0.6% |
| Hawaiian / Pacific | 0 | 0.0% |
| Hispanic or Latino | 23 | 4.7% |
| Native / Alaskan | 0 | 0.0% |
| White / Caucasian | 466 | 94.7% |
| Two or more Races | 23 | 4.7% |
| Some other Race | 0 | 0.0% |
| Total | 492 | 100.0% |
Ancestry in Morris
The most populous ancestries reported in Morris are Irish (209 | 42.5%), German (145 | 29.5%), Italian (66 | 13.4%), English (59 | 12.0%), and Scottish (28 | 5.7%), together accounting for 103.0% of all Morris residents.
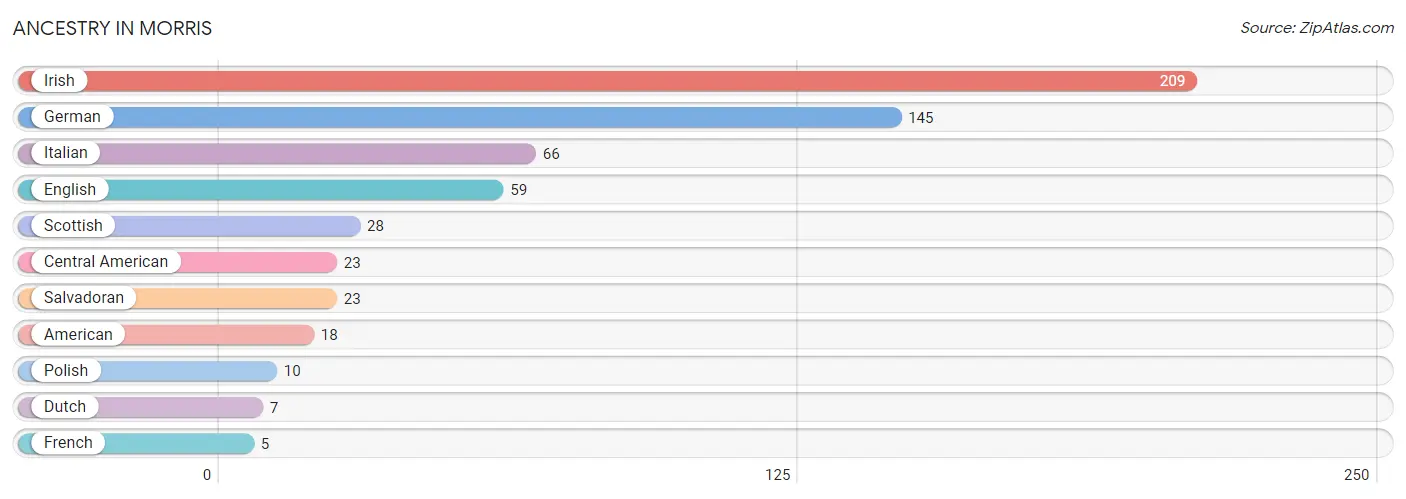
| Ancestry | # Population | % Population |
| American | 18 | 3.7% |
| Central American | 23 | 4.7% |
| Dutch | 7 | 1.4% |
| English | 59 | 12.0% |
| French | 5 | 1.0% |
| German | 145 | 29.5% |
| Irish | 209 | 42.5% |
| Italian | 66 | 13.4% |
| Polish | 10 | 2.0% |
| Salvadoran | 23 | 4.7% |
| Scottish | 28 | 5.7% | View All 11 Rows |
Immigrants in Morris
The most numerous immigrant groups reported in Morris came from Central America (5 | 1.0%), El Salvador (5 | 1.0%), and Latin America (5 | 1.0%), together accounting for 3.1% of all Morris residents.
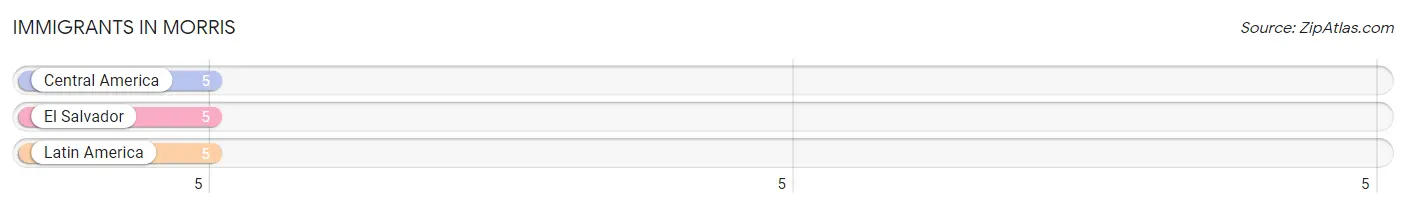
| Immigration Origin | # Population | % Population |
| Central America | 5 | 1.0% |
| El Salvador | 5 | 1.0% |
| Latin America | 5 | 1.0% | View All 3 Rows |
Sex and Age in Morris
Sex and Age in Morris
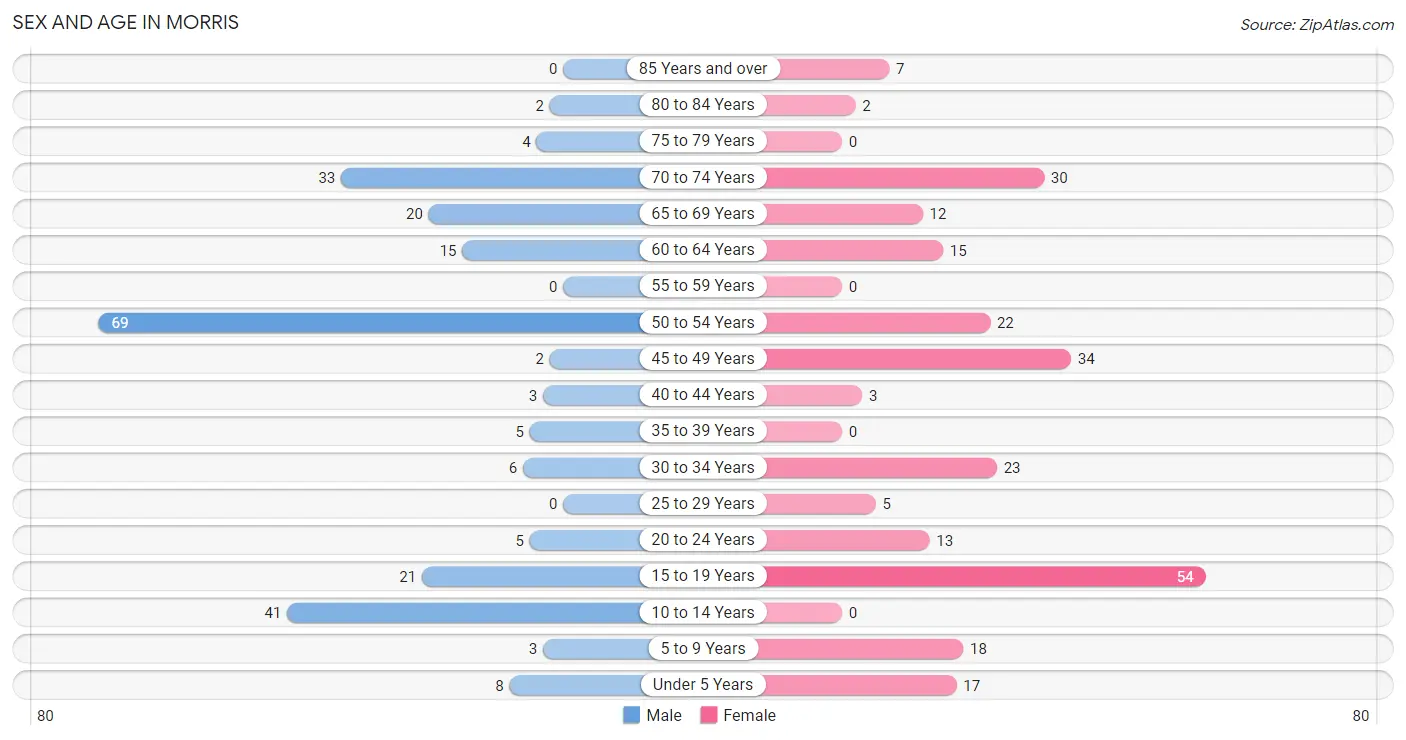
The most populous age groups in Morris are 50 to 54 Years (69 | 29.1%) for men and 15 to 19 Years (54 | 21.2%) for women.
| Age Bracket | Male | Female |
| Under 5 Years | 8 (3.4%) | 17 (6.7%) |
| 5 to 9 Years | 3 (1.3%) | 18 (7.1%) |
| 10 to 14 Years | 41 (17.3%) | 0 (0.0%) |
| 15 to 19 Years | 21 (8.9%) | 54 (21.2%) |
| 20 to 24 Years | 5 (2.1%) | 13 (5.1%) |
| 25 to 29 Years | 0 (0.0%) | 5 (2.0%) |
| 30 to 34 Years | 6 (2.5%) | 23 (9.0%) |
| 35 to 39 Years | 5 (2.1%) | 0 (0.0%) |
| 40 to 44 Years | 3 (1.3%) | 3 (1.2%) |
| 45 to 49 Years | 2 (0.8%) | 34 (13.3%) |
| 50 to 54 Years | 69 (29.1%) | 22 (8.6%) |
| 55 to 59 Years | 0 (0.0%) | 0 (0.0%) |
| 60 to 64 Years | 15 (6.3%) | 15 (5.9%) |
| 65 to 69 Years | 20 (8.4%) | 12 (4.7%) |
| 70 to 74 Years | 33 (13.9%) | 30 (11.8%) |
| 75 to 79 Years | 4 (1.7%) | 0 (0.0%) |
| 80 to 84 Years | 2 (0.8%) | 2 (0.8%) |
| 85 Years and over | 0 (0.0%) | 7 (2.8%) |
| Total | 237 (100.0%) | 255 (100.0%) |
Families and Households in Morris
Median Family Size in Morris
The median family size in Morris is 3.11 persons per family, with single male/father families (14 | 11.8%) accounting for the largest median family size of 4.07 persons per family. On the other hand, married-couple families (100 | 84.0%) represent the smallest median family size with 2.95 persons per family.
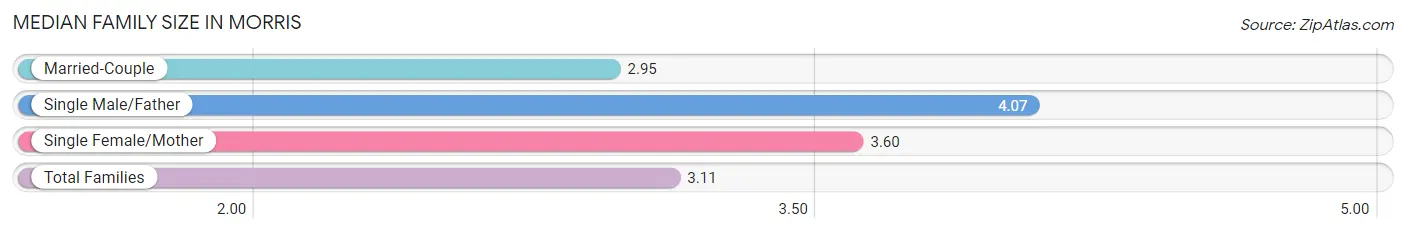
| Family Type | # Families | Family Size |
| Married-Couple | 100 (84.0%) | 2.95 |
| Single Male/Father | 14 (11.8%) | 4.07 |
| Single Female/Mother | 5 (4.2%) | 3.60 |
| Total Families | 119 (100.0%) | 3.11 |
Median Household Size in Morris
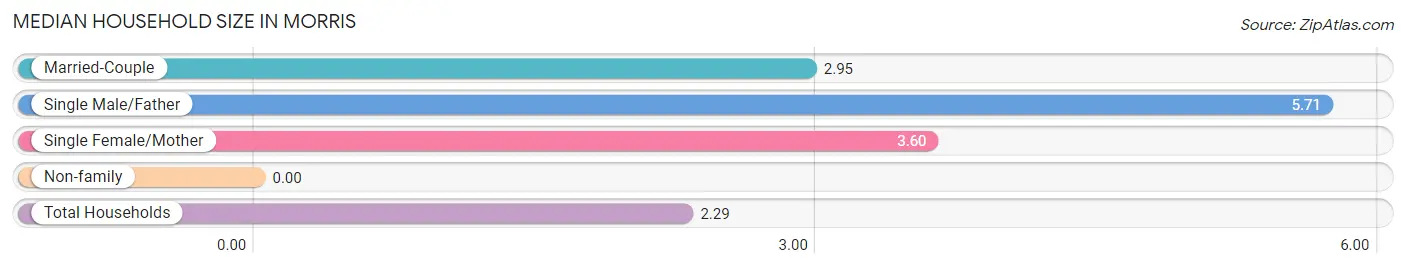
| Household Type | # Households | Household Size |
| Married-Couple | 100 (47.2%) | 2.95 |
| Single Male/Father | 14 (6.6%) | 5.71 |
| Single Female/Mother | 5 (2.4%) | 3.60 |
| Non-family | 93 (43.9%) | - |
| Total Households | 212 (100.0%) | 2.29 |
Household Size by Marriage Status in Morris
Out of a total of 212 households in Morris, 119 (56.1%) are family households, while 93 (43.9%) are nonfamily households. The most numerous type of family households are 6-person households, comprising 41, and the most common type of nonfamily households are 1-person households, comprising 93.
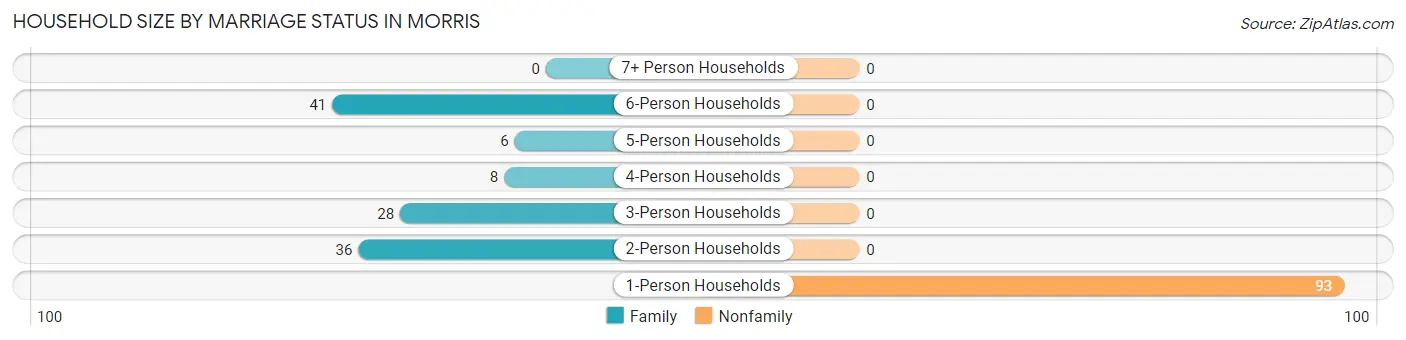
| Household Size | Family Households | Nonfamily Households |
| 1-Person Households | - | 93 (43.9%) |
| 2-Person Households | 36 (17.0%) | 0 (0.0%) |
| 3-Person Households | 28 (13.2%) | 0 (0.0%) |
| 4-Person Households | 8 (3.8%) | 0 (0.0%) |
| 5-Person Households | 6 (2.8%) | 0 (0.0%) |
| 6-Person Households | 41 (19.3%) | 0 (0.0%) |
| 7+ Person Households | 0 (0.0%) | 0 (0.0%) |
| Total | 119 (56.1%) | 93 (43.9%) |
Female Fertility in Morris
Fertility by Age in Morris
Average fertility rate in Morris is 129.0 births per 1,000 women. Women in the age bracket of 20 to 34 years have the highest fertility rate with 415.0 births per 1,000 women. Women in the age bracket of 20 to 34 years acount for 100.0% of all women with births.
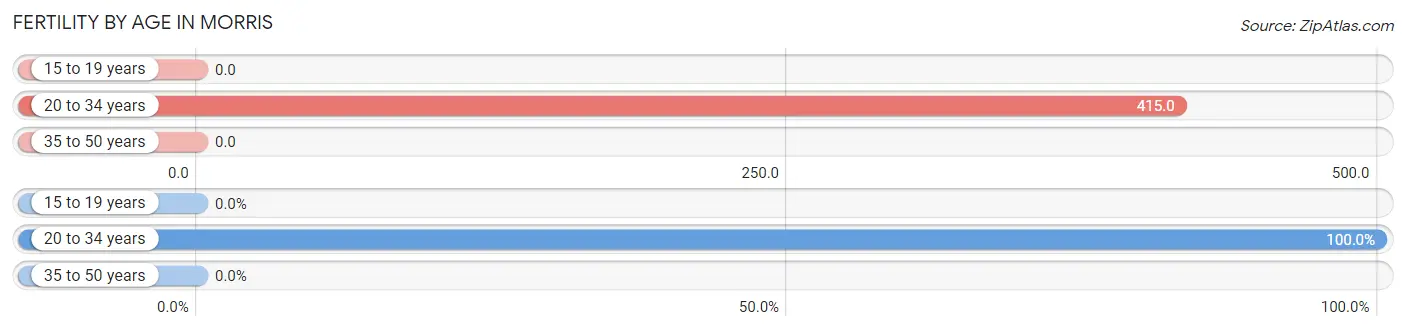
| Age Bracket | Women with Births | Births / 1,000 Women |
| 15 to 19 years | 0 (0.0%) | 0.0 |
| 20 to 34 years | 17 (100.0%) | 415.0 |
| 35 to 50 years | 0 (0.0%) | 0.0 |
| Total | 17 (100.0%) | 129.0 |
Fertility by Age by Marriage Status in Morris
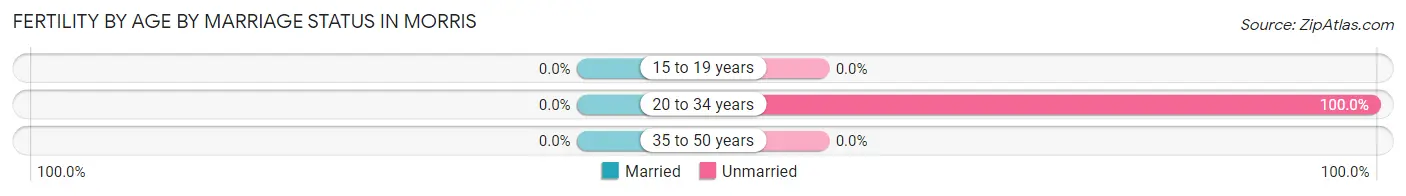
| Age Bracket | Married | Unmarried |
| 15 to 19 years | 0 (0.0%) | 0 (0.0%) |
| 20 to 34 years | 0 (0.0%) | 17 (100.0%) |
| 35 to 50 years | 0 (0.0%) | 0 (0.0%) |
| Total | 0 (0.0%) | 17 (100.0%) |
Fertility by Education in Morris
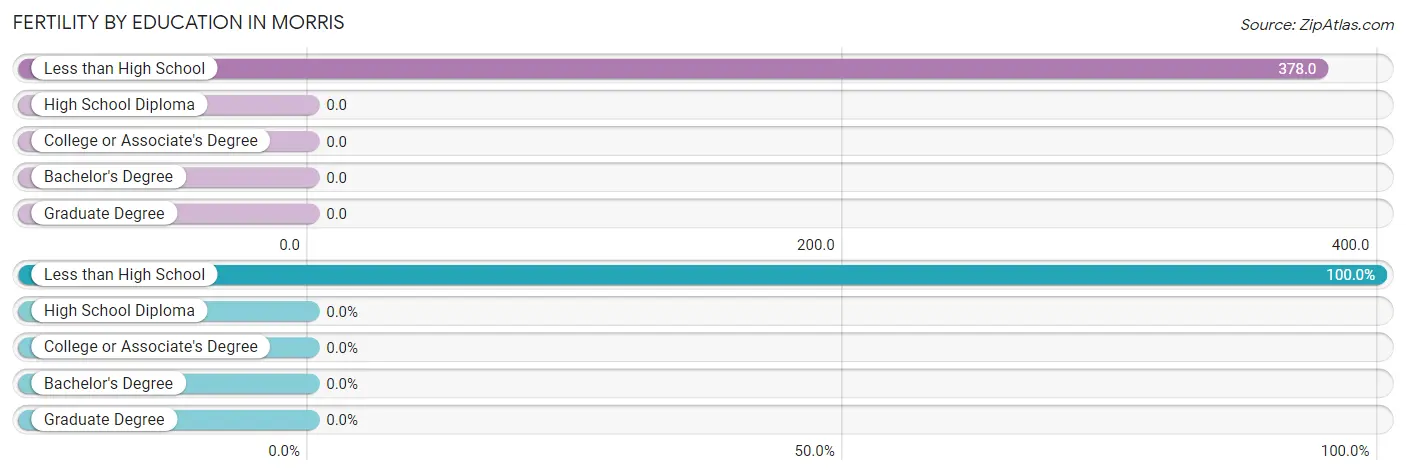
| Educational Attainment | Women with Births | Births / 1,000 Women |
| Less than High School | 17 (100.0%) | 378.0 |
| High School Diploma | 0 (0.0%) | 0.0 |
| College or Associate's Degree | 0 (0.0%) | 0.0 |
| Bachelor's Degree | 0 (0.0%) | 0.0 |
| Graduate Degree | 0 (0.0%) | 0.0 |
| Total | 17 (100.0%) | 129.0 |
Fertility by Education by Marriage Status in Morris
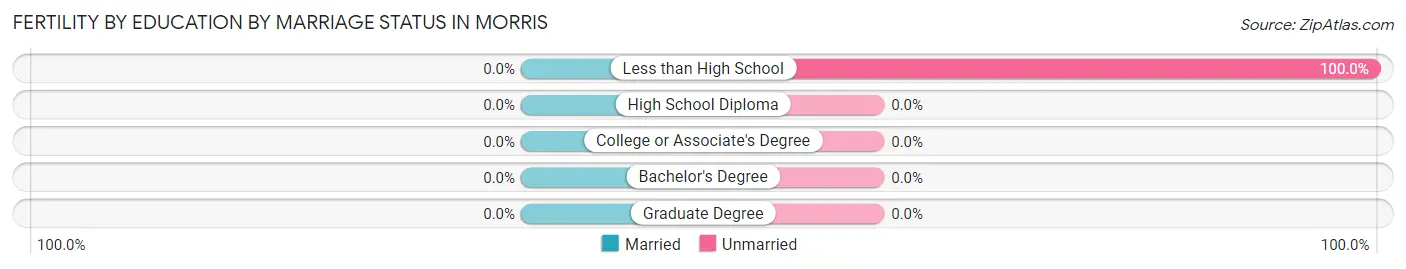
| Educational Attainment | Married | Unmarried |
| Less than High School | 0 (0.0%) | 17 (100.0%) |
| High School Diploma | 0 (0.0%) | 0 (0.0%) |
| College or Associate's Degree | 0 (0.0%) | 0 (0.0%) |
| Bachelor's Degree | 0 (0.0%) | 0 (0.0%) |
| Graduate Degree | 0 (0.0%) | 0 (0.0%) |
| Total | 0 (0.0%) | 17 (100.0%) |
Employment Characteristics in Morris
Employment by Class of Employer in Morris
Among the 218 employed individuals in Morris, private company employees (68 | 31.2%), state government employees (49 | 22.5%), and local government employees (45 | 20.6%) make up the most common classes of employment.
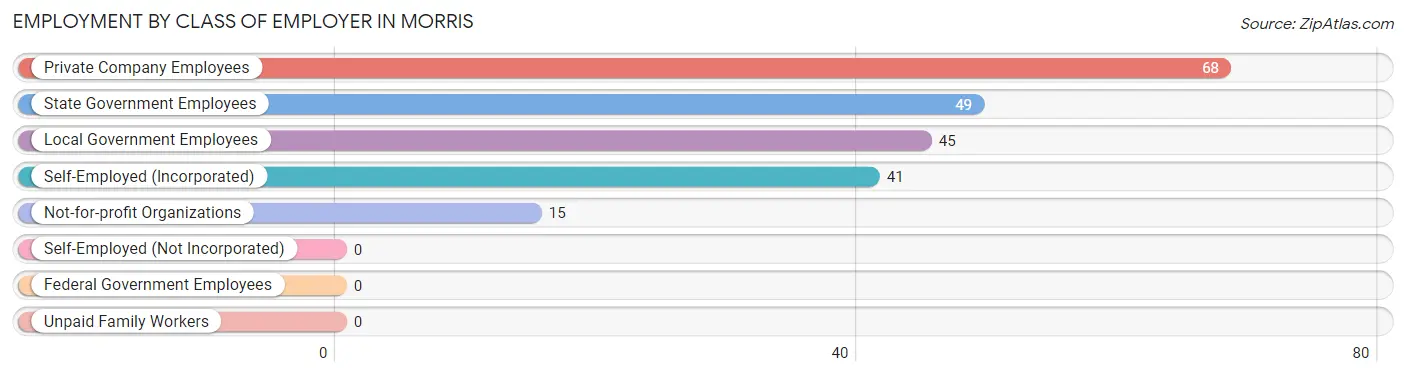
| Employer Class | # Employees | % Employees |
| Private Company Employees | 68 | 31.2% |
| Self-Employed (Incorporated) | 41 | 18.8% |
| Self-Employed (Not Incorporated) | 0 | 0.0% |
| Not-for-profit Organizations | 15 | 6.9% |
| Local Government Employees | 45 | 20.6% |
| State Government Employees | 49 | 22.5% |
| Federal Government Employees | 0 | 0.0% |
| Unpaid Family Workers | 0 | 0.0% |
| Total | 218 | 100.0% |
Employment Status by Age in Morris
According to the labor force statistics for Morris, out of the total population over 16 years of age (405), 54.8% or 222 individuals are in the labor force, with 1.8% or 4 of them unemployed. The age group with the highest labor force participation rate is 25 to 29 years, with 100.0% or 5 individuals in the labor force. Within the labor force, the 65 to 74 years age range has the highest percentage of unemployed individuals, with 22.2% or 4 of them being unemployed.
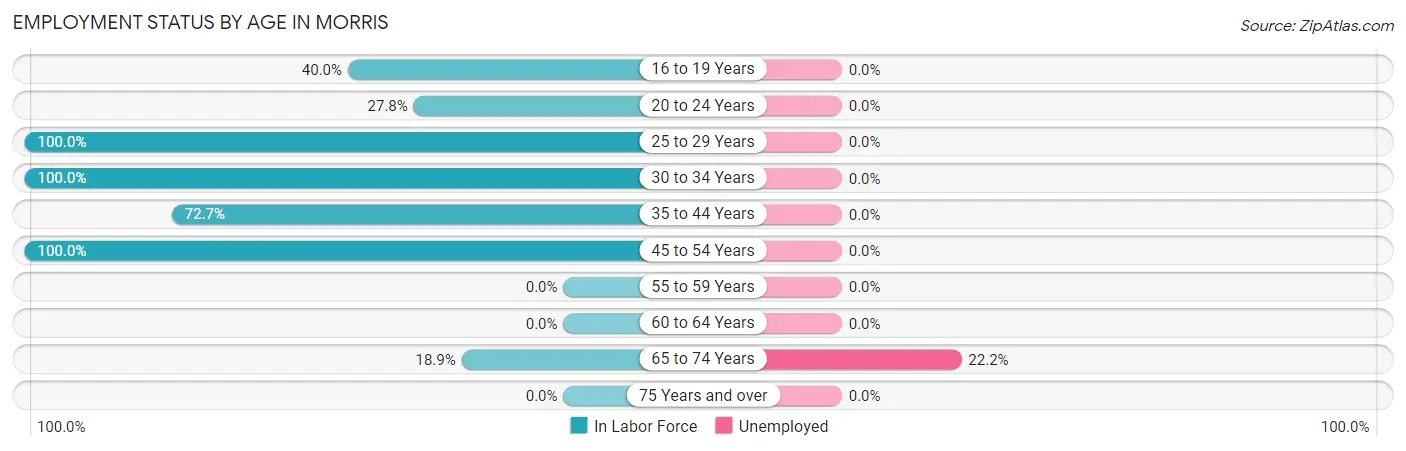
| Age Bracket | In Labor Force | Unemployed |
| 16 to 19 Years | 30 (40.0%) | 0 (0.0%) |
| 20 to 24 Years | 5 (27.8%) | 0 (0.0%) |
| 25 to 29 Years | 5 (100.0%) | 0 (0.0%) |
| 30 to 34 Years | 29 (100.0%) | 0 (0.0%) |
| 35 to 44 Years | 8 (72.7%) | 0 (0.0%) |
| 45 to 54 Years | 127 (100.0%) | 0 (0.0%) |
| 55 to 59 Years | 0 (0.0%) | 0 (0.0%) |
| 60 to 64 Years | 0 (0.0%) | 0 (0.0%) |
| 65 to 74 Years | 18 (18.9%) | 4 (22.2%) |
| 75 Years and over | 0 (0.0%) | 0 (0.0%) |
| Total | 222 (54.8%) | 4 (1.8%) |
Employment Status by Educational Attainment in Morris
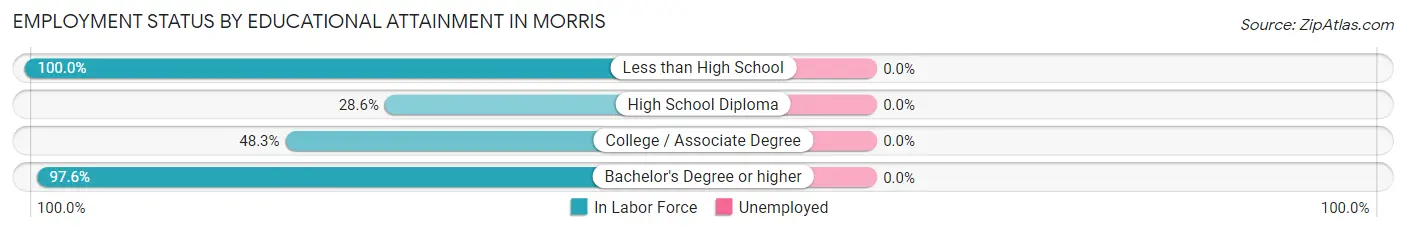
| Educational Attainment | In Labor Force | Unemployed |
| Less than High School | 26 (100.0%) | 0 (0.0%) |
| High School Diploma | 6 (28.6%) | 0 (0.0%) |
| College / Associate Degree | 14 (48.3%) | 0 (0.0%) |
| Bachelor's Degree or higher | 123 (97.6%) | 0 (0.0%) |
| Total | 169 (83.7%) | 0 (0.0%) |
Employment Occupations by Sex in Morris
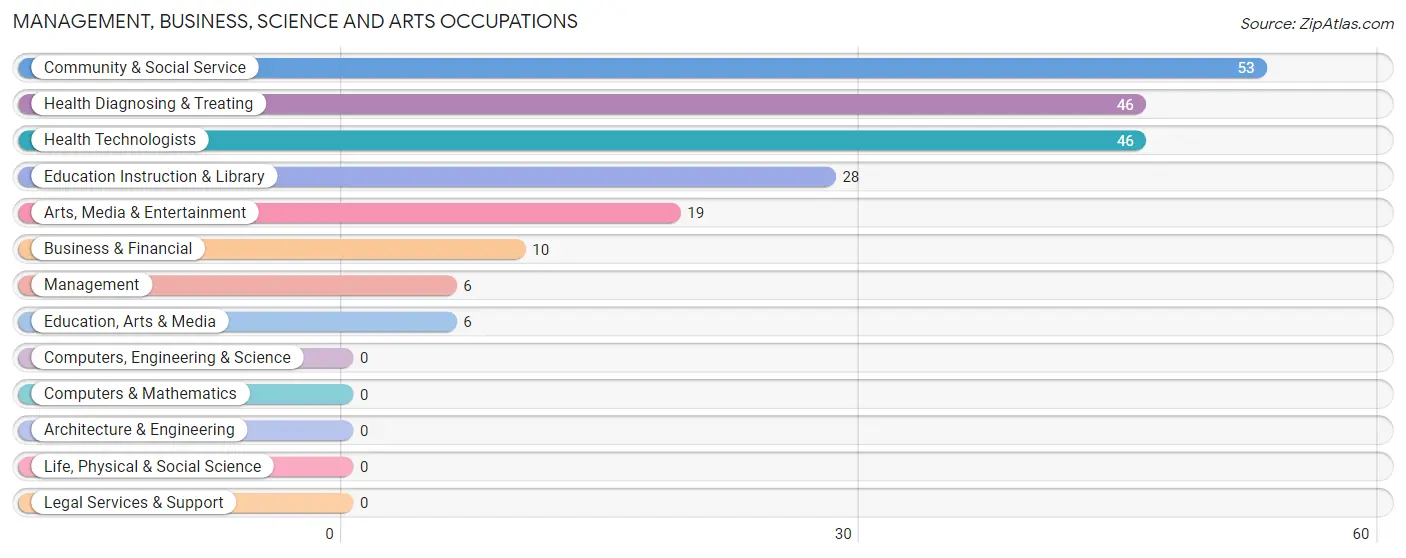
Management, Business, Science and Arts Occupations
The most common Management, Business, Science and Arts occupations in Morris are Community & Social Service (53 | 24.3%), Health Diagnosing & Treating (46 | 21.1%), Health Technologists (46 | 21.1%), Education Instruction & Library (28 | 12.8%), and Arts, Media & Entertainment (19 | 8.7%).
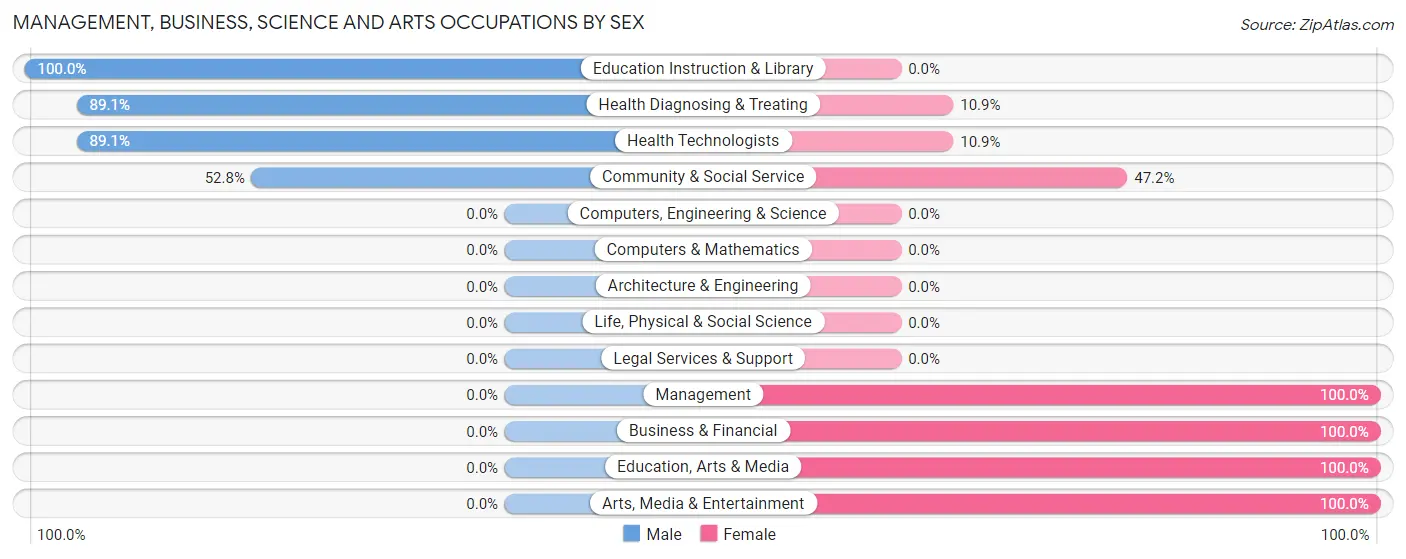
Management, Business, Science and Arts Occupations by Sex
Within the Management, Business, Science and Arts occupations in Morris, the most male-oriented occupations are Education Instruction & Library (100.0%), Health Diagnosing & Treating (89.1%), and Health Technologists (89.1%), while the most female-oriented occupations are Management (100.0%), Business & Financial (100.0%), and Education, Arts & Media (100.0%).
| Occupation | Male | Female |
| Management | 0 (0.0%) | 6 (100.0%) |
| Business & Financial | 0 (0.0%) | 10 (100.0%) |
| Computers, Engineering & Science | 0 (0.0%) | 0 (0.0%) |
| Computers & Mathematics | 0 (0.0%) | 0 (0.0%) |
| Architecture & Engineering | 0 (0.0%) | 0 (0.0%) |
| Life, Physical & Social Science | 0 (0.0%) | 0 (0.0%) |
| Community & Social Service | 28 (52.8%) | 25 (47.2%) |
| Education, Arts & Media | 0 (0.0%) | 6 (100.0%) |
| Legal Services & Support | 0 (0.0%) | 0 (0.0%) |
| Education Instruction & Library | 28 (100.0%) | 0 (0.0%) |
| Arts, Media & Entertainment | 0 (0.0%) | 19 (100.0%) |
| Health Diagnosing & Treating | 41 (89.1%) | 5 (10.9%) |
| Health Technologists | 41 (89.1%) | 5 (10.9%) |
| Total (Category) | 69 (60.0%) | 46 (40.0%) |
| Total (Overall) | 89 (40.8%) | 129 (59.2%) |
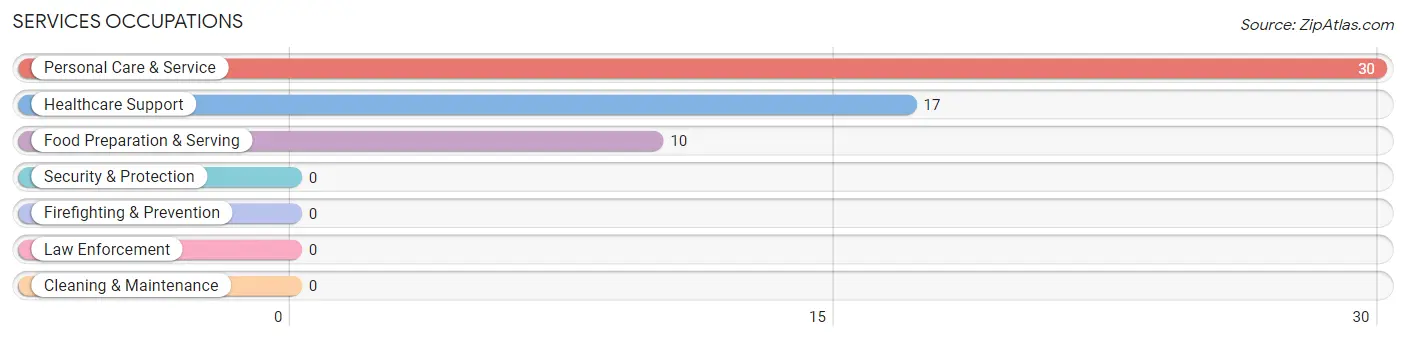
Services Occupations
The most common Services occupations in Morris are Personal Care & Service (30 | 13.8%), Healthcare Support (17 | 7.8%), and Food Preparation & Serving (10 | 4.6%).
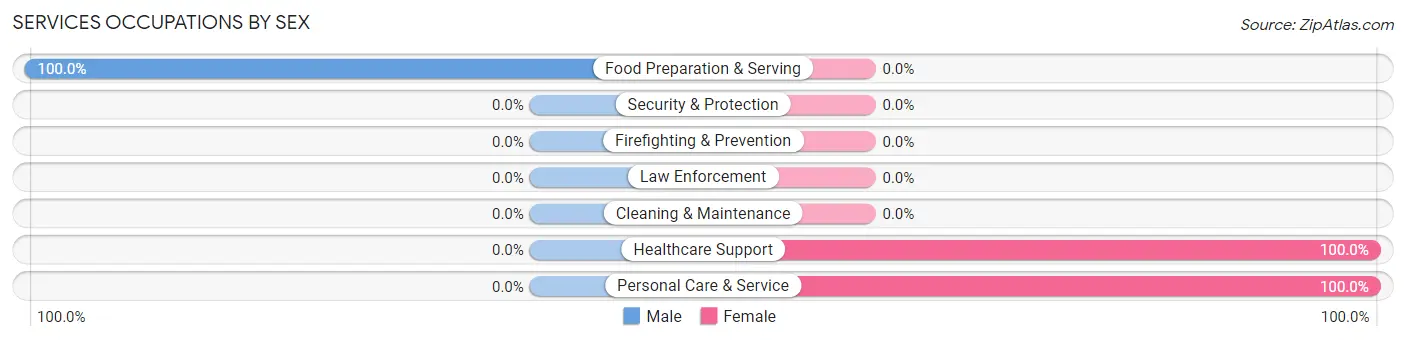
Services Occupations by Sex
| Occupation | Male | Female |
| Healthcare Support | 0 (0.0%) | 17 (100.0%) |
| Security & Protection | 0 (0.0%) | 0 (0.0%) |
| Firefighting & Prevention | 0 (0.0%) | 0 (0.0%) |
| Law Enforcement | 0 (0.0%) | 0 (0.0%) |
| Food Preparation & Serving | 10 (100.0%) | 0 (0.0%) |
| Cleaning & Maintenance | 0 (0.0%) | 0 (0.0%) |
| Personal Care & Service | 0 (0.0%) | 30 (100.0%) |
| Total (Category) | 10 (17.5%) | 47 (82.5%) |
| Total (Overall) | 89 (40.8%) | 129 (59.2%) |
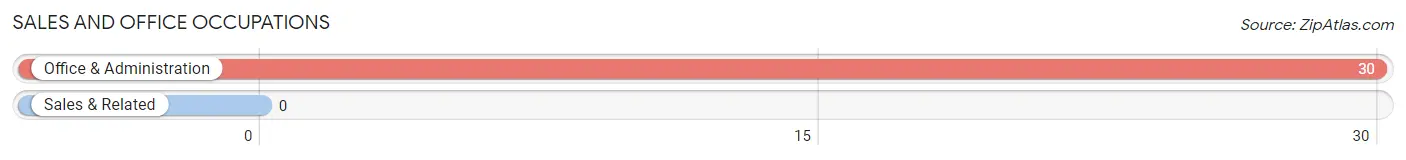
Sales and Office Occupations
The most common Sales and Office occupations in Morris are , and Office & Administration (30 | 13.8%).
Sales and Office Occupations by Sex
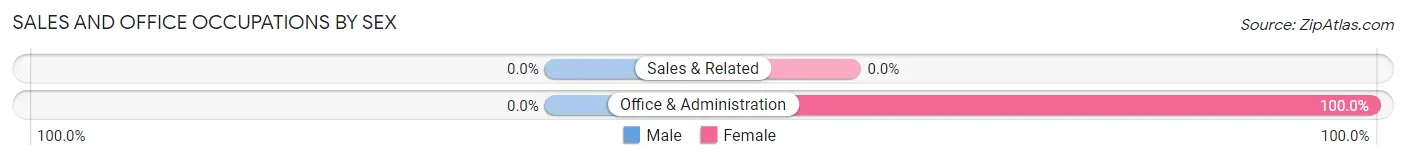
| Occupation | Male | Female |
| Sales & Related | 0 (0.0%) | 0 (0.0%) |
| Office & Administration | 0 (0.0%) | 30 (100.0%) |
| Total (Category) | 0 (0.0%) | 30 (100.0%) |
| Total (Overall) | 89 (40.8%) | 129 (59.2%) |
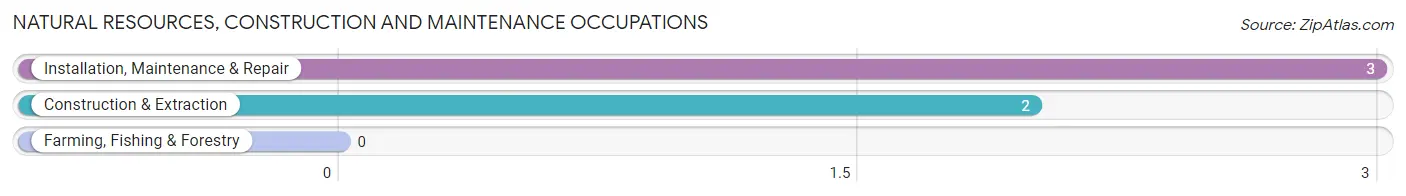
Natural Resources, Construction and Maintenance Occupations
The most common Natural Resources, Construction and Maintenance occupations in Morris are Installation, Maintenance & Repair (3 | 1.4%), and Construction & Extraction (2 | 0.9%).
Natural Resources, Construction and Maintenance Occupations by Sex
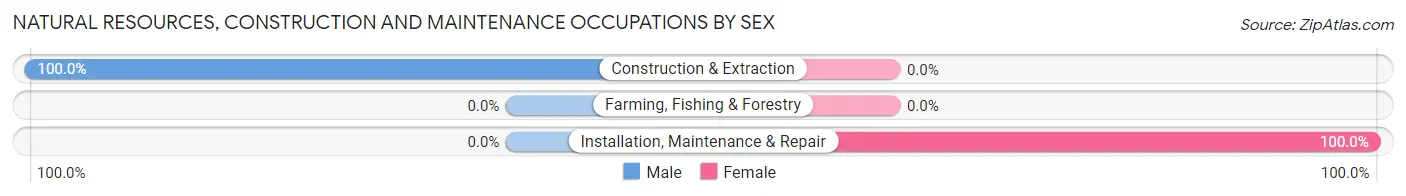
| Occupation | Male | Female |
| Farming, Fishing & Forestry | 0 (0.0%) | 0 (0.0%) |
| Construction & Extraction | 2 (100.0%) | 0 (0.0%) |
| Installation, Maintenance & Repair | 0 (0.0%) | 3 (100.0%) |
| Total (Category) | 2 (40.0%) | 3 (60.0%) |
| Total (Overall) | 89 (40.8%) | 129 (59.2%) |
Production, Transportation and Moving Occupations
The most common Production, Transportation and Moving occupations in Morris are Production (6 | 2.8%), and Transportation (5 | 2.3%).
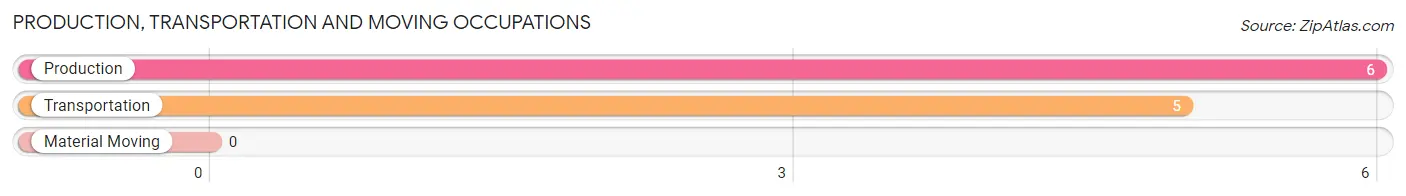
Production, Transportation and Moving Occupations by Sex
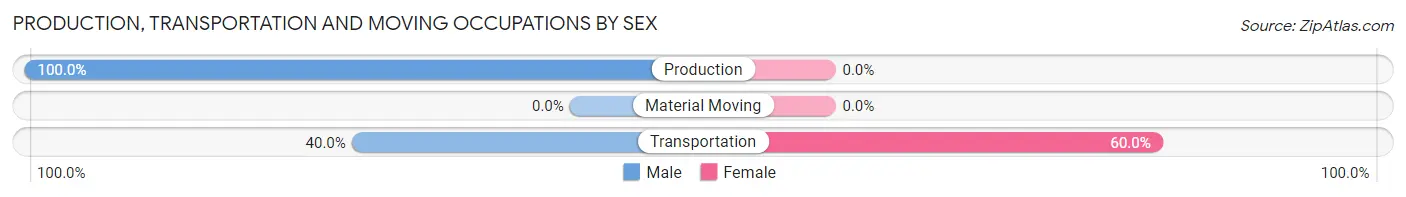
| Occupation | Male | Female |
| Production | 6 (100.0%) | 0 (0.0%) |
| Transportation | 2 (40.0%) | 3 (60.0%) |
| Material Moving | 0 (0.0%) | 0 (0.0%) |
| Total (Category) | 8 (72.7%) | 3 (27.3%) |
| Total (Overall) | 89 (40.8%) | 129 (59.2%) |
Employment Industries by Sex in Morris
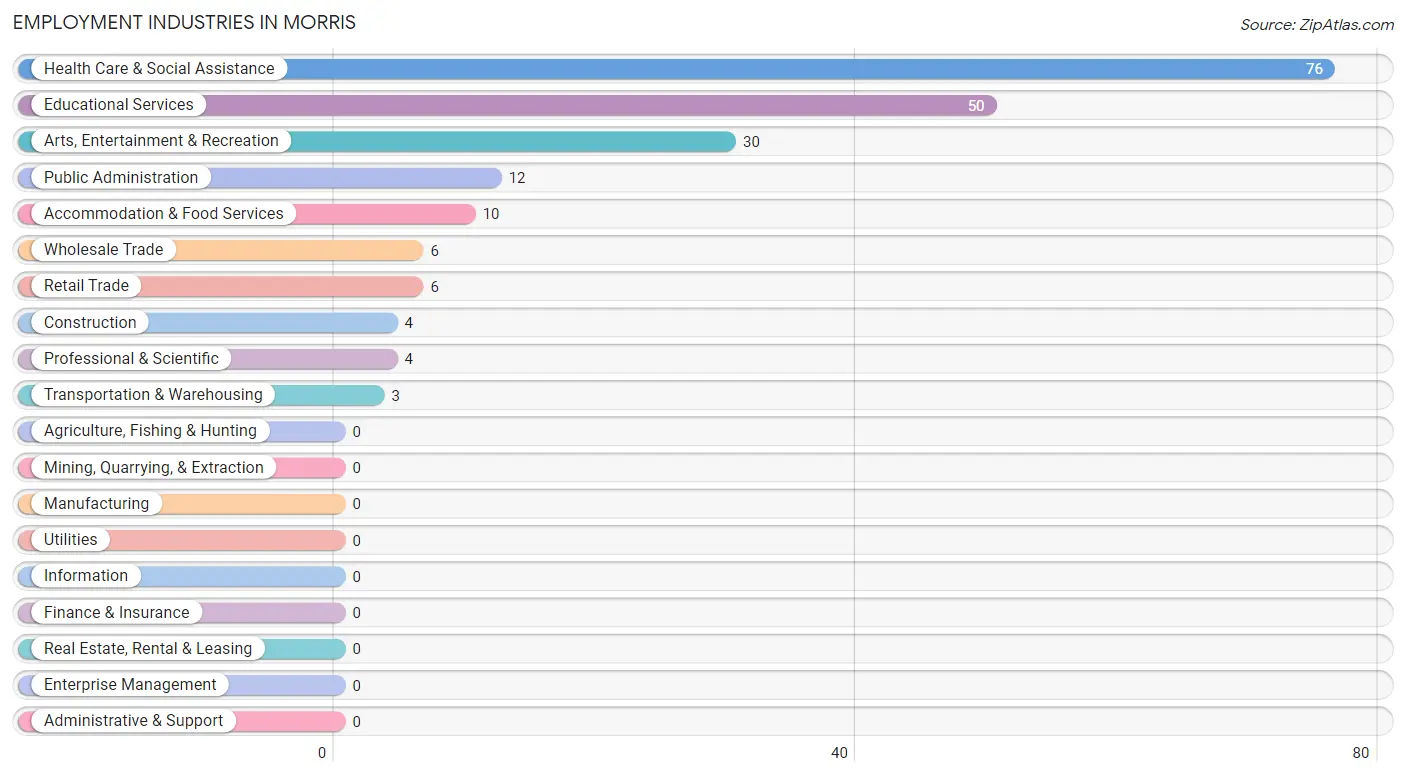
Employment Industries in Morris
The major employment industries in Morris include Health Care & Social Assistance (76 | 34.9%), Educational Services (50 | 22.9%), Arts, Entertainment & Recreation (30 | 13.8%), Public Administration (12 | 5.5%), and Accommodation & Food Services (10 | 4.6%).
Employment Industries by Sex in Morris
The Morris industries that see more men than women are Construction (100.0%), Retail Trade (100.0%), and Accommodation & Food Services (100.0%), whereas the industries that tend to have a higher number of women are Wholesale Trade (100.0%), Transportation & Warehousing (100.0%), and Professional & Scientific (100.0%).
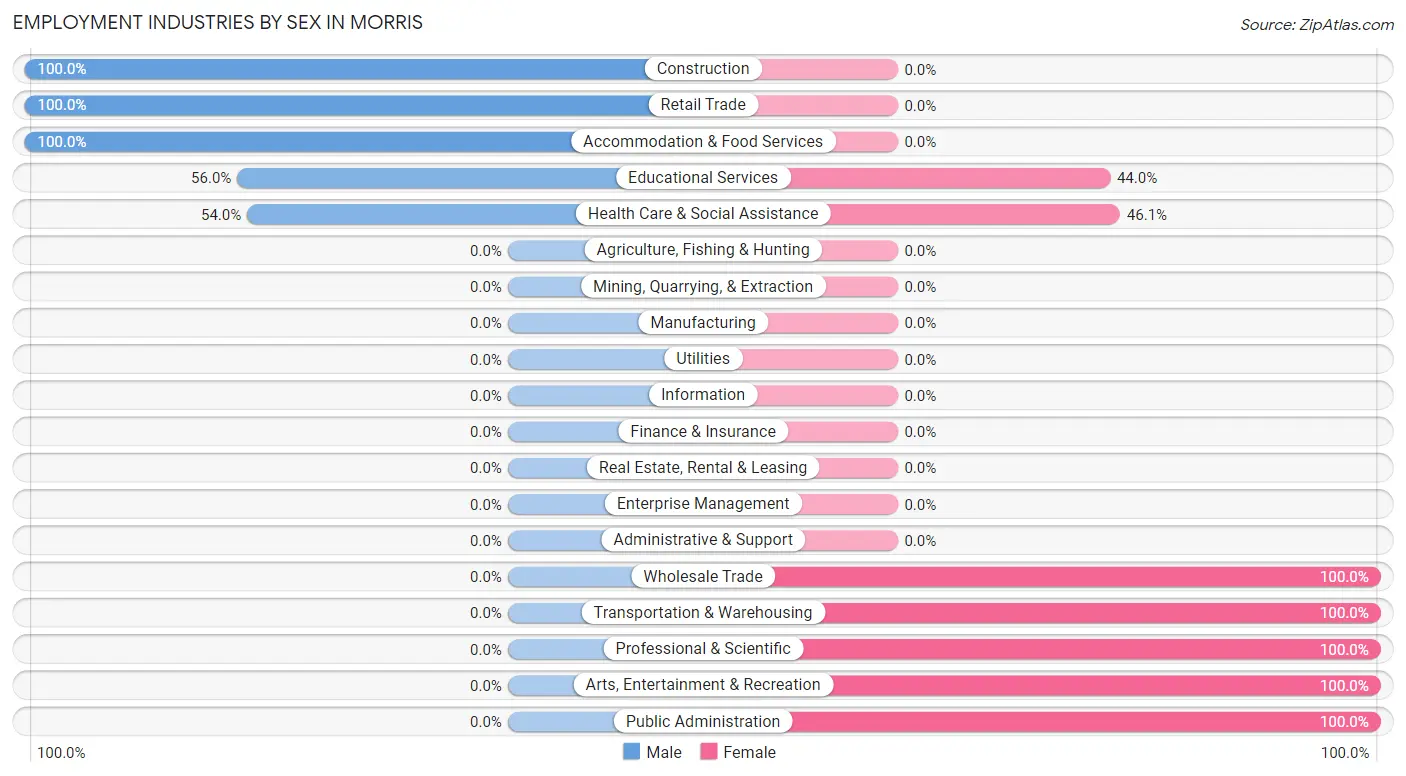
| Industry | Male | Female |
| Agriculture, Fishing & Hunting | 0 (0.0%) | 0 (0.0%) |
| Mining, Quarrying, & Extraction | 0 (0.0%) | 0 (0.0%) |
| Construction | 4 (100.0%) | 0 (0.0%) |
| Manufacturing | 0 (0.0%) | 0 (0.0%) |
| Wholesale Trade | 0 (0.0%) | 6 (100.0%) |
| Retail Trade | 6 (100.0%) | 0 (0.0%) |
| Transportation & Warehousing | 0 (0.0%) | 3 (100.0%) |
| Utilities | 0 (0.0%) | 0 (0.0%) |
| Information | 0 (0.0%) | 0 (0.0%) |
| Finance & Insurance | 0 (0.0%) | 0 (0.0%) |
| Real Estate, Rental & Leasing | 0 (0.0%) | 0 (0.0%) |
| Professional & Scientific | 0 (0.0%) | 4 (100.0%) |
| Enterprise Management | 0 (0.0%) | 0 (0.0%) |
| Administrative & Support | 0 (0.0%) | 0 (0.0%) |
| Educational Services | 28 (56.0%) | 22 (44.0%) |
| Health Care & Social Assistance | 41 (53.9%) | 35 (46.1%) |
| Arts, Entertainment & Recreation | 0 (0.0%) | 30 (100.0%) |
| Accommodation & Food Services | 10 (100.0%) | 0 (0.0%) |
| Public Administration | 0 (0.0%) | 12 (100.0%) |
| Total | 89 (40.8%) | 129 (59.2%) |
Education in Morris
School Enrollment in Morris
The most common levels of schooling among the 145 students in Morris are high school (54 | 37.2%), middle school (41 | 28.3%), and elementary school (21 | 14.5%).
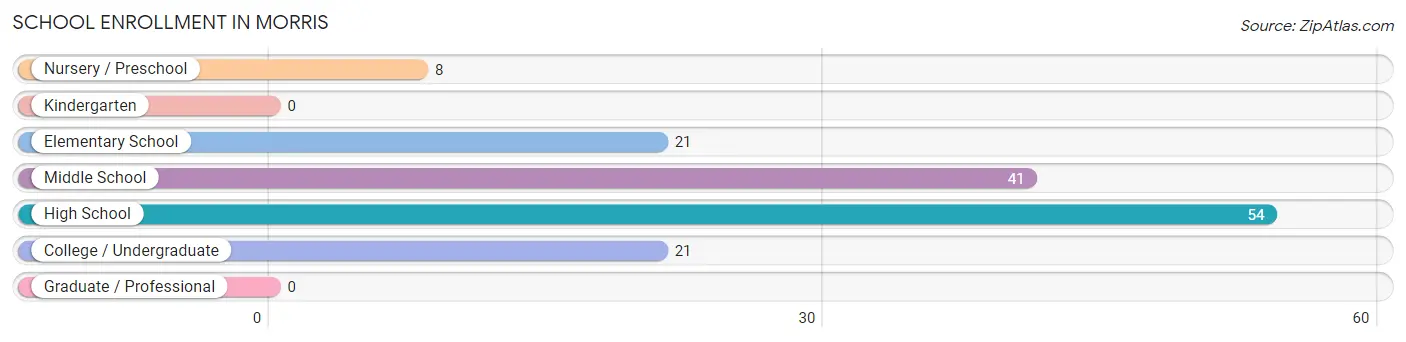
| School Level | # Students | % Students |
| Nursery / Preschool | 8 | 5.5% |
| Kindergarten | 0 | 0.0% |
| Elementary School | 21 | 14.5% |
| Middle School | 41 | 28.3% |
| High School | 54 | 37.2% |
| College / Undergraduate | 21 | 14.5% |
| Graduate / Professional | 0 | 0.0% |
| Total | 145 | 100.0% |
School Enrollment by Age by Funding Source in Morris
Out of a total of 145 students who are enrolled in schools in Morris, 24 (16.6%) attend a private institution, while the remaining 121 (83.4%) are enrolled in public schools. The age group of 18 to 19 year olds has the highest likelihood of being enrolled in private schools, with 21 (41.2% in the age bracket) enrolled. Conversely, the age group of 3 to 4 year olds has the lowest likelihood of being enrolled in a private school, with 8 (100.0% in the age bracket) attending a public institution.
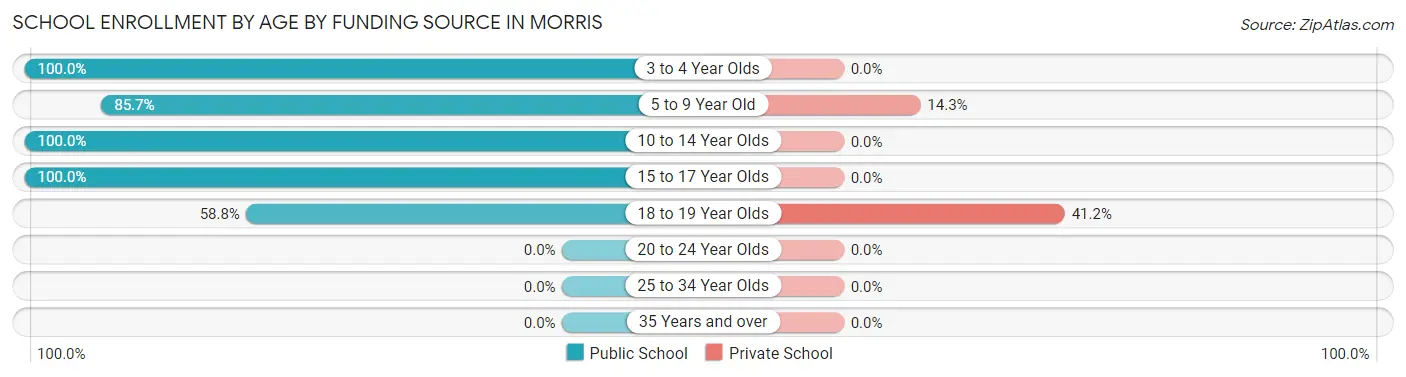
| Age Bracket | Public School | Private School |
| 3 to 4 Year Olds | 8 (100.0%) | 0 (0.0%) |
| 5 to 9 Year Old | 18 (85.7%) | 3 (14.3%) |
| 10 to 14 Year Olds | 41 (100.0%) | 0 (0.0%) |
| 15 to 17 Year Olds | 24 (100.0%) | 0 (0.0%) |
| 18 to 19 Year Olds | 30 (58.8%) | 21 (41.2%) |
| 20 to 24 Year Olds | 0 (0.0%) | 0 (0.0%) |
| 25 to 34 Year Olds | 0 (0.0%) | 0 (0.0%) |
| 35 Years and over | 0 (0.0%) | 0 (0.0%) |
| Total | 121 (83.4%) | 24 (16.6%) |
Educational Attainment by Field of Study in Morris
Education (73 | 42.9%), bio, nature & agricultural (46 | 27.1%), science & technology (29 | 17.1%), liberal arts & history (9 | 5.3%), and business (6 | 3.5%) are the most common fields of study among 170 individuals in Morris who have obtained a bachelor's degree or higher.
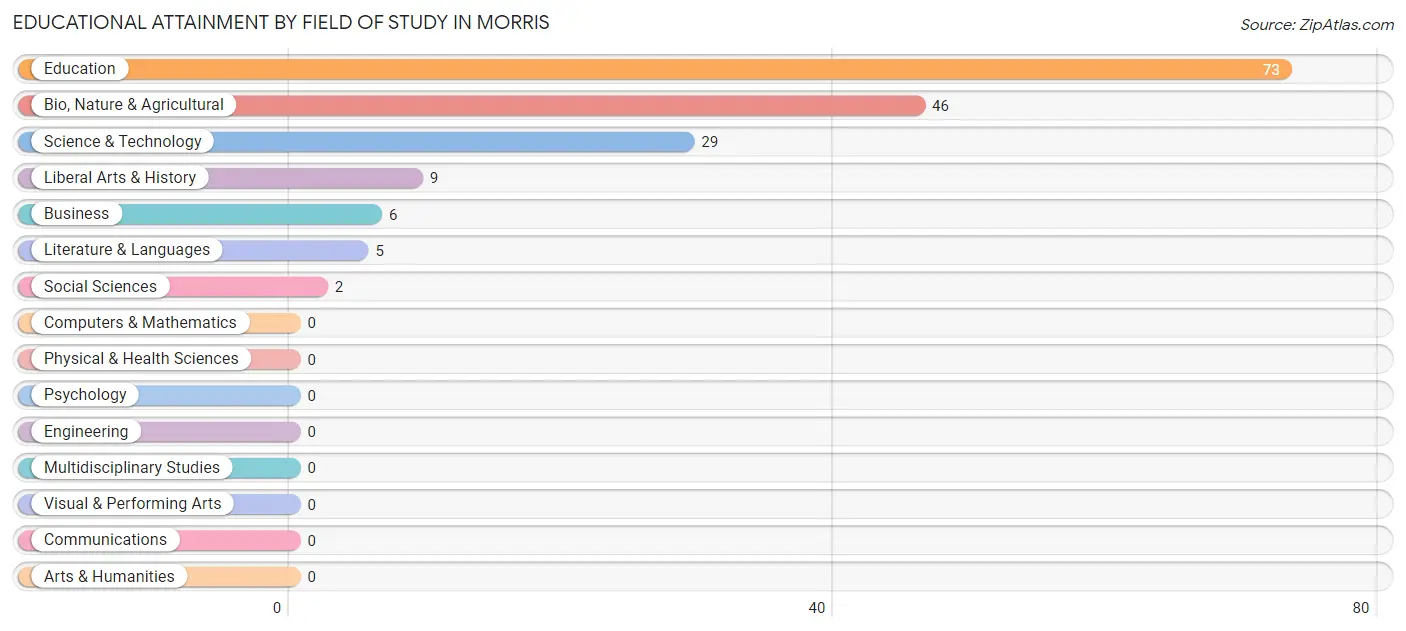
| Field of Study | # Graduates | % Graduates |
| Computers & Mathematics | 0 | 0.0% |
| Bio, Nature & Agricultural | 46 | 27.1% |
| Physical & Health Sciences | 0 | 0.0% |
| Psychology | 0 | 0.0% |
| Social Sciences | 2 | 1.2% |
| Engineering | 0 | 0.0% |
| Multidisciplinary Studies | 0 | 0.0% |
| Science & Technology | 29 | 17.1% |
| Business | 6 | 3.5% |
| Education | 73 | 42.9% |
| Literature & Languages | 5 | 2.9% |
| Liberal Arts & History | 9 | 5.3% |
| Visual & Performing Arts | 0 | 0.0% |
| Communications | 0 | 0.0% |
| Arts & Humanities | 0 | 0.0% |
| Total | 170 | 100.0% |
Transportation & Commute in Morris
Vehicle Availability by Sex in Morris
The most prevalent vehicle ownership categories in Morris are males with 2 vehicles (41, accounting for 46.1%) and females with 2 vehicles (84, making up 31.8%).
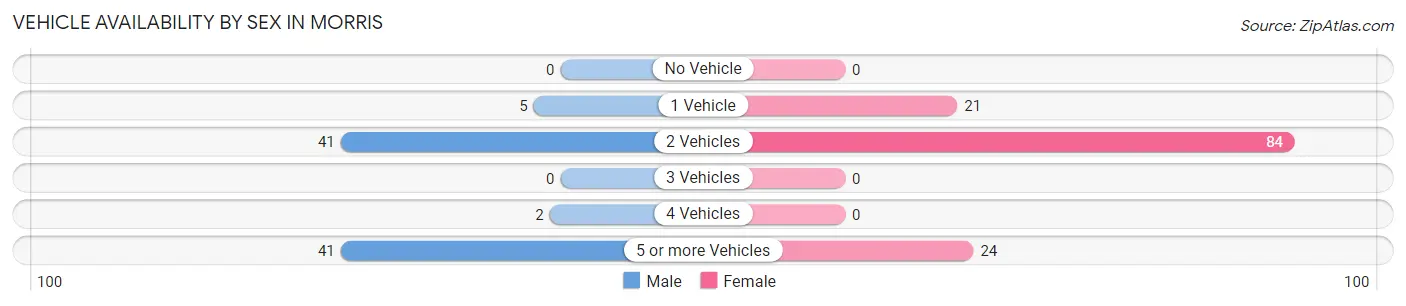
| Vehicles Available | Male | Female |
| No Vehicle | 0 (0.0%) | 0 (0.0%) |
| 1 Vehicle | 5 (5.6%) | 21 (16.3%) |
| 2 Vehicles | 41 (46.1%) | 84 (65.1%) |
| 3 Vehicles | 0 (0.0%) | 0 (0.0%) |
| 4 Vehicles | 2 (2.2%) | 0 (0.0%) |
| 5 or more Vehicles | 41 (46.1%) | 24 (18.6%) |
| Total | 89 (100.0%) | 129 (100.0%) |
Commute Time in Morris
The most frequently occuring commute durations in Morris are 30 to 34 minutes (109 commuters, 62.3%), 20 to 24 minutes (21 commuters, 12.0%), and 10 to 14 minutes (17 commuters, 9.7%).
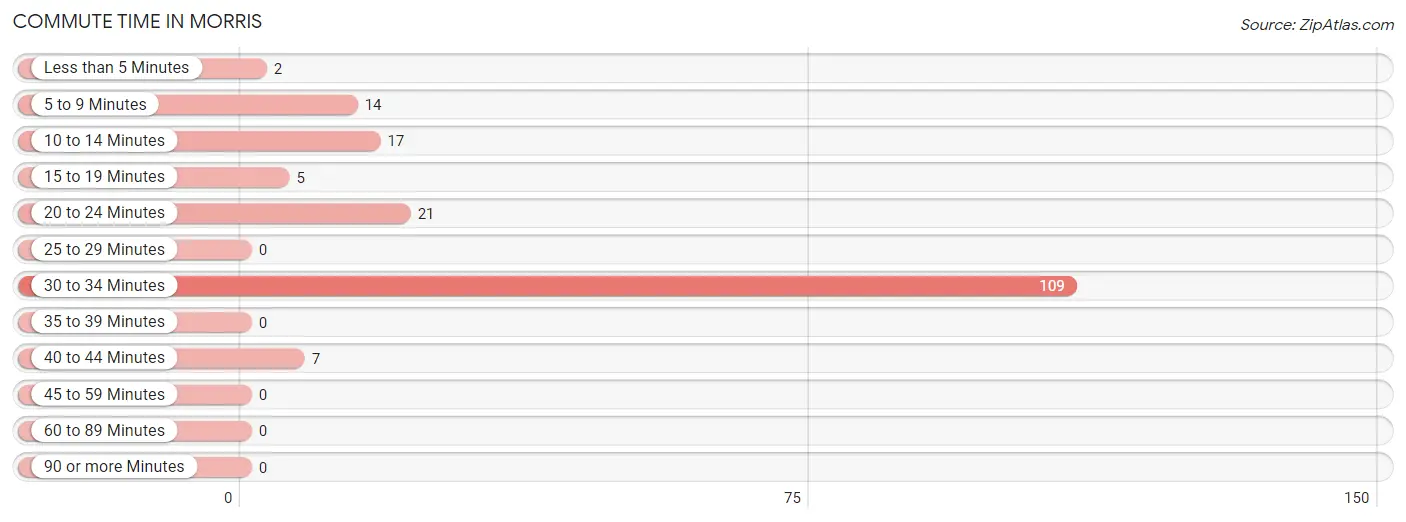
| Commute Time | # Commuters | % Commuters |
| Less than 5 Minutes | 2 | 1.1% |
| 5 to 9 Minutes | 14 | 8.0% |
| 10 to 14 Minutes | 17 | 9.7% |
| 15 to 19 Minutes | 5 | 2.9% |
| 20 to 24 Minutes | 21 | 12.0% |
| 25 to 29 Minutes | 0 | 0.0% |
| 30 to 34 Minutes | 109 | 62.3% |
| 35 to 39 Minutes | 0 | 0.0% |
| 40 to 44 Minutes | 7 | 4.0% |
| 45 to 59 Minutes | 0 | 0.0% |
| 60 to 89 Minutes | 0 | 0.0% |
| 90 or more Minutes | 0 | 0.0% |
Commute Time by Sex in Morris
The most common commute times in Morris are 30 to 34 minutes (74 commuters, 83.2%) for males and 30 to 34 minutes (35 commuters, 40.7%) for females.
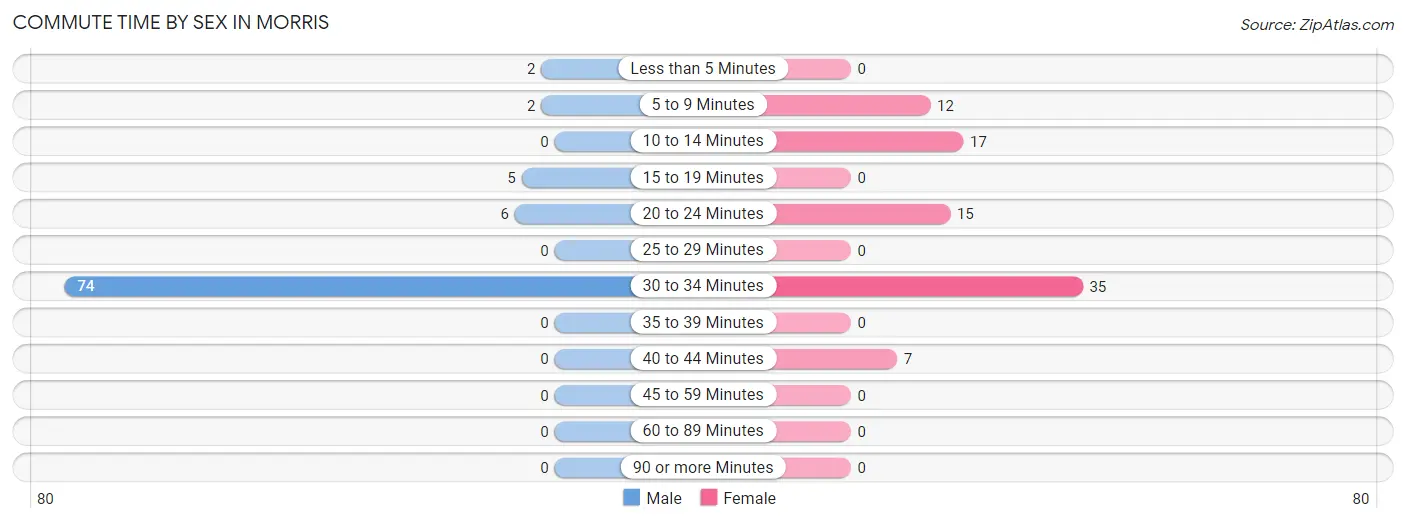
| Commute Time | Male | Female |
| Less than 5 Minutes | 2 (2.2%) | 0 (0.0%) |
| 5 to 9 Minutes | 2 (2.2%) | 12 (14.0%) |
| 10 to 14 Minutes | 0 (0.0%) | 17 (19.8%) |
| 15 to 19 Minutes | 5 (5.6%) | 0 (0.0%) |
| 20 to 24 Minutes | 6 (6.7%) | 15 (17.4%) |
| 25 to 29 Minutes | 0 (0.0%) | 0 (0.0%) |
| 30 to 34 Minutes | 74 (83.2%) | 35 (40.7%) |
| 35 to 39 Minutes | 0 (0.0%) | 0 (0.0%) |
| 40 to 44 Minutes | 0 (0.0%) | 7 (8.1%) |
| 45 to 59 Minutes | 0 (0.0%) | 0 (0.0%) |
| 60 to 89 Minutes | 0 (0.0%) | 0 (0.0%) |
| 90 or more Minutes | 0 (0.0%) | 0 (0.0%) |
Time of Departure to Work by Sex in Morris
The most frequent times of departure to work in Morris are 6:30 AM to 6:59 AM (82, 92.1%) for males and 5:30 AM to 5:59 AM (30, 34.9%) for females.
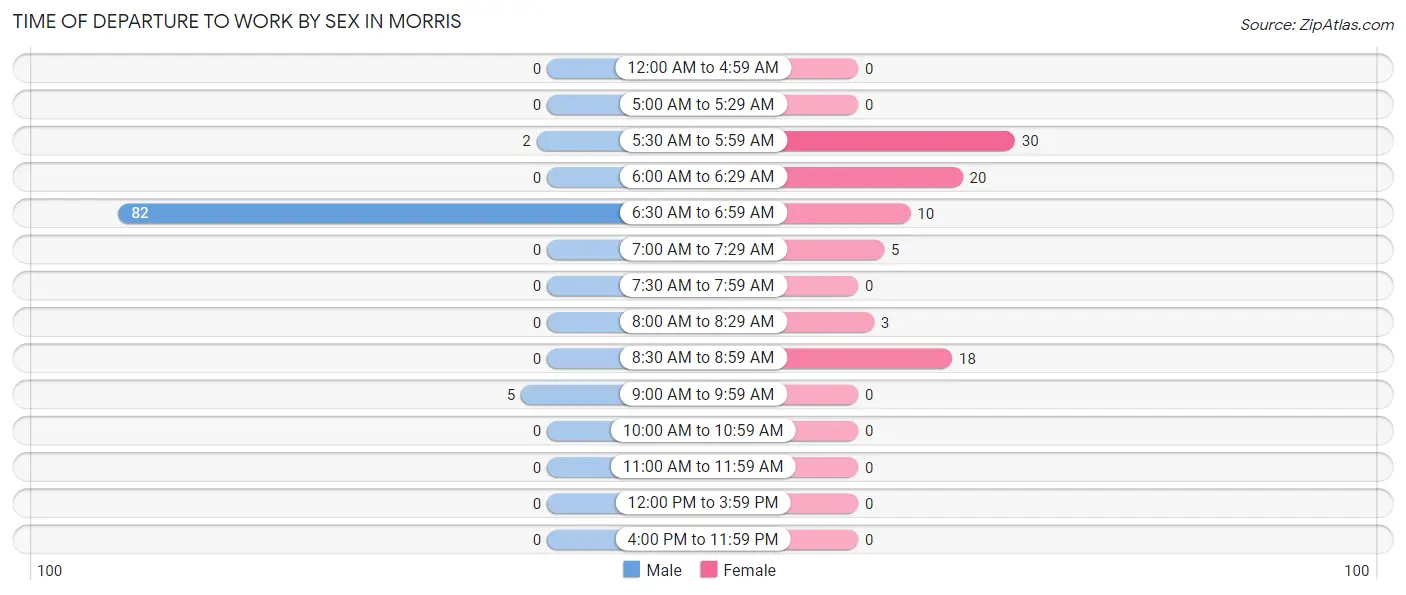
| Time of Departure | Male | Female |
| 12:00 AM to 4:59 AM | 0 (0.0%) | 0 (0.0%) |
| 5:00 AM to 5:29 AM | 0 (0.0%) | 0 (0.0%) |
| 5:30 AM to 5:59 AM | 2 (2.2%) | 30 (34.9%) |
| 6:00 AM to 6:29 AM | 0 (0.0%) | 20 (23.3%) |
| 6:30 AM to 6:59 AM | 82 (92.1%) | 10 (11.6%) |
| 7:00 AM to 7:29 AM | 0 (0.0%) | 5 (5.8%) |
| 7:30 AM to 7:59 AM | 0 (0.0%) | 0 (0.0%) |
| 8:00 AM to 8:29 AM | 0 (0.0%) | 3 (3.5%) |
| 8:30 AM to 8:59 AM | 0 (0.0%) | 18 (20.9%) |
| 9:00 AM to 9:59 AM | 5 (5.6%) | 0 (0.0%) |
| 10:00 AM to 10:59 AM | 0 (0.0%) | 0 (0.0%) |
| 11:00 AM to 11:59 AM | 0 (0.0%) | 0 (0.0%) |
| 12:00 PM to 3:59 PM | 0 (0.0%) | 0 (0.0%) |
| 4:00 PM to 11:59 PM | 0 (0.0%) | 0 (0.0%) |
| Total | 89 (100.0%) | 86 (100.0%) |
Housing Occupancy in Morris
Occupancy by Ownership in Morris
Of the total 212 dwellings in Morris, owner-occupied units account for 161 (75.9%), while renter-occupied units make up 51 (24.1%).
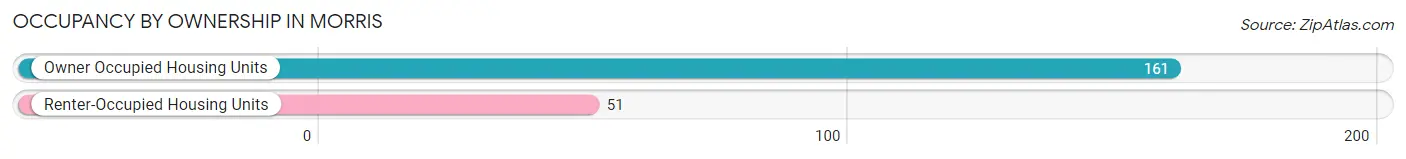
| Occupancy | # Housing Units | % Housing Units |
| Owner Occupied Housing Units | 161 | 75.9% |
| Renter-Occupied Housing Units | 51 | 24.1% |
| Total Occupied Housing Units | 212 | 100.0% |
Occupancy by Household Size in Morris
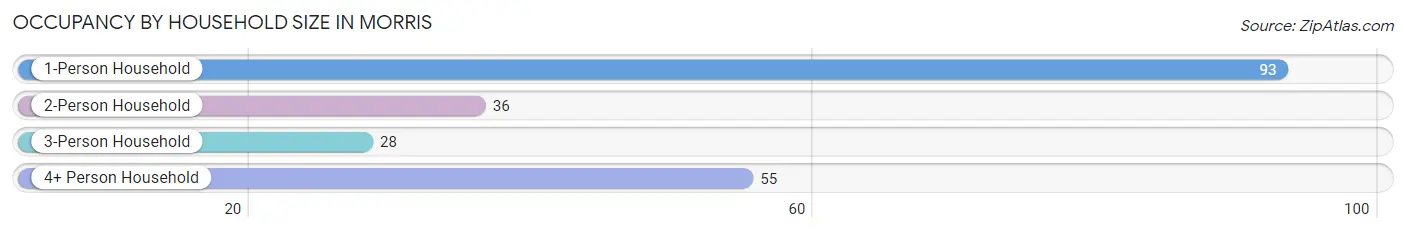
| Household Size | # Housing Units | % Housing Units |
| 1-Person Household | 93 | 43.9% |
| 2-Person Household | 36 | 17.0% |
| 3-Person Household | 28 | 13.2% |
| 4+ Person Household | 55 | 25.9% |
| Total Housing Units | 212 | 100.0% |
Occupancy by Ownership by Household Size in Morris
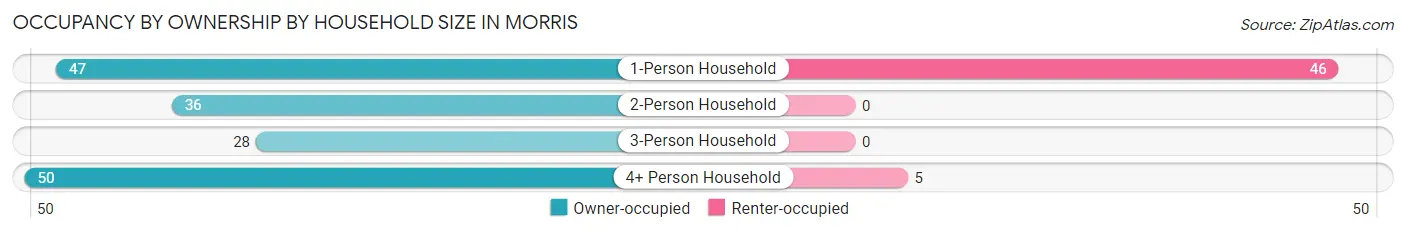
| Household Size | Owner-occupied | Renter-occupied |
| 1-Person Household | 47 (50.5%) | 46 (49.5%) |
| 2-Person Household | 36 (100.0%) | 0 (0.0%) |
| 3-Person Household | 28 (100.0%) | 0 (0.0%) |
| 4+ Person Household | 50 (90.9%) | 5 (9.1%) |
| Total Housing Units | 161 (75.9%) | 51 (24.1%) |
Occupancy by Educational Attainment in Morris
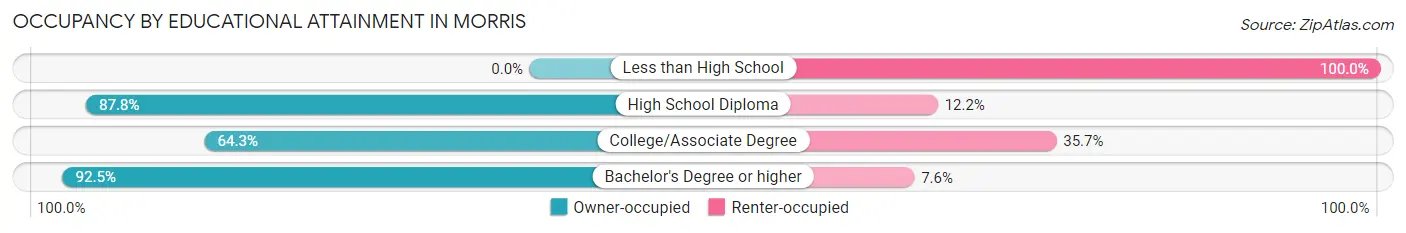
| Household Size | Owner-occupied | Renter-occupied |
| Less than High School | 0 (0.0%) | 23 (100.0%) |
| High School Diploma | 36 (87.8%) | 5 (12.2%) |
| College/Associate Degree | 27 (64.3%) | 15 (35.7%) |
| Bachelor's Degree or higher | 98 (92.4%) | 8 (7.5%) |
Occupancy by Age of Householder in Morris
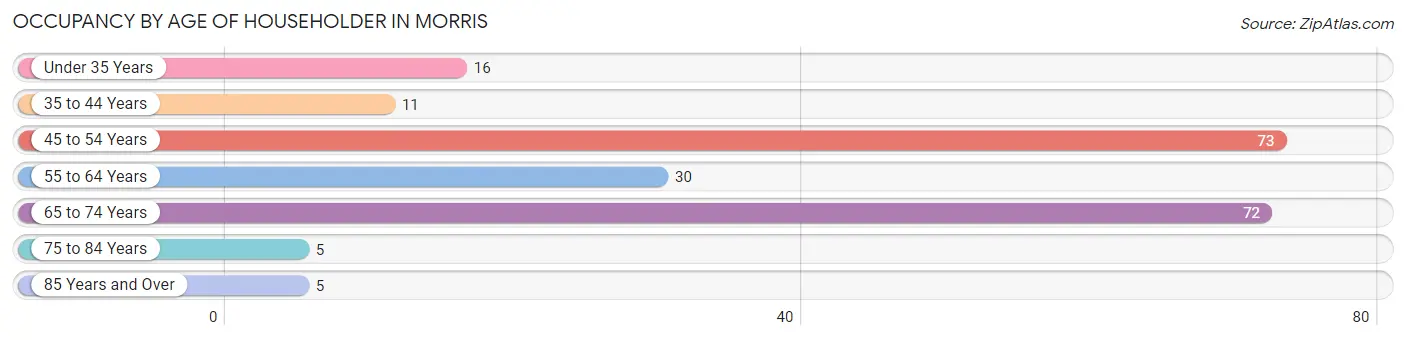
| Age Bracket | # Households | % Households |
| Under 35 Years | 16 | 7.5% |
| 35 to 44 Years | 11 | 5.2% |
| 45 to 54 Years | 73 | 34.4% |
| 55 to 64 Years | 30 | 14.1% |
| 65 to 74 Years | 72 | 34.0% |
| 75 to 84 Years | 5 | 2.4% |
| 85 Years and Over | 5 | 2.4% |
| Total | 212 | 100.0% |
Housing Finances in Morris
Median Income by Occupancy in Morris
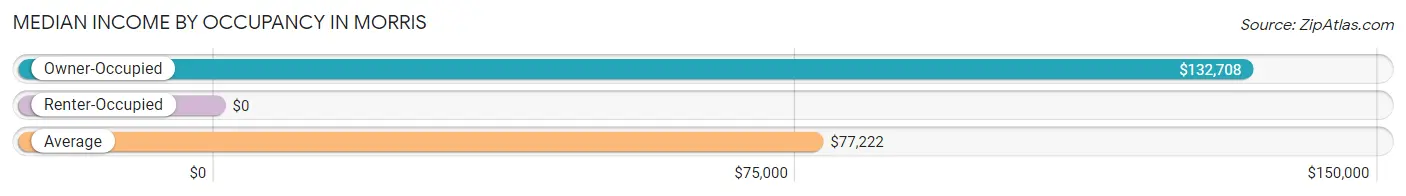
| Occupancy Type | # Households | Median Income |
| Owner-Occupied | 161 (75.9%) | $132,708 |
| Renter-Occupied | 51 (24.1%) | $0 |
| Average | 212 (100.0%) | $77,222 |
Occupancy by Householder Income Bracket in Morris
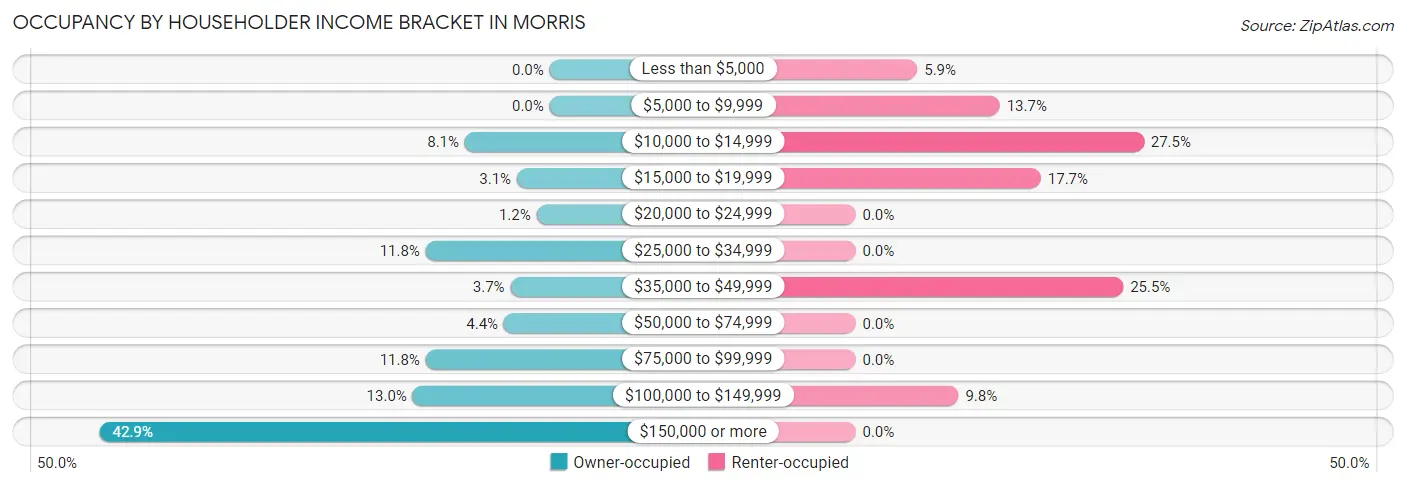
| Income Bracket | Owner-occupied | Renter-occupied |
| Less than $5,000 | 0 (0.0%) | 3 (5.9%) |
| $5,000 to $9,999 | 0 (0.0%) | 7 (13.7%) |
| $10,000 to $14,999 | 13 (8.1%) | 14 (27.5%) |
| $15,000 to $19,999 | 5 (3.1%) | 9 (17.6%) |
| $20,000 to $24,999 | 2 (1.2%) | 0 (0.0%) |
| $25,000 to $34,999 | 19 (11.8%) | 0 (0.0%) |
| $35,000 to $49,999 | 6 (3.7%) | 13 (25.5%) |
| $50,000 to $74,999 | 7 (4.3%) | 0 (0.0%) |
| $75,000 to $99,999 | 19 (11.8%) | 0 (0.0%) |
| $100,000 to $149,999 | 21 (13.0%) | 5 (9.8%) |
| $150,000 or more | 69 (42.9%) | 0 (0.0%) |
| Total | 161 (100.0%) | 51 (100.0%) |
Monthly Housing Cost Tiers in Morris
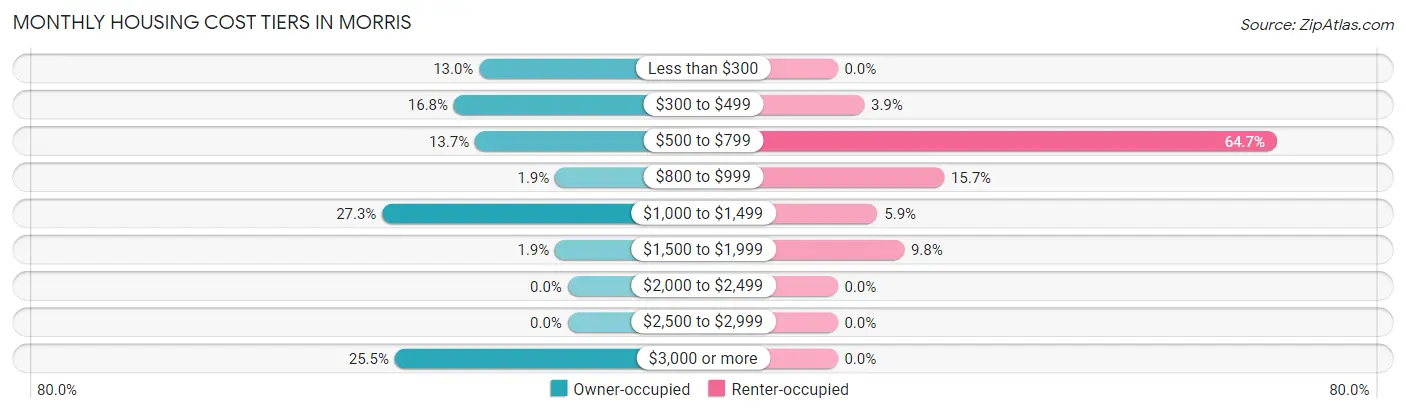
| Monthly Cost | Owner-occupied | Renter-occupied |
| Less than $300 | 21 (13.0%) | 0 (0.0%) |
| $300 to $499 | 27 (16.8%) | 2 (3.9%) |
| $500 to $799 | 22 (13.7%) | 33 (64.7%) |
| $800 to $999 | 3 (1.9%) | 8 (15.7%) |
| $1,000 to $1,499 | 44 (27.3%) | 3 (5.9%) |
| $1,500 to $1,999 | 3 (1.9%) | 5 (9.8%) |
| $2,000 to $2,499 | 0 (0.0%) | 0 (0.0%) |
| $2,500 to $2,999 | 0 (0.0%) | 0 (0.0%) |
| $3,000 or more | 41 (25.5%) | 0 (0.0%) |
| Total | 161 (100.0%) | 51 (100.0%) |
Physical Housing Characteristics in Morris
Housing Structures in Morris
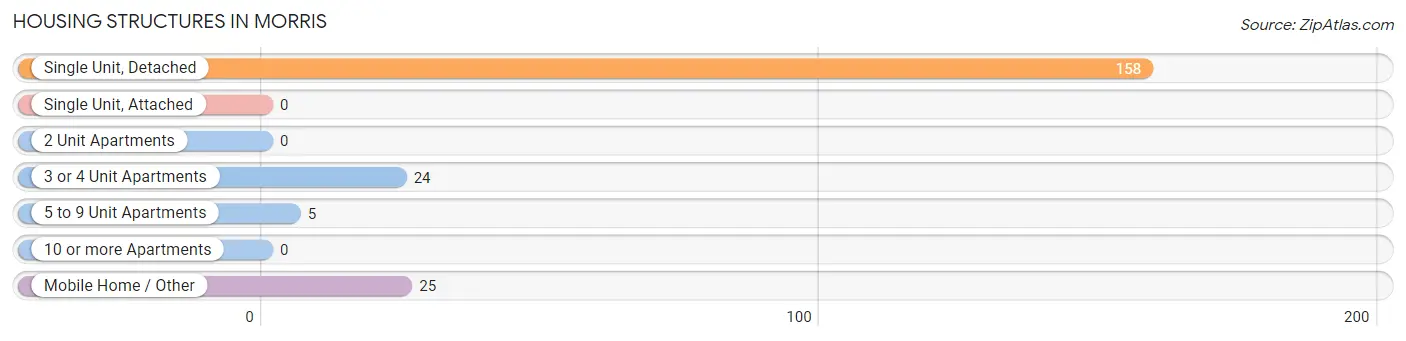
| Structure Type | # Housing Units | % Housing Units |
| Single Unit, Detached | 158 | 74.5% |
| Single Unit, Attached | 0 | 0.0% |
| 2 Unit Apartments | 0 | 0.0% |
| 3 or 4 Unit Apartments | 24 | 11.3% |
| 5 to 9 Unit Apartments | 5 | 2.4% |
| 10 or more Apartments | 0 | 0.0% |
| Mobile Home / Other | 25 | 11.8% |
| Total | 212 | 100.0% |
Housing Structures by Occupancy in Morris
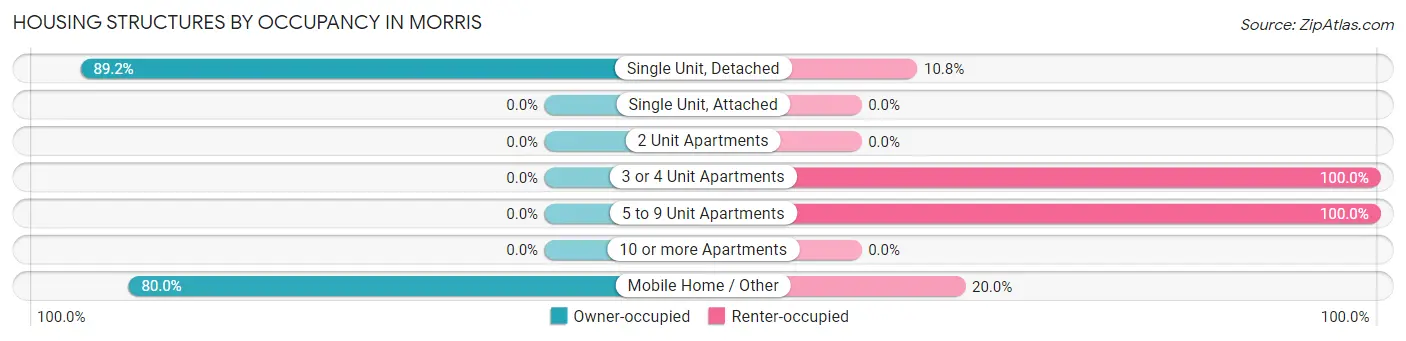
| Structure Type | Owner-occupied | Renter-occupied |
| Single Unit, Detached | 141 (89.2%) | 17 (10.8%) |
| Single Unit, Attached | 0 (0.0%) | 0 (0.0%) |
| 2 Unit Apartments | 0 (0.0%) | 0 (0.0%) |
| 3 or 4 Unit Apartments | 0 (0.0%) | 24 (100.0%) |
| 5 to 9 Unit Apartments | 0 (0.0%) | 5 (100.0%) |
| 10 or more Apartments | 0 (0.0%) | 0 (0.0%) |
| Mobile Home / Other | 20 (80.0%) | 5 (20.0%) |
| Total | 161 (75.9%) | 51 (24.1%) |
Housing Structures by Number of Rooms in Morris
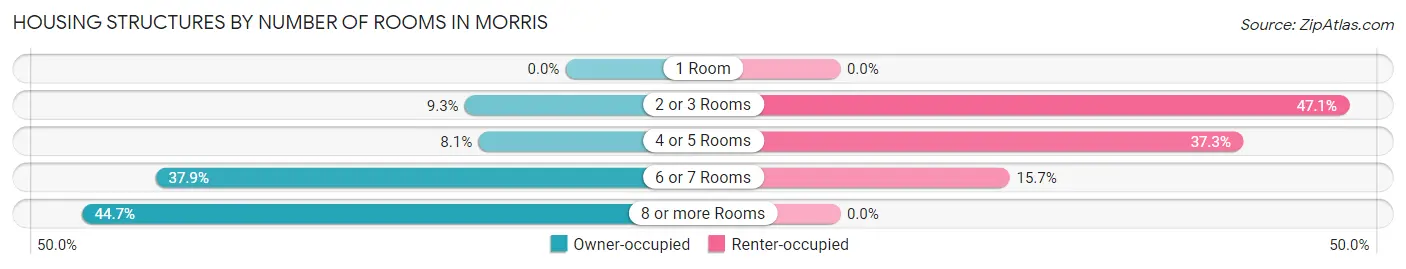
| Number of Rooms | Owner-occupied | Renter-occupied |
| 1 Room | 0 (0.0%) | 0 (0.0%) |
| 2 or 3 Rooms | 15 (9.3%) | 24 (47.1%) |
| 4 or 5 Rooms | 13 (8.1%) | 19 (37.2%) |
| 6 or 7 Rooms | 61 (37.9%) | 8 (15.7%) |
| 8 or more Rooms | 72 (44.7%) | 0 (0.0%) |
| Total | 161 (100.0%) | 51 (100.0%) |
Housing Structure by Heating Type in Morris
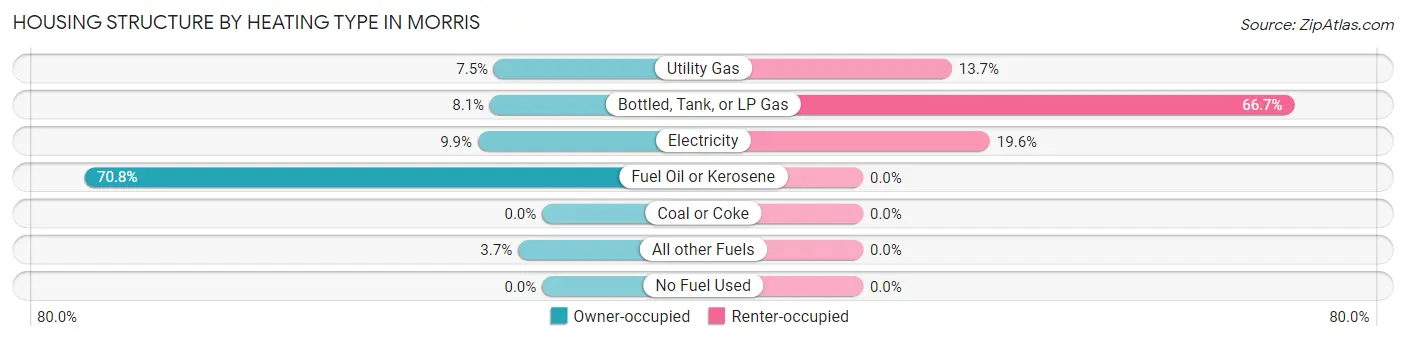
| Heating Type | Owner-occupied | Renter-occupied |
| Utility Gas | 12 (7.4%) | 7 (13.7%) |
| Bottled, Tank, or LP Gas | 13 (8.1%) | 34 (66.7%) |
| Electricity | 16 (9.9%) | 10 (19.6%) |
| Fuel Oil or Kerosene | 114 (70.8%) | 0 (0.0%) |
| Coal or Coke | 0 (0.0%) | 0 (0.0%) |
| All other Fuels | 6 (3.7%) | 0 (0.0%) |
| No Fuel Used | 0 (0.0%) | 0 (0.0%) |
| Total | 161 (100.0%) | 51 (100.0%) |
Household Vehicle Usage in Morris
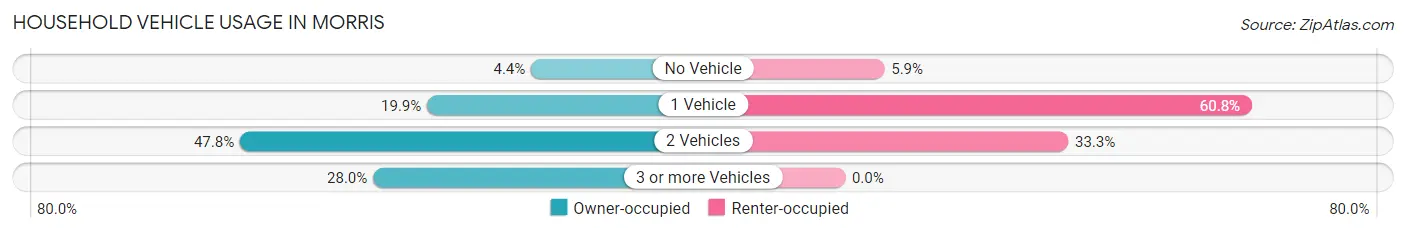
| Vehicles per Household | Owner-occupied | Renter-occupied |
| No Vehicle | 7 (4.3%) | 3 (5.9%) |
| 1 Vehicle | 32 (19.9%) | 31 (60.8%) |
| 2 Vehicles | 77 (47.8%) | 17 (33.3%) |
| 3 or more Vehicles | 45 (28.0%) | 0 (0.0%) |
| Total | 161 (100.0%) | 51 (100.0%) |
Real Estate & Mortgages in Morris
Real Estate and Mortgage Overview in Morris
| Characteristic | Without Mortgage | With Mortgage |
| Housing Units | 72 | 89 |
| Median Property Value | $120,200 | $0 |
| Median Household Income | - | - |
| Monthly Housing Costs | $425 | $41 |
| Real Estate Taxes | $2,333 | $0 |
Property Value by Mortgage Status in Morris
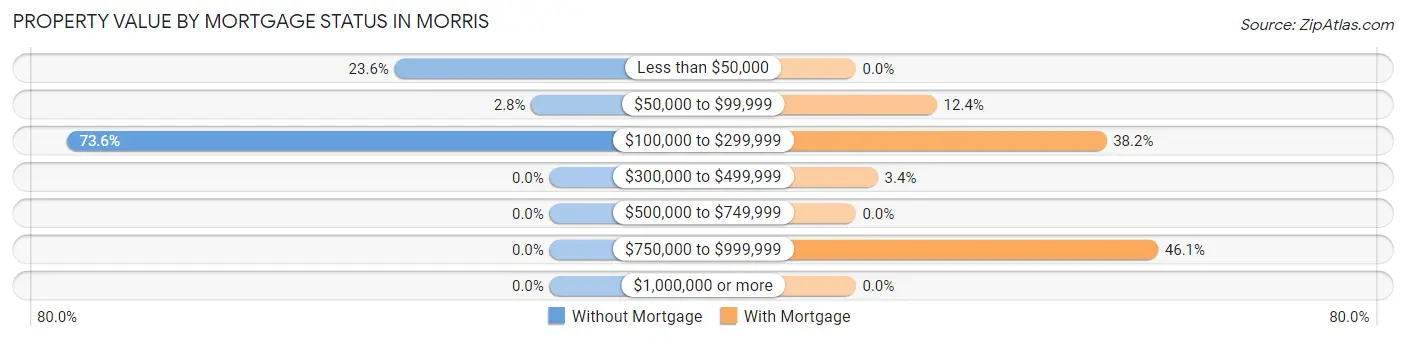
| Property Value | Without Mortgage | With Mortgage |
| Less than $50,000 | 17 (23.6%) | 0 (0.0%) |
| $50,000 to $99,999 | 2 (2.8%) | 11 (12.4%) |
| $100,000 to $299,999 | 53 (73.6%) | 34 (38.2%) |
| $300,000 to $499,999 | 0 (0.0%) | 3 (3.4%) |
| $500,000 to $749,999 | 0 (0.0%) | 0 (0.0%) |
| $750,000 to $999,999 | 0 (0.0%) | 41 (46.1%) |
| $1,000,000 or more | 0 (0.0%) | 0 (0.0%) |
| Total | 72 (100.0%) | 89 (100.0%) |
Household Income by Mortgage Status in Morris
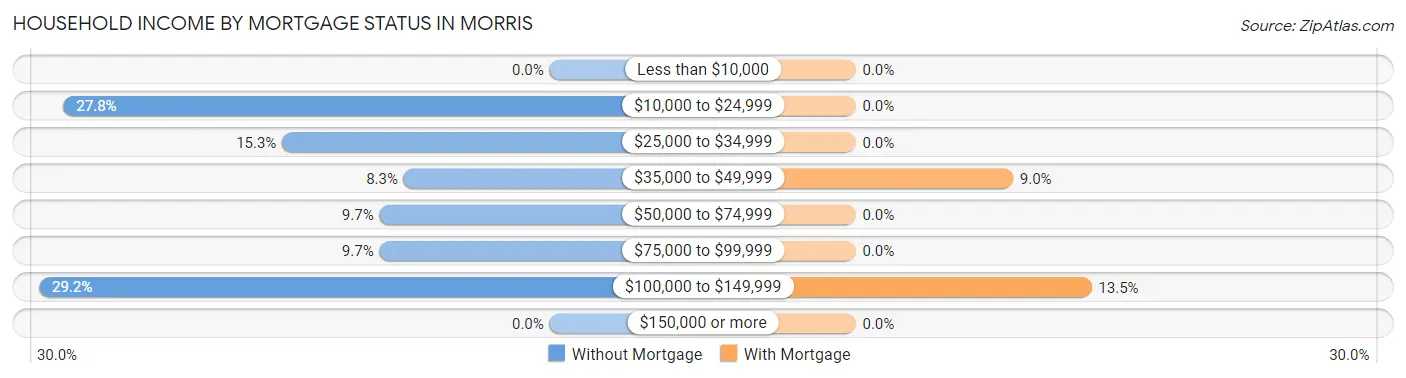
| Household Income | Without Mortgage | With Mortgage |
| Less than $10,000 | 0 (0.0%) | 0 (0.0%) |
| $10,000 to $24,999 | 20 (27.8%) | 0 (0.0%) |
| $25,000 to $34,999 | 11 (15.3%) | 0 (0.0%) |
| $35,000 to $49,999 | 6 (8.3%) | 8 (9.0%) |
| $50,000 to $74,999 | 7 (9.7%) | 0 (0.0%) |
| $75,000 to $99,999 | 7 (9.7%) | 0 (0.0%) |
| $100,000 to $149,999 | 21 (29.2%) | 12 (13.5%) |
| $150,000 or more | 0 (0.0%) | 0 (0.0%) |
| Total | 72 (100.0%) | 89 (100.0%) |
Property Value to Household Income Ratio in Morris
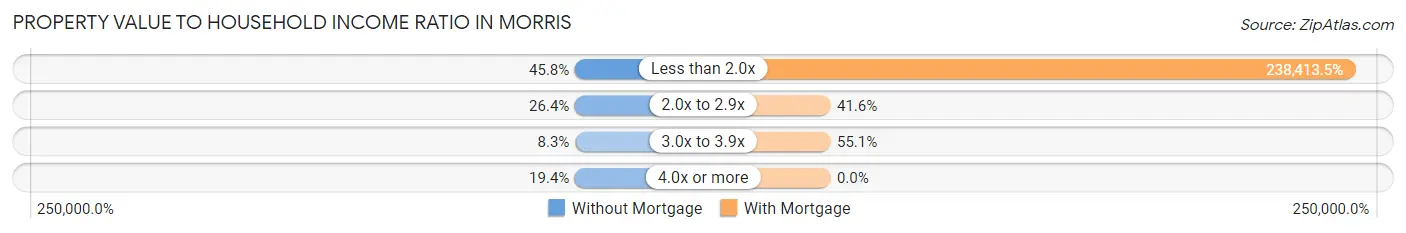
| Value-to-Income Ratio | Without Mortgage | With Mortgage |
| Less than 2.0x | 33 (45.8%) | 212,188 (238,413.5%) |
| 2.0x to 2.9x | 19 (26.4%) | 37 (41.6%) |
| 3.0x to 3.9x | 6 (8.3%) | 49 (55.1%) |
| 4.0x or more | 14 (19.4%) | 0 (0.0%) |
| Total | 72 (100.0%) | 89 (100.0%) |
Real Estate Taxes by Mortgage Status in Morris
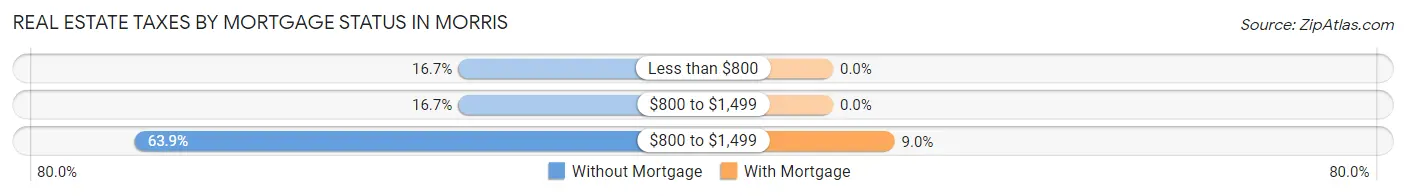
| Property Taxes | Without Mortgage | With Mortgage |
| Less than $800 | 12 (16.7%) | 0 (0.0%) |
| $800 to $1,499 | 12 (16.7%) | 0 (0.0%) |
| $800 to $1,499 | 46 (63.9%) | 8 (9.0%) |
| Total | 72 (100.0%) | 89 (100.0%) |
Health & Disability in Morris
Health Insurance Coverage by Age in Morris
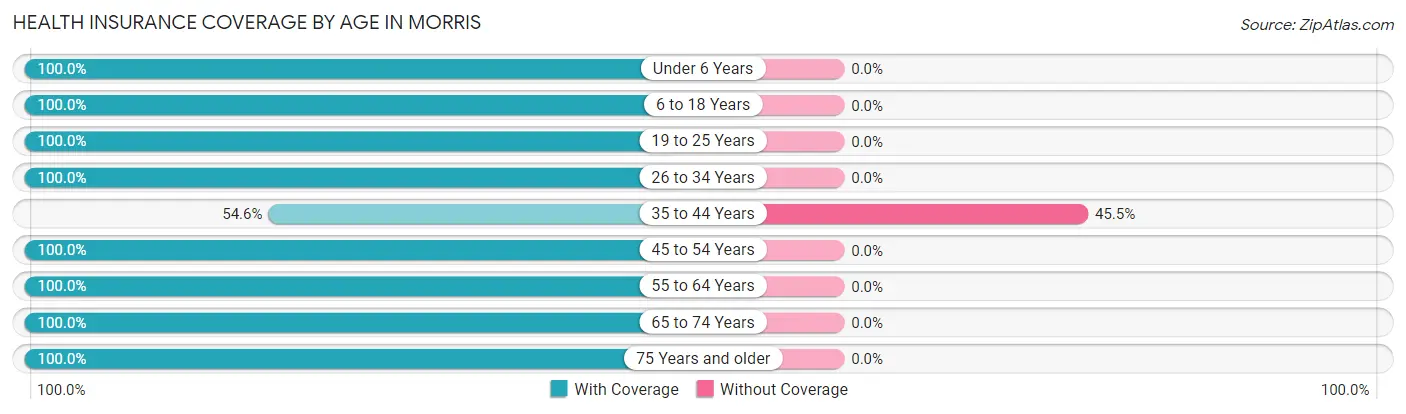
| Age Bracket | With Coverage | Without Coverage |
| Under 6 Years | 25 (100.0%) | 0 (0.0%) |
| 6 to 18 Years | 116 (100.0%) | 0 (0.0%) |
| 19 to 25 Years | 39 (100.0%) | 0 (0.0%) |
| 26 to 34 Years | 34 (100.0%) | 0 (0.0%) |
| 35 to 44 Years | 6 (54.5%) | 5 (45.5%) |
| 45 to 54 Years | 127 (100.0%) | 0 (0.0%) |
| 55 to 64 Years | 30 (100.0%) | 0 (0.0%) |
| 65 to 74 Years | 95 (100.0%) | 0 (0.0%) |
| 75 Years and older | 15 (100.0%) | 0 (0.0%) |
| Total | 487 (99.0%) | 5 (1.0%) |
Health Insurance Coverage by Citizenship Status in Morris
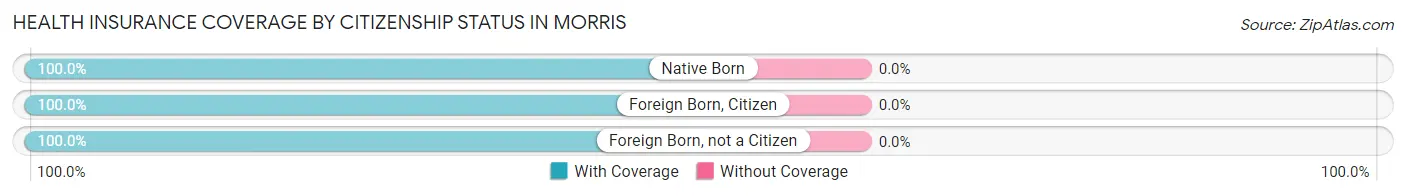
| Citizenship Status | With Coverage | Without Coverage |
| Native Born | 25 (100.0%) | 0 (0.0%) |
| Foreign Born, Citizen | 116 (100.0%) | 0 (0.0%) |
| Foreign Born, not a Citizen | 39 (100.0%) | 0 (0.0%) |
Health Insurance Coverage by Household Income in Morris

| Household Income | With Coverage | Without Coverage |
| Under $25,000 | 53 (100.0%) | 0 (0.0%) |
| $25,000 to $49,999 | 81 (94.2%) | 5 (5.8%) |
| $50,000 to $74,999 | 14 (100.0%) | 0 (0.0%) |
| $75,000 to $99,999 | 64 (100.0%) | 0 (0.0%) |
| $100,000 and over | 269 (100.0%) | 0 (0.0%) |
Public vs Private Health Insurance Coverage by Age in Morris
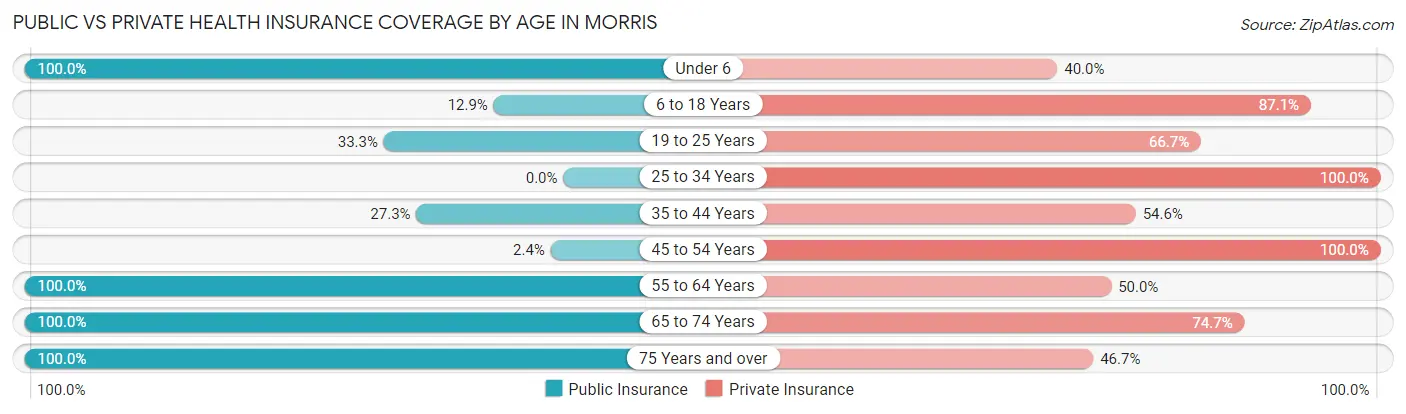
| Age Bracket | Public Insurance | Private Insurance |
| Under 6 | 25 (100.0%) | 10 (40.0%) |
| 6 to 18 Years | 15 (12.9%) | 101 (87.1%) |
| 19 to 25 Years | 13 (33.3%) | 26 (66.7%) |
| 25 to 34 Years | 0 (0.0%) | 34 (100.0%) |
| 35 to 44 Years | 3 (27.3%) | 6 (54.5%) |
| 45 to 54 Years | 3 (2.4%) | 127 (100.0%) |
| 55 to 64 Years | 30 (100.0%) | 15 (50.0%) |
| 65 to 74 Years | 95 (100.0%) | 71 (74.7%) |
| 75 Years and over | 15 (100.0%) | 7 (46.7%) |
| Total | 199 (40.5%) | 397 (80.7%) |
Disability Status by Sex by Age in Morris
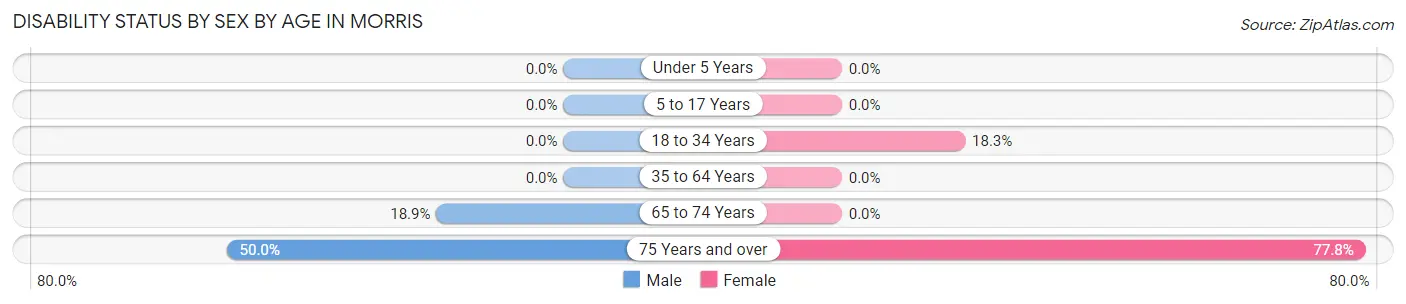
| Age Bracket | Male | Female |
| Under 5 Years | 0 (0.0%) | 0 (0.0%) |
| 5 to 17 Years | 0 (0.0%) | 0 (0.0%) |
| 18 to 34 Years | 0 (0.0%) | 13 (18.3%) |
| 35 to 64 Years | 0 (0.0%) | 0 (0.0%) |
| 65 to 74 Years | 10 (18.9%) | 0 (0.0%) |
| 75 Years and over | 3 (50.0%) | 7 (77.8%) |
Disability Class by Sex by Age in Morris
Disability Class: Hearing Difficulty
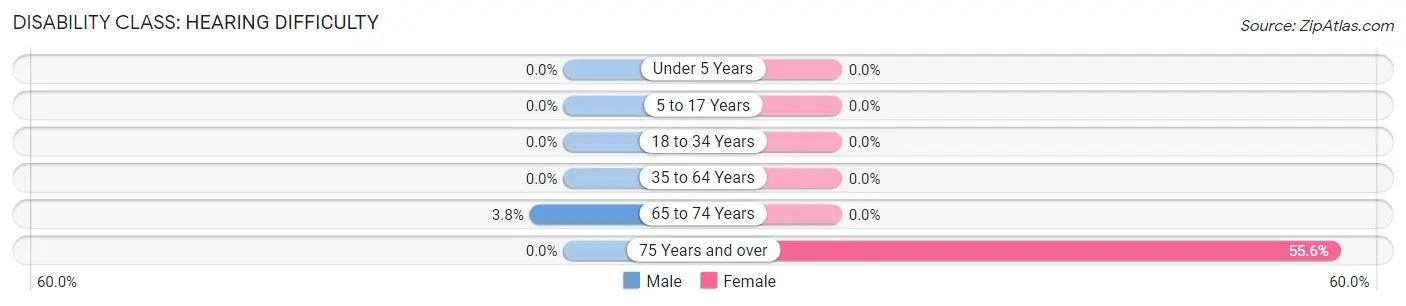
| Age Bracket | Male | Female |
| Under 5 Years | 0 (0.0%) | 0 (0.0%) |
| 5 to 17 Years | 0 (0.0%) | 0 (0.0%) |
| 18 to 34 Years | 0 (0.0%) | 0 (0.0%) |
| 35 to 64 Years | 0 (0.0%) | 0 (0.0%) |
| 65 to 74 Years | 2 (3.8%) | 0 (0.0%) |
| 75 Years and over | 0 (0.0%) | 5 (55.6%) |
Disability Class: Vision Difficulty
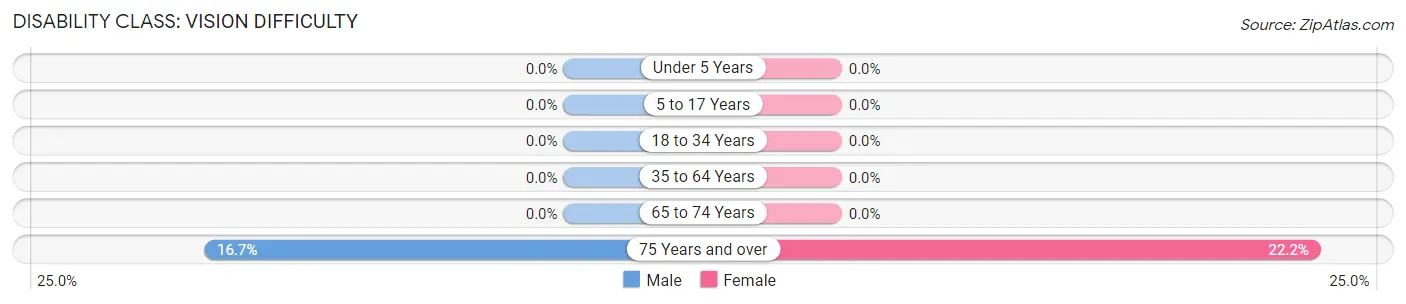
| Age Bracket | Male | Female |
| Under 5 Years | 0 (0.0%) | 0 (0.0%) |
| 5 to 17 Years | 0 (0.0%) | 0 (0.0%) |
| 18 to 34 Years | 0 (0.0%) | 0 (0.0%) |
| 35 to 64 Years | 0 (0.0%) | 0 (0.0%) |
| 65 to 74 Years | 0 (0.0%) | 0 (0.0%) |
| 75 Years and over | 1 (16.7%) | 2 (22.2%) |
Disability Class: Cognitive Difficulty
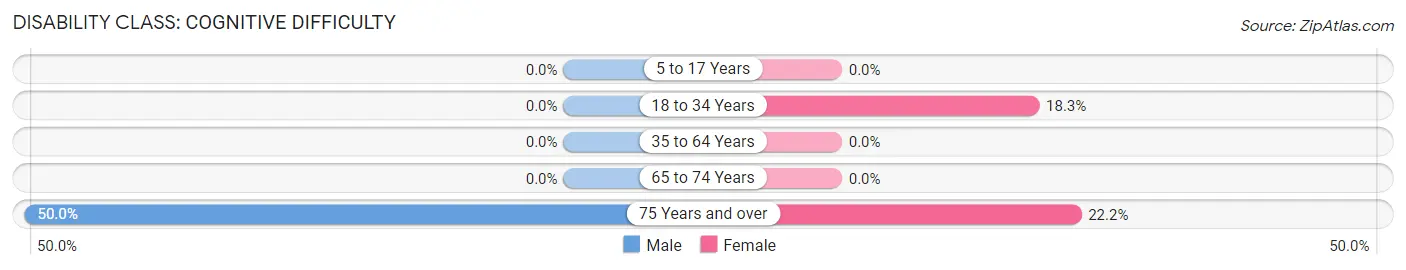
| Age Bracket | Male | Female |
| 5 to 17 Years | 0 (0.0%) | 0 (0.0%) |
| 18 to 34 Years | 0 (0.0%) | 13 (18.3%) |
| 35 to 64 Years | 0 (0.0%) | 0 (0.0%) |
| 65 to 74 Years | 0 (0.0%) | 0 (0.0%) |
| 75 Years and over | 3 (50.0%) | 2 (22.2%) |
Disability Class: Ambulatory Difficulty
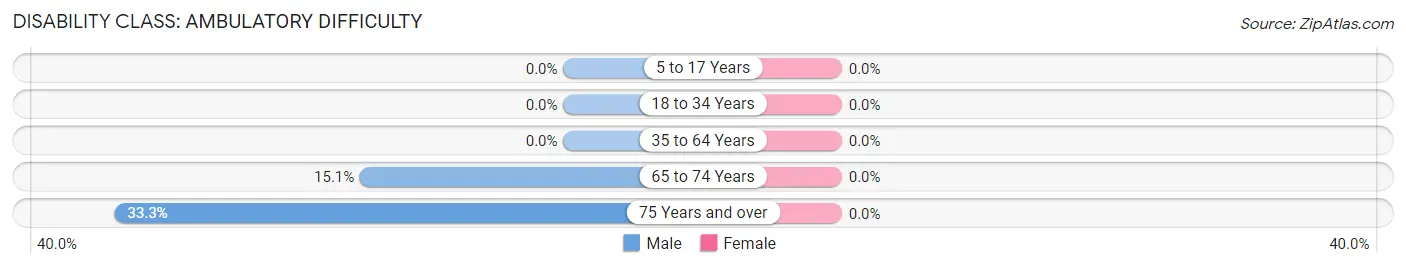
| Age Bracket | Male | Female |
| 5 to 17 Years | 0 (0.0%) | 0 (0.0%) |
| 18 to 34 Years | 0 (0.0%) | 0 (0.0%) |
| 35 to 64 Years | 0 (0.0%) | 0 (0.0%) |
| 65 to 74 Years | 8 (15.1%) | 0 (0.0%) |
| 75 Years and over | 2 (33.3%) | 0 (0.0%) |
Disability Class: Self-Care Difficulty
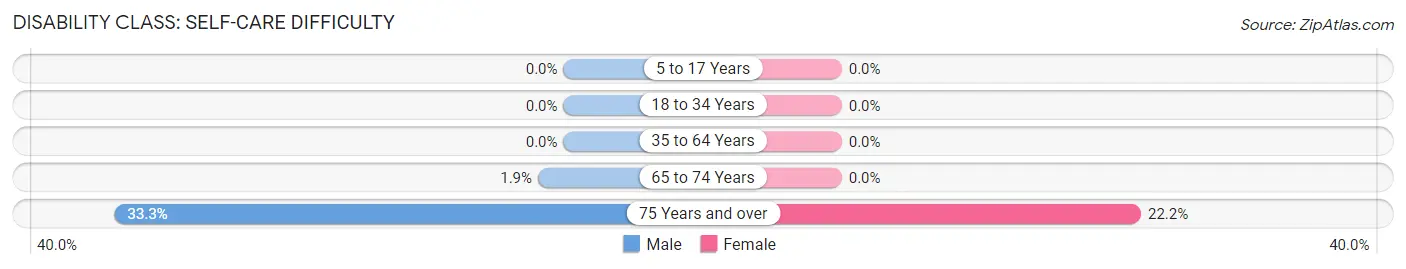
| Age Bracket | Male | Female |
| 5 to 17 Years | 0 (0.0%) | 0 (0.0%) |
| 18 to 34 Years | 0 (0.0%) | 0 (0.0%) |
| 35 to 64 Years | 0 (0.0%) | 0 (0.0%) |
| 65 to 74 Years | 1 (1.9%) | 0 (0.0%) |
| 75 Years and over | 2 (33.3%) | 2 (22.2%) |
Technology Access in Morris
Computing Device Access in Morris
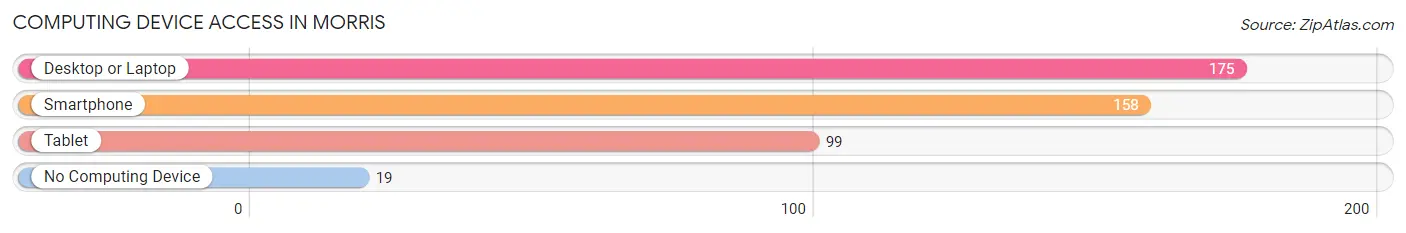
| Device Type | # Households | % Households |
| Desktop or Laptop | 175 | 82.6% |
| Smartphone | 158 | 74.5% |
| Tablet | 99 | 46.7% |
| No Computing Device | 19 | 9.0% |
| Total | 212 | 100.0% |
Internet Access in Morris
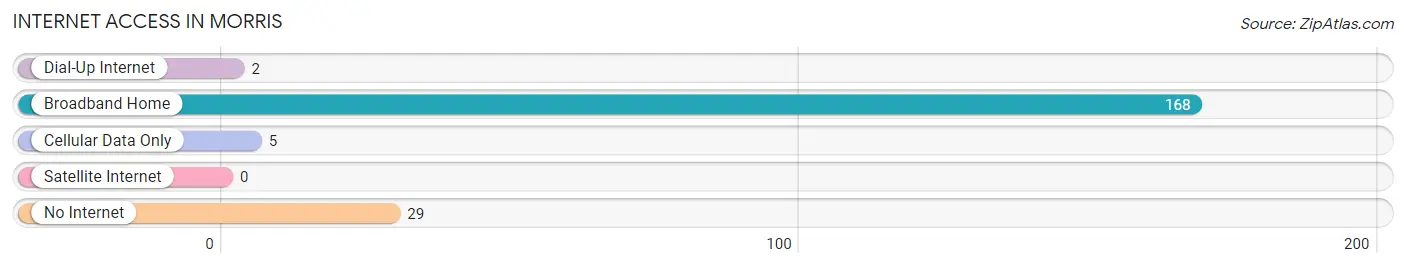
| Internet Type | # Households | % Households |
| Dial-Up Internet | 2 | 0.9% |
| Broadband Home | 168 | 79.2% |
| Cellular Data Only | 5 | 2.4% |
| Satellite Internet | 0 | 0.0% |
| No Internet | 29 | 13.7% |
| Total | 212 | 100.0% |
Morris Summary
Morris, New York is a small town located in the southern part of Otsego County, in the state of New York. It is situated in the foothills of the Catskill Mountains, and is bordered by the towns of Butternuts, Pittsfield, and Westford. The town has a population of approximately 1,400 people, and is home to a variety of businesses, including a small grocery store, a gas station, a post office, and a few restaurants.
Geography
Morris is located in the foothills of the Catskill Mountains, and is bordered by the towns of Butternuts, Pittsfield, and Westford. The town is situated on the banks of the Susquehanna River, and is surrounded by rolling hills and forests. The town is home to several small lakes, including Lake Morris, which is the largest lake in the area. The town is also home to several small streams, including the Morris Creek, which flows through the town.
Economy
The economy of Morris is largely based on agriculture and tourism. The town is home to several small farms, which produce a variety of crops, including corn, soybeans, hay, and vegetables. The town is also home to several small businesses, including a grocery store, a gas station, a post office, and a few restaurants. The town is also home to several small manufacturing companies, which produce a variety of products, including furniture, clothing, and electronics.
Demographics
As of the 2010 census, the population of Morris was 1,400 people. The racial makeup of the town was 97.3% White, 0.7% African American, 0.3% Native American, 0.3% Asian, 0.1% Pacific Islander, 0.3% from other races, and 1.3% from two or more races. The median household income in Morris was $45,000, and the median family income was $50,000. The per capita income in Morris was $20,000.
History
Morris was first settled in 1790 by a group of settlers from Connecticut. The town was named after General Jacob Morris, who was a prominent figure in the American Revolution. The town was incorporated in 1808, and has remained largely unchanged since then. The town was home to several small industries, including a sawmill, a gristmill, and a tannery. The town was also home to several small farms, which produced a variety of crops, including corn, soybeans, hay, and vegetables.
In the late 19th century, the town was home to several small businesses, including a grocery store, a gas station, a post office, and a few restaurants. The town was also home to several small manufacturing companies, which produced a variety of products, including furniture, clothing, and electronics. The town was also home to several small lakes, which were popular for fishing and swimming.
Today, Morris is a small, rural town that is home to a variety of businesses, including a grocery store, a gas station, a post office, and a few restaurants. The town is also home to several small farms, which produce a variety of crops, including corn, soybeans, hay, and vegetables. The town is also home to several small manufacturing companies, which produce a variety of products, including furniture, clothing, and electronics. The town is also home to several small lakes, which are popular for fishing and swimming.
Common Questions
What is Per Capita Income in Morris?
Per Capita income in Morris is $51,908.
What is the Median Family Income in Morris?
Median Family Income in Morris is $210,848.
What is the Median Household income in Morris?
Median Household Income in Morris is $77,222.
What is Inequality or Gini Index in Morris?
Inequality or Gini Index in Morris is 0.51.
What is the Total Population of Morris?
Total Population of Morris is 492.
What is the Total Male Population of Morris?
Total Male Population of Morris is 237.
What is the Total Female Population of Morris?
Total Female Population of Morris is 255.
What is the Ratio of Males per 100 Females in Morris?
There are 92.94 Males per 100 Females in Morris.
What is the Ratio of Females per 100 Males in Morris?
There are 107.59 Females per 100 Males in Morris.
What is the Median Population Age in Morris?
Median Population Age in Morris is 48.5 Years.
What is the Average Family Size in Morris
Average Family Size in Morris is 3.1 People.
What is the Average Household Size in Morris
Average Household Size in Morris is 2.3 People.
How Large is the Labor Force in Morris?
There are 222 People in the Labor Forcein in Morris.
What is the Percentage of People in the Labor Force in Morris?
54.8% of People are in the Labor Force in Morris.
What is the Unemployment Rate in Morris?
Unemployment Rate in Morris is 1.8%.