Westhampton, NY Map & Demographics
Westhampton Map
Westhampton Overview
$64,561
PER CAPITA INCOME
$156,964
AVG FAMILY INCOME
$131,354
AVG HOUSEHOLD INCOME
17.1%
WAGE / INCOME GAP [ % ]
82.9¢/ $1
WAGE / INCOME GAP [ $ ]
0.47
INEQUALITY / GINI INDEX
3,769
TOTAL POPULATION
1,775
MALE POPULATION
1,994
FEMALE POPULATION
89.02
MALES / 100 FEMALES
112.34
FEMALES / 100 MALES
48.7
MEDIAN AGE
3.2
AVG FAMILY SIZE
2.8
AVG HOUSEHOLD SIZE
1,575
LABOR FORCE [ PEOPLE ]
52.8%
PERCENT IN LABOR FORCE
4.3%
UNEMPLOYMENT RATE
Westhampton Zip Codes
Westhampton Area Codes
Income in Westhampton
Income Overview in Westhampton
Per Capita Income in Westhampton is $64,561, while median incomes of families and households are $156,964 and $131,354 respectively.
| Characteristic | Number | Measure |
| Per Capita Income | 3,769 | $64,561 |
| Median Family Income | 1,009 | $156,964 |
| Mean Family Income | 1,009 | $204,407 |
| Median Household Income | 1,278 | $131,354 |
| Mean Household Income | 1,278 | $184,559 |
| Income Deficit | 1,009 | $0 |
| Wage / Income Gap (%) | 3,769 | 17.14% |
| Wage / Income Gap ($) | 3,769 | 82.86¢ per $1 |
| Gini / Inequality Index | 3,769 | 0.47 |
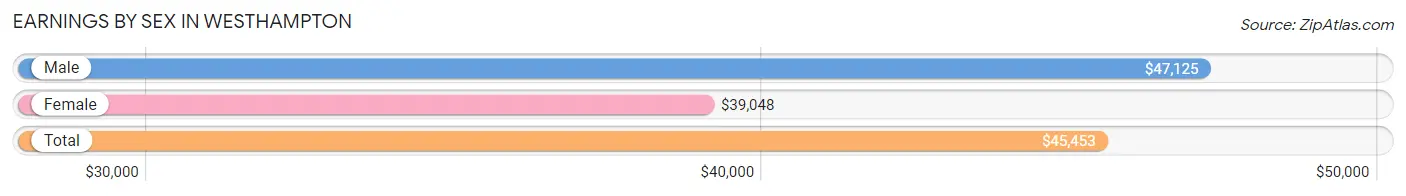
Earnings by Sex in Westhampton
Average Earnings in Westhampton are $45,453, $47,125 for men and $39,048 for women, a difference of 17.1%.
| Sex | Number | Average Earnings |
| Male | 1,031 (59.4%) | $47,125 |
| Female | 706 (40.6%) | $39,048 |
| Total | 1,737 (100.0%) | $45,453 |
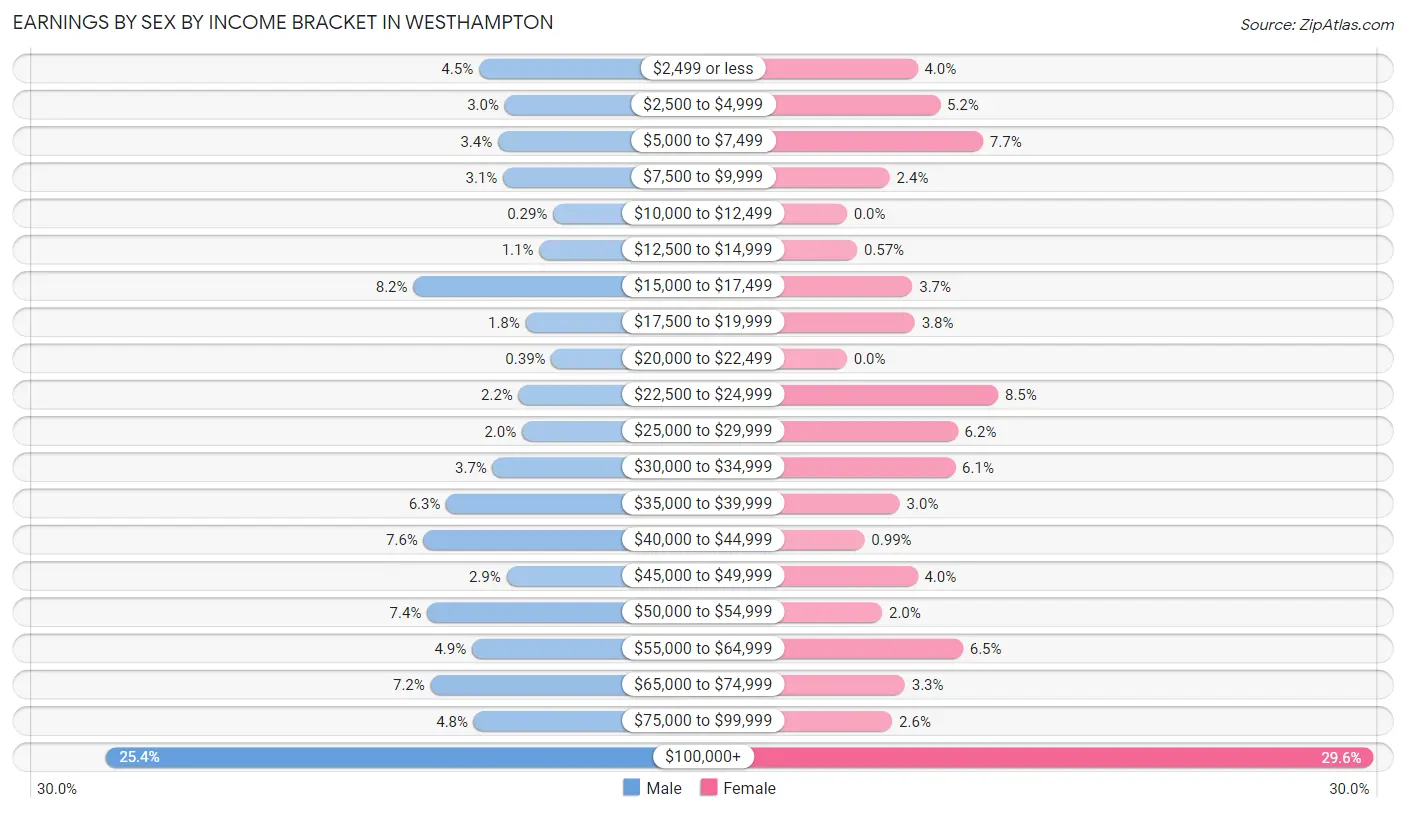
Earnings by Sex by Income Bracket in Westhampton
The most common earnings brackets in Westhampton are $100,000+ for men (262 | 25.4%) and $100,000+ for women (209 | 29.6%).
| Income | Male | Female |
| $2,499 or less | 46 (4.5%) | 28 (4.0%) |
| $2,500 to $4,999 | 31 (3.0%) | 37 (5.2%) |
| $5,000 to $7,499 | 35 (3.4%) | 54 (7.6%) |
| $7,500 to $9,999 | 32 (3.1%) | 17 (2.4%) |
| $10,000 to $12,499 | 3 (0.3%) | 0 (0.0%) |
| $12,500 to $14,999 | 11 (1.1%) | 4 (0.6%) |
| $15,000 to $17,499 | 84 (8.2%) | 26 (3.7%) |
| $17,500 to $19,999 | 19 (1.8%) | 27 (3.8%) |
| $20,000 to $22,499 | 4 (0.4%) | 0 (0.0%) |
| $22,500 to $24,999 | 23 (2.2%) | 60 (8.5%) |
| $25,000 to $29,999 | 21 (2.0%) | 44 (6.2%) |
| $30,000 to $34,999 | 38 (3.7%) | 43 (6.1%) |
| $35,000 to $39,999 | 65 (6.3%) | 21 (3.0%) |
| $40,000 to $44,999 | 78 (7.6%) | 7 (1.0%) |
| $45,000 to $49,999 | 30 (2.9%) | 28 (4.0%) |
| $50,000 to $54,999 | 76 (7.4%) | 14 (2.0%) |
| $55,000 to $64,999 | 50 (4.9%) | 46 (6.5%) |
| $65,000 to $74,999 | 74 (7.2%) | 23 (3.3%) |
| $75,000 to $99,999 | 49 (4.8%) | 18 (2.5%) |
| $100,000+ | 262 (25.4%) | 209 (29.6%) |
| Total | 1,031 (100.0%) | 706 (100.0%) |
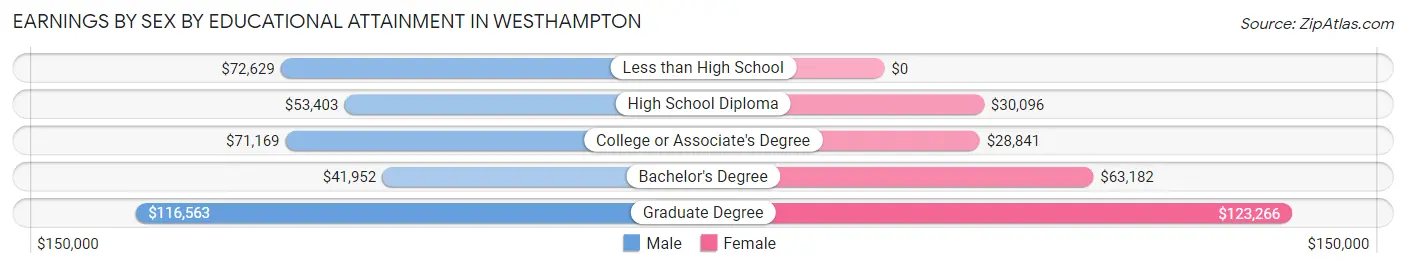
Earnings by Sex by Educational Attainment in Westhampton
Average earnings in Westhampton are $54,704 for men and $56,786 for women, a difference of 3.7%. Men with an educational attainment of graduate degree enjoy the highest average annual earnings of $116,563, while those with bachelor's degree education earn the least with $41,952. Women with an educational attainment of graduate degree earn the most with the average annual earnings of $123,266, while those with college or associate's degree education have the smallest earnings of $28,841.
| Educational Attainment | Male Income | Female Income |
| Less than High School | $72,629 | $0 |
| High School Diploma | $53,403 | $30,096 |
| College or Associate's Degree | $71,169 | $28,841 |
| Bachelor's Degree | $41,952 | $63,182 |
| Graduate Degree | $116,563 | $123,266 |
| Total | $54,704 | $56,786 |
Family Income in Westhampton
Family Income Brackets in Westhampton
According to the Westhampton family income data, there are 289 families falling into the $200,000+ income range, which is the most common income bracket and makes up 28.6% of all families.
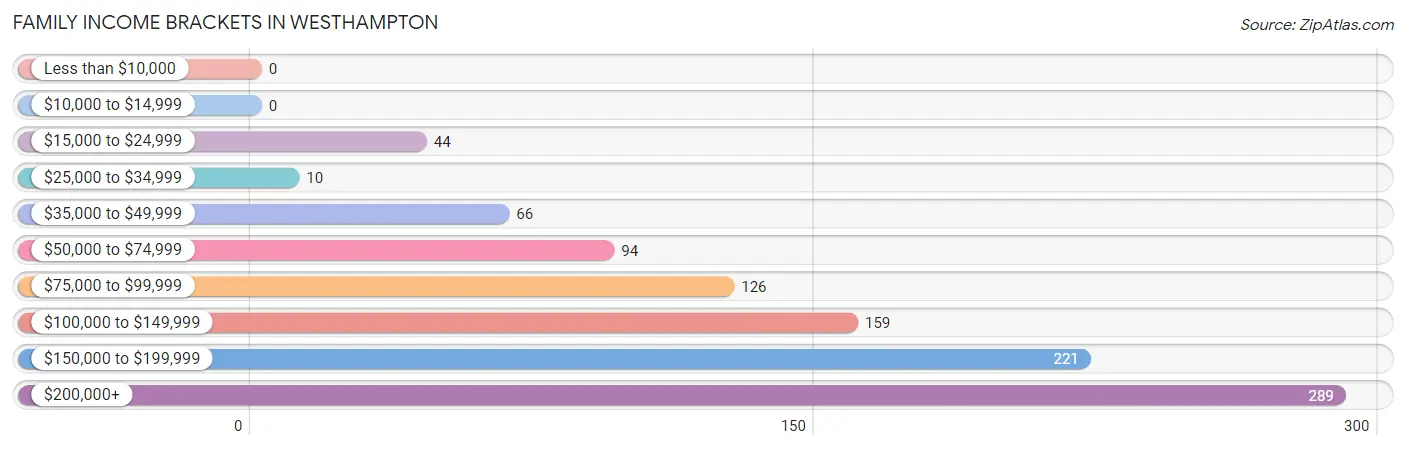
| Income Bracket | # Families | % Families |
| Less than $10,000 | 0 | 0.0% |
| $10,000 to $14,999 | 0 | 0.0% |
| $15,000 to $24,999 | 44 | 4.4% |
| $25,000 to $34,999 | 10 | 1.0% |
| $35,000 to $49,999 | 66 | 6.5% |
| $50,000 to $74,999 | 94 | 9.3% |
| $75,000 to $99,999 | 126 | 12.5% |
| $100,000 to $149,999 | 159 | 15.8% |
| $150,000 to $199,999 | 221 | 21.9% |
| $200,000+ | 289 | 28.6% |
Family Income by Famaliy Size in Westhampton
4-person families (102 | 10.1%) account for the highest median family income in Westhampton with $250,001 per family, while 2-person families (548 | 54.3%) have the highest median income of $77,678 per family member.
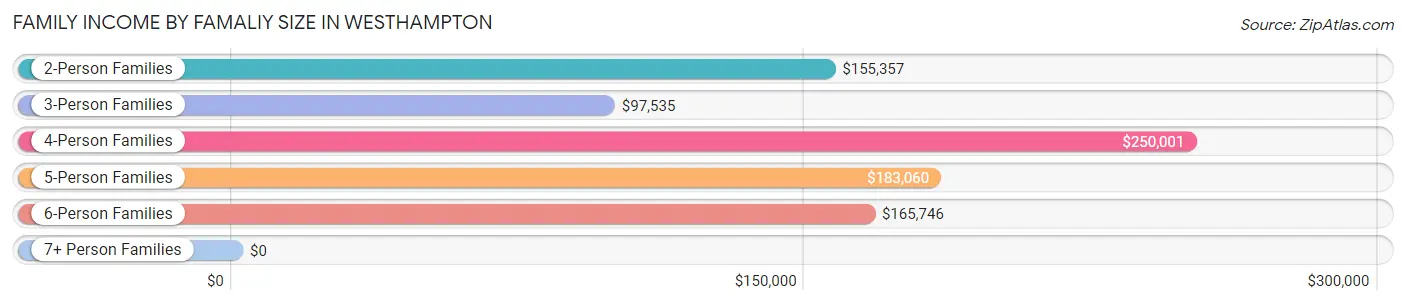
| Income Bracket | # Families | Median Income |
| 2-Person Families | 548 (54.3%) | $155,357 |
| 3-Person Families | 209 (20.7%) | $97,535 |
| 4-Person Families | 102 (10.1%) | $250,001 |
| 5-Person Families | 59 (5.9%) | $183,060 |
| 6-Person Families | 91 (9.0%) | $165,746 |
| 7+ Person Families | 0 (0.0%) | $0 |
| Total | 1,009 (100.0%) | $156,964 |
Family Income by Number of Earners in Westhampton
The median family income in Westhampton is $156,964, with families comprising 3+ earners (186) having the highest median family income of $183,793, while families with 1 earner (327) have the lowest median family income of $131,103, accounting for 18.4% and 32.4% of families, respectively.
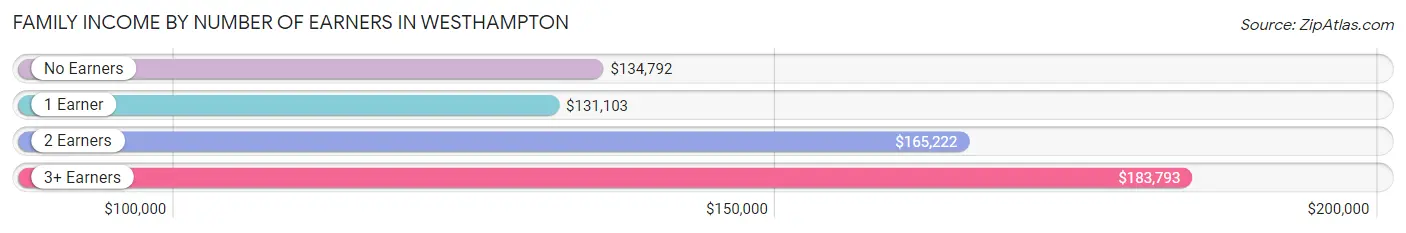
| Number of Earners | # Families | Median Income |
| No Earners | 233 (23.1%) | $134,792 |
| 1 Earner | 327 (32.4%) | $131,103 |
| 2 Earners | 263 (26.1%) | $165,222 |
| 3+ Earners | 186 (18.4%) | $183,793 |
| Total | 1,009 (100.0%) | $156,964 |
Household Income in Westhampton
Household Income Brackets in Westhampton
With 325 households falling in the category, the $200,000+ income range is the most frequent in Westhampton, accounting for 25.4% of all households.
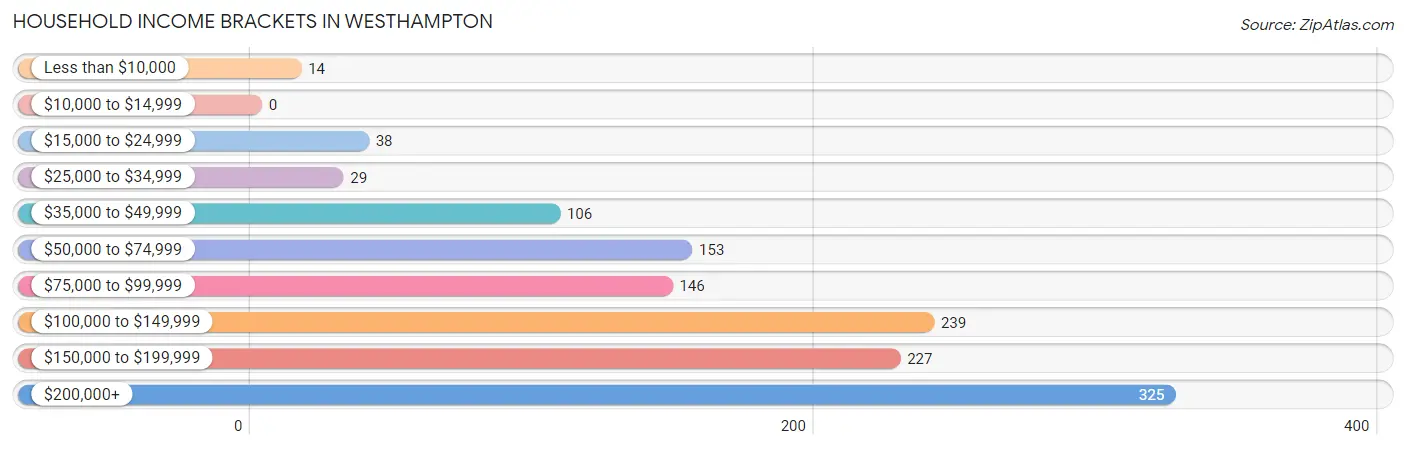
| Income Bracket | # Households | % Households |
| Less than $10,000 | 14 | 1.1% |
| $10,000 to $14,999 | 0 | 0.0% |
| $15,000 to $24,999 | 38 | 3.0% |
| $25,000 to $34,999 | 29 | 2.3% |
| $35,000 to $49,999 | 106 | 8.3% |
| $50,000 to $74,999 | 153 | 12.0% |
| $75,000 to $99,999 | 146 | 11.4% |
| $100,000 to $149,999 | 239 | 18.7% |
| $150,000 to $199,999 | 227 | 17.8% |
| $200,000+ | 325 | 25.4% |
Household Income by Householder Age in Westhampton
The median household income in Westhampton is $131,354, with the highest median household income of $165,363 found in the 25 to 44 years age bracket for the primary householder. A total of 208 households (16.3%) fall into this category. Meanwhile, the 15 to 24 years age bracket for the primary householder has the lowest median household income of $0, with 10 households (0.8%) in this group.
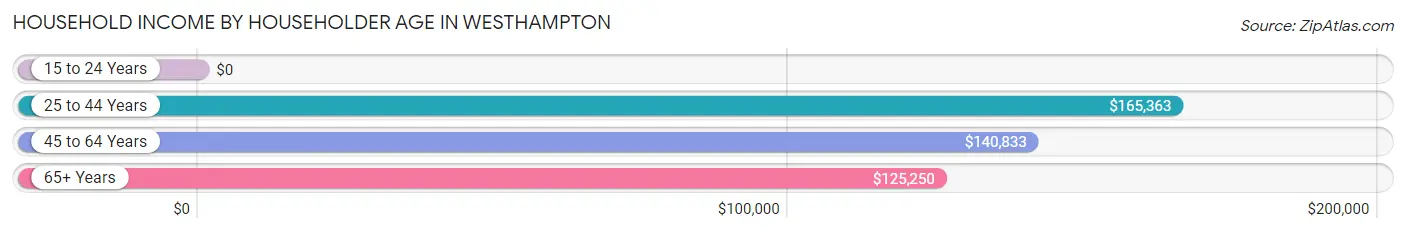
| Income Bracket | # Households | Median Income |
| 15 to 24 Years | 10 (0.8%) | $0 |
| 25 to 44 Years | 208 (16.3%) | $165,363 |
| 45 to 64 Years | 454 (35.5%) | $140,833 |
| 65+ Years | 606 (47.4%) | $125,250 |
| Total | 1,278 (100.0%) | $131,354 |
Poverty in Westhampton
Income Below Poverty by Sex and Age in Westhampton
With 7.3% poverty level for males and 3.5% for females among the residents of Westhampton, 6 to 11 year old males and 25 to 34 year old females are the most vulnerable to poverty, with 71 males (64.5%) and 29 females (34.5%) in their respective age groups living below the poverty level.
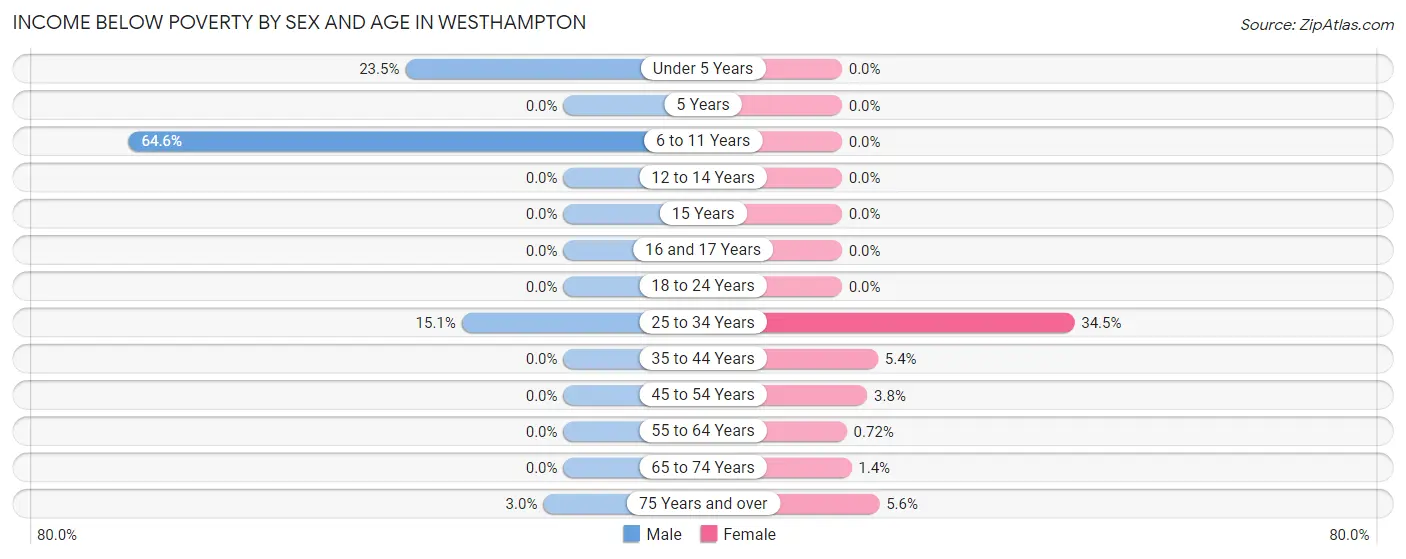
| Age Bracket | Male | Female |
| Under 5 Years | 31 (23.5%) | 0 (0.0%) |
| 5 Years | 0 (0.0%) | 0 (0.0%) |
| 6 to 11 Years | 71 (64.5%) | 0 (0.0%) |
| 12 to 14 Years | 0 (0.0%) | 0 (0.0%) |
| 15 Years | 0 (0.0%) | 0 (0.0%) |
| 16 and 17 Years | 0 (0.0%) | 0 (0.0%) |
| 18 to 24 Years | 0 (0.0%) | 0 (0.0%) |
| 25 to 34 Years | 21 (15.1%) | 29 (34.5%) |
| 35 to 44 Years | 0 (0.0%) | 10 (5.3%) |
| 45 to 54 Years | 0 (0.0%) | 6 (3.8%) |
| 55 to 64 Years | 0 (0.0%) | 2 (0.7%) |
| 65 to 74 Years | 0 (0.0%) | 5 (1.4%) |
| 75 Years and over | 6 (3.0%) | 14 (5.6%) |
| Total | 129 (7.3%) | 66 (3.5%) |
Income Above Poverty by Sex and Age in Westhampton
According to the poverty statistics in Westhampton, males aged 12 to 14 years and females aged under 5 years are the age groups that are most secure financially, with 100.0% of males and 100.0% of females in these age groups living above the poverty line.
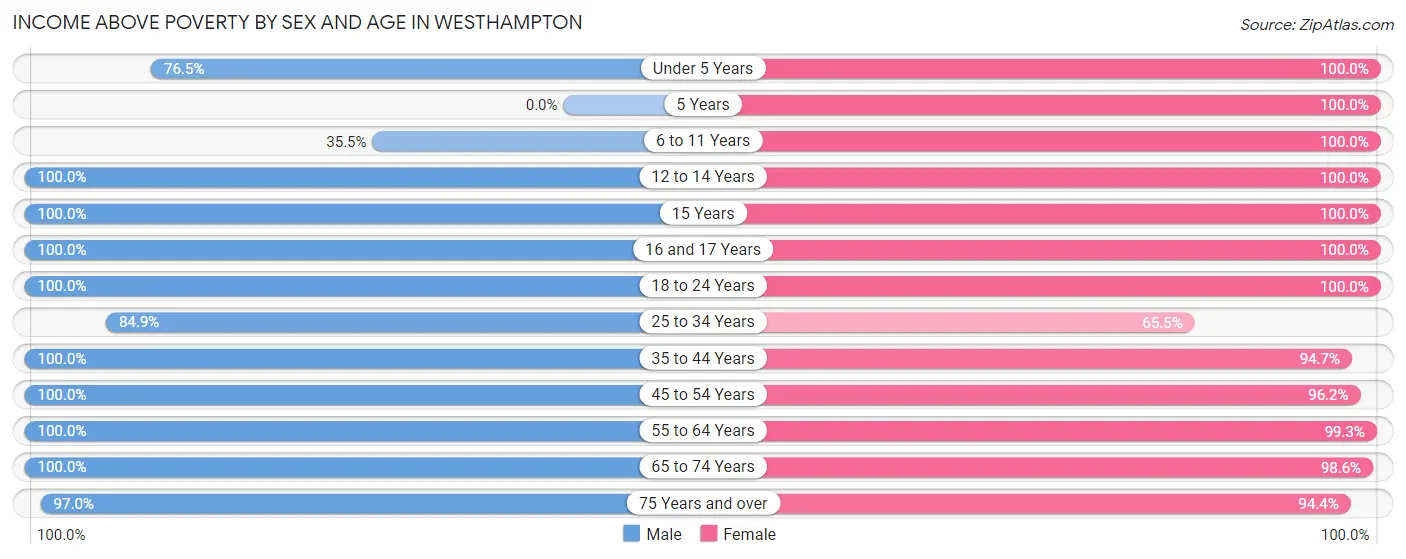
| Age Bracket | Male | Female |
| Under 5 Years | 101 (76.5%) | 100 (100.0%) |
| 5 Years | 0 (0.0%) | 36 (100.0%) |
| 6 to 11 Years | 39 (35.4%) | 244 (100.0%) |
| 12 to 14 Years | 106 (100.0%) | 16 (100.0%) |
| 15 Years | 13 (100.0%) | 29 (100.0%) |
| 16 and 17 Years | 80 (100.0%) | 79 (100.0%) |
| 18 to 24 Years | 113 (100.0%) | 88 (100.0%) |
| 25 to 34 Years | 118 (84.9%) | 55 (65.5%) |
| 35 to 44 Years | 154 (100.0%) | 177 (94.7%) |
| 45 to 54 Years | 193 (100.0%) | 153 (96.2%) |
| 55 to 64 Years | 253 (100.0%) | 275 (99.3%) |
| 65 to 74 Years | 260 (100.0%) | 348 (98.6%) |
| 75 Years and over | 195 (97.0%) | 238 (94.4%) |
| Total | 1,625 (92.6%) | 1,838 (96.5%) |
Income Below Poverty Among Married-Couple Families in Westhampton
The poverty statistics for married-couple families in Westhampton show that 0.8% or 7 of the total 892 families live below the poverty line. Families with no children have the highest poverty rate of 1.2%, comprising of 7 families. On the other hand, families with 1 or 2 children have the lowest poverty rate of 0.0%, which includes 0 families.
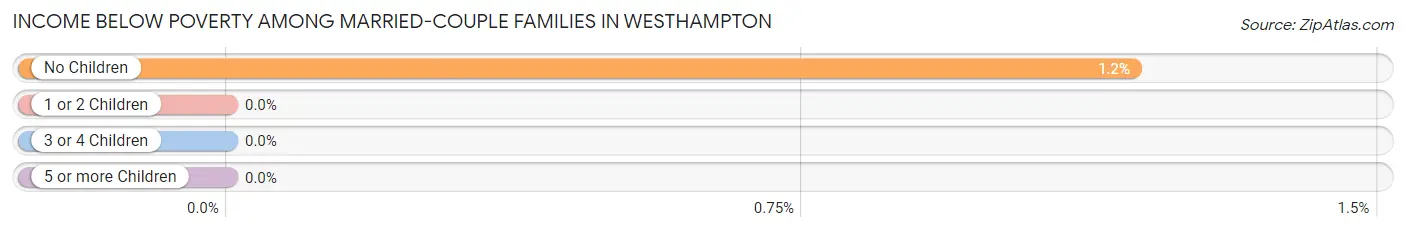
| Children | Above Poverty | Below Poverty |
| No Children | 586 (98.8%) | 7 (1.2%) |
| 1 or 2 Children | 171 (100.0%) | 0 (0.0%) |
| 3 or 4 Children | 128 (100.0%) | 0 (0.0%) |
| 5 or more Children | 0 (0.0%) | 0 (0.0%) |
| Total | 885 (99.2%) | 7 (0.8%) |
Income Below Poverty Among Single-Parent Households in Westhampton
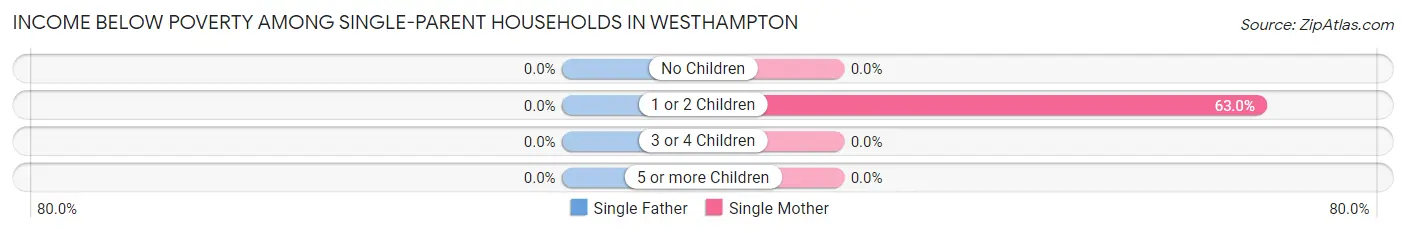
| Children | Single Father | Single Mother |
| No Children | 0 (0.0%) | 0 (0.0%) |
| 1 or 2 Children | 0 (0.0%) | 29 (63.0%) |
| 3 or 4 Children | 0 (0.0%) | 0 (0.0%) |
| 5 or more Children | 0 (0.0%) | 0 (0.0%) |
| Total | 0 (0.0%) | 29 (35.4%) |
Income Below Poverty Among Married-Couple vs Single-Parent Households in Westhampton
The poverty data for Westhampton shows that 7 of the married-couple family households (0.8%) and 29 of the single-parent households (24.8%) are living below the poverty level. Within the married-couple family households, those with no children have the highest poverty rate, with 7 households (1.2%) falling below the poverty line. Among the single-parent households, those with 1 or 2 children have the highest poverty rate, with 29 household (42.0%) living below poverty.
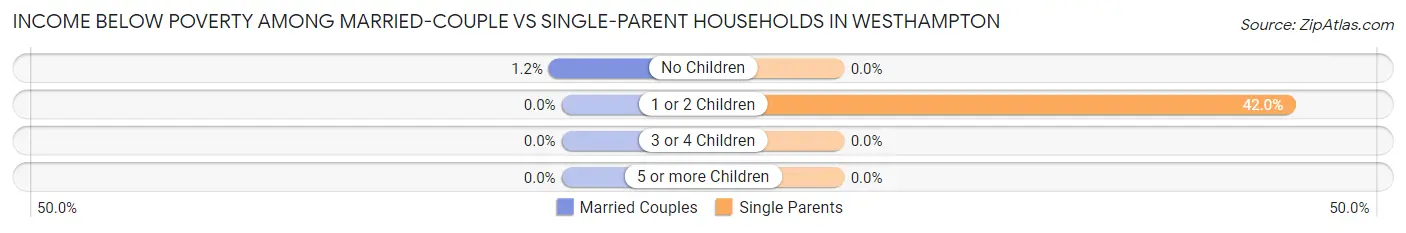
| Children | Married-Couple Families | Single-Parent Households |
| No Children | 7 (1.2%) | 0 (0.0%) |
| 1 or 2 Children | 0 (0.0%) | 29 (42.0%) |
| 3 or 4 Children | 0 (0.0%) | 0 (0.0%) |
| 5 or more Children | 0 (0.0%) | 0 (0.0%) |
| Total | 7 (0.8%) | 29 (24.8%) |
Race in Westhampton
The most populous races in Westhampton are White / Caucasian (3,142 | 83.4%), Hispanic or Latino (243 | 6.5%), and Two or more Races (198 | 5.2%).
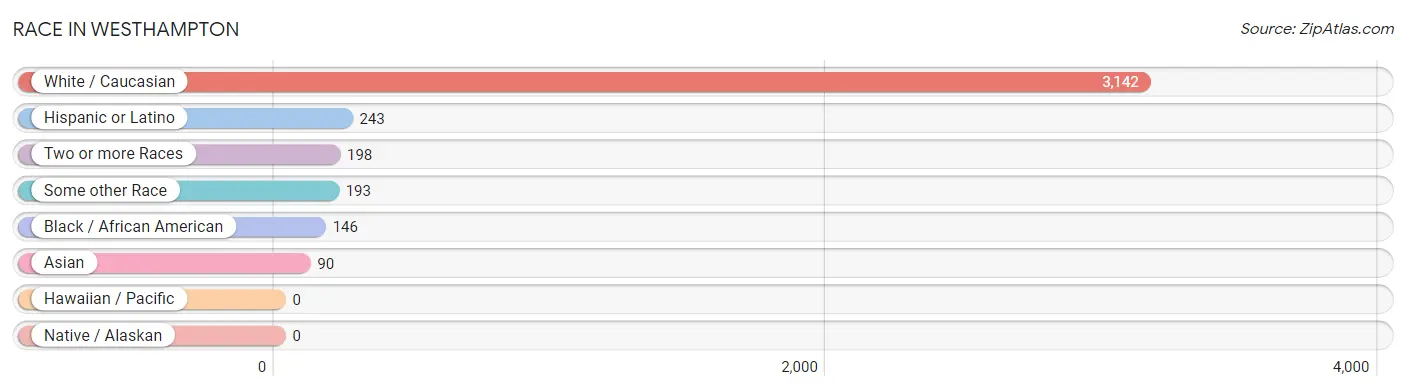
| Race | # Population | % Population |
| Asian | 90 | 2.4% |
| Black / African American | 146 | 3.9% |
| Hawaiian / Pacific | 0 | 0.0% |
| Hispanic or Latino | 243 | 6.5% |
| Native / Alaskan | 0 | 0.0% |
| White / Caucasian | 3,142 | 83.4% |
| Two or more Races | 198 | 5.2% |
| Some other Race | 193 | 5.1% |
| Total | 3,769 | 100.0% |
Ancestry in Westhampton
The most populous ancestries reported in Westhampton are Irish (719 | 19.1%), Italian (701 | 18.6%), English (304 | 8.1%), German (279 | 7.4%), and American (229 | 6.1%), together accounting for 59.2% of all Westhampton residents.
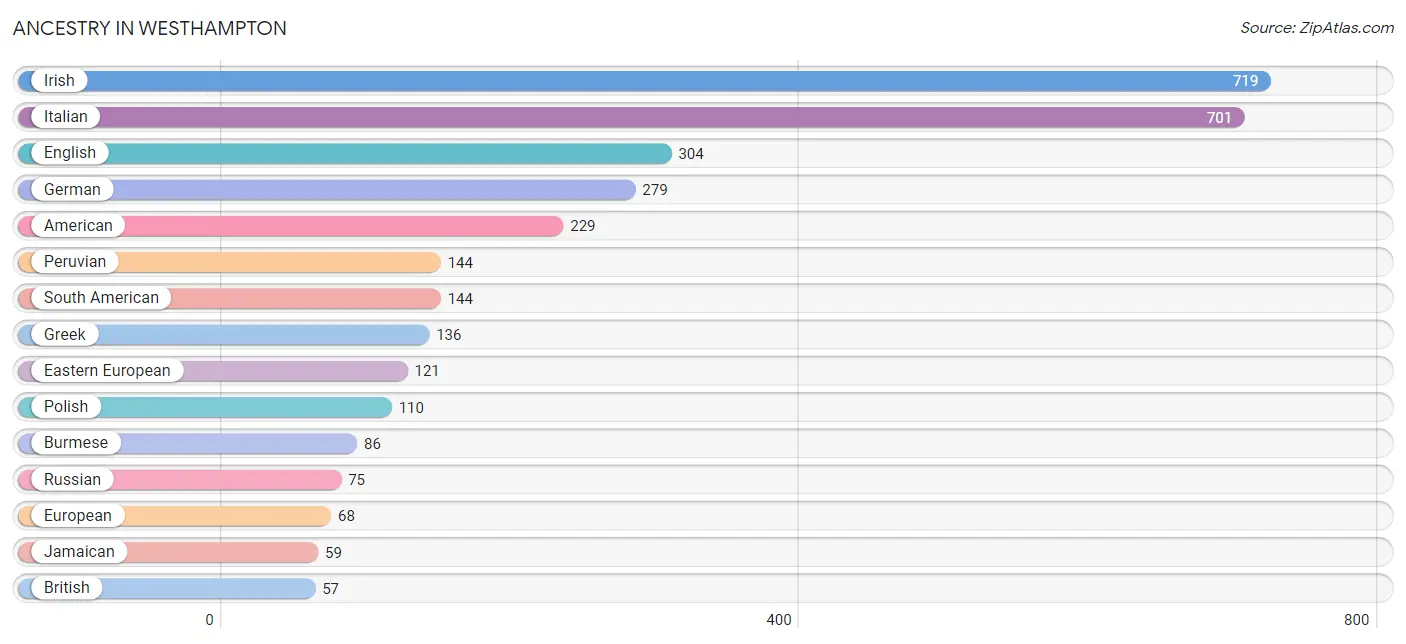
| Ancestry | # Population | % Population |
| American | 229 | 6.1% |
| Armenian | 6 | 0.2% |
| Austrian | 29 | 0.8% |
| Bhutanese | 4 | 0.1% |
| British | 57 | 1.5% |
| Burmese | 86 | 2.3% |
| Canadian | 19 | 0.5% |
| Cherokee | 7 | 0.2% |
| Czech | 24 | 0.6% |
| Dutch | 9 | 0.2% |
| Eastern European | 121 | 3.2% |
| English | 304 | 8.1% |
| European | 68 | 1.8% |
| French | 18 | 0.5% |
| French Canadian | 7 | 0.2% |
| German | 279 | 7.4% |
| Greek | 136 | 3.6% |
| Hungarian | 13 | 0.3% |
| Irish | 719 | 19.1% |
| Italian | 701 | 18.6% |
| Jamaican | 59 | 1.6% |
| Lithuanian | 11 | 0.3% |
| Norwegian | 23 | 0.6% |
| Peruvian | 144 | 3.8% |
| Polish | 110 | 2.9% |
| Portuguese | 4 | 0.1% |
| Puerto Rican | 10 | 0.3% |
| Romanian | 10 | 0.3% |
| Russian | 75 | 2.0% |
| Scandinavian | 8 | 0.2% |
| Scottish | 20 | 0.5% |
| Slovak | 3 | 0.1% |
| South American | 144 | 3.8% |
| Spaniard | 6 | 0.2% |
| Swedish | 26 | 0.7% |
| Turkish | 2 | 0.1% |
| Ukrainian | 18 | 0.5% |
| Welsh | 3 | 0.1% | View All 38 Rows |
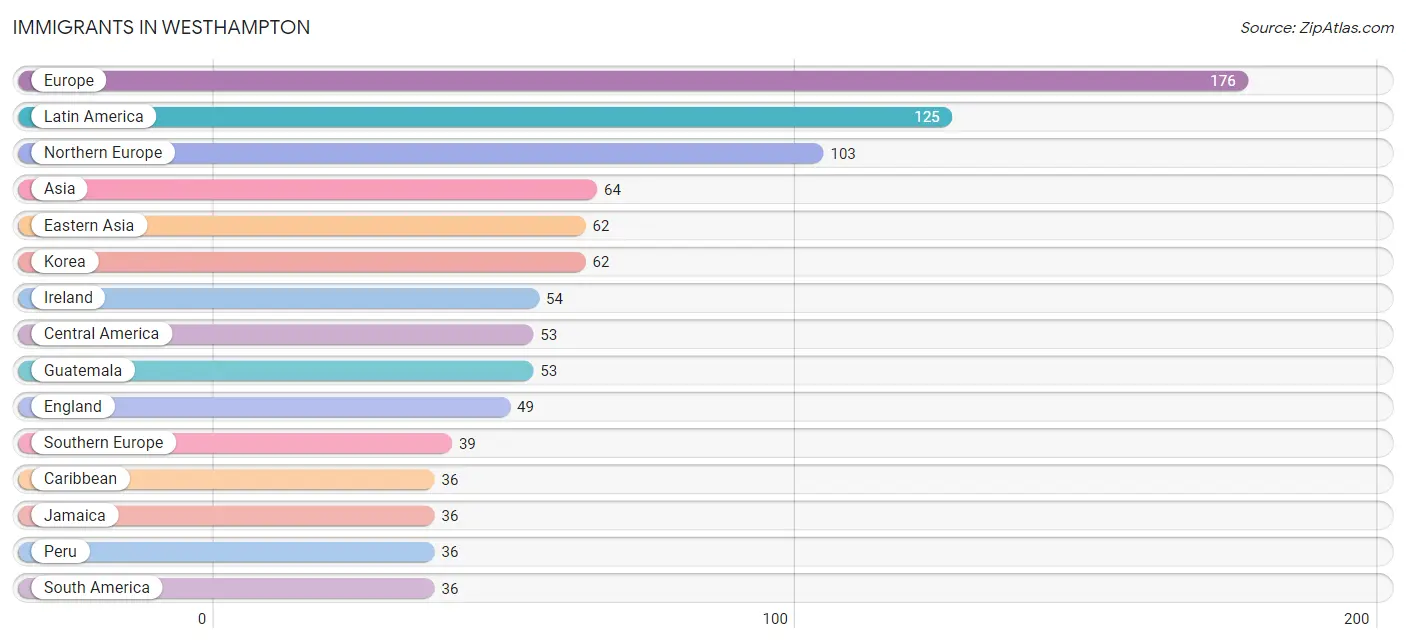
Immigrants in Westhampton
The most numerous immigrant groups reported in Westhampton came from Europe (176 | 4.7%), Latin America (125 | 3.3%), Northern Europe (103 | 2.7%), Asia (64 | 1.7%), and Eastern Asia (62 | 1.6%), together accounting for 14.1% of all Westhampton residents.
| Immigration Origin | # Population | % Population |
| Asia | 64 | 1.7% |
| Caribbean | 36 | 1.0% |
| Central America | 53 | 1.4% |
| Eastern Asia | 62 | 1.6% |
| Eastern Europe | 25 | 0.7% |
| England | 49 | 1.3% |
| Europe | 176 | 4.7% |
| Germany | 9 | 0.2% |
| Greece | 10 | 0.3% |
| Guatemala | 53 | 1.4% |
| Hungary | 6 | 0.2% |
| Ireland | 54 | 1.4% |
| Italy | 29 | 0.8% |
| Jamaica | 36 | 1.0% |
| Korea | 62 | 1.6% |
| Latin America | 125 | 3.3% |
| Northern Europe | 103 | 2.7% |
| Peru | 36 | 1.0% |
| Poland | 16 | 0.4% |
| Romania | 3 | 0.1% |
| South America | 36 | 1.0% |
| Southern Europe | 39 | 1.0% |
| Turkey | 2 | 0.1% |
| Western Asia | 2 | 0.1% |
| Western Europe | 9 | 0.2% | View All 25 Rows |
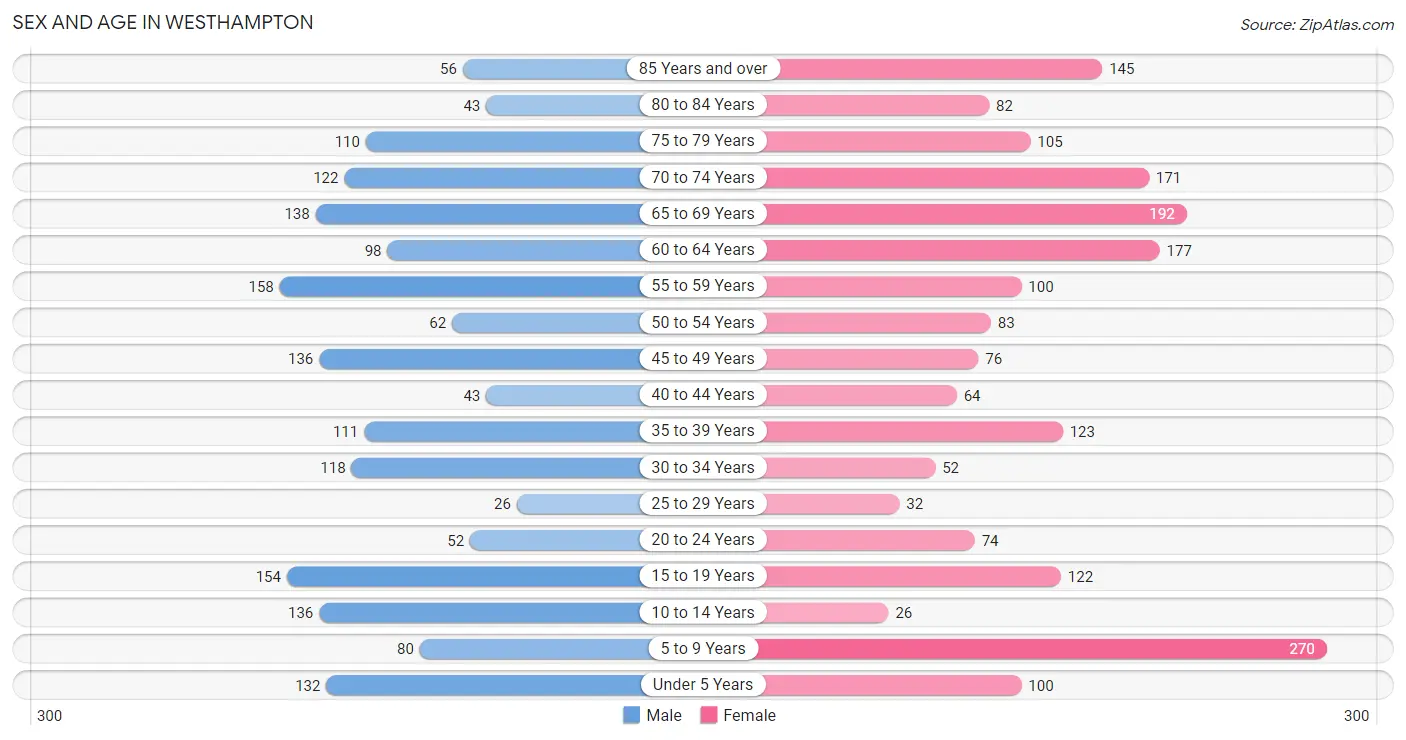
Sex and Age in Westhampton
Sex and Age in Westhampton
The most populous age groups in Westhampton are 55 to 59 Years (158 | 8.9%) for men and 5 to 9 Years (270 | 13.5%) for women.
| Age Bracket | Male | Female |
| Under 5 Years | 132 (7.4%) | 100 (5.0%) |
| 5 to 9 Years | 80 (4.5%) | 270 (13.5%) |
| 10 to 14 Years | 136 (7.7%) | 26 (1.3%) |
| 15 to 19 Years | 154 (8.7%) | 122 (6.1%) |
| 20 to 24 Years | 52 (2.9%) | 74 (3.7%) |
| 25 to 29 Years | 26 (1.5%) | 32 (1.6%) |
| 30 to 34 Years | 118 (6.7%) | 52 (2.6%) |
| 35 to 39 Years | 111 (6.2%) | 123 (6.2%) |
| 40 to 44 Years | 43 (2.4%) | 64 (3.2%) |
| 45 to 49 Years | 136 (7.7%) | 76 (3.8%) |
| 50 to 54 Years | 62 (3.5%) | 83 (4.2%) |
| 55 to 59 Years | 158 (8.9%) | 100 (5.0%) |
| 60 to 64 Years | 98 (5.5%) | 177 (8.9%) |
| 65 to 69 Years | 138 (7.8%) | 192 (9.6%) |
| 70 to 74 Years | 122 (6.9%) | 171 (8.6%) |
| 75 to 79 Years | 110 (6.2%) | 105 (5.3%) |
| 80 to 84 Years | 43 (2.4%) | 82 (4.1%) |
| 85 Years and over | 56 (3.2%) | 145 (7.3%) |
| Total | 1,775 (100.0%) | 1,994 (100.0%) |
Families and Households in Westhampton
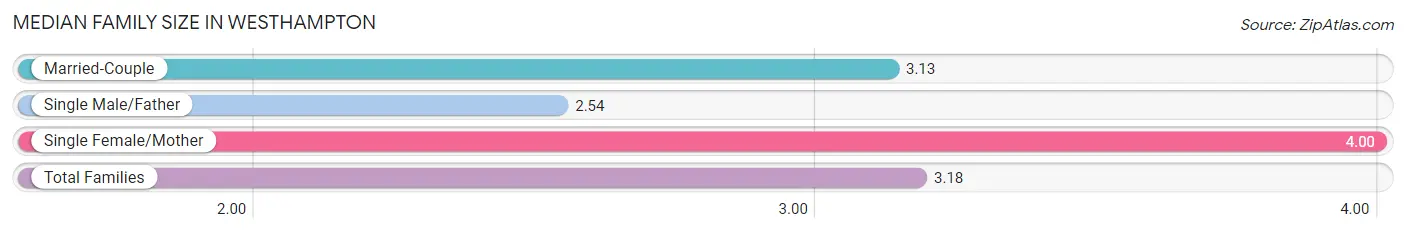
Median Family Size in Westhampton
The median family size in Westhampton is 3.18 persons per family, with single female/mother families (82 | 8.1%) accounting for the largest median family size of 4 persons per family. On the other hand, single male/father families (35 | 3.5%) represent the smallest median family size with 2.54 persons per family.
| Family Type | # Families | Family Size |
| Married-Couple | 892 (88.4%) | 3.13 |
| Single Male/Father | 35 (3.5%) | 2.54 |
| Single Female/Mother | 82 (8.1%) | 4.00 |
| Total Families | 1,009 (100.0%) | 3.18 |
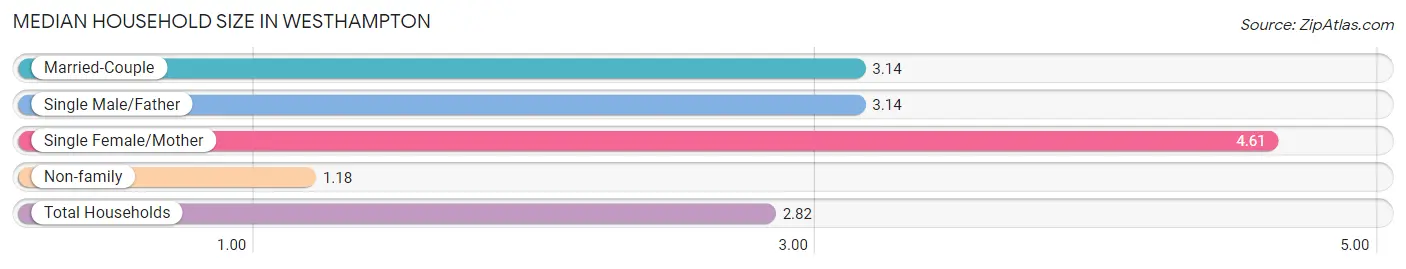
Median Household Size in Westhampton
The median household size in Westhampton is 2.82 persons per household, with single female/mother households (82 | 6.4%) accounting for the largest median household size of 4.61 persons per household. non-family households (269 | 21.0%) represent the smallest median household size with 1.18 persons per household.
| Household Type | # Households | Household Size |
| Married-Couple | 892 (69.8%) | 3.14 |
| Single Male/Father | 35 (2.7%) | 3.14 |
| Single Female/Mother | 82 (6.4%) | 4.61 |
| Non-family | 269 (21.0%) | 1.18 |
| Total Households | 1,278 (100.0%) | 2.82 |
Household Size by Marriage Status in Westhampton
Out of a total of 1,278 households in Westhampton, 1,009 (78.9%) are family households, while 269 (21.0%) are nonfamily households. The most numerous type of family households are 2-person households, comprising 517, and the most common type of nonfamily households are 1-person households, comprising 224.
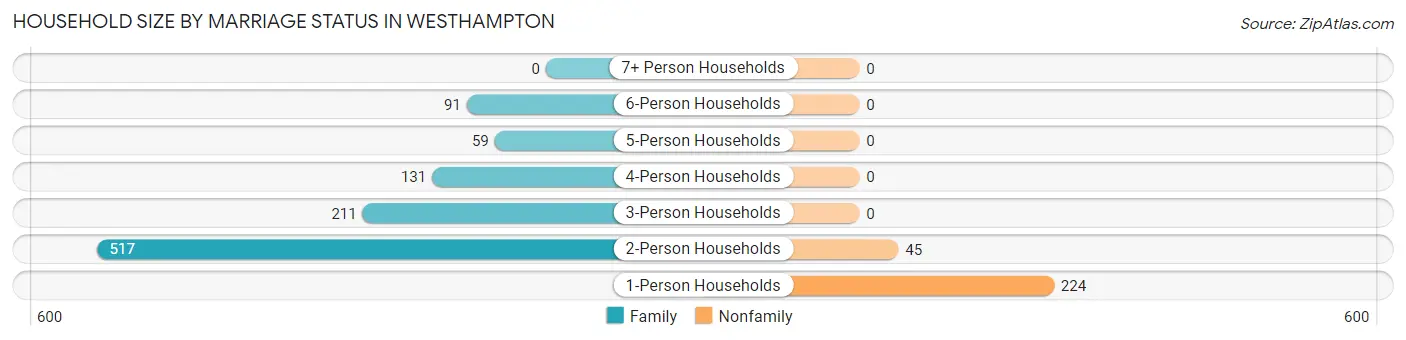
| Household Size | Family Households | Nonfamily Households |
| 1-Person Households | - | 224 (17.5%) |
| 2-Person Households | 517 (40.5%) | 45 (3.5%) |
| 3-Person Households | 211 (16.5%) | 0 (0.0%) |
| 4-Person Households | 131 (10.2%) | 0 (0.0%) |
| 5-Person Households | 59 (4.6%) | 0 (0.0%) |
| 6-Person Households | 91 (7.1%) | 0 (0.0%) |
| 7+ Person Households | 0 (0.0%) | 0 (0.0%) |
| Total | 1,009 (78.9%) | 269 (21.0%) |
Female Fertility in Westhampton
Fertility by Age in Westhampton
| Age Bracket | Women with Births | Births / 1,000 Women |
| 15 to 19 years | 0 (0.0%) | 0.0 |
| 20 to 34 years | 0 (0.0%) | 0.0 |
| 35 to 50 years | 0 (0.0%) | 0.0 |
| Total | 0 (0.0%) | 0.0 |
Fertility by Age by Marriage Status in Westhampton
| Age Bracket | Married | Unmarried |
| 15 to 19 years | 0 (0.0%) | 0 (0.0%) |
| 20 to 34 years | 0 (0.0%) | 0 (0.0%) |
| 35 to 50 years | 0 (0.0%) | 0 (0.0%) |
| Total | 0 (0.0%) | 0 (0.0%) |
Fertility by Education in Westhampton
| Educational Attainment | Women with Births | Births / 1,000 Women |
| Less than High School | 0 (0.0%) | 0.0 |
| High School Diploma | 0 (0.0%) | 0.0 |
| College or Associate's Degree | 0 (0.0%) | 0.0 |
| Bachelor's Degree | 0 (0.0%) | 0.0 |
| Graduate Degree | 0 (0.0%) | 0.0 |
| Total | 0 (0.0%) | 0.0 |
Fertility by Education by Marriage Status in Westhampton
| Educational Attainment | Married | Unmarried |
| Less than High School | 0 (0.0%) | 0 (0.0%) |
| High School Diploma | 0 (0.0%) | 0 (0.0%) |
| College or Associate's Degree | 0 (0.0%) | 0 (0.0%) |
| Bachelor's Degree | 0 (0.0%) | 0 (0.0%) |
| Graduate Degree | 0 (0.0%) | 0 (0.0%) |
| Total | 0 (0.0%) | 0 (0.0%) |
Employment Characteristics in Westhampton
Employment by Class of Employer in Westhampton
Among the 1,423 employed individuals in Westhampton, private company employees (804 | 56.5%), self-employed (incorporated) (182 | 12.8%), and not-for-profit organizations (109 | 7.7%) make up the most common classes of employment.
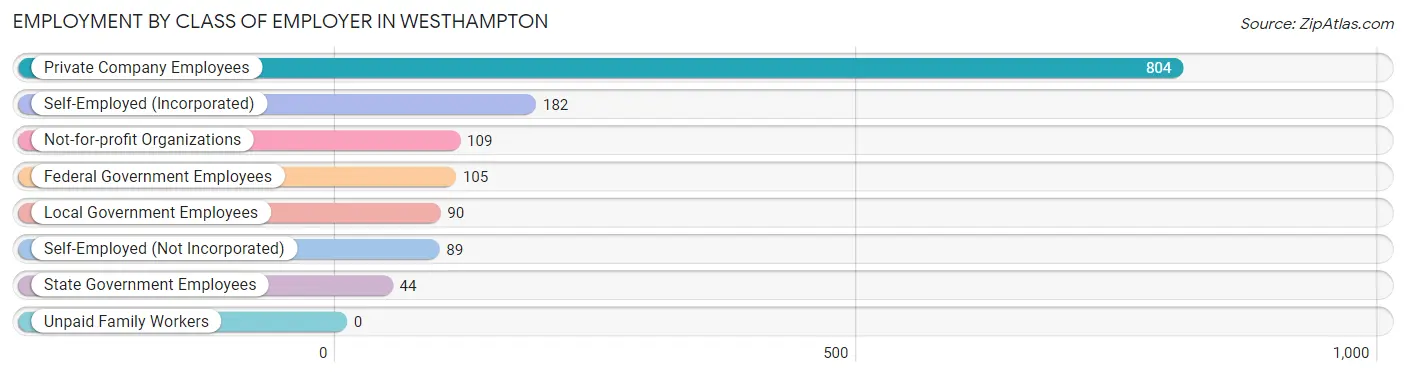
| Employer Class | # Employees | % Employees |
| Private Company Employees | 804 | 56.5% |
| Self-Employed (Incorporated) | 182 | 12.8% |
| Self-Employed (Not Incorporated) | 89 | 6.2% |
| Not-for-profit Organizations | 109 | 7.7% |
| Local Government Employees | 90 | 6.3% |
| State Government Employees | 44 | 3.1% |
| Federal Government Employees | 105 | 7.4% |
| Unpaid Family Workers | 0 | 0.0% |
| Total | 1,423 | 100.0% |
Employment Status by Age in Westhampton
According to the labor force statistics for Westhampton, out of the total population over 16 years of age (2,983), 52.8% or 1,575 individuals are in the labor force, with 4.3% or 68 of them unemployed. The age group with the highest labor force participation rate is 45 to 54 years, with 92.7% or 331 individuals in the labor force. Within the labor force, the 25 to 29 years age range has the highest percentage of unemployed individuals, with 18.9% or 10 of them being unemployed.
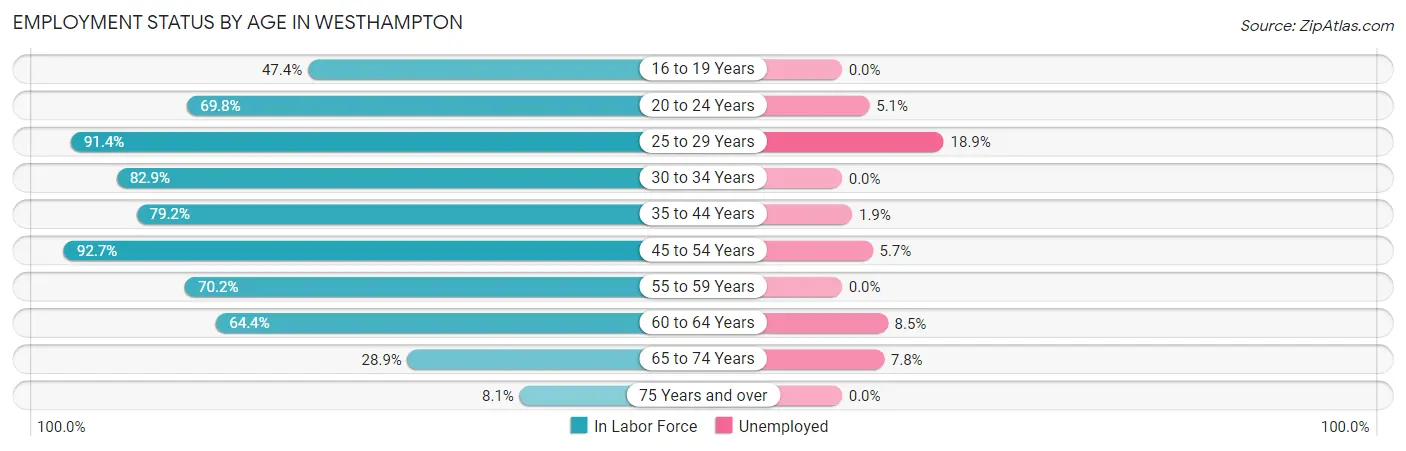
| Age Bracket | In Labor Force | Unemployed |
| 16 to 19 Years | 111 (47.4%) | 0 (0.0%) |
| 20 to 24 Years | 88 (69.8%) | 4 (5.1%) |
| 25 to 29 Years | 53 (91.4%) | 10 (18.9%) |
| 30 to 34 Years | 141 (82.9%) | 0 (0.0%) |
| 35 to 44 Years | 270 (79.2%) | 5 (1.9%) |
| 45 to 54 Years | 331 (92.7%) | 19 (5.7%) |
| 55 to 59 Years | 181 (70.2%) | 0 (0.0%) |
| 60 to 64 Years | 177 (64.4%) | 15 (8.5%) |
| 65 to 74 Years | 180 (28.9%) | 14 (7.8%) |
| 75 Years and over | 44 (8.1%) | 0 (0.0%) |
| Total | 1,575 (52.8%) | 68 (4.3%) |
Employment Status by Educational Attainment in Westhampton
According to labor force statistics for Westhampton, 79.0% of individuals (1,153) out of the total population between 25 and 64 years of age (1,459) are in the labor force, with 4.2% or 48 of them being unemployed. The group with the highest labor force participation rate are those with the educational attainment of bachelor's degree or higher, with 87.7% or 653 individuals in the labor force. Within the labor force, individuals with college / associate degree education have the highest percentage of unemployment, with 8.6% or 20 of them being unemployed.
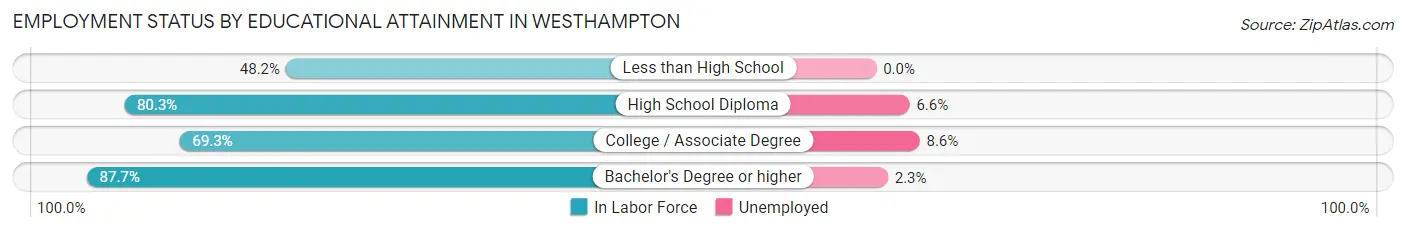
| Educational Attainment | In Labor Force | Unemployed |
| Less than High School | 55 (48.2%) | 0 (0.0%) |
| High School Diploma | 212 (80.3%) | 17 (6.6%) |
| College / Associate Degree | 233 (69.3%) | 29 (8.6%) |
| Bachelor's Degree or higher | 653 (87.7%) | 17 (2.3%) |
| Total | 1,153 (79.0%) | 61 (4.2%) |
Employment Occupations by Sex in Westhampton
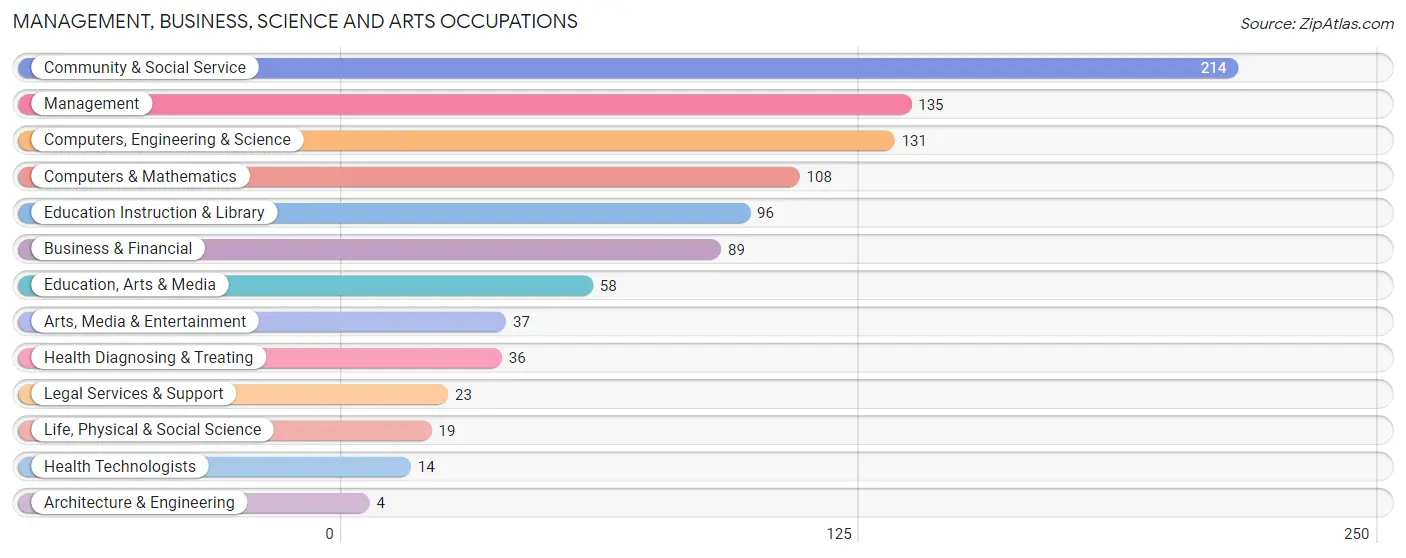
Management, Business, Science and Arts Occupations
The most common Management, Business, Science and Arts occupations in Westhampton are Community & Social Service (214 | 14.3%), Management (135 | 9.0%), Computers, Engineering & Science (131 | 8.7%), Computers & Mathematics (108 | 7.2%), and Education Instruction & Library (96 | 6.4%).
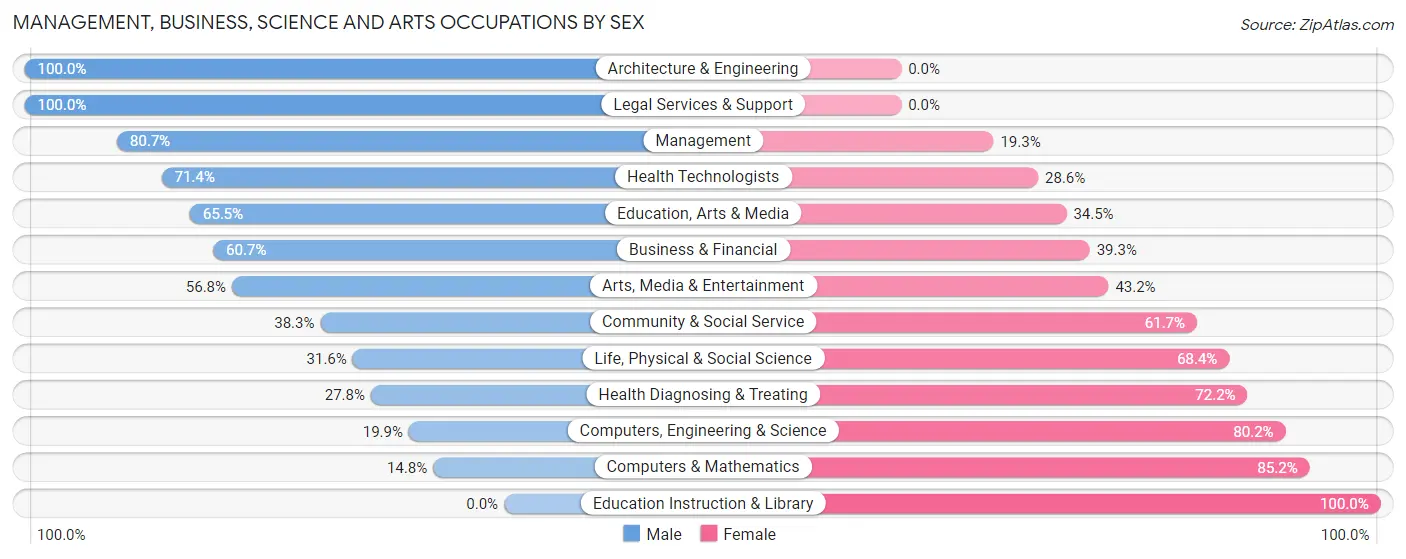
Management, Business, Science and Arts Occupations by Sex
Within the Management, Business, Science and Arts occupations in Westhampton, the most male-oriented occupations are Architecture & Engineering (100.0%), Legal Services & Support (100.0%), and Management (80.7%), while the most female-oriented occupations are Education Instruction & Library (100.0%), Computers & Mathematics (85.2%), and Computers, Engineering & Science (80.1%).
| Occupation | Male | Female |
| Management | 109 (80.7%) | 26 (19.3%) |
| Business & Financial | 54 (60.7%) | 35 (39.3%) |
| Computers, Engineering & Science | 26 (19.9%) | 105 (80.1%) |
| Computers & Mathematics | 16 (14.8%) | 92 (85.2%) |
| Architecture & Engineering | 4 (100.0%) | 0 (0.0%) |
| Life, Physical & Social Science | 6 (31.6%) | 13 (68.4%) |
| Community & Social Service | 82 (38.3%) | 132 (61.7%) |
| Education, Arts & Media | 38 (65.5%) | 20 (34.5%) |
| Legal Services & Support | 23 (100.0%) | 0 (0.0%) |
| Education Instruction & Library | 0 (0.0%) | 96 (100.0%) |
| Arts, Media & Entertainment | 21 (56.8%) | 16 (43.2%) |
| Health Diagnosing & Treating | 10 (27.8%) | 26 (72.2%) |
| Health Technologists | 10 (71.4%) | 4 (28.6%) |
| Total (Category) | 281 (46.5%) | 324 (53.5%) |
| Total (Overall) | 902 (60.2%) | 597 (39.8%) |
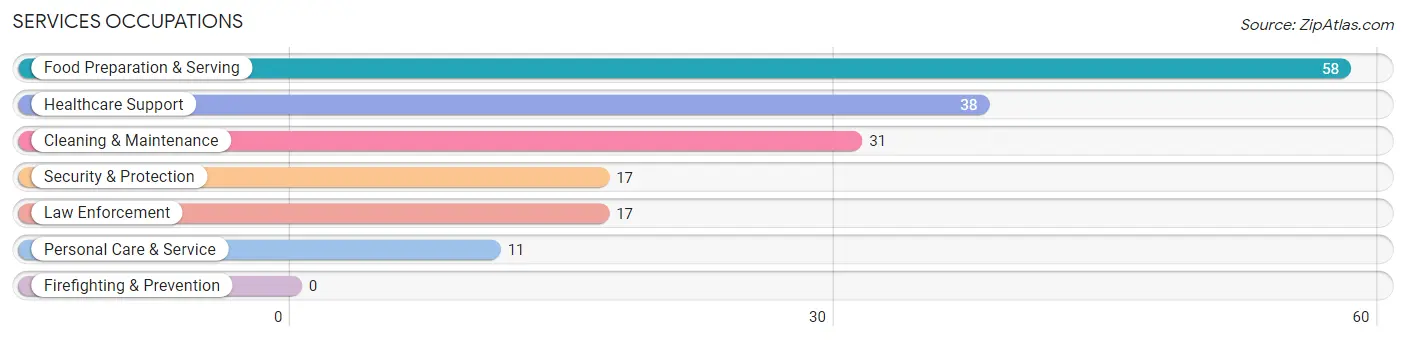
Services Occupations
The most common Services occupations in Westhampton are Food Preparation & Serving (58 | 3.9%), Healthcare Support (38 | 2.5%), Cleaning & Maintenance (31 | 2.1%), Security & Protection (17 | 1.1%), and Law Enforcement (17 | 1.1%).
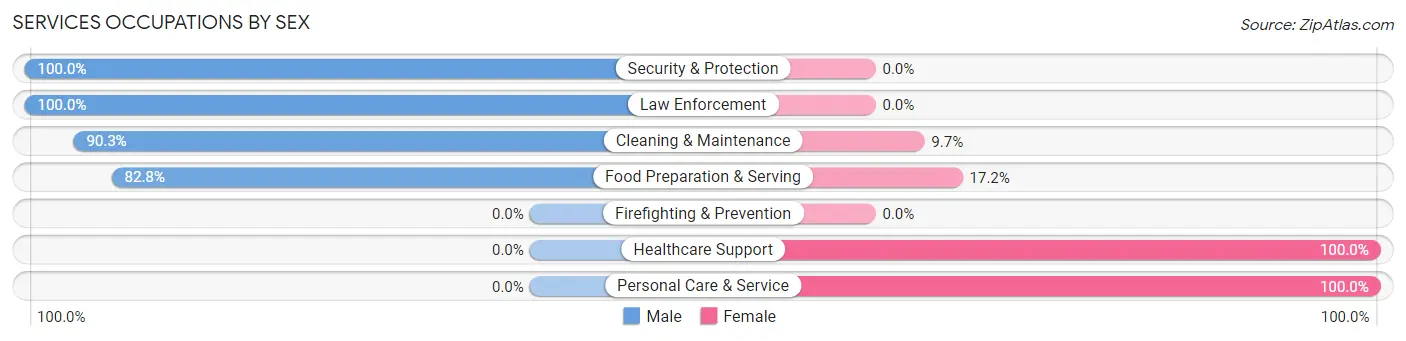
Services Occupations by Sex
Within the Services occupations in Westhampton, the most male-oriented occupations are Security & Protection (100.0%), Law Enforcement (100.0%), and Cleaning & Maintenance (90.3%), while the most female-oriented occupations are Healthcare Support (100.0%), Personal Care & Service (100.0%), and Food Preparation & Serving (17.2%).
| Occupation | Male | Female |
| Healthcare Support | 0 (0.0%) | 38 (100.0%) |
| Security & Protection | 17 (100.0%) | 0 (0.0%) |
| Firefighting & Prevention | 0 (0.0%) | 0 (0.0%) |
| Law Enforcement | 17 (100.0%) | 0 (0.0%) |
| Food Preparation & Serving | 48 (82.8%) | 10 (17.2%) |
| Cleaning & Maintenance | 28 (90.3%) | 3 (9.7%) |
| Personal Care & Service | 0 (0.0%) | 11 (100.0%) |
| Total (Category) | 93 (60.0%) | 62 (40.0%) |
| Total (Overall) | 902 (60.2%) | 597 (39.8%) |
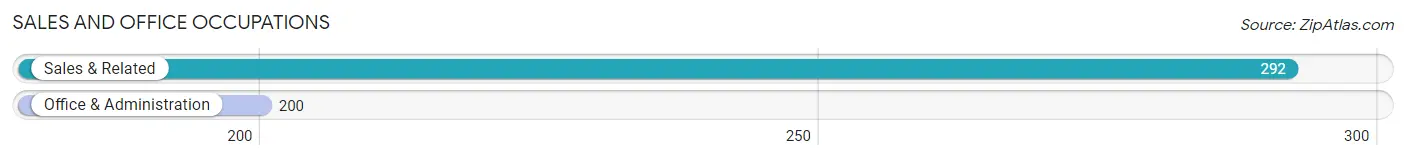
Sales and Office Occupations
The most common Sales and Office occupations in Westhampton are Sales & Related (292 | 19.5%), and Office & Administration (200 | 13.3%).
Sales and Office Occupations by Sex
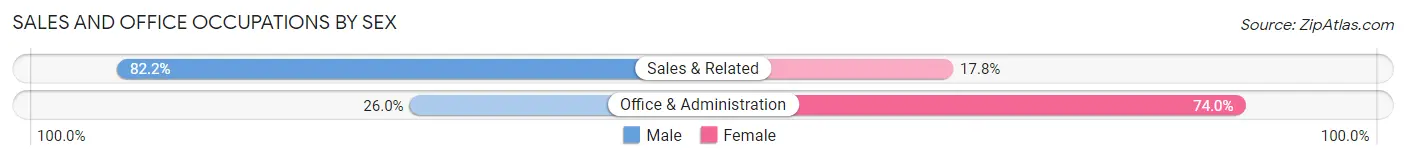
| Occupation | Male | Female |
| Sales & Related | 240 (82.2%) | 52 (17.8%) |
| Office & Administration | 52 (26.0%) | 148 (74.0%) |
| Total (Category) | 292 (59.4%) | 200 (40.6%) |
| Total (Overall) | 902 (60.2%) | 597 (39.8%) |
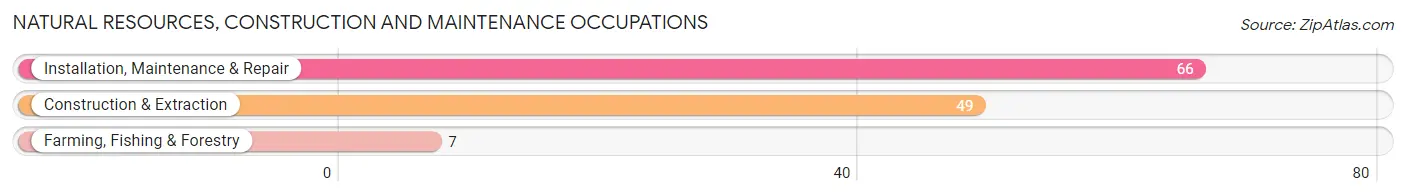
Natural Resources, Construction and Maintenance Occupations
The most common Natural Resources, Construction and Maintenance occupations in Westhampton are Installation, Maintenance & Repair (66 | 4.4%), Construction & Extraction (49 | 3.3%), and Farming, Fishing & Forestry (7 | 0.5%).
Natural Resources, Construction and Maintenance Occupations by Sex
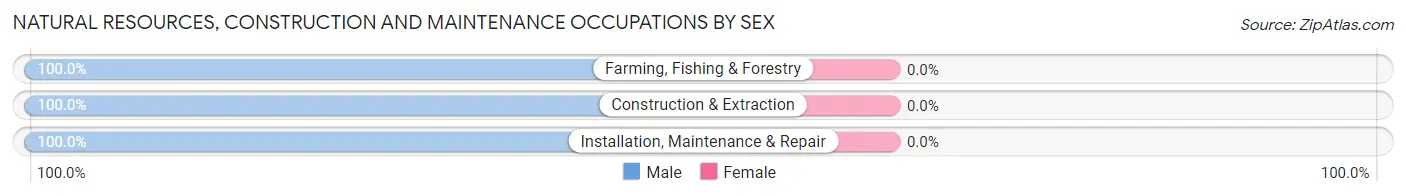
| Occupation | Male | Female |
| Farming, Fishing & Forestry | 7 (100.0%) | 0 (0.0%) |
| Construction & Extraction | 49 (100.0%) | 0 (0.0%) |
| Installation, Maintenance & Repair | 66 (100.0%) | 0 (0.0%) |
| Total (Category) | 122 (100.0%) | 0 (0.0%) |
| Total (Overall) | 902 (60.2%) | 597 (39.8%) |
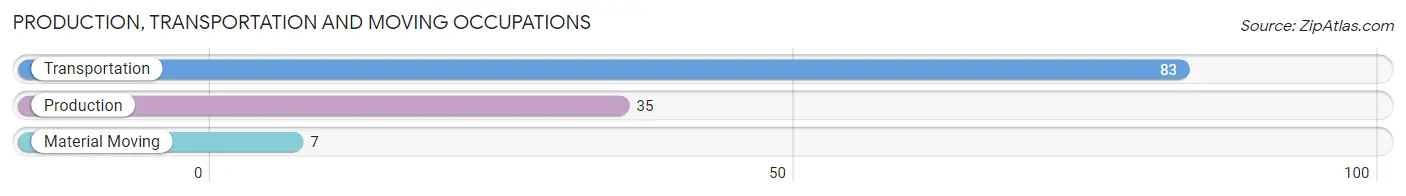
Production, Transportation and Moving Occupations
The most common Production, Transportation and Moving occupations in Westhampton are Transportation (83 | 5.5%), Production (35 | 2.3%), and Material Moving (7 | 0.5%).
Production, Transportation and Moving Occupations by Sex
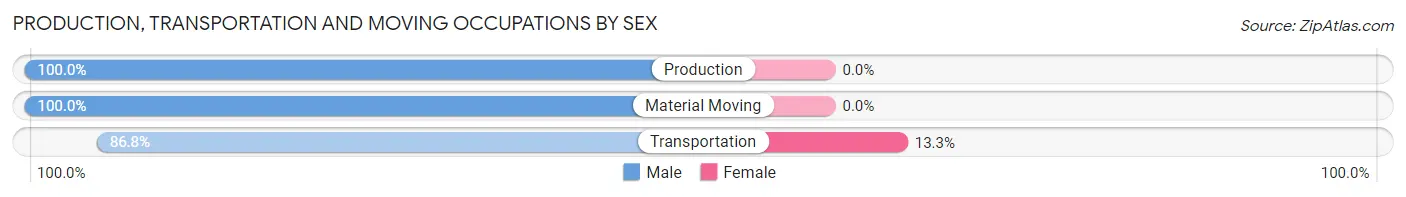
| Occupation | Male | Female |
| Production | 35 (100.0%) | 0 (0.0%) |
| Transportation | 72 (86.8%) | 11 (13.3%) |
| Material Moving | 7 (100.0%) | 0 (0.0%) |
| Total (Category) | 114 (91.2%) | 11 (8.8%) |
| Total (Overall) | 902 (60.2%) | 597 (39.8%) |
Employment Industries by Sex in Westhampton
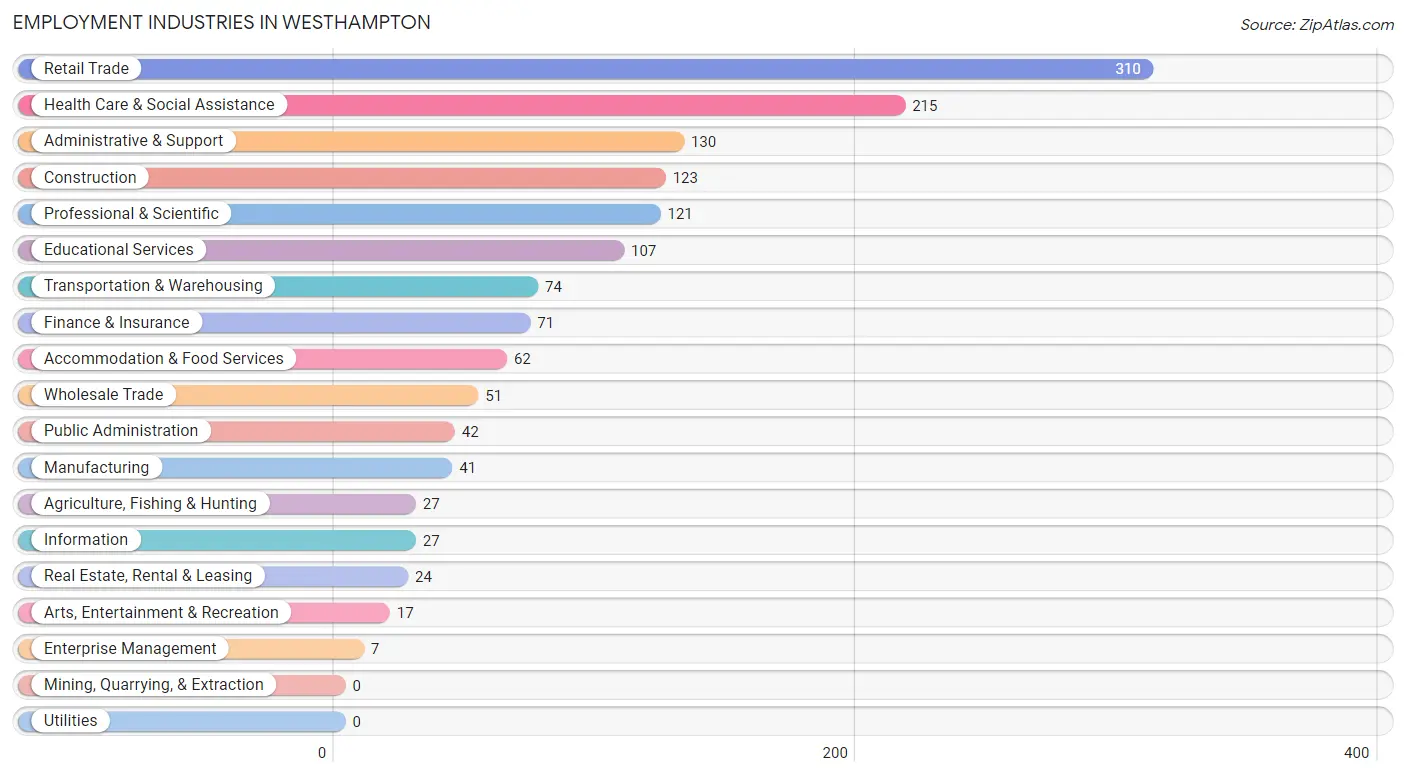
Employment Industries in Westhampton
The major employment industries in Westhampton include Retail Trade (310 | 20.7%), Health Care & Social Assistance (215 | 14.3%), Administrative & Support (130 | 8.7%), Construction (123 | 8.2%), and Professional & Scientific (121 | 8.1%).
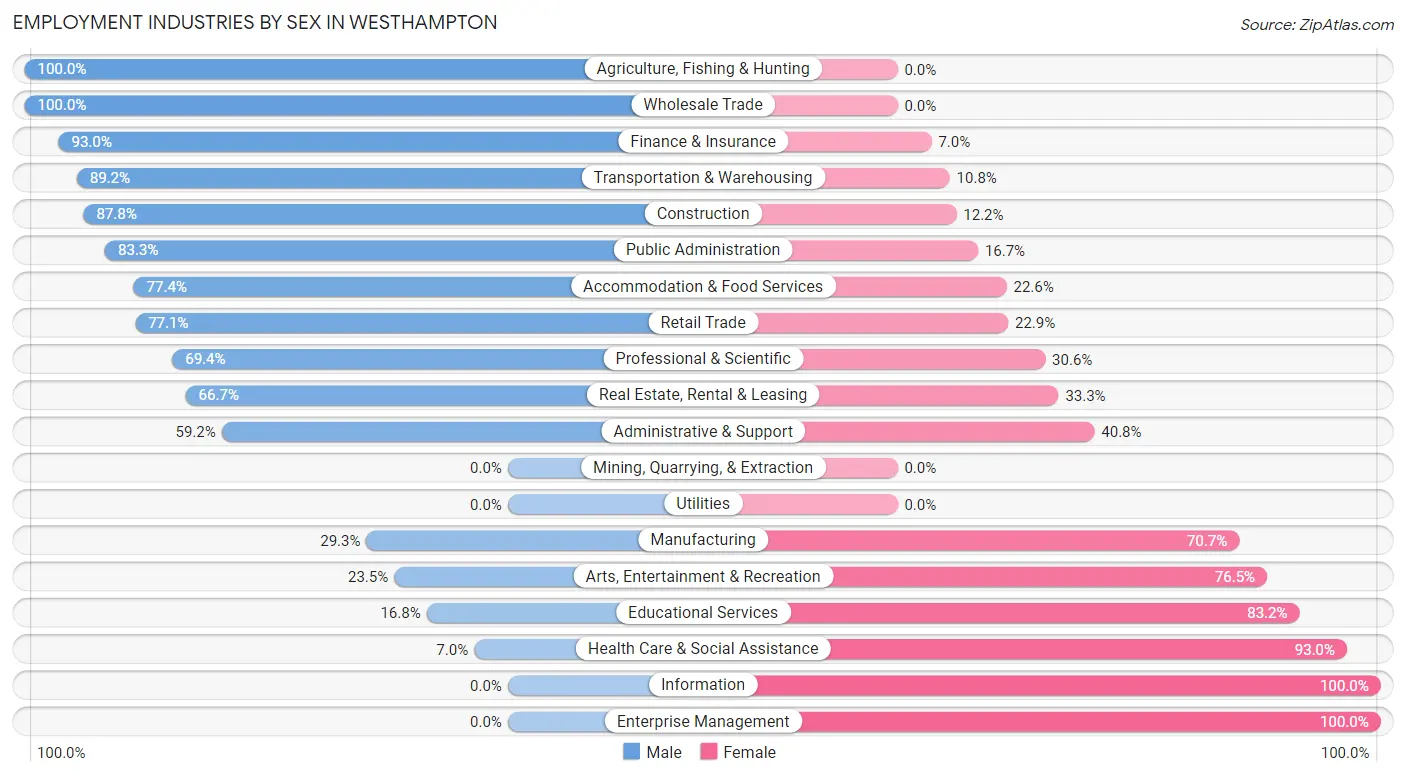
Employment Industries by Sex in Westhampton
The Westhampton industries that see more men than women are Agriculture, Fishing & Hunting (100.0%), Wholesale Trade (100.0%), and Finance & Insurance (93.0%), whereas the industries that tend to have a higher number of women are Information (100.0%), Enterprise Management (100.0%), and Health Care & Social Assistance (93.0%).
| Industry | Male | Female |
| Agriculture, Fishing & Hunting | 27 (100.0%) | 0 (0.0%) |
| Mining, Quarrying, & Extraction | 0 (0.0%) | 0 (0.0%) |
| Construction | 108 (87.8%) | 15 (12.2%) |
| Manufacturing | 12 (29.3%) | 29 (70.7%) |
| Wholesale Trade | 51 (100.0%) | 0 (0.0%) |
| Retail Trade | 239 (77.1%) | 71 (22.9%) |
| Transportation & Warehousing | 66 (89.2%) | 8 (10.8%) |
| Utilities | 0 (0.0%) | 0 (0.0%) |
| Information | 0 (0.0%) | 27 (100.0%) |
| Finance & Insurance | 66 (93.0%) | 5 (7.0%) |
| Real Estate, Rental & Leasing | 16 (66.7%) | 8 (33.3%) |
| Professional & Scientific | 84 (69.4%) | 37 (30.6%) |
| Enterprise Management | 0 (0.0%) | 7 (100.0%) |
| Administrative & Support | 77 (59.2%) | 53 (40.8%) |
| Educational Services | 18 (16.8%) | 89 (83.2%) |
| Health Care & Social Assistance | 15 (7.0%) | 200 (93.0%) |
| Arts, Entertainment & Recreation | 4 (23.5%) | 13 (76.5%) |
| Accommodation & Food Services | 48 (77.4%) | 14 (22.6%) |
| Public Administration | 35 (83.3%) | 7 (16.7%) |
| Total | 902 (60.2%) | 597 (39.8%) |
Education in Westhampton
School Enrollment in Westhampton
The most common levels of schooling among the 953 students in Westhampton are high school (250 | 26.2%), elementary school (226 | 23.7%), and nursery / preschool (141 | 14.8%).
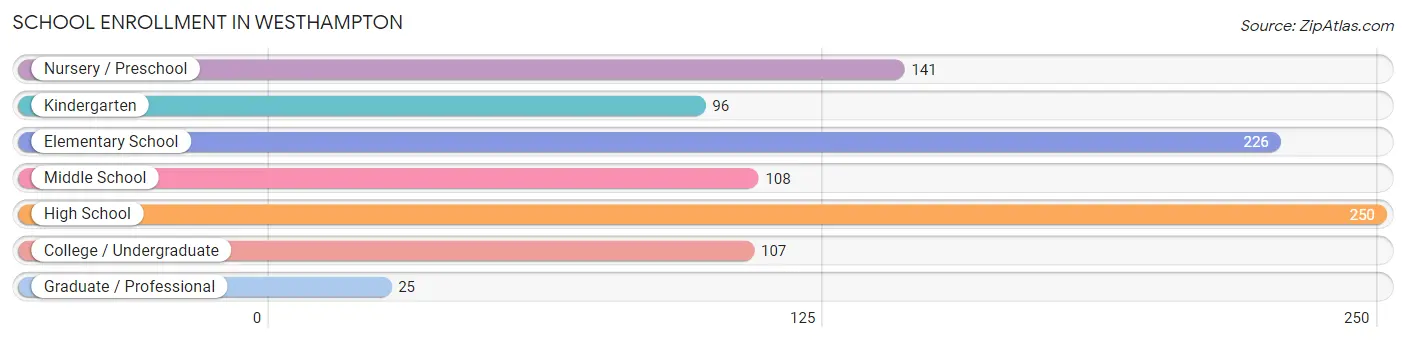
| School Level | # Students | % Students |
| Nursery / Preschool | 141 | 14.8% |
| Kindergarten | 96 | 10.1% |
| Elementary School | 226 | 23.7% |
| Middle School | 108 | 11.3% |
| High School | 250 | 26.2% |
| College / Undergraduate | 107 | 11.2% |
| Graduate / Professional | 25 | 2.6% |
| Total | 953 | 100.0% |
School Enrollment by Age by Funding Source in Westhampton
Out of a total of 953 students who are enrolled in schools in Westhampton, 87 (9.1%) attend a private institution, while the remaining 866 (90.9%) are enrolled in public schools. The age group of 35 years and over has the highest likelihood of being enrolled in private schools, with 10 (34.5% in the age bracket) enrolled. Conversely, the age group of 3 to 4 year olds has the lowest likelihood of being enrolled in a private school, with 117 (100.0% in the age bracket) attending a public institution.
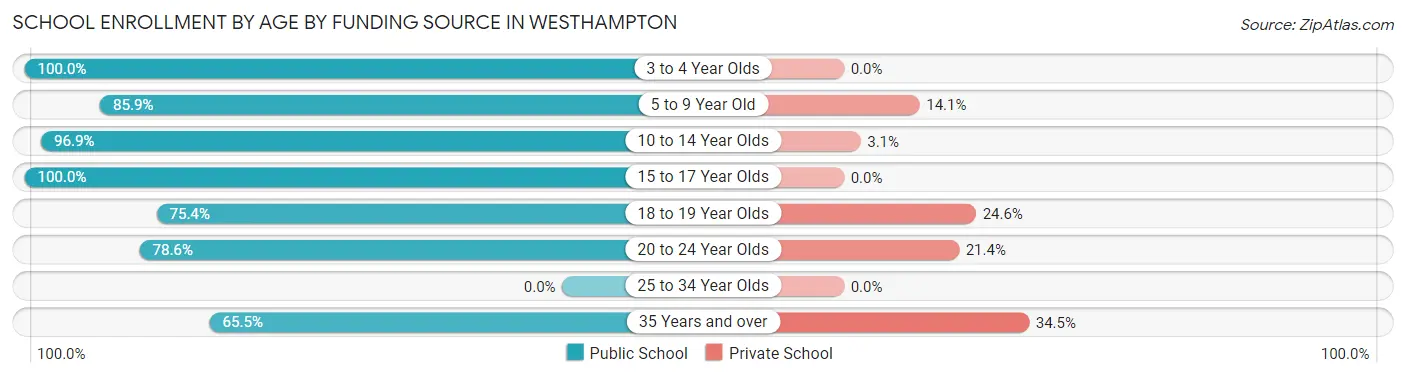
| Age Bracket | Public School | Private School |
| 3 to 4 Year Olds | 117 (100.0%) | 0 (0.0%) |
| 5 to 9 Year Old | 293 (85.9%) | 48 (14.1%) |
| 10 to 14 Year Olds | 157 (96.9%) | 5 (3.1%) |
| 15 to 17 Year Olds | 201 (100.0%) | 0 (0.0%) |
| 18 to 19 Year Olds | 46 (75.4%) | 15 (24.6%) |
| 20 to 24 Year Olds | 33 (78.6%) | 9 (21.4%) |
| 25 to 34 Year Olds | 0 (0.0%) | 0 (0.0%) |
| 35 Years and over | 19 (65.5%) | 10 (34.5%) |
| Total | 866 (90.9%) | 87 (9.1%) |
Educational Attainment by Field of Study in Westhampton
Business (208 | 14.5%), education (183 | 12.8%), liberal arts & history (159 | 11.1%), visual & performing arts (146 | 10.2%), and science & technology (127 | 8.9%) are the most common fields of study among 1,432 individuals in Westhampton who have obtained a bachelor's degree or higher.
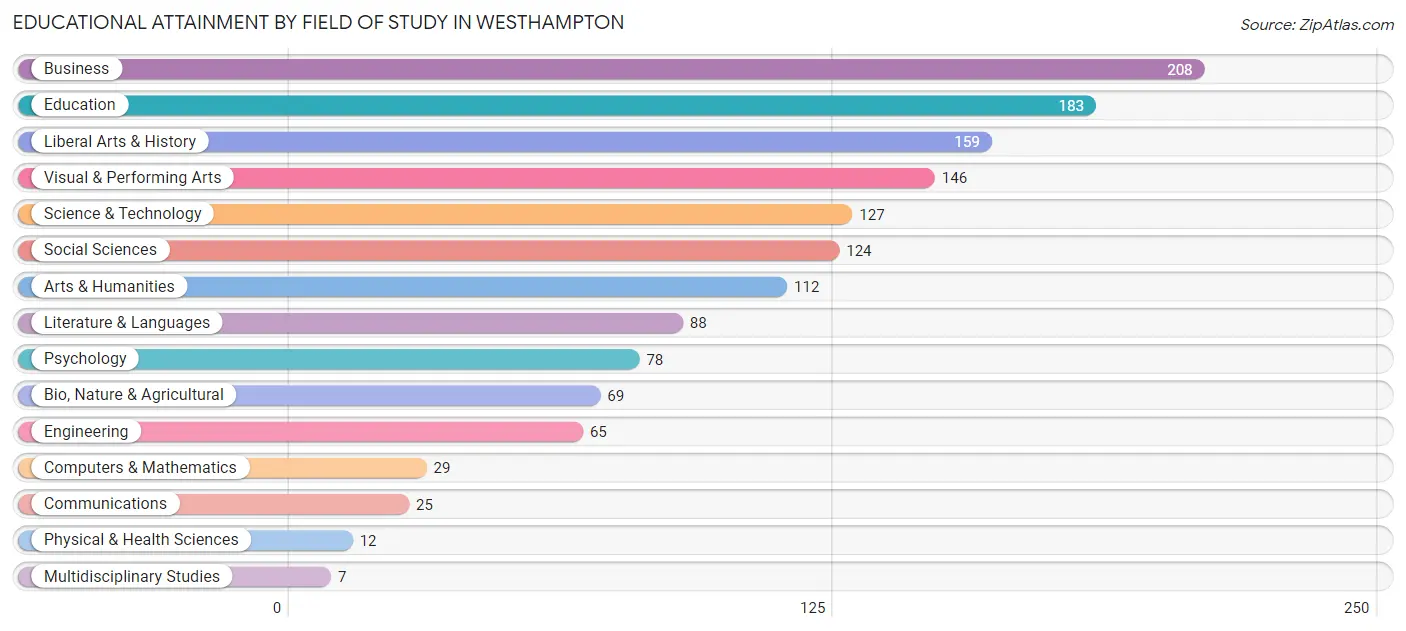
| Field of Study | # Graduates | % Graduates |
| Computers & Mathematics | 29 | 2.0% |
| Bio, Nature & Agricultural | 69 | 4.8% |
| Physical & Health Sciences | 12 | 0.8% |
| Psychology | 78 | 5.4% |
| Social Sciences | 124 | 8.7% |
| Engineering | 65 | 4.5% |
| Multidisciplinary Studies | 7 | 0.5% |
| Science & Technology | 127 | 8.9% |
| Business | 208 | 14.5% |
| Education | 183 | 12.8% |
| Literature & Languages | 88 | 6.1% |
| Liberal Arts & History | 159 | 11.1% |
| Visual & Performing Arts | 146 | 10.2% |
| Communications | 25 | 1.8% |
| Arts & Humanities | 112 | 7.8% |
| Total | 1,432 | 100.0% |
Transportation & Commute in Westhampton
Vehicle Availability by Sex in Westhampton
The most prevalent vehicle ownership categories in Westhampton are males with 2 vehicles (418, accounting for 49.6%) and females with 2 vehicles (319, making up 72.1%).
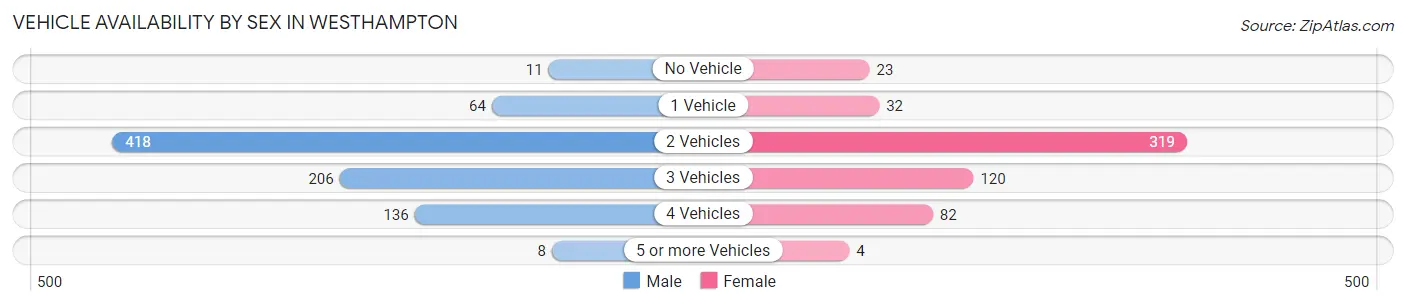
| Vehicles Available | Male | Female |
| No Vehicle | 11 (1.3%) | 23 (4.0%) |
| 1 Vehicle | 64 (7.6%) | 32 (5.5%) |
| 2 Vehicles | 418 (49.6%) | 319 (55.0%) |
| 3 Vehicles | 206 (24.4%) | 120 (20.7%) |
| 4 Vehicles | 136 (16.1%) | 82 (14.1%) |
| 5 or more Vehicles | 8 (0.9%) | 4 (0.7%) |
| Total | 843 (100.0%) | 580 (100.0%) |
Commute Time in Westhampton
The most frequently occuring commute durations in Westhampton are 5 to 9 minutes (357 commuters, 29.1%), 10 to 14 minutes (171 commuters, 13.9%), and 90 or more minutes (167 commuters, 13.6%).
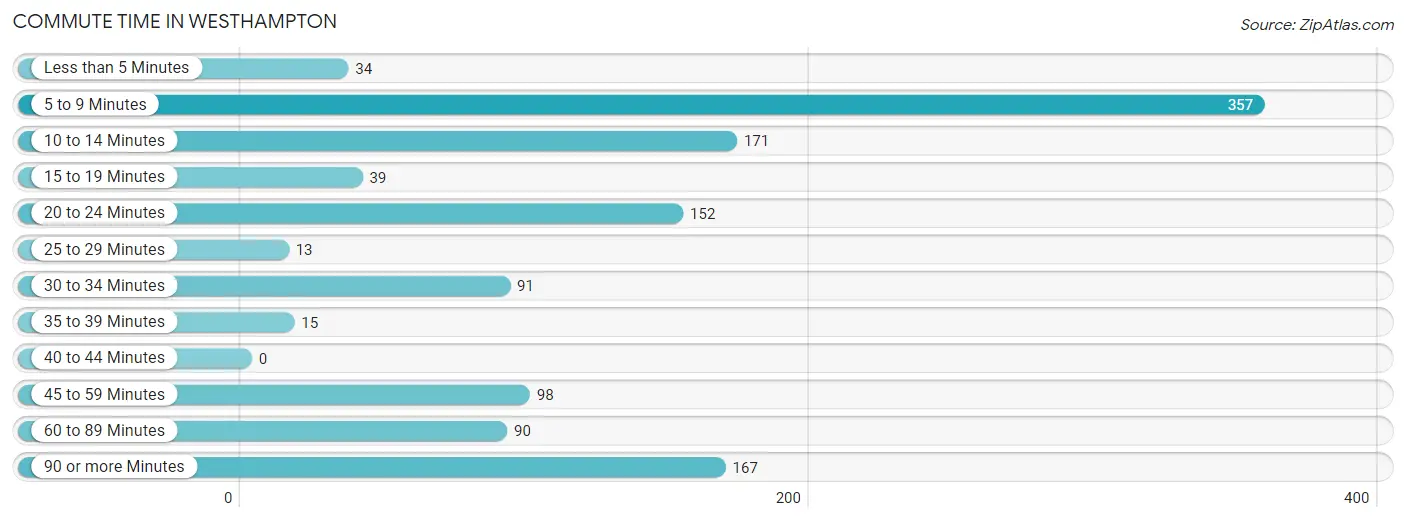
| Commute Time | # Commuters | % Commuters |
| Less than 5 Minutes | 34 | 2.8% |
| 5 to 9 Minutes | 357 | 29.1% |
| 10 to 14 Minutes | 171 | 13.9% |
| 15 to 19 Minutes | 39 | 3.2% |
| 20 to 24 Minutes | 152 | 12.4% |
| 25 to 29 Minutes | 13 | 1.1% |
| 30 to 34 Minutes | 91 | 7.4% |
| 35 to 39 Minutes | 15 | 1.2% |
| 40 to 44 Minutes | 0 | 0.0% |
| 45 to 59 Minutes | 98 | 8.0% |
| 60 to 89 Minutes | 90 | 7.3% |
| 90 or more Minutes | 167 | 13.6% |
Commute Time by Sex in Westhampton
The most common commute times in Westhampton are 5 to 9 minutes (267 commuters, 35.9%) for males and 10 to 14 minutes (96 commuters, 19.9%) for females.
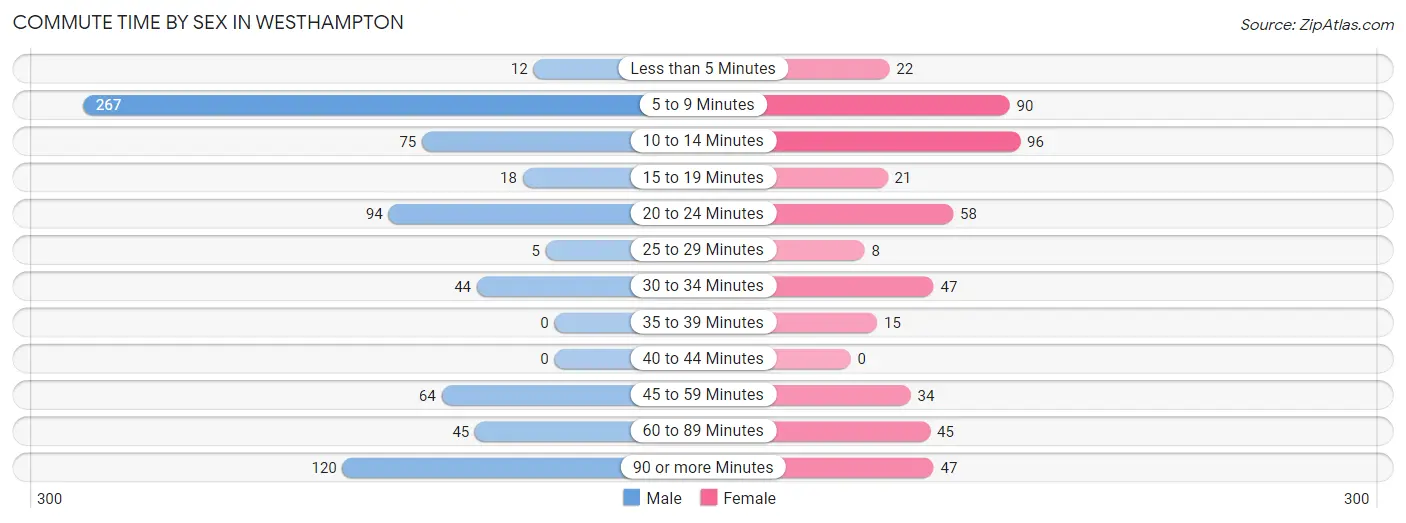
| Commute Time | Male | Female |
| Less than 5 Minutes | 12 (1.6%) | 22 (4.5%) |
| 5 to 9 Minutes | 267 (35.9%) | 90 (18.6%) |
| 10 to 14 Minutes | 75 (10.1%) | 96 (19.9%) |
| 15 to 19 Minutes | 18 (2.4%) | 21 (4.3%) |
| 20 to 24 Minutes | 94 (12.6%) | 58 (12.0%) |
| 25 to 29 Minutes | 5 (0.7%) | 8 (1.7%) |
| 30 to 34 Minutes | 44 (5.9%) | 47 (9.7%) |
| 35 to 39 Minutes | 0 (0.0%) | 15 (3.1%) |
| 40 to 44 Minutes | 0 (0.0%) | 0 (0.0%) |
| 45 to 59 Minutes | 64 (8.6%) | 34 (7.0%) |
| 60 to 89 Minutes | 45 (6.0%) | 45 (9.3%) |
| 90 or more Minutes | 120 (16.1%) | 47 (9.7%) |
Time of Departure to Work by Sex in Westhampton
The most frequent times of departure to work in Westhampton are 7:00 AM to 7:29 AM (149, 20.0%) for males and 8:00 AM to 8:29 AM (140, 29.0%) for females.
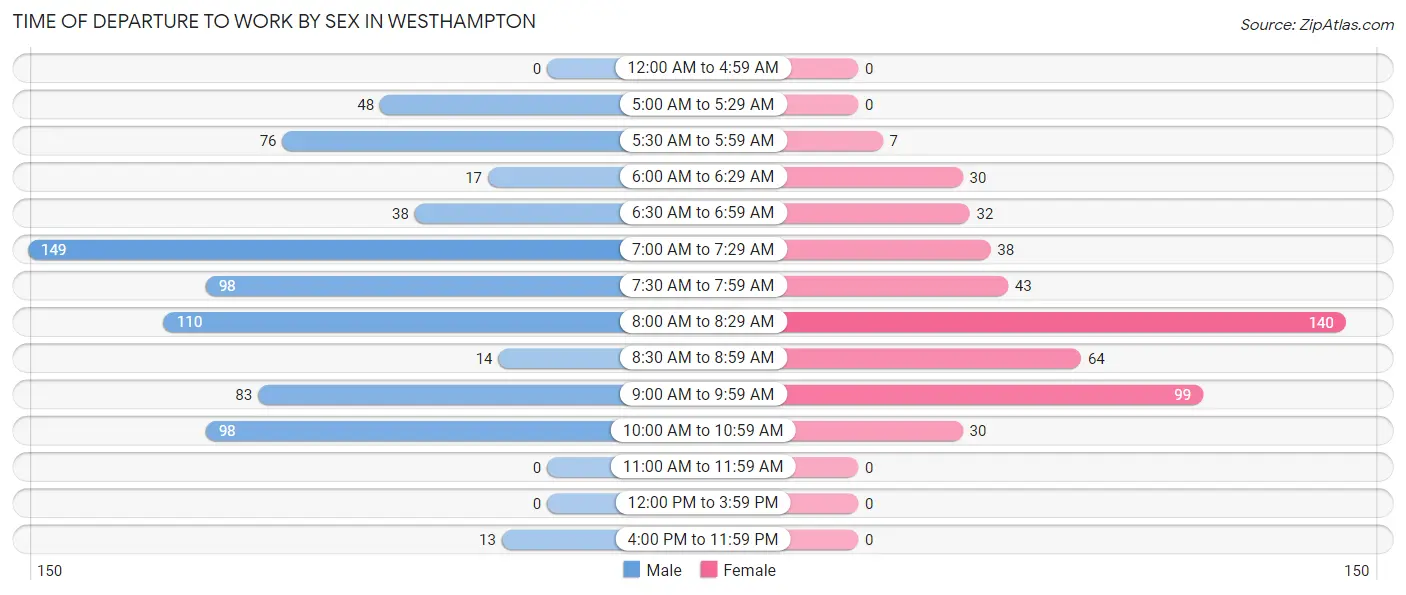
| Time of Departure | Male | Female |
| 12:00 AM to 4:59 AM | 0 (0.0%) | 0 (0.0%) |
| 5:00 AM to 5:29 AM | 48 (6.5%) | 0 (0.0%) |
| 5:30 AM to 5:59 AM | 76 (10.2%) | 7 (1.5%) |
| 6:00 AM to 6:29 AM | 17 (2.3%) | 30 (6.2%) |
| 6:30 AM to 6:59 AM | 38 (5.1%) | 32 (6.6%) |
| 7:00 AM to 7:29 AM | 149 (20.0%) | 38 (7.9%) |
| 7:30 AM to 7:59 AM | 98 (13.2%) | 43 (8.9%) |
| 8:00 AM to 8:29 AM | 110 (14.8%) | 140 (29.0%) |
| 8:30 AM to 8:59 AM | 14 (1.9%) | 64 (13.3%) |
| 9:00 AM to 9:59 AM | 83 (11.2%) | 99 (20.5%) |
| 10:00 AM to 10:59 AM | 98 (13.2%) | 30 (6.2%) |
| 11:00 AM to 11:59 AM | 0 (0.0%) | 0 (0.0%) |
| 12:00 PM to 3:59 PM | 0 (0.0%) | 0 (0.0%) |
| 4:00 PM to 11:59 PM | 13 (1.8%) | 0 (0.0%) |
| Total | 744 (100.0%) | 483 (100.0%) |
Housing Occupancy in Westhampton
Occupancy by Ownership in Westhampton
Of the total 1,278 dwellings in Westhampton, owner-occupied units account for 1,146 (89.7%), while renter-occupied units make up 132 (10.3%).
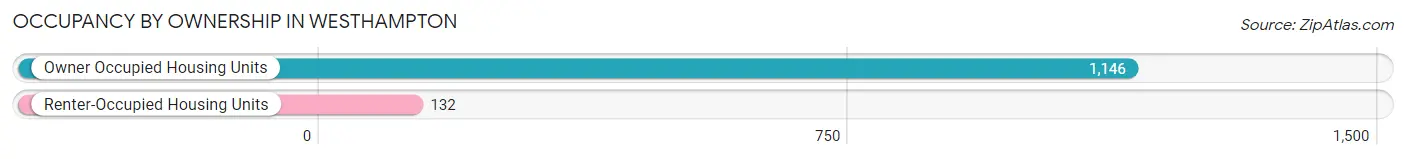
| Occupancy | # Housing Units | % Housing Units |
| Owner Occupied Housing Units | 1,146 | 89.7% |
| Renter-Occupied Housing Units | 132 | 10.3% |
| Total Occupied Housing Units | 1,278 | 100.0% |
Occupancy by Household Size in Westhampton
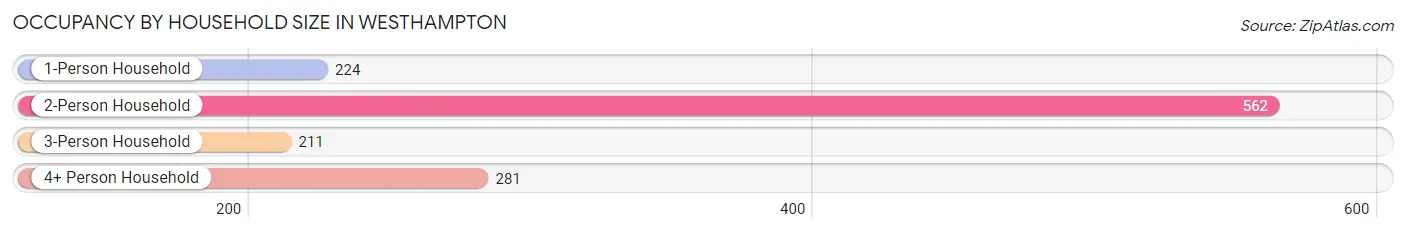
| Household Size | # Housing Units | % Housing Units |
| 1-Person Household | 224 | 17.5% |
| 2-Person Household | 562 | 44.0% |
| 3-Person Household | 211 | 16.5% |
| 4+ Person Household | 281 | 22.0% |
| Total Housing Units | 1,278 | 100.0% |
Occupancy by Ownership by Household Size in Westhampton
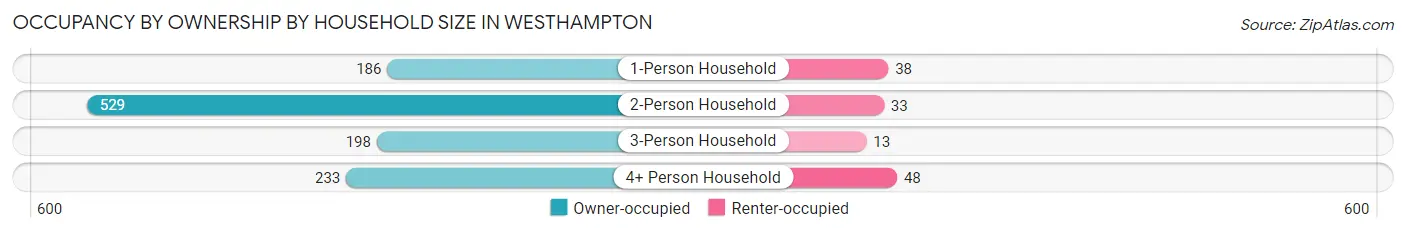
| Household Size | Owner-occupied | Renter-occupied |
| 1-Person Household | 186 (83.0%) | 38 (17.0%) |
| 2-Person Household | 529 (94.1%) | 33 (5.9%) |
| 3-Person Household | 198 (93.8%) | 13 (6.2%) |
| 4+ Person Household | 233 (82.9%) | 48 (17.1%) |
| Total Housing Units | 1,146 (89.7%) | 132 (10.3%) |
Occupancy by Educational Attainment in Westhampton
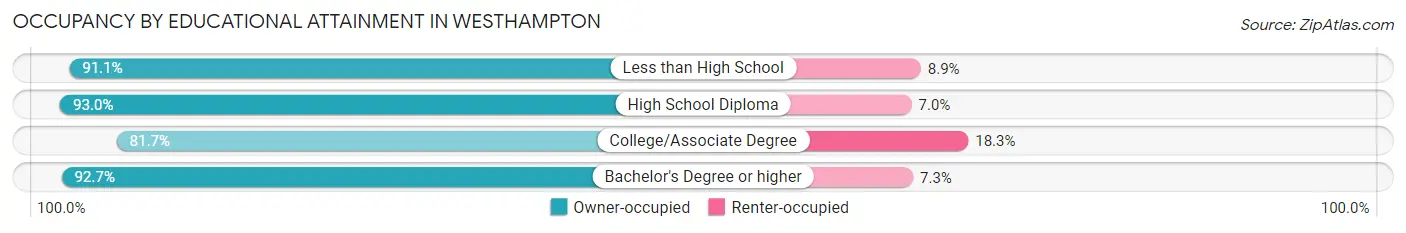
| Household Size | Owner-occupied | Renter-occupied |
| Less than High School | 72 (91.1%) | 7 (8.9%) |
| High School Diploma | 172 (93.0%) | 13 (7.0%) |
| College/Associate Degree | 282 (81.7%) | 63 (18.3%) |
| Bachelor's Degree or higher | 620 (92.7%) | 49 (7.3%) |
Occupancy by Age of Householder in Westhampton
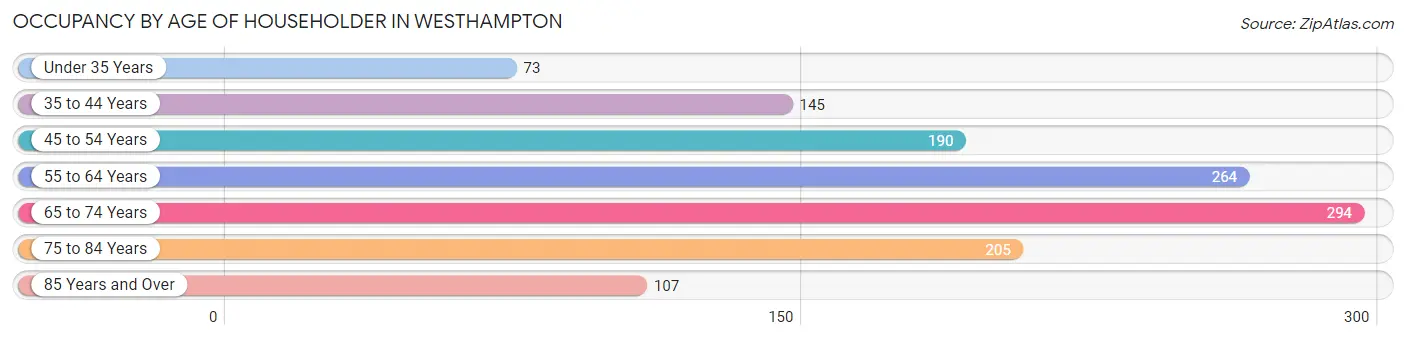
| Age Bracket | # Households | % Households |
| Under 35 Years | 73 | 5.7% |
| 35 to 44 Years | 145 | 11.4% |
| 45 to 54 Years | 190 | 14.9% |
| 55 to 64 Years | 264 | 20.7% |
| 65 to 74 Years | 294 | 23.0% |
| 75 to 84 Years | 205 | 16.0% |
| 85 Years and Over | 107 | 8.4% |
| Total | 1,278 | 100.0% |
Housing Finances in Westhampton
Median Income by Occupancy in Westhampton
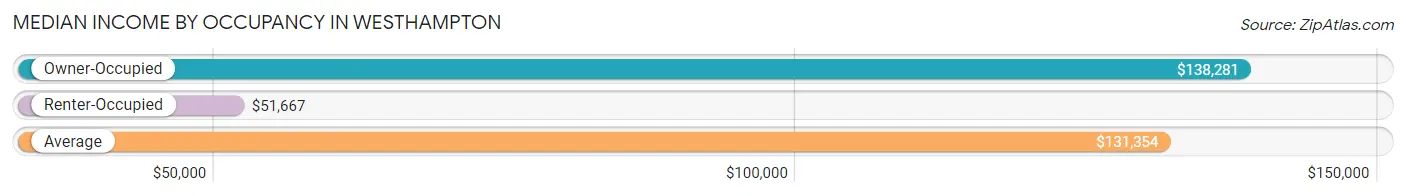
| Occupancy Type | # Households | Median Income |
| Owner-Occupied | 1,146 (89.7%) | $138,281 |
| Renter-Occupied | 132 (10.3%) | $51,667 |
| Average | 1,278 (100.0%) | $131,354 |
Occupancy by Householder Income Bracket in Westhampton
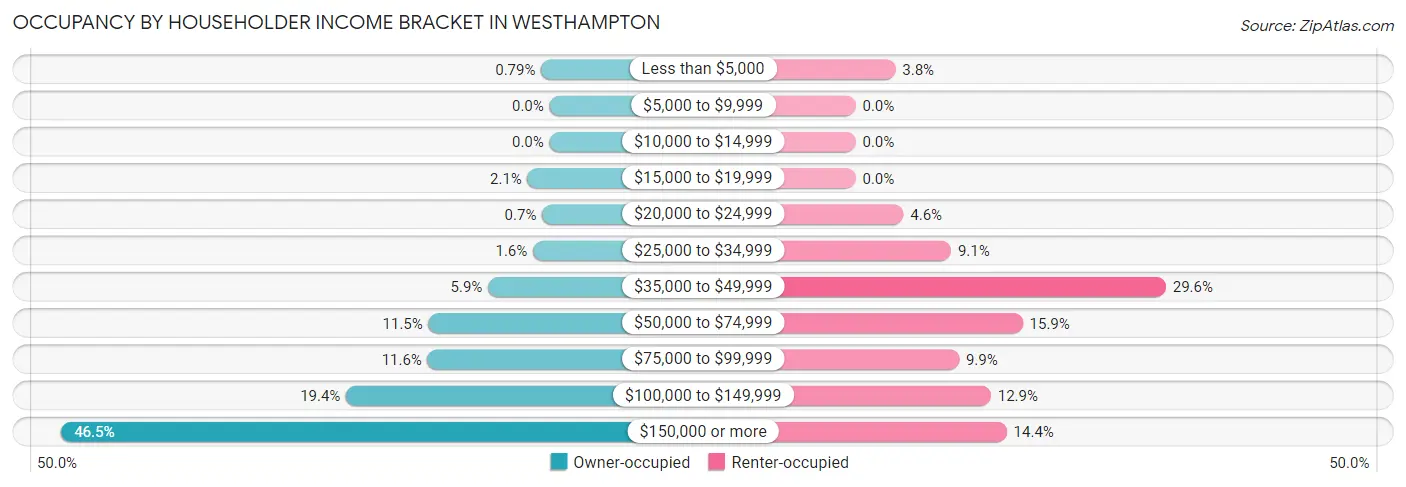
| Income Bracket | Owner-occupied | Renter-occupied |
| Less than $5,000 | 9 (0.8%) | 5 (3.8%) |
| $5,000 to $9,999 | 0 (0.0%) | 0 (0.0%) |
| $10,000 to $14,999 | 0 (0.0%) | 0 (0.0%) |
| $15,000 to $19,999 | 24 (2.1%) | 0 (0.0%) |
| $20,000 to $24,999 | 8 (0.7%) | 6 (4.5%) |
| $25,000 to $34,999 | 18 (1.6%) | 12 (9.1%) |
| $35,000 to $49,999 | 67 (5.9%) | 39 (29.5%) |
| $50,000 to $74,999 | 132 (11.5%) | 21 (15.9%) |
| $75,000 to $99,999 | 133 (11.6%) | 13 (9.9%) |
| $100,000 to $149,999 | 222 (19.4%) | 17 (12.9%) |
| $150,000 or more | 533 (46.5%) | 19 (14.4%) |
| Total | 1,146 (100.0%) | 132 (100.0%) |
Monthly Housing Cost Tiers in Westhampton
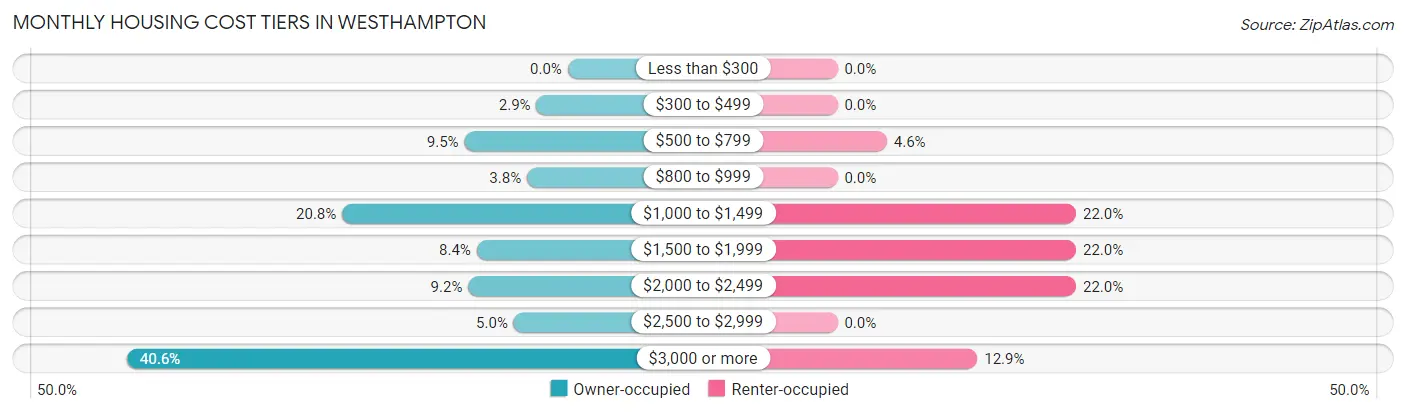
| Monthly Cost | Owner-occupied | Renter-occupied |
| Less than $300 | 0 (0.0%) | 0 (0.0%) |
| $300 to $499 | 33 (2.9%) | 0 (0.0%) |
| $500 to $799 | 109 (9.5%) | 6 (4.5%) |
| $800 to $999 | 43 (3.7%) | 0 (0.0%) |
| $1,000 to $1,499 | 238 (20.8%) | 29 (22.0%) |
| $1,500 to $1,999 | 96 (8.4%) | 29 (22.0%) |
| $2,000 to $2,499 | 105 (9.2%) | 29 (22.0%) |
| $2,500 to $2,999 | 57 (5.0%) | 0 (0.0%) |
| $3,000 or more | 465 (40.6%) | 17 (12.9%) |
| Total | 1,146 (100.0%) | 132 (100.0%) |
Physical Housing Characteristics in Westhampton
Housing Structures in Westhampton
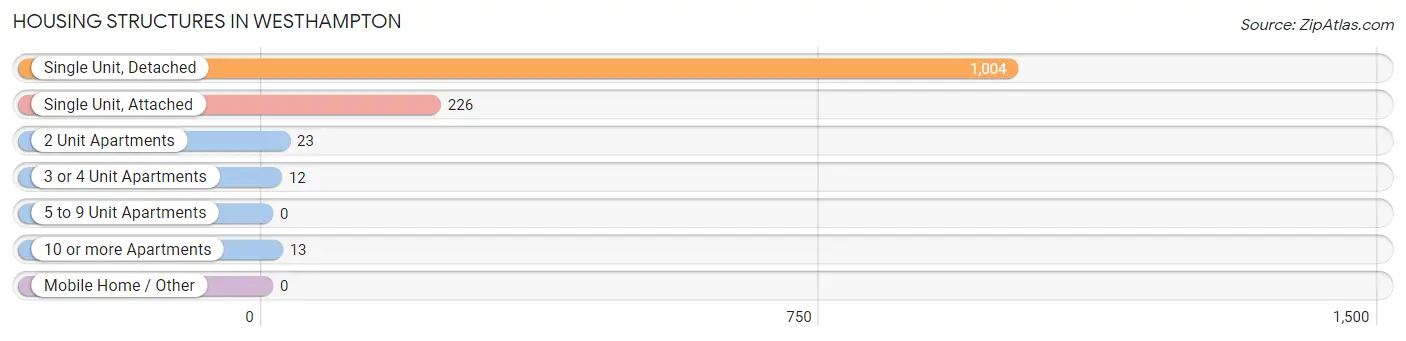
| Structure Type | # Housing Units | % Housing Units |
| Single Unit, Detached | 1,004 | 78.6% |
| Single Unit, Attached | 226 | 17.7% |
| 2 Unit Apartments | 23 | 1.8% |
| 3 or 4 Unit Apartments | 12 | 0.9% |
| 5 to 9 Unit Apartments | 0 | 0.0% |
| 10 or more Apartments | 13 | 1.0% |
| Mobile Home / Other | 0 | 0.0% |
| Total | 1,278 | 100.0% |
Housing Structures by Occupancy in Westhampton
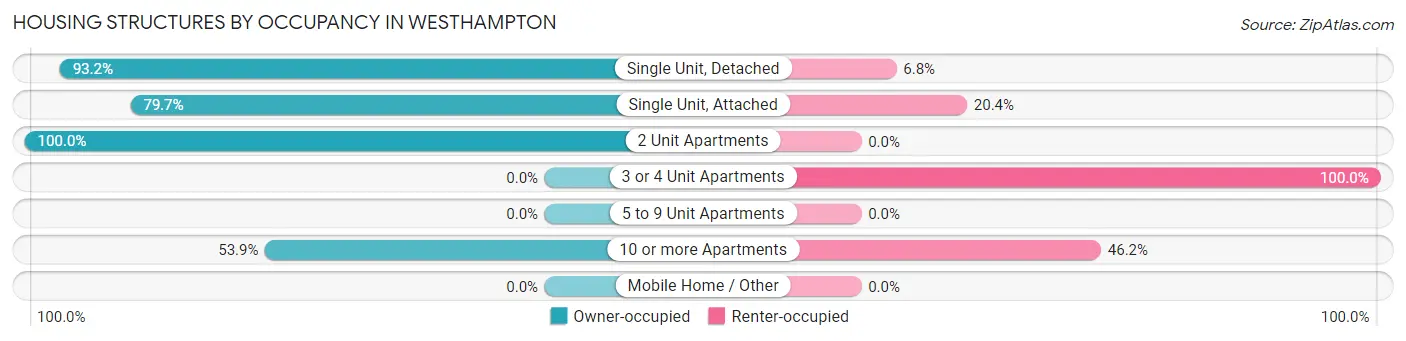
| Structure Type | Owner-occupied | Renter-occupied |
| Single Unit, Detached | 936 (93.2%) | 68 (6.8%) |
| Single Unit, Attached | 180 (79.6%) | 46 (20.3%) |
| 2 Unit Apartments | 23 (100.0%) | 0 (0.0%) |
| 3 or 4 Unit Apartments | 0 (0.0%) | 12 (100.0%) |
| 5 to 9 Unit Apartments | 0 (0.0%) | 0 (0.0%) |
| 10 or more Apartments | 7 (53.8%) | 6 (46.2%) |
| Mobile Home / Other | 0 (0.0%) | 0 (0.0%) |
| Total | 1,146 (89.7%) | 132 (10.3%) |
Housing Structures by Number of Rooms in Westhampton
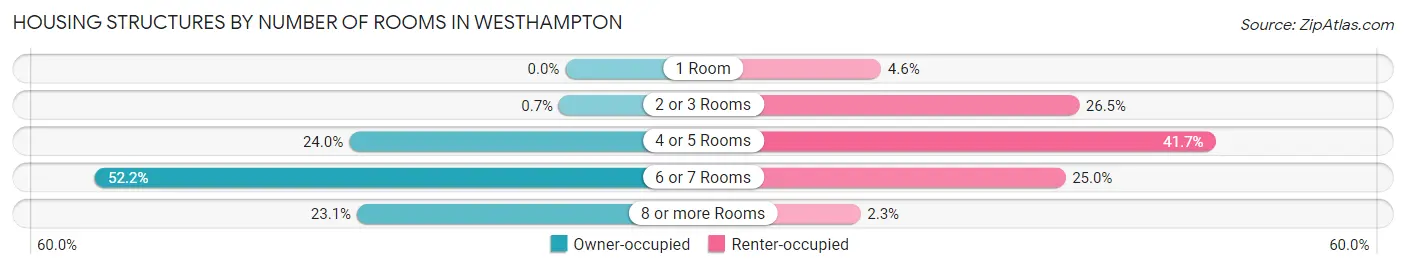
| Number of Rooms | Owner-occupied | Renter-occupied |
| 1 Room | 0 (0.0%) | 6 (4.5%) |
| 2 or 3 Rooms | 8 (0.7%) | 35 (26.5%) |
| 4 or 5 Rooms | 275 (24.0%) | 55 (41.7%) |
| 6 or 7 Rooms | 598 (52.2%) | 33 (25.0%) |
| 8 or more Rooms | 265 (23.1%) | 3 (2.3%) |
| Total | 1,146 (100.0%) | 132 (100.0%) |
Housing Structure by Heating Type in Westhampton
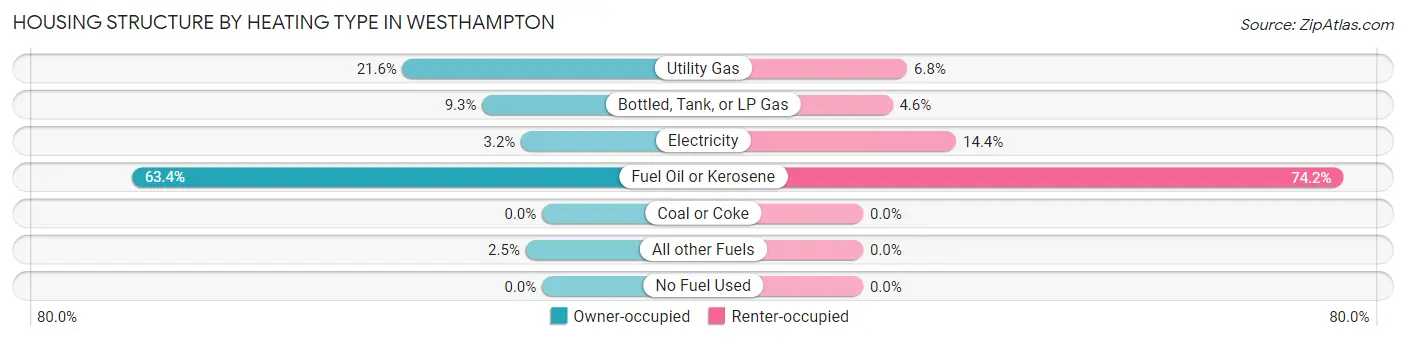
| Heating Type | Owner-occupied | Renter-occupied |
| Utility Gas | 247 (21.5%) | 9 (6.8%) |
| Bottled, Tank, or LP Gas | 106 (9.2%) | 6 (4.5%) |
| Electricity | 37 (3.2%) | 19 (14.4%) |
| Fuel Oil or Kerosene | 727 (63.4%) | 98 (74.2%) |
| Coal or Coke | 0 (0.0%) | 0 (0.0%) |
| All other Fuels | 29 (2.5%) | 0 (0.0%) |
| No Fuel Used | 0 (0.0%) | 0 (0.0%) |
| Total | 1,146 (100.0%) | 132 (100.0%) |
Household Vehicle Usage in Westhampton
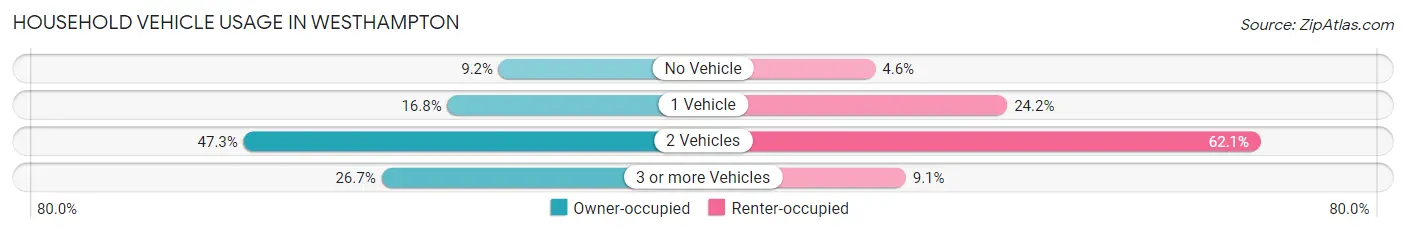
| Vehicles per Household | Owner-occupied | Renter-occupied |
| No Vehicle | 105 (9.2%) | 6 (4.5%) |
| 1 Vehicle | 193 (16.8%) | 32 (24.2%) |
| 2 Vehicles | 542 (47.3%) | 82 (62.1%) |
| 3 or more Vehicles | 306 (26.7%) | 12 (9.1%) |
| Total | 1,146 (100.0%) | 132 (100.0%) |
Real Estate & Mortgages in Westhampton
Real Estate and Mortgage Overview in Westhampton
| Characteristic | Without Mortgage | With Mortgage |
| Housing Units | 577 | 569 |
| Median Property Value | $848,600 | $951,300 |
| Median Household Income | $99,442 | $348 |
| Monthly Housing Costs | $1,232 | $408 |
| Real Estate Taxes | $5,466 | $8 |
Property Value by Mortgage Status in Westhampton
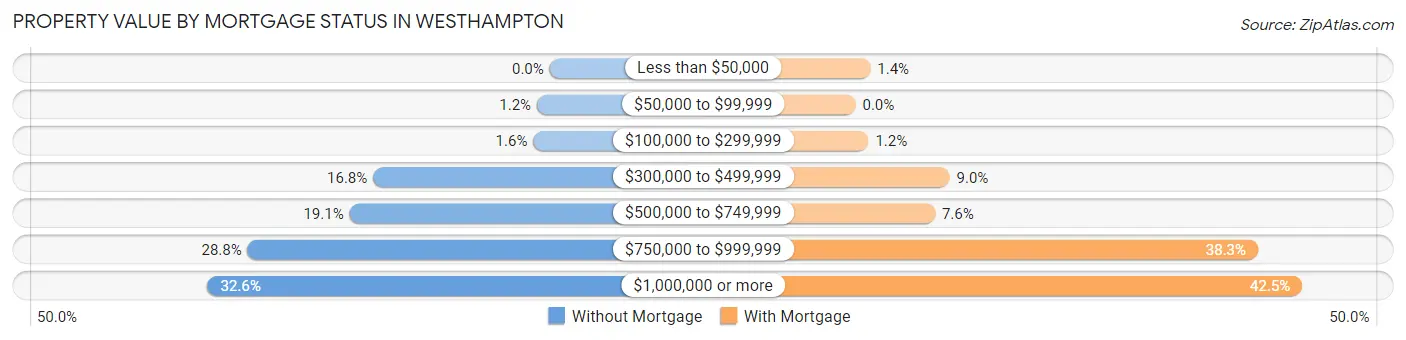
| Property Value | Without Mortgage | With Mortgage |
| Less than $50,000 | 0 (0.0%) | 8 (1.4%) |
| $50,000 to $99,999 | 7 (1.2%) | 0 (0.0%) |
| $100,000 to $299,999 | 9 (1.6%) | 7 (1.2%) |
| $300,000 to $499,999 | 97 (16.8%) | 51 (9.0%) |
| $500,000 to $749,999 | 110 (19.1%) | 43 (7.6%) |
| $750,000 to $999,999 | 166 (28.8%) | 218 (38.3%) |
| $1,000,000 or more | 188 (32.6%) | 242 (42.5%) |
| Total | 577 (100.0%) | 569 (100.0%) |
Household Income by Mortgage Status in Westhampton
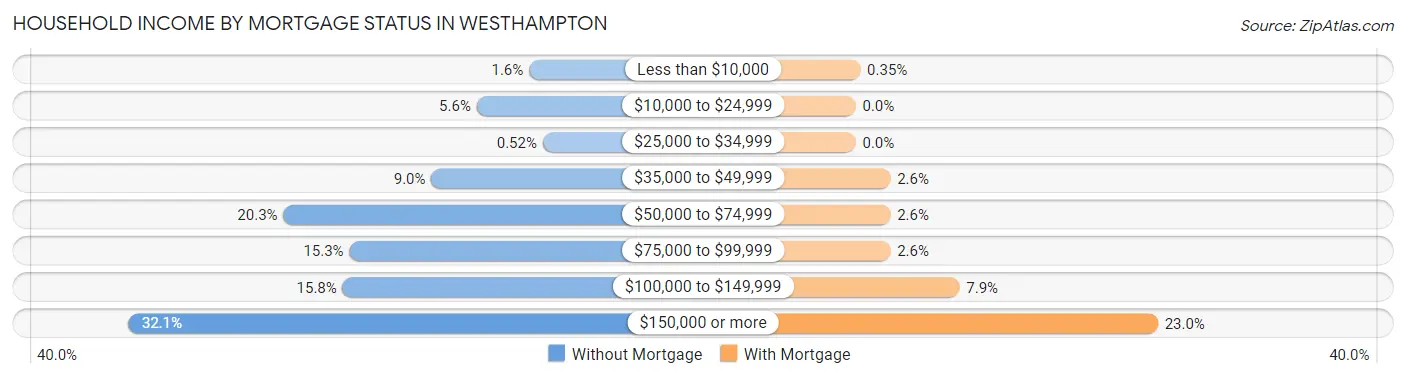
| Household Income | Without Mortgage | With Mortgage |
| Less than $10,000 | 9 (1.6%) | 2 (0.4%) |
| $10,000 to $24,999 | 32 (5.6%) | 0 (0.0%) |
| $25,000 to $34,999 | 3 (0.5%) | 0 (0.0%) |
| $35,000 to $49,999 | 52 (9.0%) | 15 (2.6%) |
| $50,000 to $74,999 | 117 (20.3%) | 15 (2.6%) |
| $75,000 to $99,999 | 88 (15.2%) | 15 (2.6%) |
| $100,000 to $149,999 | 91 (15.8%) | 45 (7.9%) |
| $150,000 or more | 185 (32.1%) | 131 (23.0%) |
| Total | 577 (100.0%) | 569 (100.0%) |
Property Value to Household Income Ratio in Westhampton
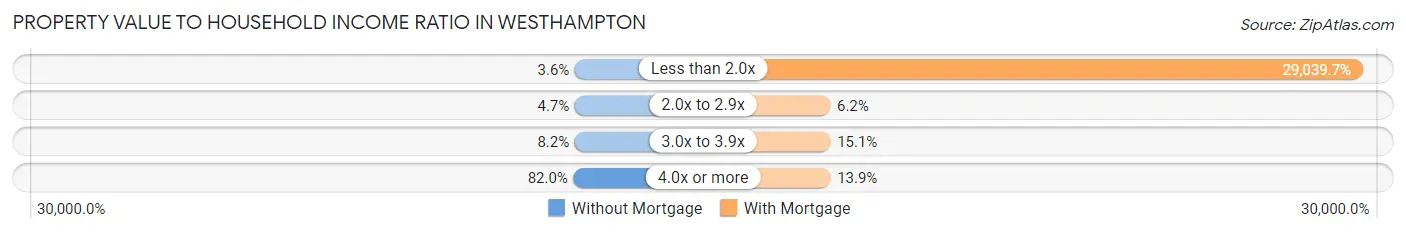
| Value-to-Income Ratio | Without Mortgage | With Mortgage |
| Less than 2.0x | 21 (3.6%) | 165,236 (29,039.7%) |
| 2.0x to 2.9x | 27 (4.7%) | 35 (6.1%) |
| 3.0x to 3.9x | 47 (8.2%) | 86 (15.1%) |
| 4.0x or more | 473 (82.0%) | 79 (13.9%) |
| Total | 577 (100.0%) | 569 (100.0%) |
Real Estate Taxes by Mortgage Status in Westhampton
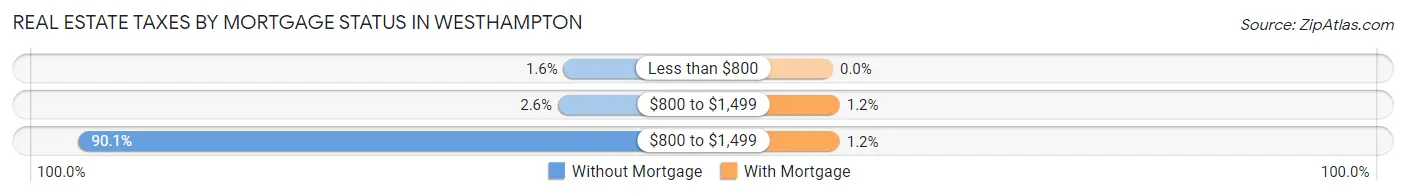
| Property Taxes | Without Mortgage | With Mortgage |
| Less than $800 | 9 (1.6%) | 0 (0.0%) |
| $800 to $1,499 | 15 (2.6%) | 7 (1.2%) |
| $800 to $1,499 | 520 (90.1%) | 7 (1.2%) |
| Total | 577 (100.0%) | 569 (100.0%) |
Health & Disability in Westhampton
Health Insurance Coverage by Age in Westhampton
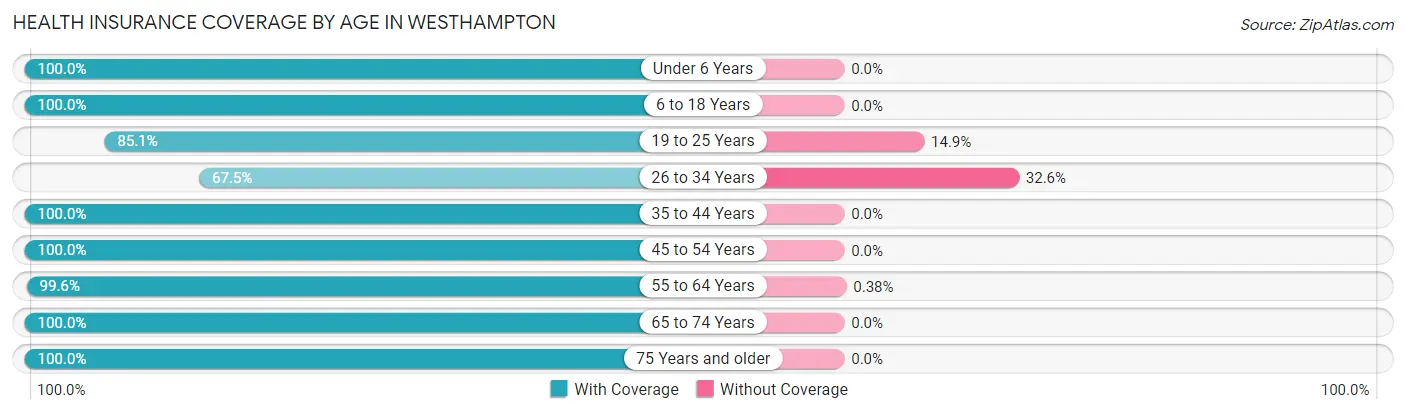
| Age Bracket | With Coverage | Without Coverage |
| Under 6 Years | 268 (100.0%) | 0 (0.0%) |
| 6 to 18 Years | 711 (100.0%) | 0 (0.0%) |
| 19 to 25 Years | 143 (85.1%) | 25 (14.9%) |
| 26 to 34 Years | 143 (67.4%) | 69 (32.6%) |
| 35 to 44 Years | 341 (100.0%) | 0 (0.0%) |
| 45 to 54 Years | 352 (100.0%) | 0 (0.0%) |
| 55 to 64 Years | 528 (99.6%) | 2 (0.4%) |
| 65 to 74 Years | 613 (100.0%) | 0 (0.0%) |
| 75 Years and older | 453 (100.0%) | 0 (0.0%) |
| Total | 3,552 (97.4%) | 96 (2.6%) |
Health Insurance Coverage by Citizenship Status in Westhampton
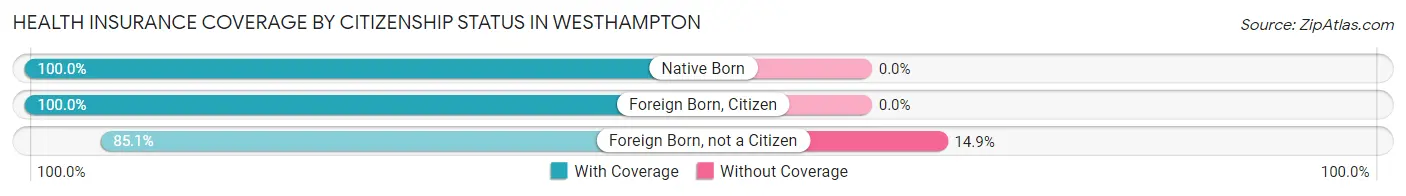
| Citizenship Status | With Coverage | Without Coverage |
| Native Born | 268 (100.0%) | 0 (0.0%) |
| Foreign Born, Citizen | 711 (100.0%) | 0 (0.0%) |
| Foreign Born, not a Citizen | 143 (85.1%) | 25 (14.9%) |
Health Insurance Coverage by Household Income in Westhampton
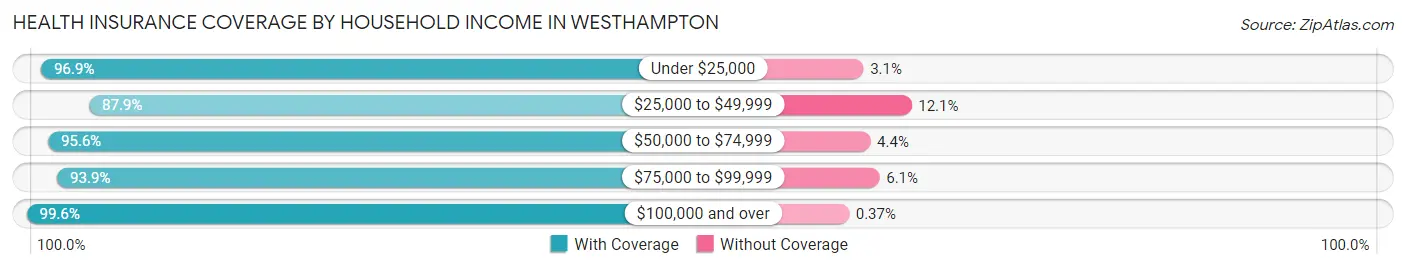
| Household Income | With Coverage | Without Coverage |
| Under $25,000 | 63 (96.9%) | 2 (3.1%) |
| $25,000 to $49,999 | 364 (87.9%) | 50 (12.1%) |
| $50,000 to $74,999 | 306 (95.6%) | 14 (4.4%) |
| $75,000 to $99,999 | 324 (93.9%) | 21 (6.1%) |
| $100,000 and over | 2,447 (99.6%) | 9 (0.4%) |
Public vs Private Health Insurance Coverage by Age in Westhampton
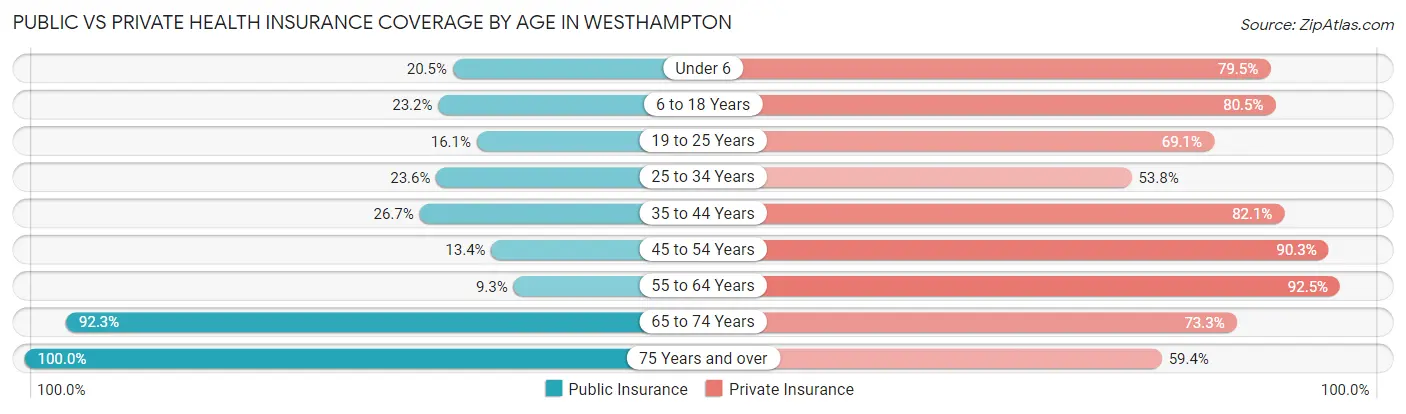
| Age Bracket | Public Insurance | Private Insurance |
| Under 6 | 55 (20.5%) | 213 (79.5%) |
| 6 to 18 Years | 165 (23.2%) | 572 (80.4%) |
| 19 to 25 Years | 27 (16.1%) | 116 (69.1%) |
| 25 to 34 Years | 50 (23.6%) | 114 (53.8%) |
| 35 to 44 Years | 91 (26.7%) | 280 (82.1%) |
| 45 to 54 Years | 47 (13.4%) | 318 (90.3%) |
| 55 to 64 Years | 49 (9.2%) | 490 (92.4%) |
| 65 to 74 Years | 566 (92.3%) | 449 (73.3%) |
| 75 Years and over | 453 (100.0%) | 269 (59.4%) |
| Total | 1,503 (41.2%) | 2,821 (77.3%) |
Disability Status by Sex by Age in Westhampton
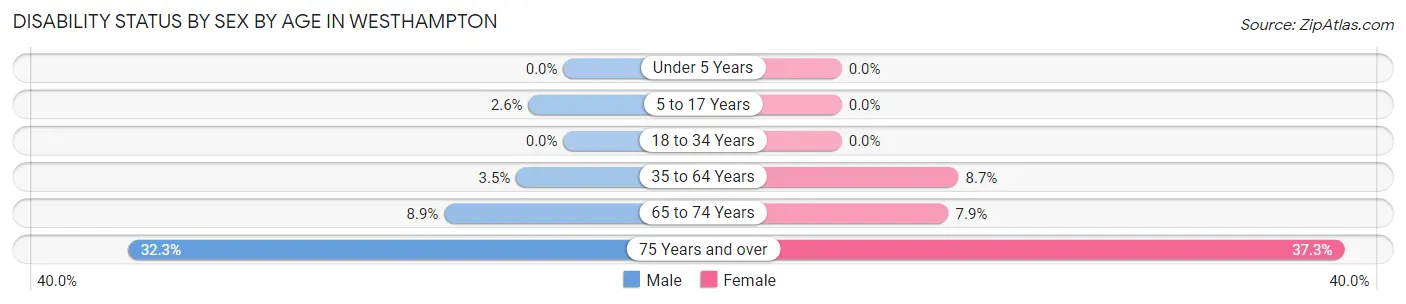
| Age Bracket | Male | Female |
| Under 5 Years | 0 (0.0%) | 0 (0.0%) |
| 5 to 17 Years | 8 (2.6%) | 0 (0.0%) |
| 18 to 34 Years | 0 (0.0%) | 0 (0.0%) |
| 35 to 64 Years | 21 (3.5%) | 54 (8.7%) |
| 65 to 74 Years | 23 (8.8%) | 28 (7.9%) |
| 75 Years and over | 65 (32.3%) | 94 (37.3%) |
Disability Class by Sex by Age in Westhampton
Disability Class: Hearing Difficulty
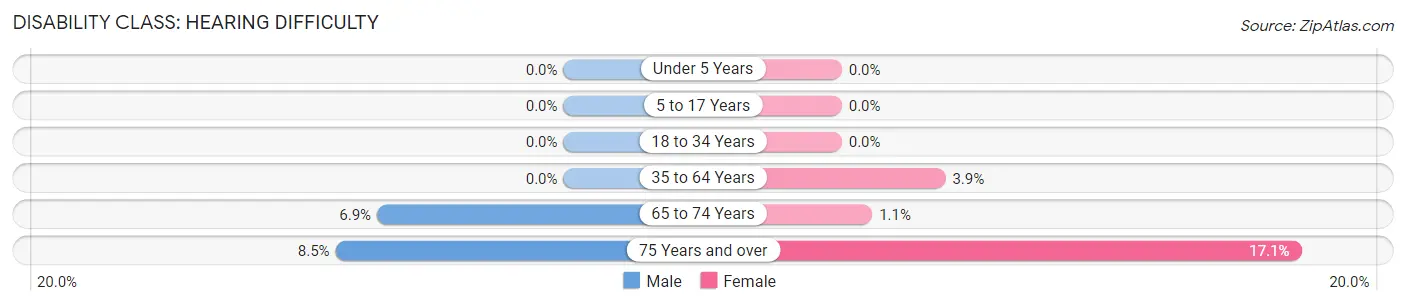
| Age Bracket | Male | Female |
| Under 5 Years | 0 (0.0%) | 0 (0.0%) |
| 5 to 17 Years | 0 (0.0%) | 0 (0.0%) |
| 18 to 34 Years | 0 (0.0%) | 0 (0.0%) |
| 35 to 64 Years | 0 (0.0%) | 24 (3.8%) |
| 65 to 74 Years | 18 (6.9%) | 4 (1.1%) |
| 75 Years and over | 17 (8.5%) | 43 (17.1%) |
Disability Class: Vision Difficulty
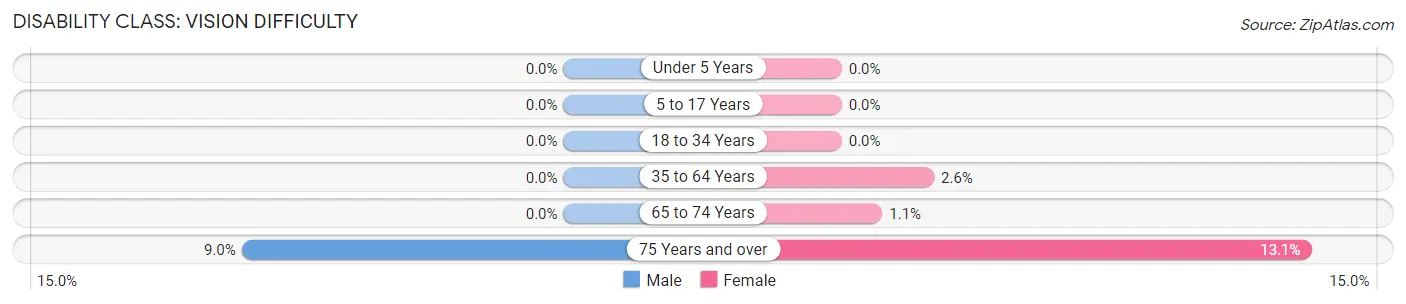
| Age Bracket | Male | Female |
| Under 5 Years | 0 (0.0%) | 0 (0.0%) |
| 5 to 17 Years | 0 (0.0%) | 0 (0.0%) |
| 18 to 34 Years | 0 (0.0%) | 0 (0.0%) |
| 35 to 64 Years | 0 (0.0%) | 16 (2.6%) |
| 65 to 74 Years | 0 (0.0%) | 4 (1.1%) |
| 75 Years and over | 18 (9.0%) | 33 (13.1%) |
Disability Class: Cognitive Difficulty
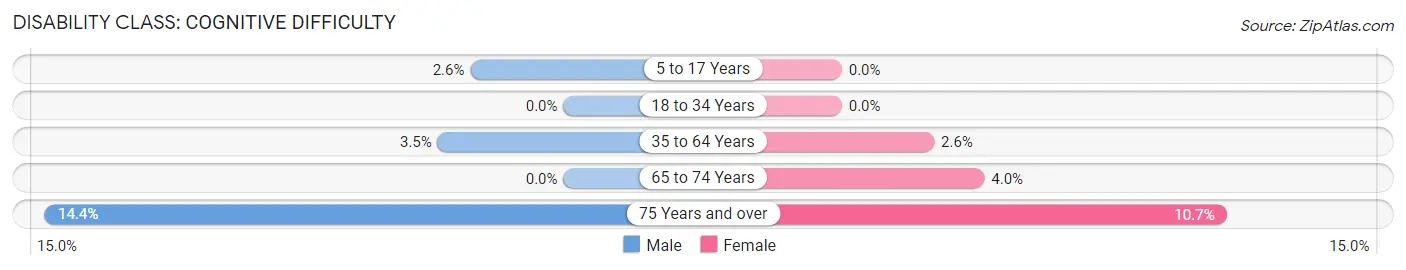
| Age Bracket | Male | Female |
| 5 to 17 Years | 8 (2.6%) | 0 (0.0%) |
| 18 to 34 Years | 0 (0.0%) | 0 (0.0%) |
| 35 to 64 Years | 21 (3.5%) | 16 (2.6%) |
| 65 to 74 Years | 0 (0.0%) | 14 (4.0%) |
| 75 Years and over | 29 (14.4%) | 27 (10.7%) |
Disability Class: Ambulatory Difficulty

| Age Bracket | Male | Female |
| 5 to 17 Years | 0 (0.0%) | 0 (0.0%) |
| 18 to 34 Years | 0 (0.0%) | 0 (0.0%) |
| 35 to 64 Years | 0 (0.0%) | 13 (2.1%) |
| 65 to 74 Years | 5 (1.9%) | 18 (5.1%) |
| 75 Years and over | 35 (17.4%) | 73 (29.0%) |
Disability Class: Self-Care Difficulty
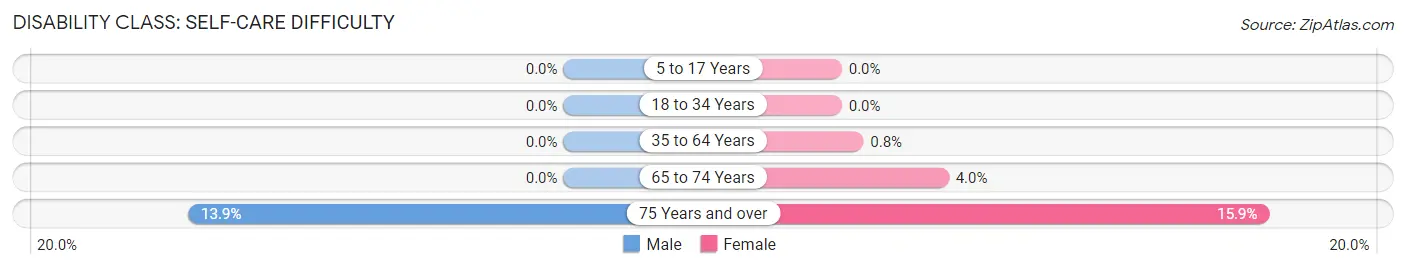
| Age Bracket | Male | Female |
| 5 to 17 Years | 0 (0.0%) | 0 (0.0%) |
| 18 to 34 Years | 0 (0.0%) | 0 (0.0%) |
| 35 to 64 Years | 0 (0.0%) | 5 (0.8%) |
| 65 to 74 Years | 0 (0.0%) | 14 (4.0%) |
| 75 Years and over | 28 (13.9%) | 40 (15.9%) |
Technology Access in Westhampton
Computing Device Access in Westhampton
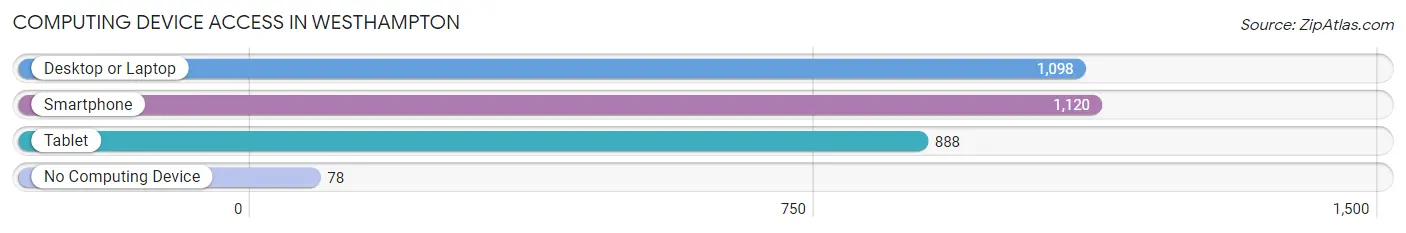
| Device Type | # Households | % Households |
| Desktop or Laptop | 1,098 | 85.9% |
| Smartphone | 1,120 | 87.6% |
| Tablet | 888 | 69.5% |
| No Computing Device | 78 | 6.1% |
| Total | 1,278 | 100.0% |
Internet Access in Westhampton

| Internet Type | # Households | % Households |
| Dial-Up Internet | 0 | 0.0% |
| Broadband Home | 1,050 | 82.2% |
| Cellular Data Only | 107 | 8.4% |
| Satellite Internet | 73 | 5.7% |
| No Internet | 95 | 7.4% |
| Total | 1,278 | 100.0% |
Westhampton Summary
History
Westhampton, New York is a small hamlet located in the Town of Southampton in Suffolk County, New York. It is located on the South Fork of Long Island, approximately 90 miles east of New York City. The hamlet was first settled in 1649 by English settlers from Lynn, Massachusetts. The settlers named the area West Hampton, after their hometown in England. The hamlet was officially incorporated in 1793.
Westhampton has a rich history of farming and fishing. In the late 19th century, the area was known for its potato farming. The potato industry was so successful that the hamlet was known as the “Potato Capital of the World”. In the early 20th century, the area was known for its fishing industry. The hamlet was home to several fish canneries and processing plants.
In the late 20th century, Westhampton began to transition from a rural farming and fishing community to a more suburban area. The hamlet has become a popular summer destination for tourists and second-home owners. The area is known for its beautiful beaches, golf courses, and other recreational activities.
Geography
Westhampton is located on the South Fork of Long Island, approximately 90 miles east of New York City. The hamlet is bordered by the Atlantic Ocean to the south, the Shinnecock Bay to the west, and the Peconic Bay to the east. The hamlet is located in the Town of Southampton, which is part of Suffolk County.
The hamlet has a total area of 4.2 square miles, of which 0.2 square miles is water. The terrain is mostly flat, with some rolling hills. The highest point in the hamlet is located at the intersection of Old Country Road and Montauk Highway, which is approximately 80 feet above sea level.
Economy
Westhampton’s economy is largely driven by tourism and second-home ownership. The hamlet is a popular summer destination for tourists and second-home owners. The area is known for its beautiful beaches, golf courses, and other recreational activities.
The hamlet is also home to several small businesses, including restaurants, retail stores, and professional services. The hamlet is also home to several large employers, including the Westhampton Beach Performing Arts Center, the Westhampton Beach Country Club, and the Westhampton Beach Yacht Club.
Demographics
As of the 2010 census, Westhampton had a population of 1,721. The population is predominantly white (94.2%), with small percentages of African American (2.2%), Asian (1.3%), and Hispanic (1.3%) residents. The median household income is $87,813, and the median home value is $717,500. The hamlet has a high rate of homeownership (83.3%).
Conclusion
Westhampton, New York is a small hamlet located in the Town of Southampton in Suffolk County, New York. It is located on the South Fork of Long Island, approximately 90 miles east of New York City. The hamlet was first settled in 1649 by English settlers from Lynn, Massachusetts. The hamlet has a rich history of farming and fishing, and in the late 20th century, it began to transition from a rural farming and fishing community to a more suburban area. The hamlet is now a popular summer destination for tourists and second-home owners. The economy is largely driven by tourism and second-home ownership, and the hamlet is home to several small businesses, including restaurants, retail stores, and professional services. As of the 2010 census, Westhampton had a population of 1,721, with a median household income of $87,813 and a median home value of $717,500.
Common Questions
What is Per Capita Income in Westhampton?
Per Capita income in Westhampton is $64,561.
What is the Median Family Income in Westhampton?
Median Family Income in Westhampton is $156,964.
What is the Median Household income in Westhampton?
Median Household Income in Westhampton is $131,354.
What is Income or Wage Gap in Westhampton?
Income or Wage Gap in Westhampton is 17.1%.
Women in Westhampton earn 82.9 cents for every dollar earned by a man.
What is Inequality or Gini Index in Westhampton?
Inequality or Gini Index in Westhampton is 0.47.
What is the Total Population of Westhampton?
Total Population of Westhampton is 3,769.
What is the Total Male Population of Westhampton?
Total Male Population of Westhampton is 1,775.
What is the Total Female Population of Westhampton?
Total Female Population of Westhampton is 1,994.
What is the Ratio of Males per 100 Females in Westhampton?
There are 89.02 Males per 100 Females in Westhampton.
What is the Ratio of Females per 100 Males in Westhampton?
There are 112.34 Females per 100 Males in Westhampton.
What is the Median Population Age in Westhampton?
Median Population Age in Westhampton is 48.7 Years.
What is the Average Family Size in Westhampton
Average Family Size in Westhampton is 3.2 People.
What is the Average Household Size in Westhampton
Average Household Size in Westhampton is 2.8 People.
How Large is the Labor Force in Westhampton?
There are 1,575 People in the Labor Forcein in Westhampton.
What is the Percentage of People in the Labor Force in Westhampton?
52.8% of People are in the Labor Force in Westhampton.
What is the Unemployment Rate in Westhampton?
Unemployment Rate in Westhampton is 4.3%.