Peconic, NY Map & Demographics
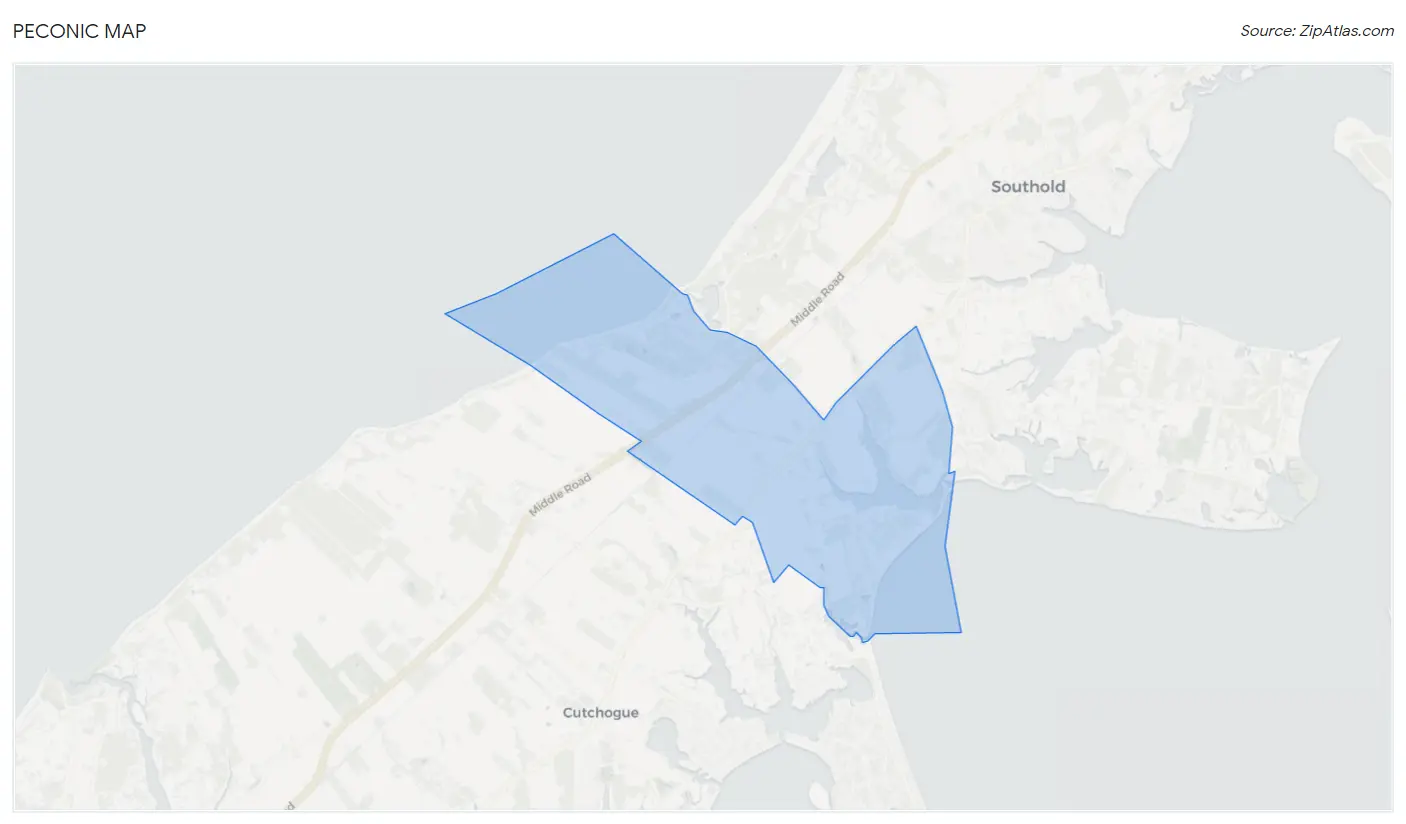
Peconic Map
Peconic Overview
$39,468
PER CAPITA INCOME
$104,934
AVG FAMILY INCOME
$67,125
AVG HOUSEHOLD INCOME
52.4%
WAGE / INCOME GAP [ % ]
47.6¢/ $1
WAGE / INCOME GAP [ $ ]
0.38
INEQUALITY / GINI INDEX
793
TOTAL POPULATION
331
MALE POPULATION
462
FEMALE POPULATION
71.65
MALES / 100 FEMALES
139.58
FEMALES / 100 MALES
37.7
MEDIAN AGE
3.5
AVG FAMILY SIZE
2.4
AVG HOUSEHOLD SIZE
314
LABOR FORCE [ PEOPLE ]
51.6%
PERCENT IN LABOR FORCE
Peconic Zip Codes
Peconic Area Codes
Income in Peconic
Income Overview in Peconic
Per Capita Income in Peconic is $39,468, while median incomes of families and households are $104,934 and $67,125 respectively.
| Characteristic | Number | Measure |
| Per Capita Income | 793 | $39,468 |
| Median Family Income | 183 | $104,934 |
| Mean Family Income | 183 | $110,095 |
| Median Household Income | 330 | $67,125 |
| Mean Household Income | 330 | $91,740 |
| Income Deficit | 183 | $0 |
| Wage / Income Gap (%) | 793 | 52.40% |
| Wage / Income Gap ($) | 793 | 47.60¢ per $1 |
| Gini / Inequality Index | 793 | 0.38 |
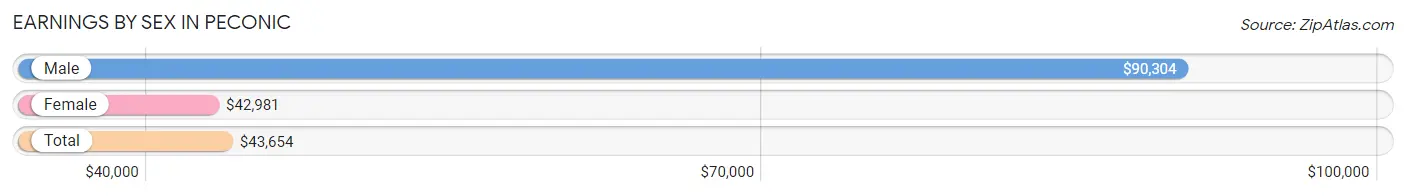
Earnings by Sex in Peconic
Average Earnings in Peconic are $43,654, $90,304 for men and $42,981 for women, a difference of 52.4%.
| Sex | Number | Average Earnings |
| Male | 173 (42.6%) | $90,304 |
| Female | 233 (57.4%) | $42,981 |
| Total | 406 (100.0%) | $43,654 |
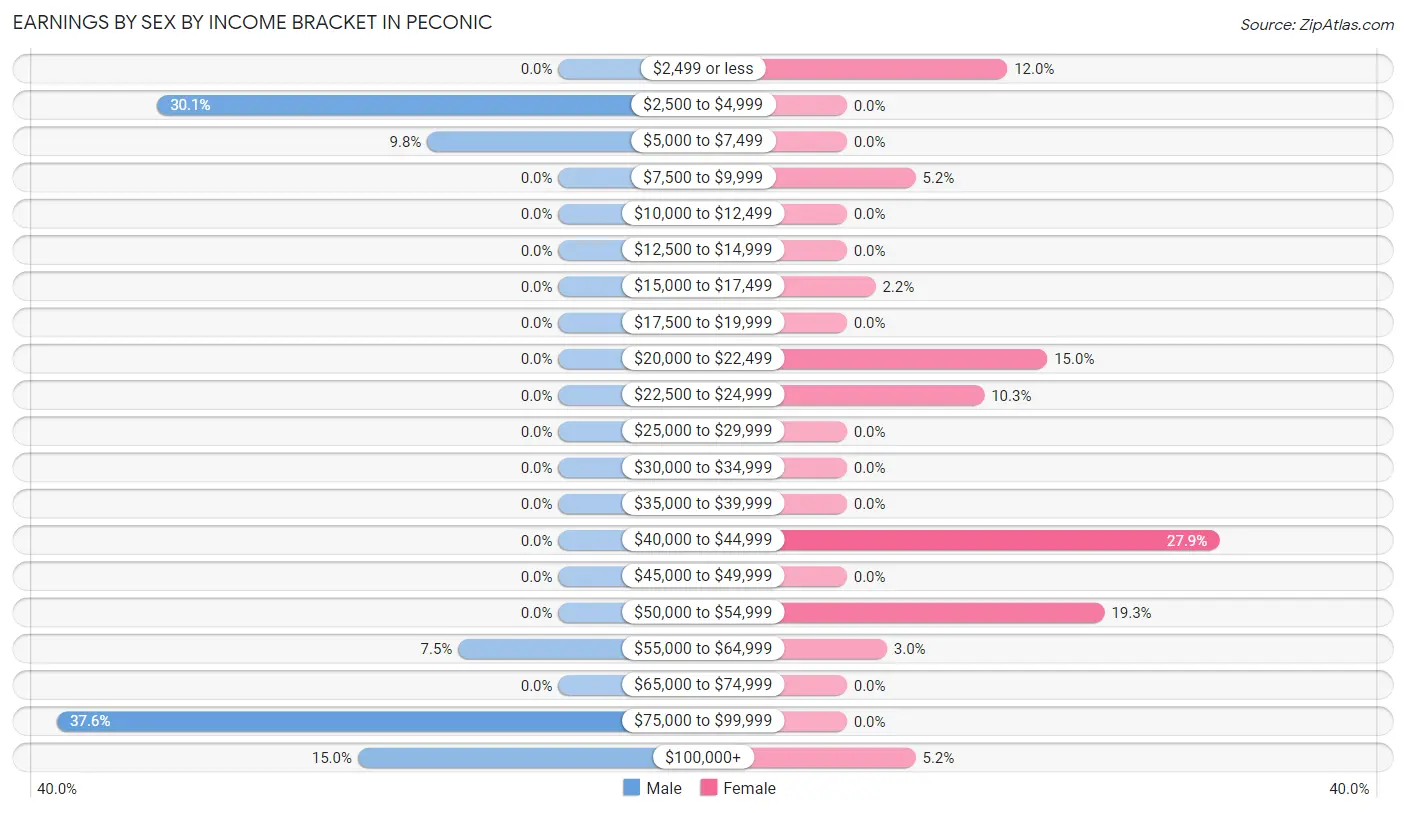
Earnings by Sex by Income Bracket in Peconic
The most common earnings brackets in Peconic are $75,000 to $99,999 for men (65 | 37.6%) and $40,000 to $44,999 for women (65 | 27.9%).
| Income | Male | Female |
| $2,499 or less | 0 (0.0%) | 28 (12.0%) |
| $2,500 to $4,999 | 52 (30.1%) | 0 (0.0%) |
| $5,000 to $7,499 | 17 (9.8%) | 0 (0.0%) |
| $7,500 to $9,999 | 0 (0.0%) | 12 (5.1%) |
| $10,000 to $12,499 | 0 (0.0%) | 0 (0.0%) |
| $12,500 to $14,999 | 0 (0.0%) | 0 (0.0%) |
| $15,000 to $17,499 | 0 (0.0%) | 5 (2.1%) |
| $17,500 to $19,999 | 0 (0.0%) | 0 (0.0%) |
| $20,000 to $22,499 | 0 (0.0%) | 35 (15.0%) |
| $22,500 to $24,999 | 0 (0.0%) | 24 (10.3%) |
| $25,000 to $29,999 | 0 (0.0%) | 0 (0.0%) |
| $30,000 to $34,999 | 0 (0.0%) | 0 (0.0%) |
| $35,000 to $39,999 | 0 (0.0%) | 0 (0.0%) |
| $40,000 to $44,999 | 0 (0.0%) | 65 (27.9%) |
| $45,000 to $49,999 | 0 (0.0%) | 0 (0.0%) |
| $50,000 to $54,999 | 0 (0.0%) | 45 (19.3%) |
| $55,000 to $64,999 | 13 (7.5%) | 7 (3.0%) |
| $65,000 to $74,999 | 0 (0.0%) | 0 (0.0%) |
| $75,000 to $99,999 | 65 (37.6%) | 0 (0.0%) |
| $100,000+ | 26 (15.0%) | 12 (5.1%) |
| Total | 173 (100.0%) | 233 (100.0%) |
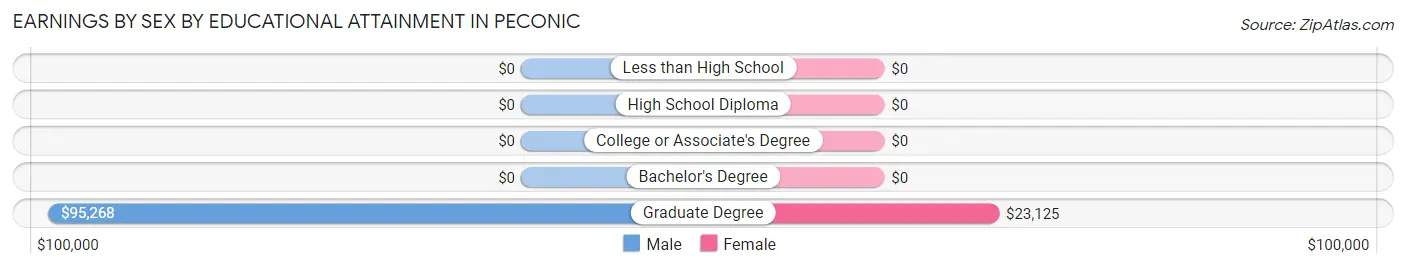
Earnings by Sex by Educational Attainment in Peconic
Average earnings in Peconic are $90,304 for men and $43,519 for women, a difference of 51.8%. Men with an educational attainment of graduate degree enjoy the highest average annual earnings of $95,268, while those with graduate degree education earn the least with $95,268. Women with an educational attainment of graduate degree earn the most with the average annual earnings of $23,125, while those with graduate degree education have the smallest earnings of $23,125.
| Educational Attainment | Male Income | Female Income |
| Less than High School | - | - |
| High School Diploma | - | - |
| College or Associate's Degree | - | - |
| Bachelor's Degree | - | - |
| Graduate Degree | $95,268 | $23,125 |
| Total | $90,304 | $43,519 |
Family Income in Peconic
Family Income Brackets in Peconic
According to the Peconic family income data, there are 87 families falling into the $100,000 to $149,999 income range, which is the most common income bracket and makes up 47.5% of all families.
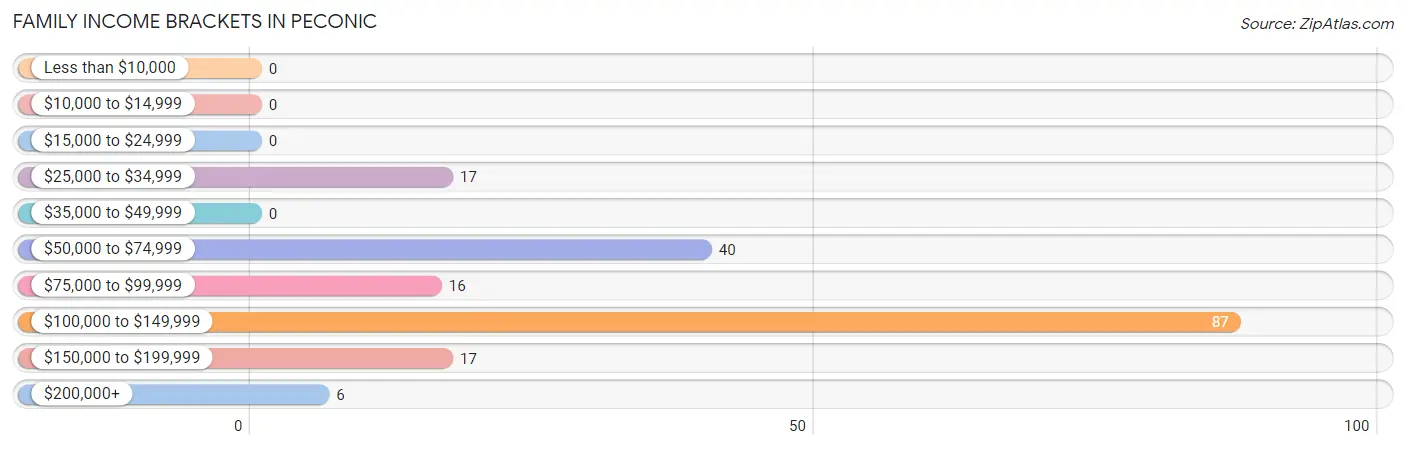
| Income Bracket | # Families | % Families |
| Less than $10,000 | 0 | 0.0% |
| $10,000 to $14,999 | 0 | 0.0% |
| $15,000 to $24,999 | 0 | 0.0% |
| $25,000 to $34,999 | 17 | 9.3% |
| $35,000 to $49,999 | 0 | 0.0% |
| $50,000 to $74,999 | 40 | 21.9% |
| $75,000 to $99,999 | 16 | 8.7% |
| $100,000 to $149,999 | 87 | 47.5% |
| $150,000 to $199,999 | 17 | 9.3% |
| $200,000+ | 6 | 3.3% |
Family Income by Famaliy Size in Peconic
2-person families (68 | 37.2%) account for the highest median family income in Peconic with $102,632 per family, while 2-person families (68 | 37.2%) have the highest median income of $51,316 per family member.
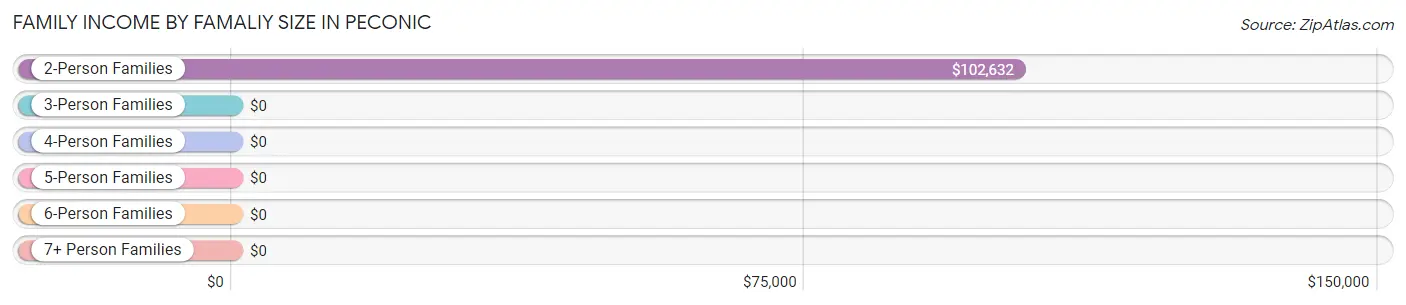
| Income Bracket | # Families | Median Income |
| 2-Person Families | 68 (37.2%) | $102,632 |
| 3-Person Families | 40 (21.9%) | $0 |
| 4-Person Families | 47 (25.7%) | $0 |
| 5-Person Families | 0 (0.0%) | $0 |
| 6-Person Families | 28 (15.3%) | $0 |
| 7+ Person Families | 0 (0.0%) | $0 |
| Total | 183 (100.0%) | $104,934 |
Family Income by Number of Earners in Peconic
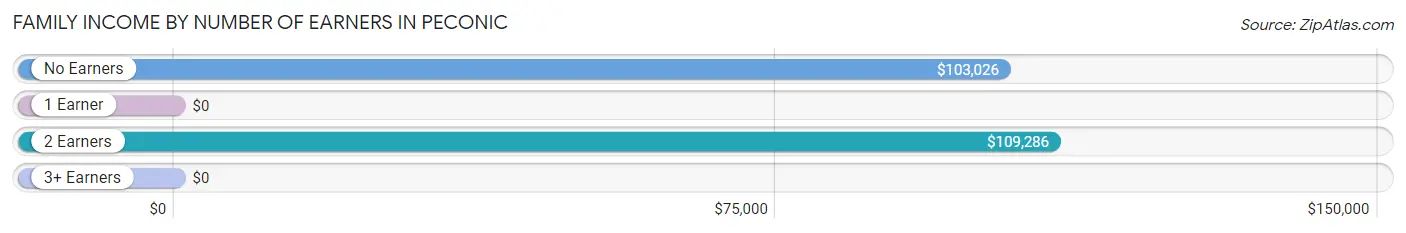
| Number of Earners | # Families | Median Income |
| No Earners | 40 (21.9%) | $103,026 |
| 1 Earner | 23 (12.6%) | $0 |
| 2 Earners | 120 (65.6%) | $109,286 |
| 3+ Earners | 0 (0.0%) | $0 |
| Total | 183 (100.0%) | $104,934 |
Household Income in Peconic
Household Income Brackets in Peconic
With 95 households falling in the category, the $100,000 to $149,999 income range is the most frequent in Peconic, accounting for 28.8% of all households.
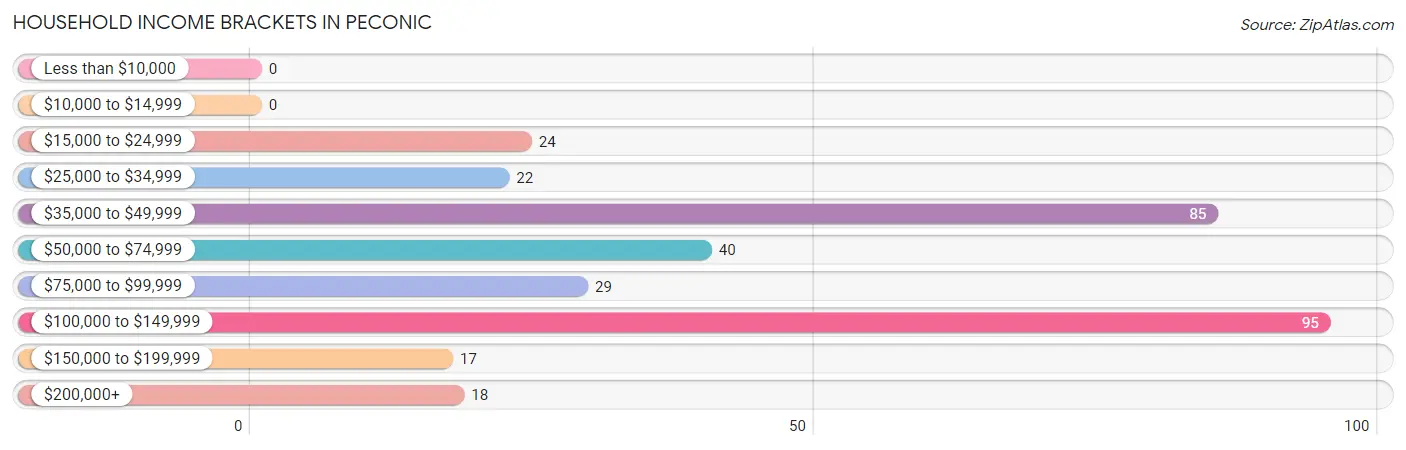
| Income Bracket | # Households | % Households |
| Less than $10,000 | 0 | 0.0% |
| $10,000 to $14,999 | 0 | 0.0% |
| $15,000 to $24,999 | 24 | 7.3% |
| $25,000 to $34,999 | 22 | 6.7% |
| $35,000 to $49,999 | 85 | 25.8% |
| $50,000 to $74,999 | 40 | 12.1% |
| $75,000 to $99,999 | 29 | 8.8% |
| $100,000 to $149,999 | 95 | 28.8% |
| $150,000 to $199,999 | 17 | 5.2% |
| $200,000+ | 18 | 5.5% |
Household Income by Householder Age in Peconic
The median household income in Peconic is $67,125, with the highest median household income of $173,000 found in the 45 to 64 years age bracket for the primary householder. A total of 58 households (17.6%) fall into this category.
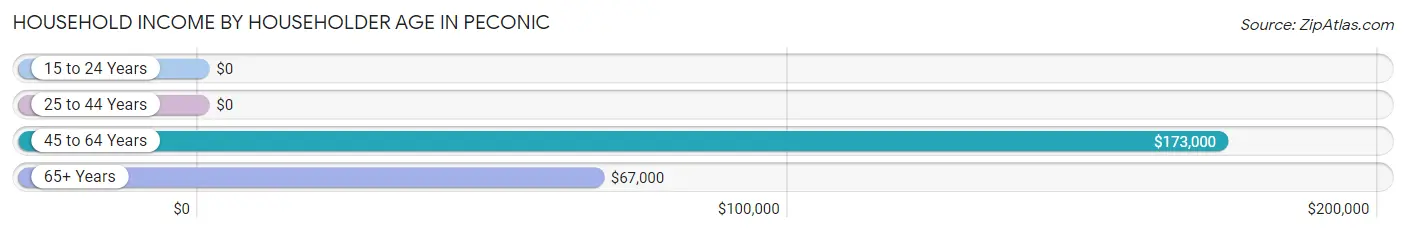
| Income Bracket | # Households | Median Income |
| 15 to 24 Years | 0 (0.0%) | $0 |
| 25 to 44 Years | 124 (37.6%) | $0 |
| 45 to 64 Years | 58 (17.6%) | $173,000 |
| 65+ Years | 148 (44.9%) | $67,000 |
| Total | 330 (100.0%) | $67,125 |
Poverty in Peconic
Income Below Poverty by Sex and Age in Peconic
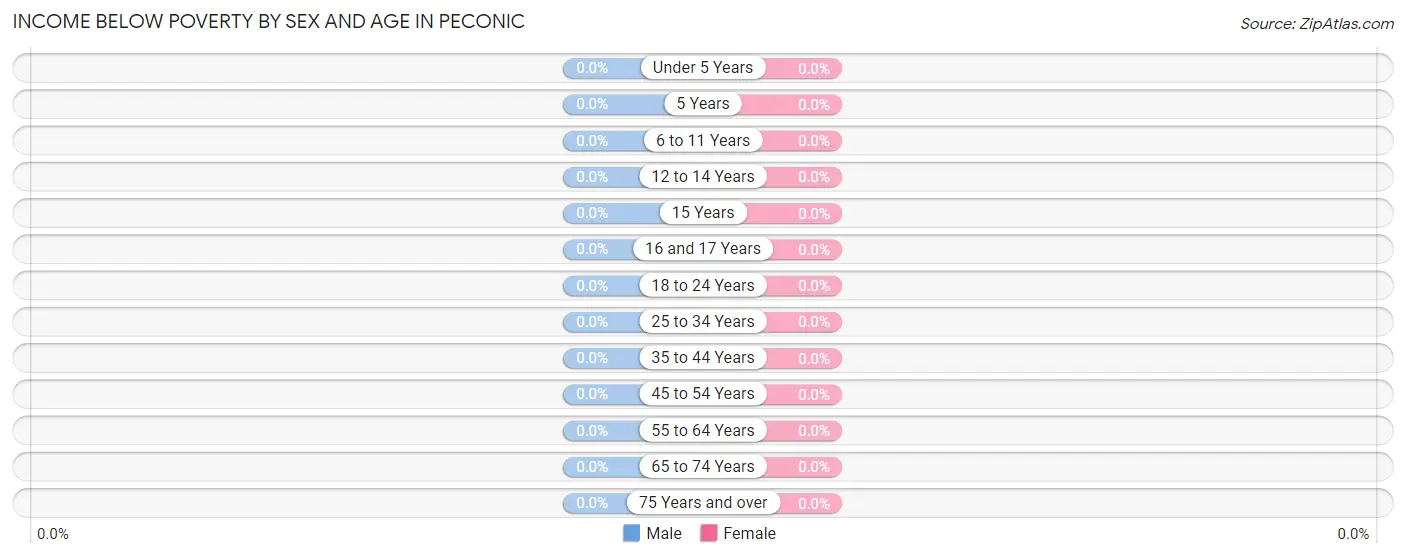
| Age Bracket | Male | Female |
| Under 5 Years | 0 (0.0%) | 0 (0.0%) |
| 5 Years | 0 (0.0%) | 0 (0.0%) |
| 6 to 11 Years | 0 (0.0%) | 0 (0.0%) |
| 12 to 14 Years | 0 (0.0%) | 0 (0.0%) |
| 15 Years | 0 (0.0%) | 0 (0.0%) |
| 16 and 17 Years | 0 (0.0%) | 0 (0.0%) |
| 18 to 24 Years | 0 (0.0%) | 0 (0.0%) |
| 25 to 34 Years | 0 (0.0%) | 0 (0.0%) |
| 35 to 44 Years | 0 (0.0%) | 0 (0.0%) |
| 45 to 54 Years | 0 (0.0%) | 0 (0.0%) |
| 55 to 64 Years | 0 (0.0%) | 0 (0.0%) |
| 65 to 74 Years | 0 (0.0%) | 0 (0.0%) |
| 75 Years and over | 0 (0.0%) | 0 (0.0%) |
| Total | 0 (0.0%) | 0 (0.0%) |
Income Above Poverty by Sex and Age in Peconic
According to the poverty statistics in Peconic, males aged 5 years and females aged under 5 years are the age groups that are most secure financially, with 100.0% of males and 100.0% of females in these age groups living above the poverty line.
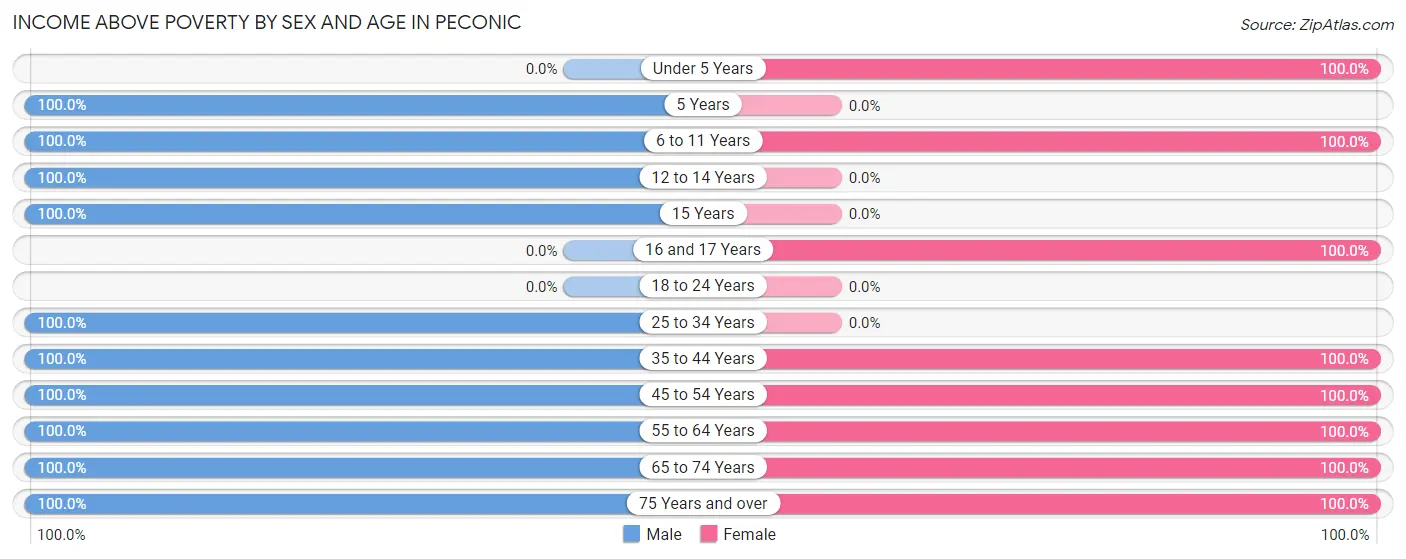
| Age Bracket | Male | Female |
| Under 5 Years | 0 (0.0%) | 38 (100.0%) |
| 5 Years | 38 (100.0%) | 0 (0.0%) |
| 6 to 11 Years | 16 (100.0%) | 42 (100.0%) |
| 12 to 14 Years | 25 (100.0%) | 0 (0.0%) |
| 15 Years | 26 (100.0%) | 0 (0.0%) |
| 16 and 17 Years | 0 (0.0%) | 28 (100.0%) |
| 18 to 24 Years | 0 (0.0%) | 0 (0.0%) |
| 25 to 34 Years | 52 (100.0%) | 0 (0.0%) |
| 35 to 44 Years | 37 (100.0%) | 124 (100.0%) |
| 45 to 54 Years | 43 (100.0%) | 38 (100.0%) |
| 55 to 64 Years | 11 (100.0%) | 70 (100.0%) |
| 65 to 74 Years | 59 (100.0%) | 35 (100.0%) |
| 75 Years and over | 24 (100.0%) | 87 (100.0%) |
| Total | 331 (100.0%) | 462 (100.0%) |
Income Below Poverty Among Married-Couple Families in Peconic
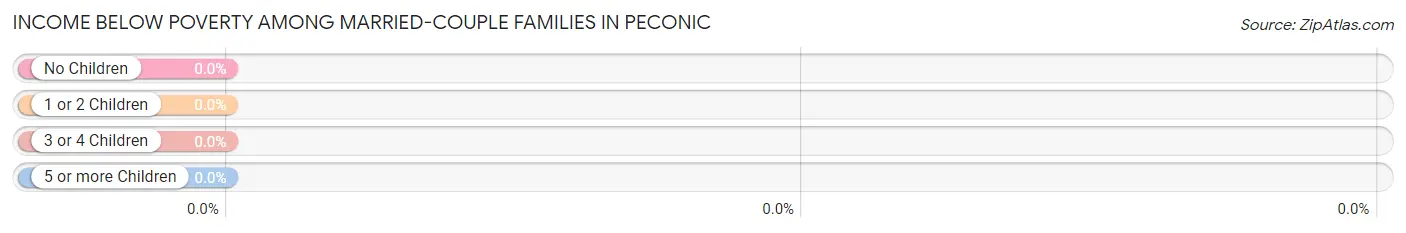
| Children | Above Poverty | Below Poverty |
| No Children | 68 (100.0%) | 0 (0.0%) |
| 1 or 2 Children | 47 (100.0%) | 0 (0.0%) |
| 3 or 4 Children | 28 (100.0%) | 0 (0.0%) |
| 5 or more Children | 0 (0.0%) | 0 (0.0%) |
| Total | 143 (100.0%) | 0 (0.0%) |
Income Below Poverty Among Single-Parent Households in Peconic
| Children | Single Father | Single Mother |
| No Children | 0 (0.0%) | 0 (0.0%) |
| 1 or 2 Children | 0 (0.0%) | 0 (0.0%) |
| 3 or 4 Children | 0 (0.0%) | 0 (0.0%) |
| 5 or more Children | 0 (0.0%) | 0 (0.0%) |
| Total | 0 (0.0%) | 0 (0.0%) |
Income Below Poverty Among Married-Couple vs Single-Parent Households in Peconic
| Children | Married-Couple Families | Single-Parent Households |
| No Children | 0 (0.0%) | 0 (0.0%) |
| 1 or 2 Children | 0 (0.0%) | 0 (0.0%) |
| 3 or 4 Children | 0 (0.0%) | 0 (0.0%) |
| 5 or more Children | 0 (0.0%) | 0 (0.0%) |
| Total | 0 (0.0%) | 0 (0.0%) |
Race in Peconic
The most populous races in Peconic are White / Caucasian (778 | 98.1%), Hispanic or Latino (53 | 6.7%), and Two or more Races (15 | 1.9%).
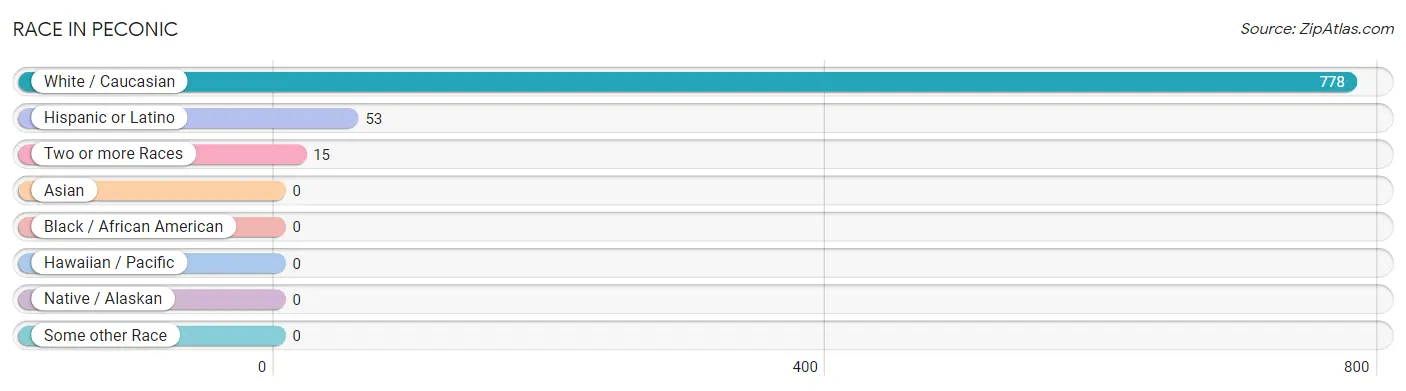
| Race | # Population | % Population |
| Asian | 0 | 0.0% |
| Black / African American | 0 | 0.0% |
| Hawaiian / Pacific | 0 | 0.0% |
| Hispanic or Latino | 53 | 6.7% |
| Native / Alaskan | 0 | 0.0% |
| White / Caucasian | 778 | 98.1% |
| Two or more Races | 15 | 1.9% |
| Some other Race | 0 | 0.0% |
| Total | 793 | 100.0% |
Ancestry in Peconic
The most populous ancestries reported in Peconic are Irish (445 | 56.1%), Italian (365 | 46.0%), American (64 | 8.1%), Spaniard (53 | 6.7%), and Swedish (52 | 6.6%), together accounting for 123.5% of all Peconic residents.
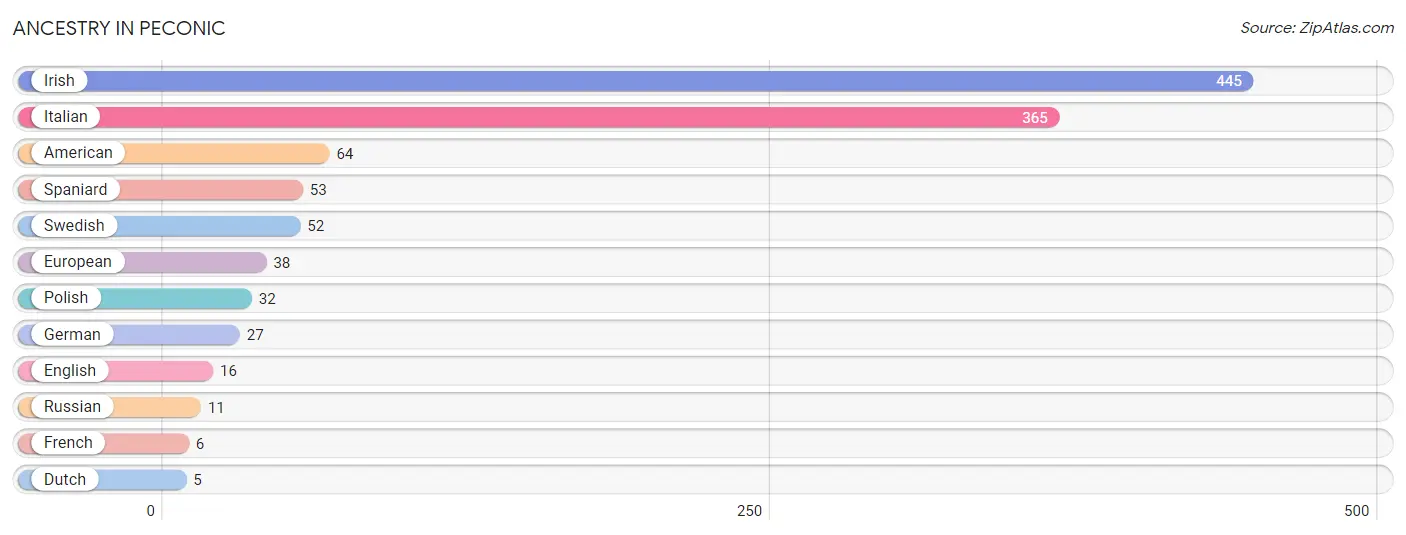
| Ancestry | # Population | % Population |
| American | 64 | 8.1% |
| Dutch | 5 | 0.6% |
| English | 16 | 2.0% |
| European | 38 | 4.8% |
| French | 6 | 0.8% |
| German | 27 | 3.4% |
| Irish | 445 | 56.1% |
| Italian | 365 | 46.0% |
| Polish | 32 | 4.0% |
| Russian | 11 | 1.4% |
| Spaniard | 53 | 6.7% |
| Swedish | 52 | 6.6% | View All 12 Rows |
Immigrants in Peconic
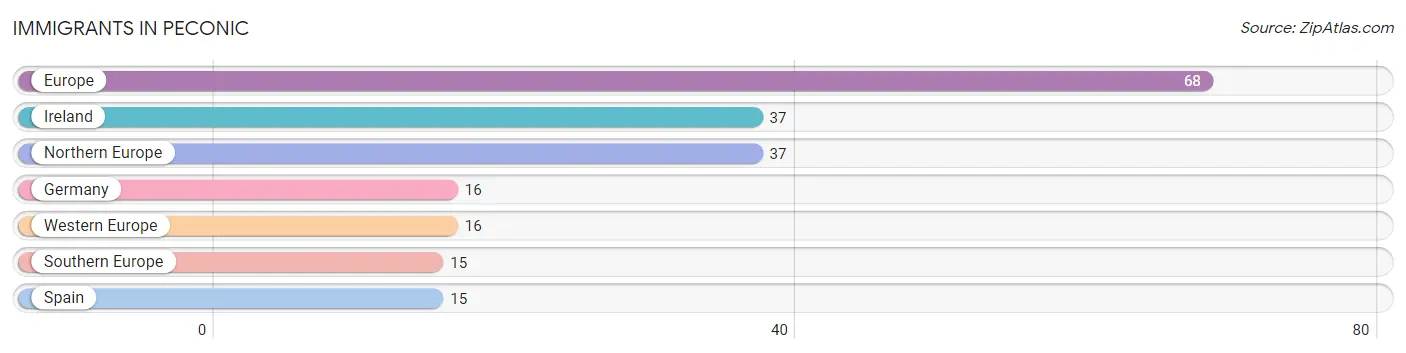
The most numerous immigrant groups reported in Peconic came from Europe (68 | 8.6%), Ireland (37 | 4.7%), Northern Europe (37 | 4.7%), Germany (16 | 2.0%), and Western Europe (16 | 2.0%), together accounting for 22.0% of all Peconic residents.
| Immigration Origin | # Population | % Population |
| Europe | 68 | 8.6% |
| Germany | 16 | 2.0% |
| Ireland | 37 | 4.7% |
| Northern Europe | 37 | 4.7% |
| Southern Europe | 15 | 1.9% |
| Spain | 15 | 1.9% |
| Western Europe | 16 | 2.0% | View All 7 Rows |
Sex and Age in Peconic
Sex and Age in Peconic
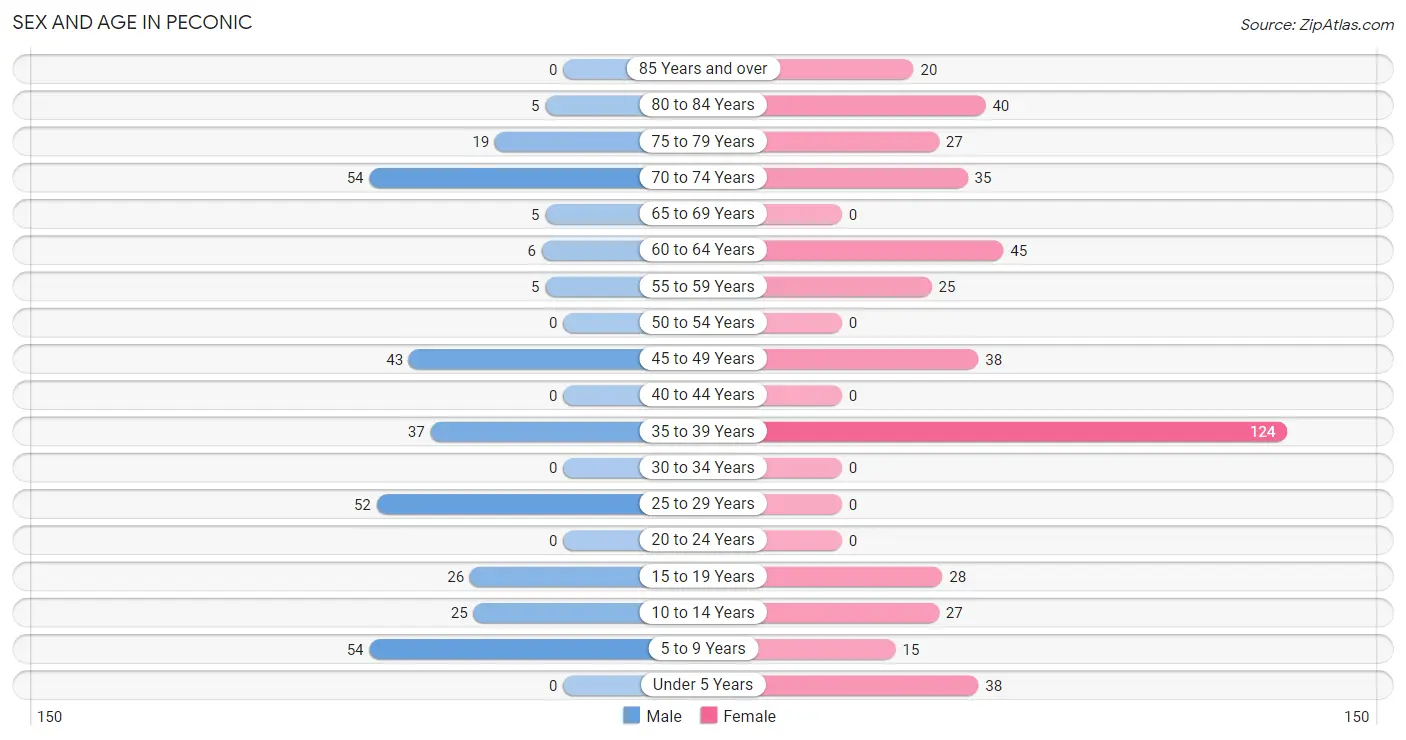
The most populous age groups in Peconic are 5 to 9 Years (54 | 16.3%) for men and 35 to 39 Years (124 | 26.8%) for women.
| Age Bracket | Male | Female |
| Under 5 Years | 0 (0.0%) | 38 (8.2%) |
| 5 to 9 Years | 54 (16.3%) | 15 (3.3%) |
| 10 to 14 Years | 25 (7.5%) | 27 (5.8%) |
| 15 to 19 Years | 26 (7.9%) | 28 (6.1%) |
| 20 to 24 Years | 0 (0.0%) | 0 (0.0%) |
| 25 to 29 Years | 52 (15.7%) | 0 (0.0%) |
| 30 to 34 Years | 0 (0.0%) | 0 (0.0%) |
| 35 to 39 Years | 37 (11.2%) | 124 (26.8%) |
| 40 to 44 Years | 0 (0.0%) | 0 (0.0%) |
| 45 to 49 Years | 43 (13.0%) | 38 (8.2%) |
| 50 to 54 Years | 0 (0.0%) | 0 (0.0%) |
| 55 to 59 Years | 5 (1.5%) | 25 (5.4%) |
| 60 to 64 Years | 6 (1.8%) | 45 (9.7%) |
| 65 to 69 Years | 5 (1.5%) | 0 (0.0%) |
| 70 to 74 Years | 54 (16.3%) | 35 (7.6%) |
| 75 to 79 Years | 19 (5.7%) | 27 (5.8%) |
| 80 to 84 Years | 5 (1.5%) | 40 (8.7%) |
| 85 Years and over | 0 (0.0%) | 20 (4.3%) |
| Total | 331 (100.0%) | 462 (100.0%) |
Families and Households in Peconic
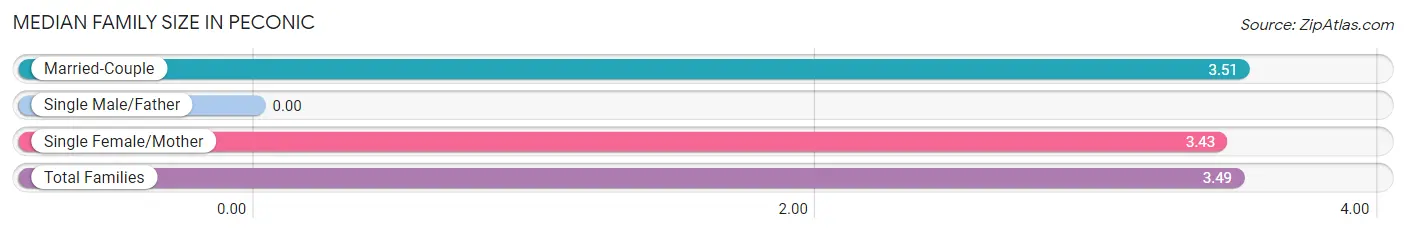
Median Family Size in Peconic
| Family Type | # Families | Family Size |
| Married-Couple | 143 (78.1%) | 3.51 |
| Single Male/Father | 0 (0.0%) | - |
| Single Female/Mother | 40 (21.9%) | 3.43 |
| Total Families | 183 (100.0%) | 3.49 |
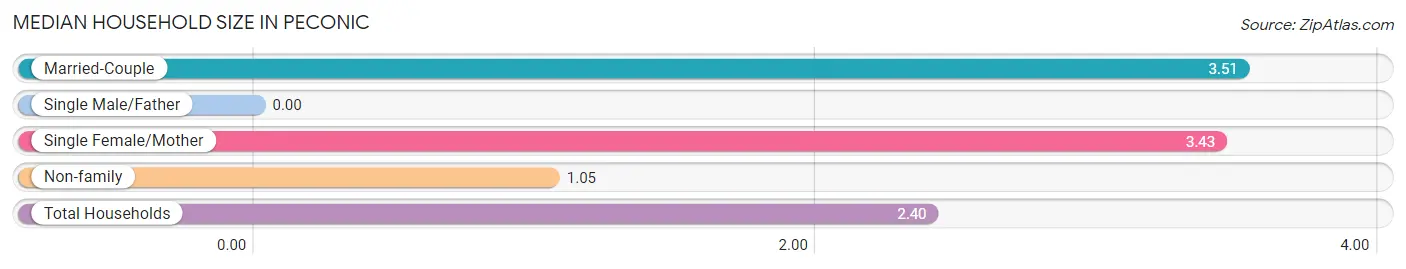
Median Household Size in Peconic
| Household Type | # Households | Household Size |
| Married-Couple | 143 (43.3%) | 3.51 |
| Single Male/Father | 0 (0.0%) | - |
| Single Female/Mother | 40 (12.1%) | 3.43 |
| Non-family | 147 (44.6%) | 1.05 |
| Total Households | 330 (100.0%) | 2.40 |
Household Size by Marriage Status in Peconic
Out of a total of 330 households in Peconic, 183 (55.4%) are family households, while 147 (44.6%) are nonfamily households. The most numerous type of family households are 2-person households, comprising 68, and the most common type of nonfamily households are 1-person households, comprising 140.
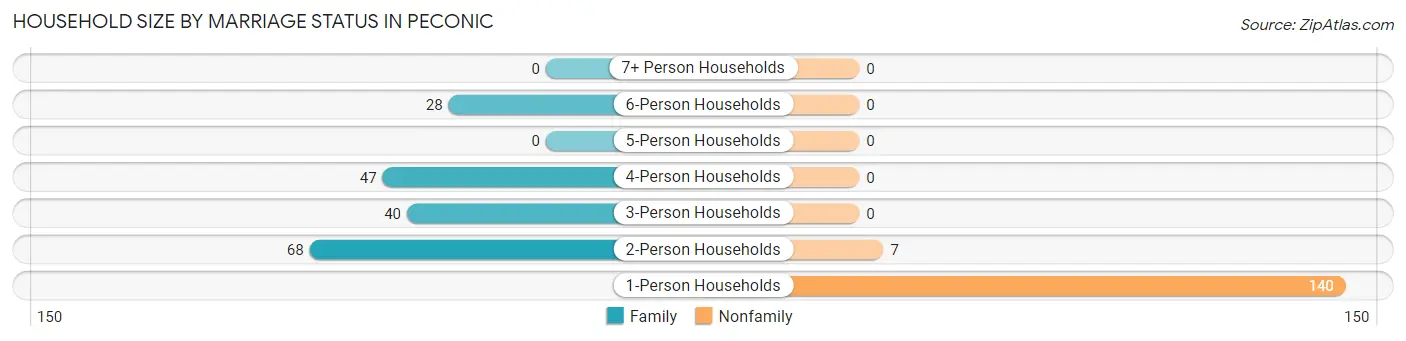
| Household Size | Family Households | Nonfamily Households |
| 1-Person Households | - | 140 (42.4%) |
| 2-Person Households | 68 (20.6%) | 7 (2.1%) |
| 3-Person Households | 40 (12.1%) | 0 (0.0%) |
| 4-Person Households | 47 (14.2%) | 0 (0.0%) |
| 5-Person Households | 0 (0.0%) | 0 (0.0%) |
| 6-Person Households | 28 (8.5%) | 0 (0.0%) |
| 7+ Person Households | 0 (0.0%) | 0 (0.0%) |
| Total | 183 (55.4%) | 147 (44.6%) |
Female Fertility in Peconic
Fertility by Age in Peconic
| Age Bracket | Women with Births | Births / 1,000 Women |
| 15 to 19 years | 0 (0.0%) | 0.0 |
| 20 to 34 years | 0 (0.0%) | 0.0 |
| 35 to 50 years | 0 (0.0%) | 0.0 |
| Total | 0 (0.0%) | 0.0 |
Fertility by Age by Marriage Status in Peconic
| Age Bracket | Married | Unmarried |
| 15 to 19 years | 0 (0.0%) | 0 (0.0%) |
| 20 to 34 years | 0 (0.0%) | 0 (0.0%) |
| 35 to 50 years | 0 (0.0%) | 0 (0.0%) |
| Total | 0 (0.0%) | 0 (0.0%) |
Fertility by Education in Peconic
| Educational Attainment | Women with Births | Births / 1,000 Women |
| Less than High School | 0 (0.0%) | 0.0 |
| High School Diploma | 0 (0.0%) | 0.0 |
| College or Associate's Degree | 0 (0.0%) | 0.0 |
| Bachelor's Degree | 0 (0.0%) | 0.0 |
| Graduate Degree | 0 (0.0%) | 0.0 |
| Total | 0 (0.0%) | 0.0 |
Fertility by Education by Marriage Status in Peconic
| Educational Attainment | Married | Unmarried |
| Less than High School | 0 (0.0%) | 0 (0.0%) |
| High School Diploma | 0 (0.0%) | 0 (0.0%) |
| College or Associate's Degree | 0 (0.0%) | 0 (0.0%) |
| Bachelor's Degree | 0 (0.0%) | 0 (0.0%) |
| Graduate Degree | 0 (0.0%) | 0 (0.0%) |
| Total | 0 (0.0%) | 0 (0.0%) |
Employment Characteristics in Peconic
Employment by Class of Employer in Peconic
Among the 314 employed individuals in Peconic, private company employees (196 | 62.4%), not-for-profit organizations (69 | 22.0%), and self-employed (incorporated) (38 | 12.1%) make up the most common classes of employment.
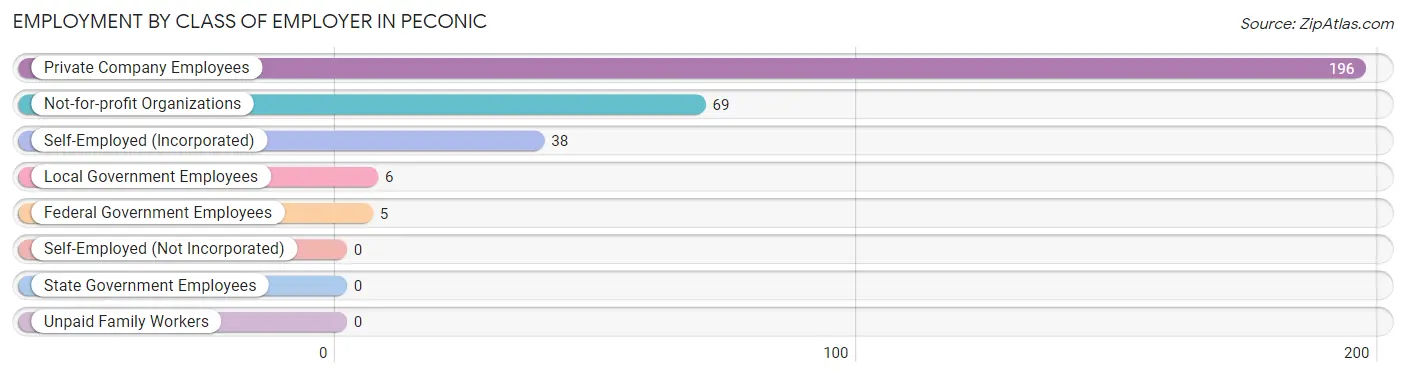
| Employer Class | # Employees | % Employees |
| Private Company Employees | 196 | 62.4% |
| Self-Employed (Incorporated) | 38 | 12.1% |
| Self-Employed (Not Incorporated) | 0 | 0.0% |
| Not-for-profit Organizations | 69 | 22.0% |
| Local Government Employees | 6 | 1.9% |
| State Government Employees | 0 | 0.0% |
| Federal Government Employees | 5 | 1.6% |
| Unpaid Family Workers | 0 | 0.0% |
| Total | 314 | 100.0% |
Employment Status by Age in Peconic
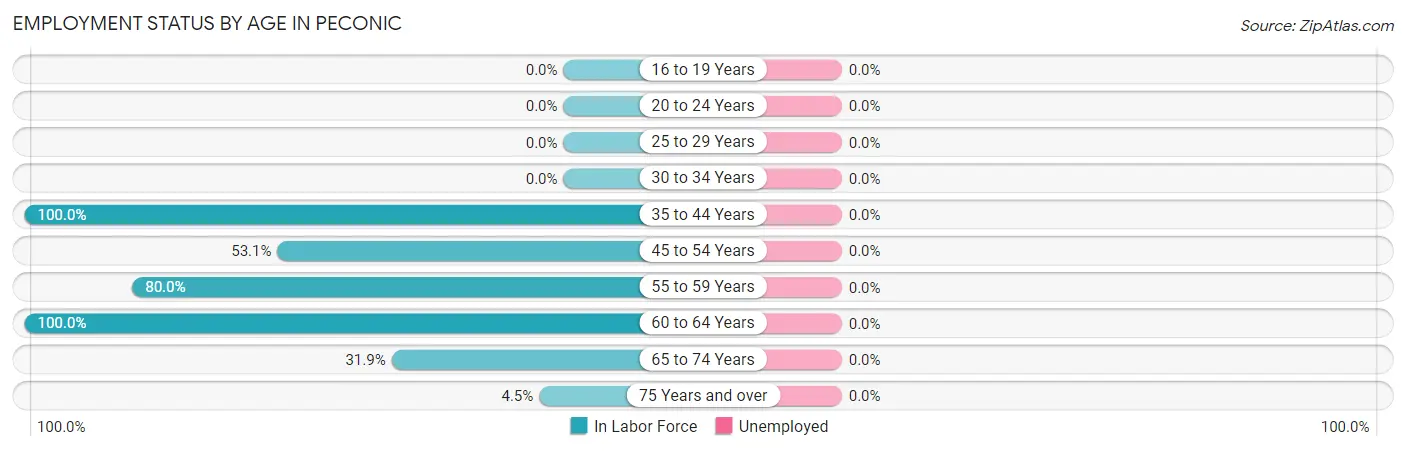
| Age Bracket | In Labor Force | Unemployed |
| 16 to 19 Years | 0 (0.0%) | 0 (0.0%) |
| 20 to 24 Years | 0 (0.0%) | 0 (0.0%) |
| 25 to 29 Years | 0 (0.0%) | 0 (0.0%) |
| 30 to 34 Years | 0 (0.0%) | 0 (0.0%) |
| 35 to 44 Years | 161 (100.0%) | 0 (0.0%) |
| 45 to 54 Years | 43 (53.1%) | 0 (0.0%) |
| 55 to 59 Years | 24 (80.0%) | 0 (0.0%) |
| 60 to 64 Years | 51 (100.0%) | 0 (0.0%) |
| 65 to 74 Years | 30 (31.9%) | 0 (0.0%) |
| 75 Years and over | 5 (4.5%) | 0 (0.0%) |
| Total | 314 (51.6%) | 0 (0.0%) |
Employment Status by Educational Attainment in Peconic
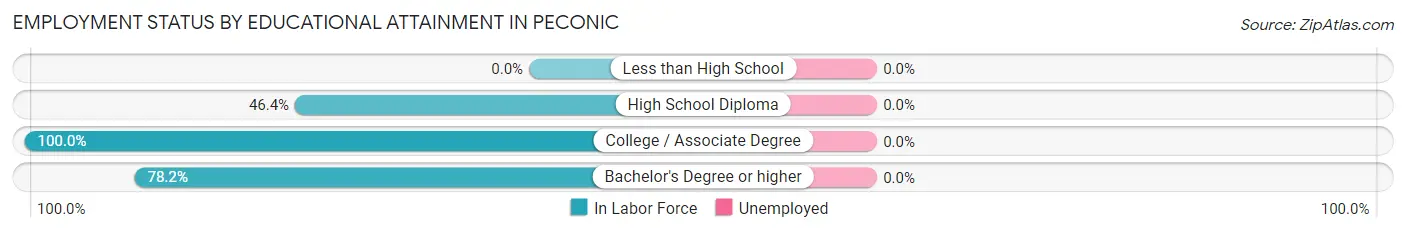
| Educational Attainment | In Labor Force | Unemployed |
| Less than High School | 0 (0.0%) | 0 (0.0%) |
| High School Diploma | 45 (46.4%) | 0 (0.0%) |
| College / Associate Degree | 76 (100.0%) | 0 (0.0%) |
| Bachelor's Degree or higher | 158 (78.2%) | 0 (0.0%) |
| Total | 279 (74.4%) | 0 (0.0%) |
Employment Occupations by Sex in Peconic
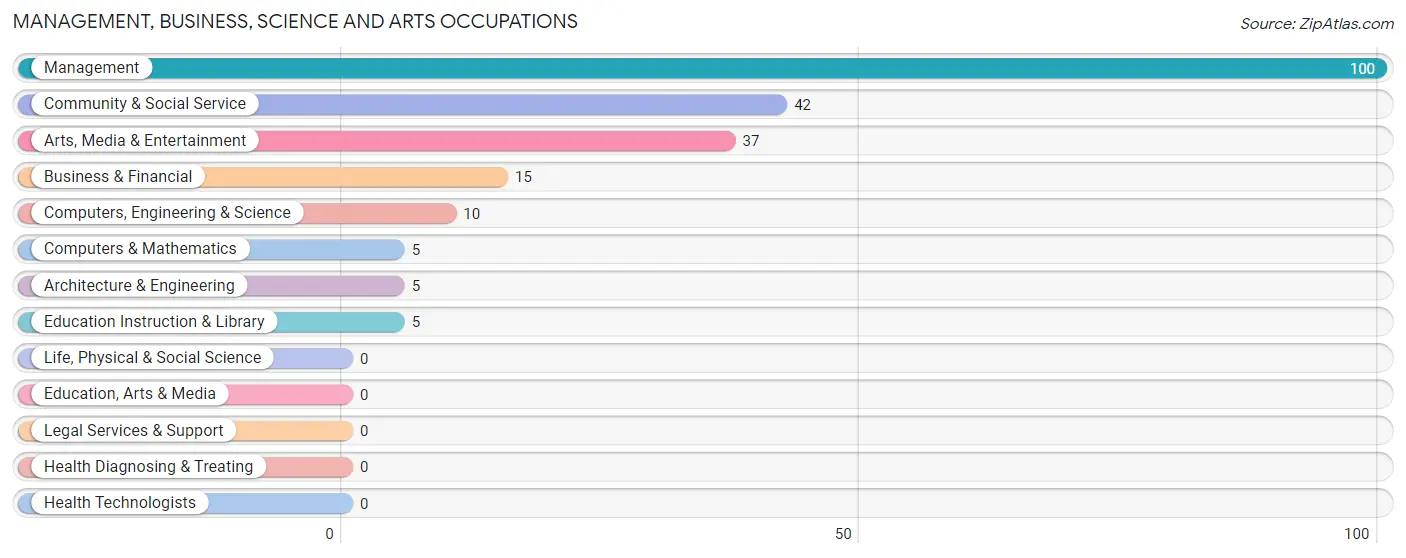
Management, Business, Science and Arts Occupations
The most common Management, Business, Science and Arts occupations in Peconic are Management (100 | 31.9%), Community & Social Service (42 | 13.4%), Arts, Media & Entertainment (37 | 11.8%), Business & Financial (15 | 4.8%), and Computers, Engineering & Science (10 | 3.2%).
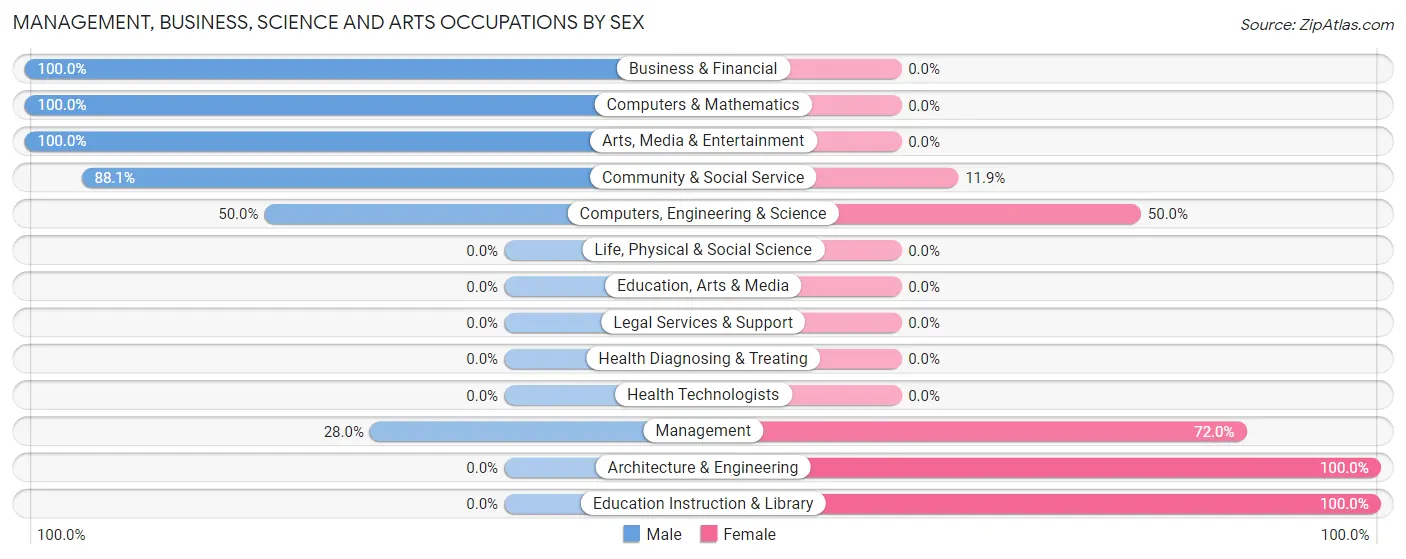
Management, Business, Science and Arts Occupations by Sex
Within the Management, Business, Science and Arts occupations in Peconic, the most male-oriented occupations are Business & Financial (100.0%), Computers & Mathematics (100.0%), and Arts, Media & Entertainment (100.0%), while the most female-oriented occupations are Architecture & Engineering (100.0%), Education Instruction & Library (100.0%), and Management (72.0%).
| Occupation | Male | Female |
| Management | 28 (28.0%) | 72 (72.0%) |
| Business & Financial | 15 (100.0%) | 0 (0.0%) |
| Computers, Engineering & Science | 5 (50.0%) | 5 (50.0%) |
| Computers & Mathematics | 5 (100.0%) | 0 (0.0%) |
| Architecture & Engineering | 0 (0.0%) | 5 (100.0%) |
| Life, Physical & Social Science | 0 (0.0%) | 0 (0.0%) |
| Community & Social Service | 37 (88.1%) | 5 (11.9%) |
| Education, Arts & Media | 0 (0.0%) | 0 (0.0%) |
| Legal Services & Support | 0 (0.0%) | 0 (0.0%) |
| Education Instruction & Library | 0 (0.0%) | 5 (100.0%) |
| Arts, Media & Entertainment | 37 (100.0%) | 0 (0.0%) |
| Health Diagnosing & Treating | 0 (0.0%) | 0 (0.0%) |
| Health Technologists | 0 (0.0%) | 0 (0.0%) |
| Total (Category) | 85 (50.9%) | 82 (49.1%) |
| Total (Overall) | 121 (38.5%) | 193 (61.5%) |
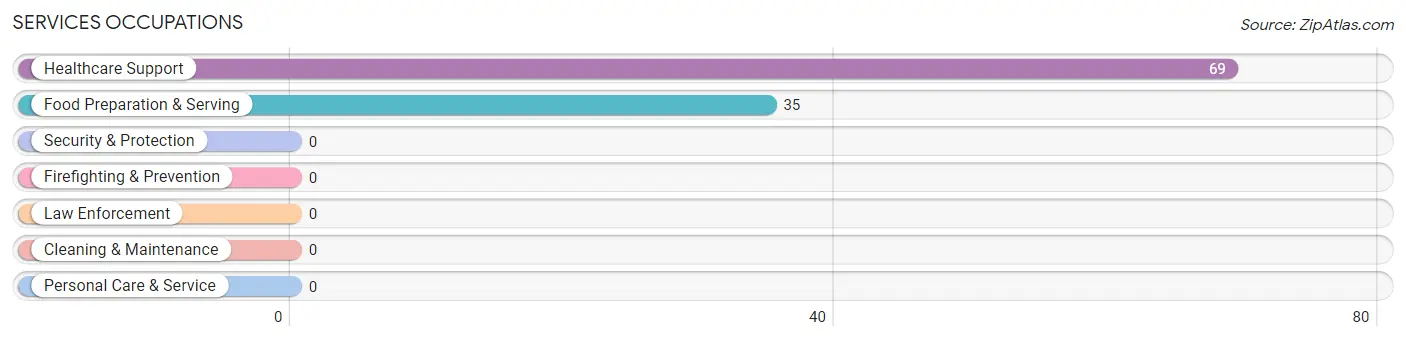
Services Occupations
The most common Services occupations in Peconic are Healthcare Support (69 | 22.0%), and Food Preparation & Serving (35 | 11.2%).
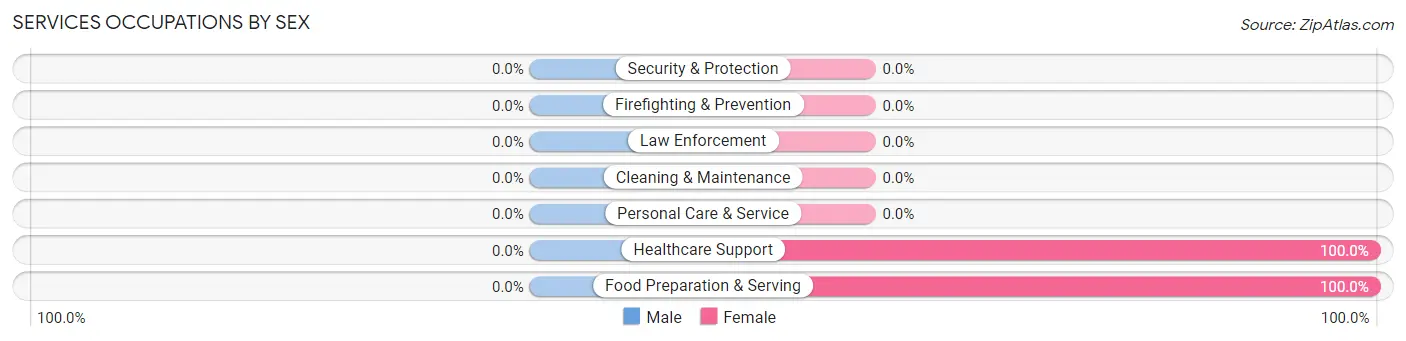
Services Occupations by Sex
| Occupation | Male | Female |
| Healthcare Support | 0 (0.0%) | 69 (100.0%) |
| Security & Protection | 0 (0.0%) | 0 (0.0%) |
| Firefighting & Prevention | 0 (0.0%) | 0 (0.0%) |
| Law Enforcement | 0 (0.0%) | 0 (0.0%) |
| Food Preparation & Serving | 0 (0.0%) | 35 (100.0%) |
| Cleaning & Maintenance | 0 (0.0%) | 0 (0.0%) |
| Personal Care & Service | 0 (0.0%) | 0 (0.0%) |
| Total (Category) | 0 (0.0%) | 104 (100.0%) |
| Total (Overall) | 121 (38.5%) | 193 (61.5%) |
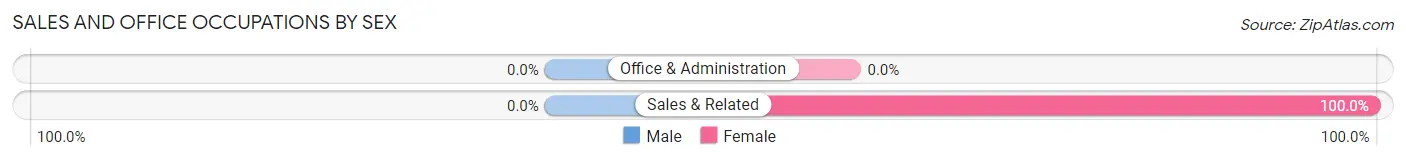
Sales and Office Occupations
The most common Sales and Office occupations in Peconic are , and Sales & Related (7 | 2.2%).

Sales and Office Occupations by Sex
| Occupation | Male | Female |
| Sales & Related | 0 (0.0%) | 7 (100.0%) |
| Office & Administration | 0 (0.0%) | 0 (0.0%) |
| Total (Category) | 0 (0.0%) | 7 (100.0%) |
| Total (Overall) | 121 (38.5%) | 193 (61.5%) |
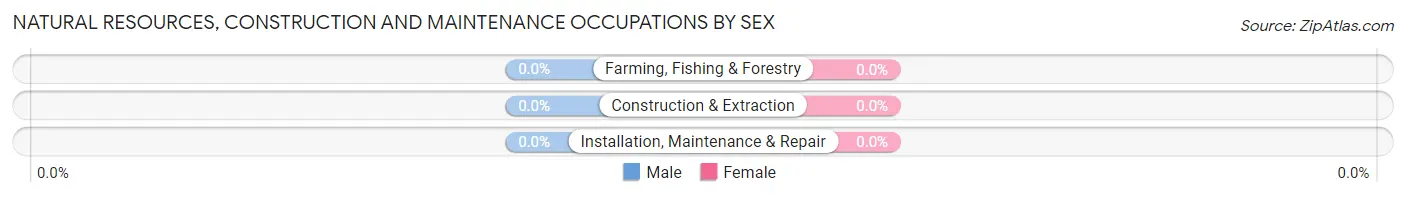
Natural Resources, Construction and Maintenance Occupations

Natural Resources, Construction and Maintenance Occupations by Sex
| Occupation | Male | Female |
| Farming, Fishing & Forestry | 0 (0.0%) | 0 (0.0%) |
| Construction & Extraction | 0 (0.0%) | 0 (0.0%) |
| Installation, Maintenance & Repair | 0 (0.0%) | 0 (0.0%) |
| Total (Category) | 0 (0.0%) | 0 (0.0%) |
| Total (Overall) | 121 (38.5%) | 193 (61.5%) |
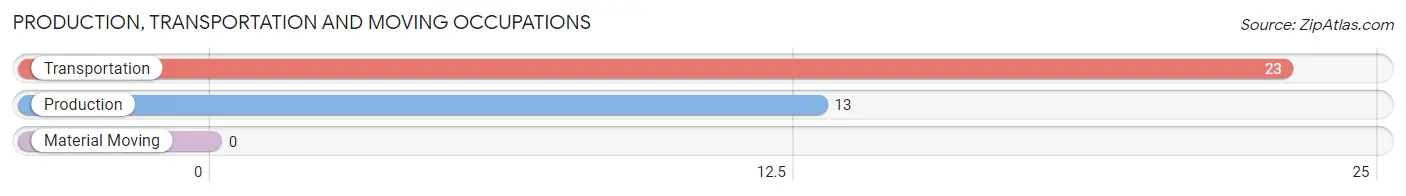
Production, Transportation and Moving Occupations
The most common Production, Transportation and Moving occupations in Peconic are Transportation (23 | 7.3%), and Production (13 | 4.1%).
Production, Transportation and Moving Occupations by Sex
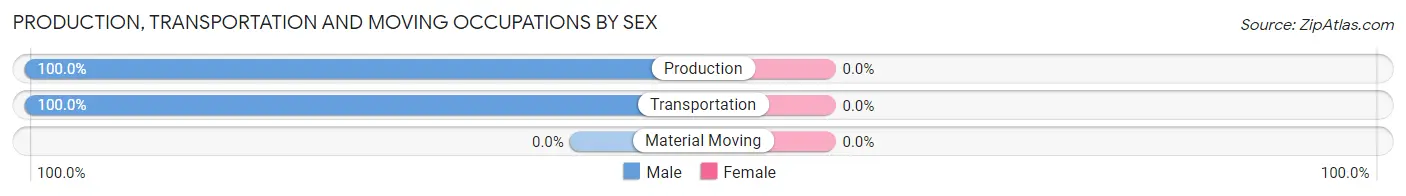
| Occupation | Male | Female |
| Production | 13 (100.0%) | 0 (0.0%) |
| Transportation | 23 (100.0%) | 0 (0.0%) |
| Material Moving | 0 (0.0%) | 0 (0.0%) |
| Total (Category) | 36 (100.0%) | 0 (0.0%) |
| Total (Overall) | 121 (38.5%) | 193 (61.5%) |
Employment Industries by Sex in Peconic
Employment Industries in Peconic
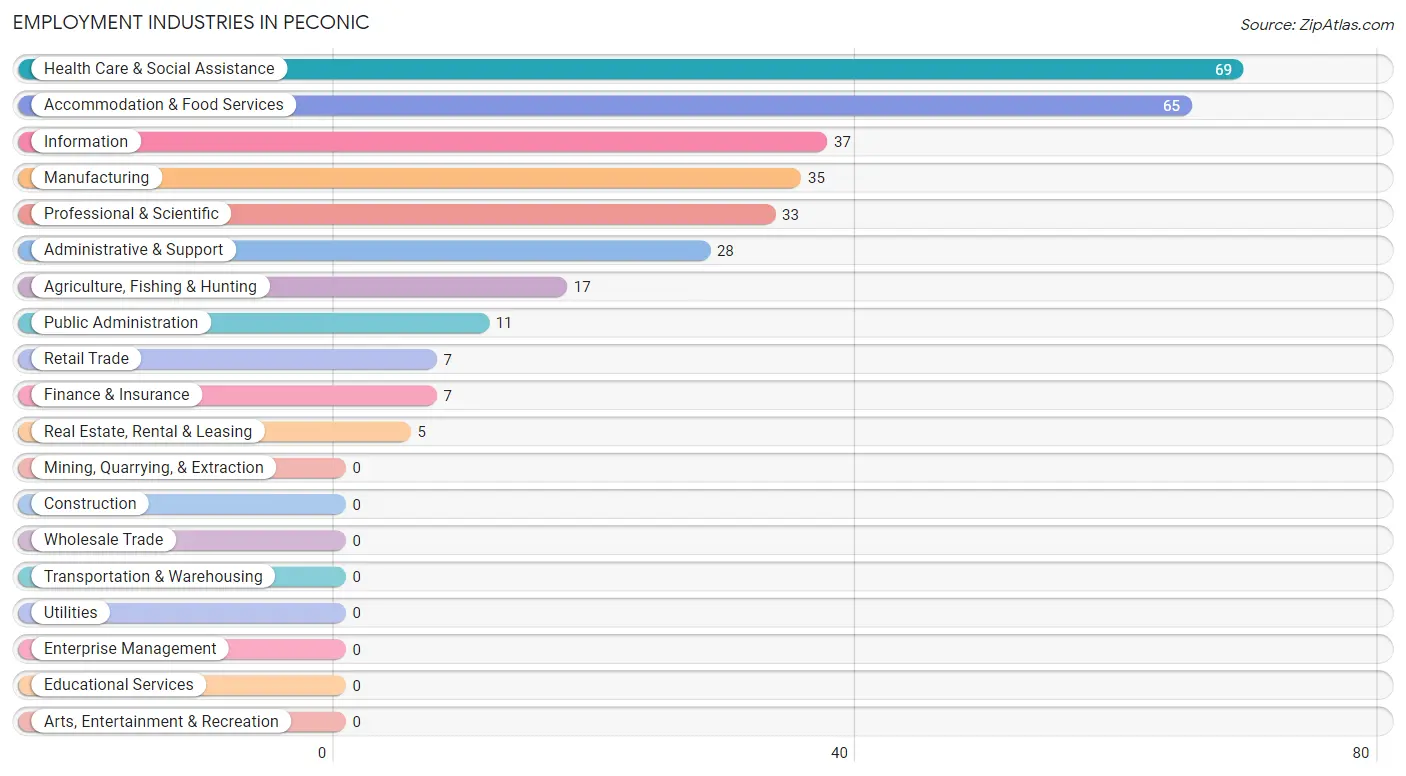
The major employment industries in Peconic include Health Care & Social Assistance (69 | 22.0%), Accommodation & Food Services (65 | 20.7%), Information (37 | 11.8%), Manufacturing (35 | 11.2%), and Professional & Scientific (33 | 10.5%).
Employment Industries by Sex in Peconic
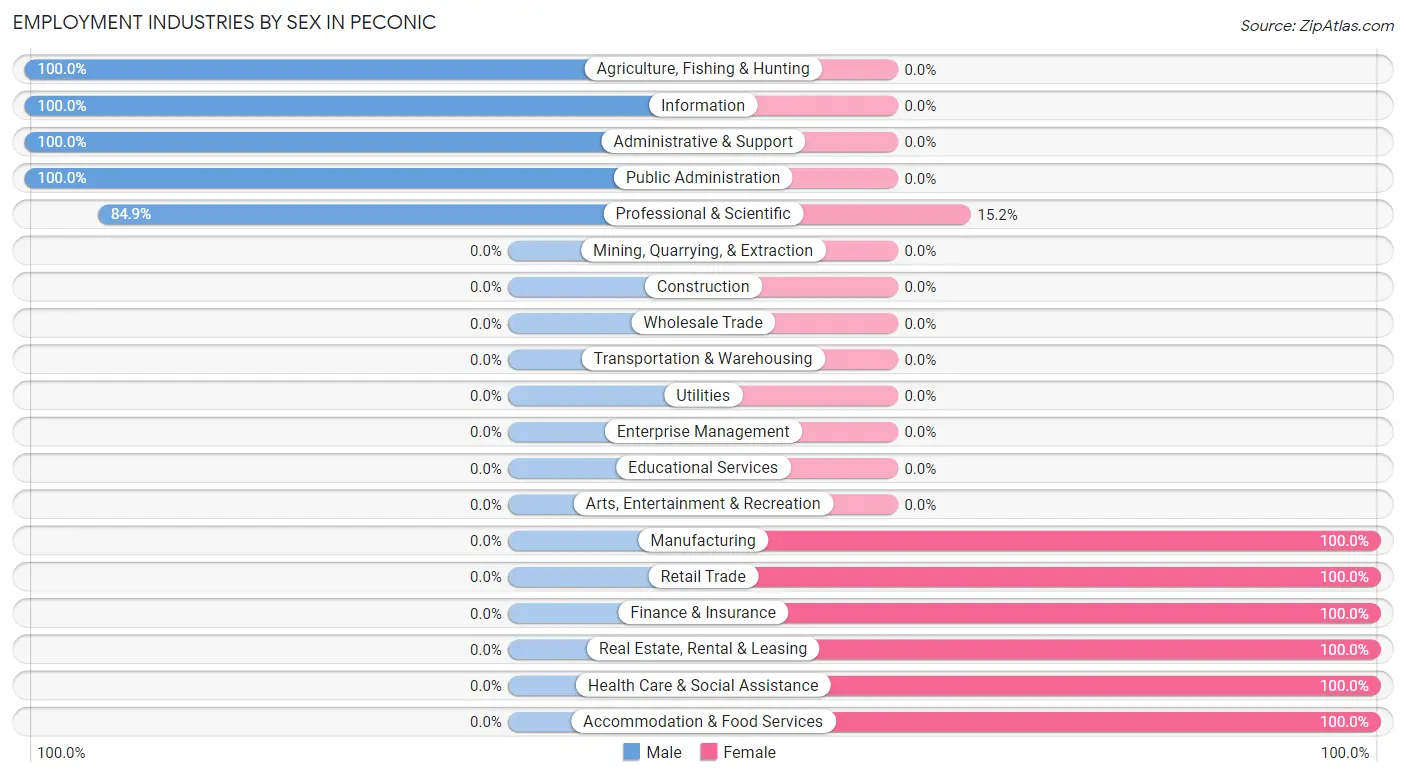
The Peconic industries that see more men than women are Agriculture, Fishing & Hunting (100.0%), Information (100.0%), and Administrative & Support (100.0%), whereas the industries that tend to have a higher number of women are Manufacturing (100.0%), Retail Trade (100.0%), and Finance & Insurance (100.0%).
| Industry | Male | Female |
| Agriculture, Fishing & Hunting | 17 (100.0%) | 0 (0.0%) |
| Mining, Quarrying, & Extraction | 0 (0.0%) | 0 (0.0%) |
| Construction | 0 (0.0%) | 0 (0.0%) |
| Manufacturing | 0 (0.0%) | 35 (100.0%) |
| Wholesale Trade | 0 (0.0%) | 0 (0.0%) |
| Retail Trade | 0 (0.0%) | 7 (100.0%) |
| Transportation & Warehousing | 0 (0.0%) | 0 (0.0%) |
| Utilities | 0 (0.0%) | 0 (0.0%) |
| Information | 37 (100.0%) | 0 (0.0%) |
| Finance & Insurance | 0 (0.0%) | 7 (100.0%) |
| Real Estate, Rental & Leasing | 0 (0.0%) | 5 (100.0%) |
| Professional & Scientific | 28 (84.9%) | 5 (15.1%) |
| Enterprise Management | 0 (0.0%) | 0 (0.0%) |
| Administrative & Support | 28 (100.0%) | 0 (0.0%) |
| Educational Services | 0 (0.0%) | 0 (0.0%) |
| Health Care & Social Assistance | 0 (0.0%) | 69 (100.0%) |
| Arts, Entertainment & Recreation | 0 (0.0%) | 0 (0.0%) |
| Accommodation & Food Services | 0 (0.0%) | 65 (100.0%) |
| Public Administration | 11 (100.0%) | 0 (0.0%) |
| Total | 121 (38.5%) | 193 (61.5%) |
Education in Peconic
School Enrollment in Peconic
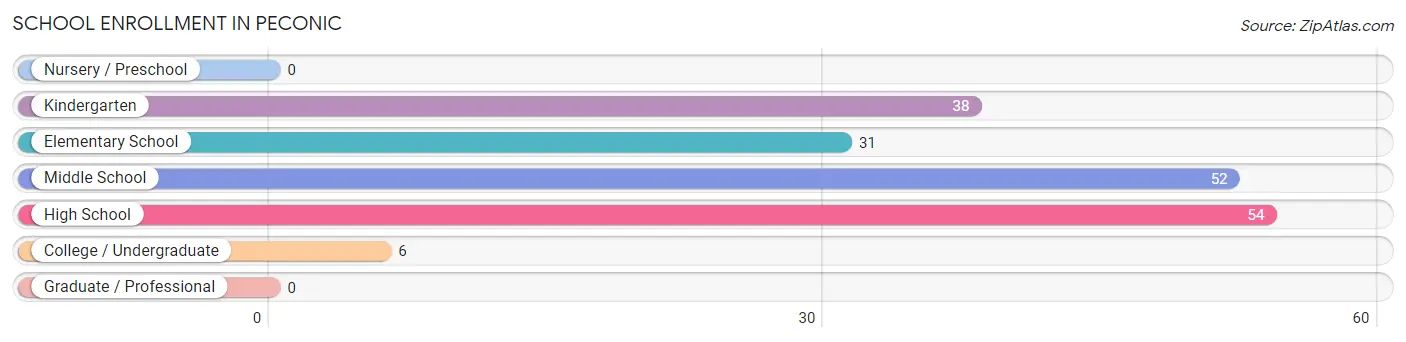
The most common levels of schooling among the 181 students in Peconic are high school (54 | 29.8%), middle school (52 | 28.7%), and kindergarten (38 | 21.0%).
| School Level | # Students | % Students |
| Nursery / Preschool | 0 | 0.0% |
| Kindergarten | 38 | 21.0% |
| Elementary School | 31 | 17.1% |
| Middle School | 52 | 28.7% |
| High School | 54 | 29.8% |
| College / Undergraduate | 6 | 3.3% |
| Graduate / Professional | 0 | 0.0% |
| Total | 181 | 100.0% |
School Enrollment by Age by Funding Source in Peconic
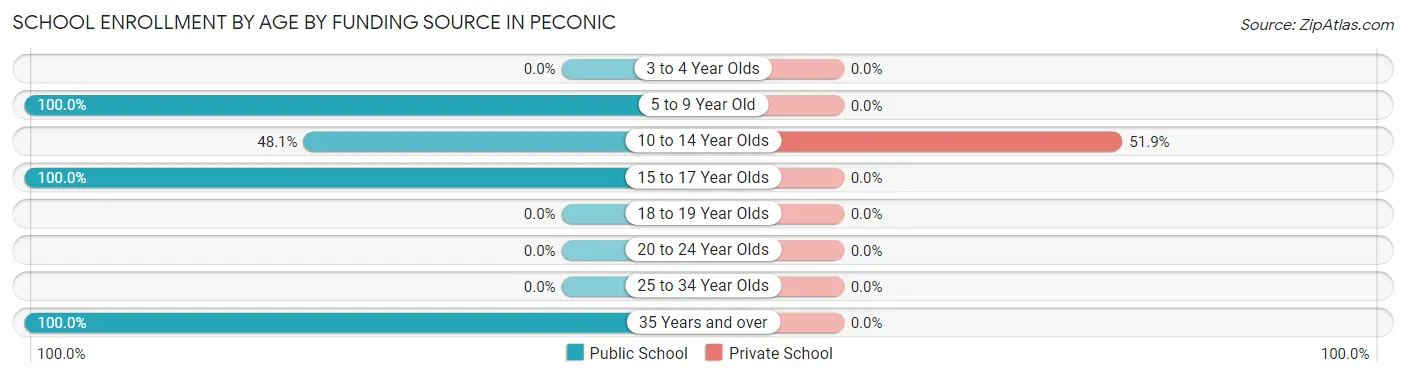
Out of a total of 181 students who are enrolled in schools in Peconic, 27 (14.9%) attend a private institution, while the remaining 154 (85.1%) are enrolled in public schools. The age group of 10 to 14 year olds has the highest likelihood of being enrolled in private schools, with 27 (51.9% in the age bracket) enrolled. Conversely, the age group of 5 to 9 year old has the lowest likelihood of being enrolled in a private school, with 69 (100.0% in the age bracket) attending a public institution.
| Age Bracket | Public School | Private School |
| 3 to 4 Year Olds | 0 (0.0%) | 0 (0.0%) |
| 5 to 9 Year Old | 69 (100.0%) | 0 (0.0%) |
| 10 to 14 Year Olds | 25 (48.1%) | 27 (51.9%) |
| 15 to 17 Year Olds | 54 (100.0%) | 0 (0.0%) |
| 18 to 19 Year Olds | 0 (0.0%) | 0 (0.0%) |
| 20 to 24 Year Olds | 0 (0.0%) | 0 (0.0%) |
| 25 to 34 Year Olds | 0 (0.0%) | 0 (0.0%) |
| 35 Years and over | 6 (100.0%) | 0 (0.0%) |
| Total | 154 (85.1%) | 27 (14.9%) |
Educational Attainment by Field of Study in Peconic
Social sciences (60 | 21.8%), literature & languages (59 | 21.4%), visual & performing arts (57 | 20.7%), physical & health sciences (37 | 13.5%), and education (27 | 9.8%) are the most common fields of study among 275 individuals in Peconic who have obtained a bachelor's degree or higher.
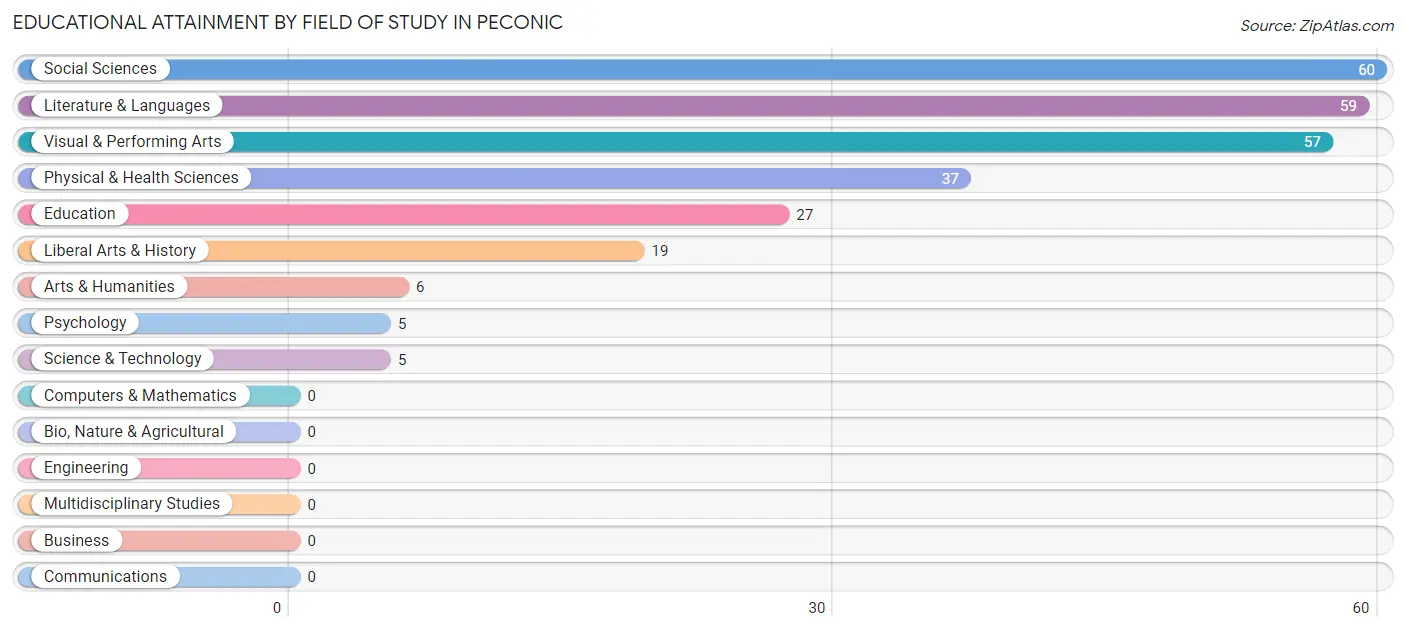
| Field of Study | # Graduates | % Graduates |
| Computers & Mathematics | 0 | 0.0% |
| Bio, Nature & Agricultural | 0 | 0.0% |
| Physical & Health Sciences | 37 | 13.5% |
| Psychology | 5 | 1.8% |
| Social Sciences | 60 | 21.8% |
| Engineering | 0 | 0.0% |
| Multidisciplinary Studies | 0 | 0.0% |
| Science & Technology | 5 | 1.8% |
| Business | 0 | 0.0% |
| Education | 27 | 9.8% |
| Literature & Languages | 59 | 21.4% |
| Liberal Arts & History | 19 | 6.9% |
| Visual & Performing Arts | 57 | 20.7% |
| Communications | 0 | 0.0% |
| Arts & Humanities | 6 | 2.2% |
| Total | 275 | 100.0% |
Transportation & Commute in Peconic
Vehicle Availability by Sex in Peconic
The most prevalent vehicle ownership categories in Peconic are males with 2 vehicles (73, accounting for 60.3%) and females with 2 vehicles (94, making up 37.8%).
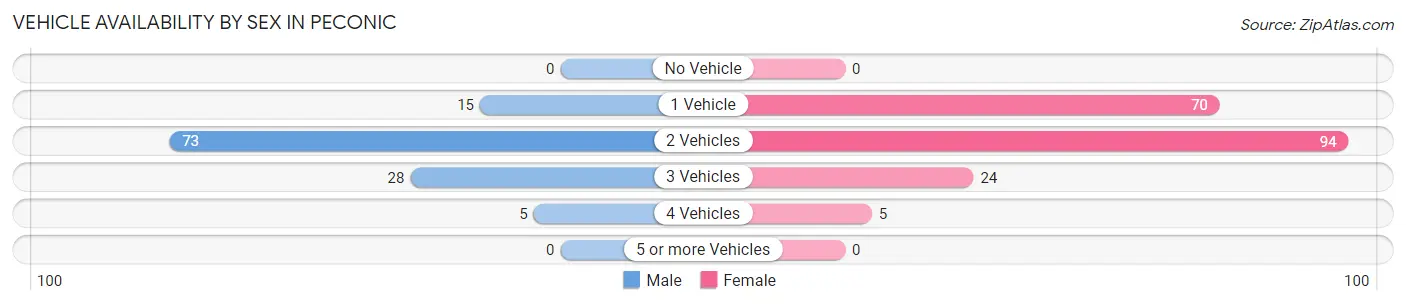
| Vehicles Available | Male | Female |
| No Vehicle | 0 (0.0%) | 0 (0.0%) |
| 1 Vehicle | 15 (12.4%) | 70 (36.3%) |
| 2 Vehicles | 73 (60.3%) | 94 (48.7%) |
| 3 Vehicles | 28 (23.1%) | 24 (12.4%) |
| 4 Vehicles | 5 (4.1%) | 5 (2.6%) |
| 5 or more Vehicles | 0 (0.0%) | 0 (0.0%) |
| Total | 121 (100.0%) | 193 (100.0%) |
Commute Time in Peconic
The most frequently occuring commute durations in Peconic are 20 to 24 minutes (65 commuters, 26.0%), 5 to 9 minutes (59 commuters, 23.6%), and 45 to 59 minutes (45 commuters, 18.0%).
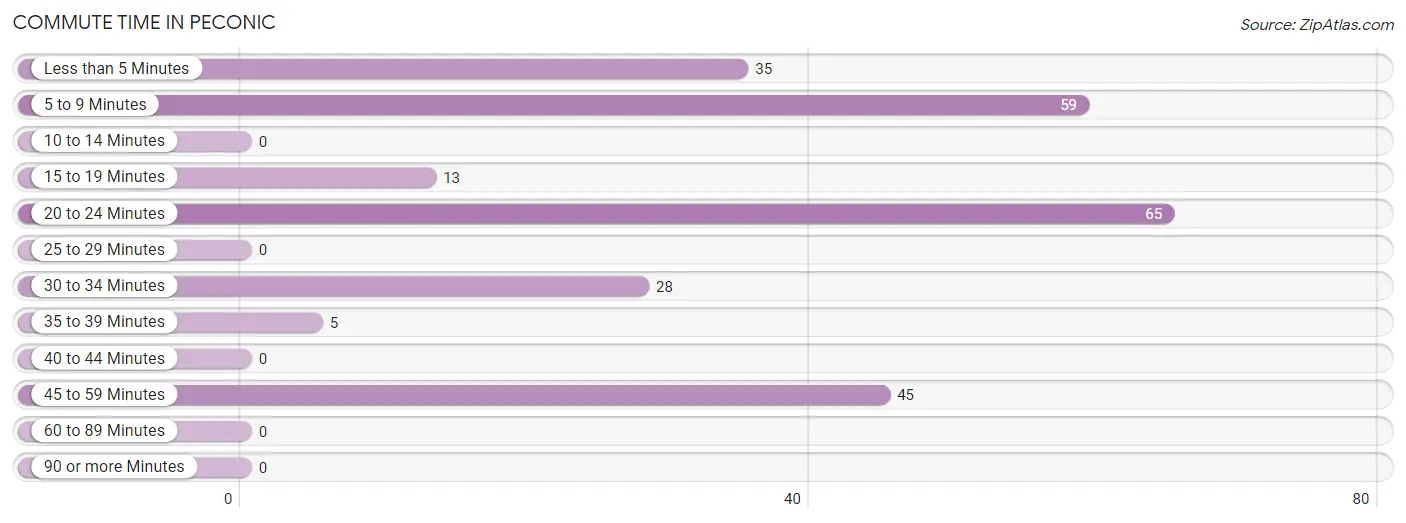
| Commute Time | # Commuters | % Commuters |
| Less than 5 Minutes | 35 | 14.0% |
| 5 to 9 Minutes | 59 | 23.6% |
| 10 to 14 Minutes | 0 | 0.0% |
| 15 to 19 Minutes | 13 | 5.2% |
| 20 to 24 Minutes | 65 | 26.0% |
| 25 to 29 Minutes | 0 | 0.0% |
| 30 to 34 Minutes | 28 | 11.2% |
| 35 to 39 Minutes | 5 | 2.0% |
| 40 to 44 Minutes | 0 | 0.0% |
| 45 to 59 Minutes | 45 | 18.0% |
| 60 to 89 Minutes | 0 | 0.0% |
| 90 or more Minutes | 0 | 0.0% |
Commute Time by Sex in Peconic
The most common commute times in Peconic are 5 to 9 minutes (28 commuters, 40.6%) for males and 20 to 24 minutes (65 commuters, 35.9%) for females.
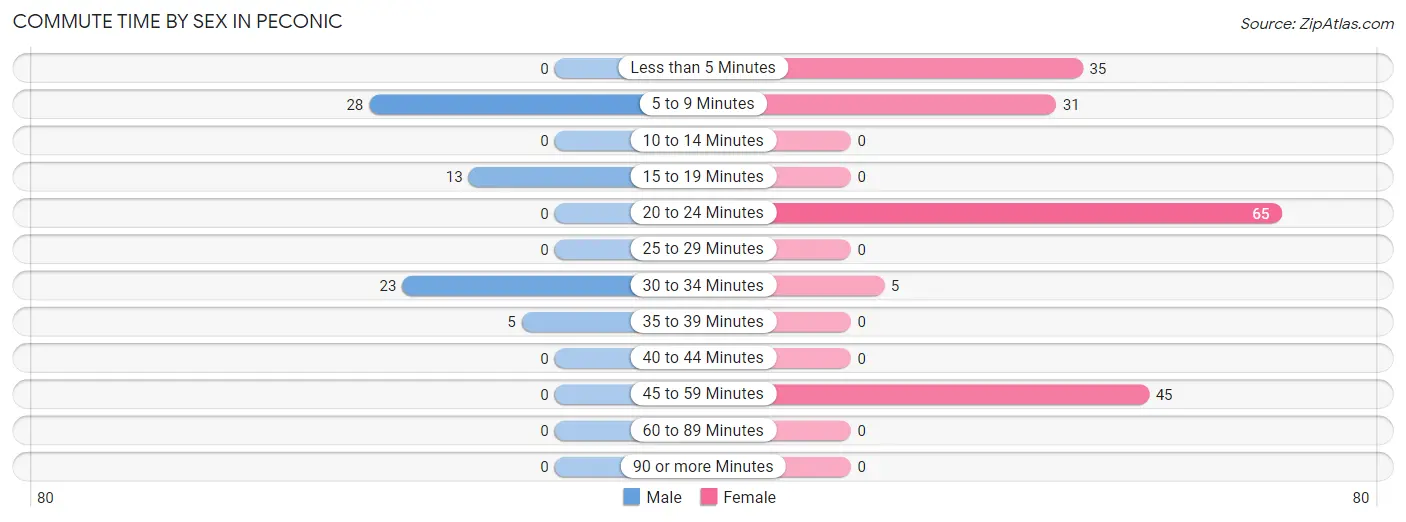
| Commute Time | Male | Female |
| Less than 5 Minutes | 0 (0.0%) | 35 (19.3%) |
| 5 to 9 Minutes | 28 (40.6%) | 31 (17.1%) |
| 10 to 14 Minutes | 0 (0.0%) | 0 (0.0%) |
| 15 to 19 Minutes | 13 (18.8%) | 0 (0.0%) |
| 20 to 24 Minutes | 0 (0.0%) | 65 (35.9%) |
| 25 to 29 Minutes | 0 (0.0%) | 0 (0.0%) |
| 30 to 34 Minutes | 23 (33.3%) | 5 (2.8%) |
| 35 to 39 Minutes | 5 (7.2%) | 0 (0.0%) |
| 40 to 44 Minutes | 0 (0.0%) | 0 (0.0%) |
| 45 to 59 Minutes | 0 (0.0%) | 45 (24.9%) |
| 60 to 89 Minutes | 0 (0.0%) | 0 (0.0%) |
| 90 or more Minutes | 0 (0.0%) | 0 (0.0%) |
Time of Departure to Work by Sex in Peconic
The most frequent times of departure to work in Peconic are 8:30 AM to 8:59 AM (28, 40.6%) for males and 12:00 PM to 3:59 PM (134, 74.0%) for females.
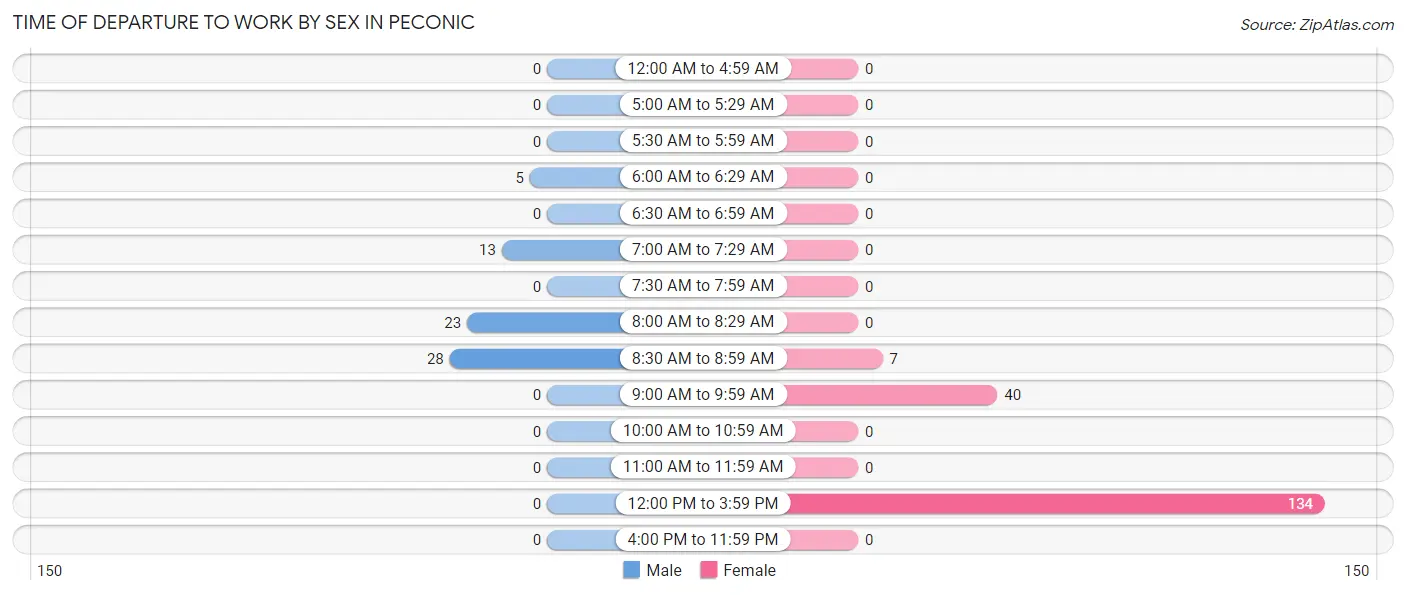
| Time of Departure | Male | Female |
| 12:00 AM to 4:59 AM | 0 (0.0%) | 0 (0.0%) |
| 5:00 AM to 5:29 AM | 0 (0.0%) | 0 (0.0%) |
| 5:30 AM to 5:59 AM | 0 (0.0%) | 0 (0.0%) |
| 6:00 AM to 6:29 AM | 5 (7.2%) | 0 (0.0%) |
| 6:30 AM to 6:59 AM | 0 (0.0%) | 0 (0.0%) |
| 7:00 AM to 7:29 AM | 13 (18.8%) | 0 (0.0%) |
| 7:30 AM to 7:59 AM | 0 (0.0%) | 0 (0.0%) |
| 8:00 AM to 8:29 AM | 23 (33.3%) | 0 (0.0%) |
| 8:30 AM to 8:59 AM | 28 (40.6%) | 7 (3.9%) |
| 9:00 AM to 9:59 AM | 0 (0.0%) | 40 (22.1%) |
| 10:00 AM to 10:59 AM | 0 (0.0%) | 0 (0.0%) |
| 11:00 AM to 11:59 AM | 0 (0.0%) | 0 (0.0%) |
| 12:00 PM to 3:59 PM | 0 (0.0%) | 134 (74.0%) |
| 4:00 PM to 11:59 PM | 0 (0.0%) | 0 (0.0%) |
| Total | 69 (100.0%) | 181 (100.0%) |
Housing Occupancy in Peconic
Occupancy by Ownership in Peconic
Of the total 330 dwellings in Peconic, owner-occupied units account for 230 (69.7%), while renter-occupied units make up 100 (30.3%).
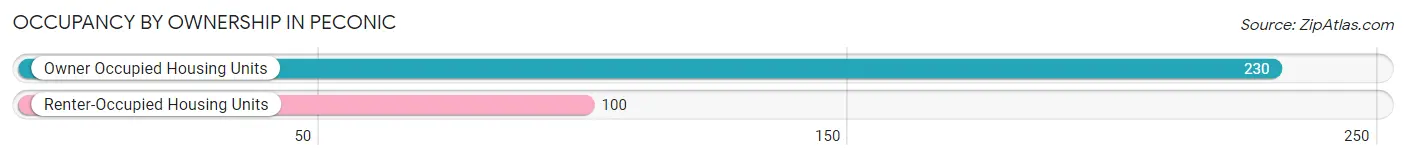
| Occupancy | # Housing Units | % Housing Units |
| Owner Occupied Housing Units | 230 | 69.7% |
| Renter-Occupied Housing Units | 100 | 30.3% |
| Total Occupied Housing Units | 330 | 100.0% |
Occupancy by Household Size in Peconic
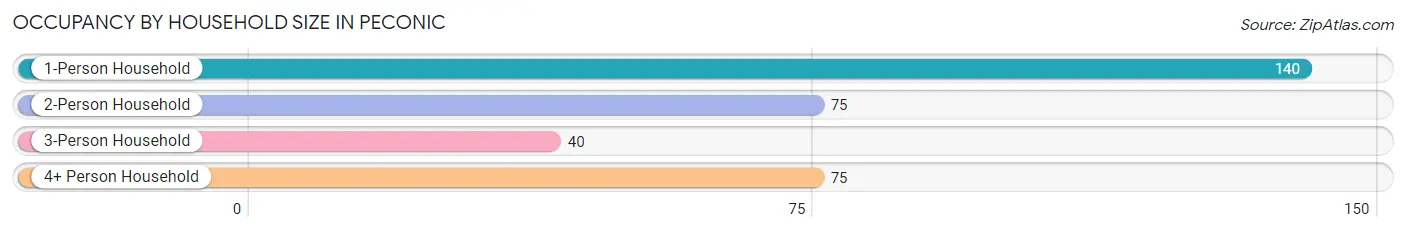
| Household Size | # Housing Units | % Housing Units |
| 1-Person Household | 140 | 42.4% |
| 2-Person Household | 75 | 22.7% |
| 3-Person Household | 40 | 12.1% |
| 4+ Person Household | 75 | 22.7% |
| Total Housing Units | 330 | 100.0% |
Occupancy by Ownership by Household Size in Peconic
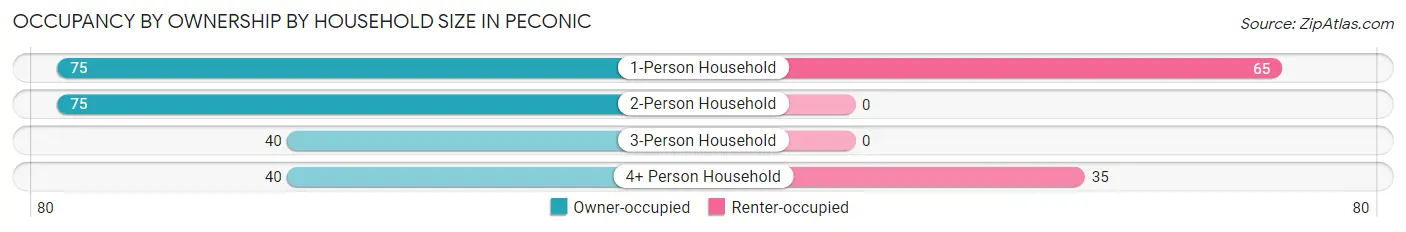
| Household Size | Owner-occupied | Renter-occupied |
| 1-Person Household | 75 (53.6%) | 65 (46.4%) |
| 2-Person Household | 75 (100.0%) | 0 (0.0%) |
| 3-Person Household | 40 (100.0%) | 0 (0.0%) |
| 4+ Person Household | 40 (53.3%) | 35 (46.7%) |
| Total Housing Units | 230 (69.7%) | 100 (30.3%) |
Occupancy by Educational Attainment in Peconic
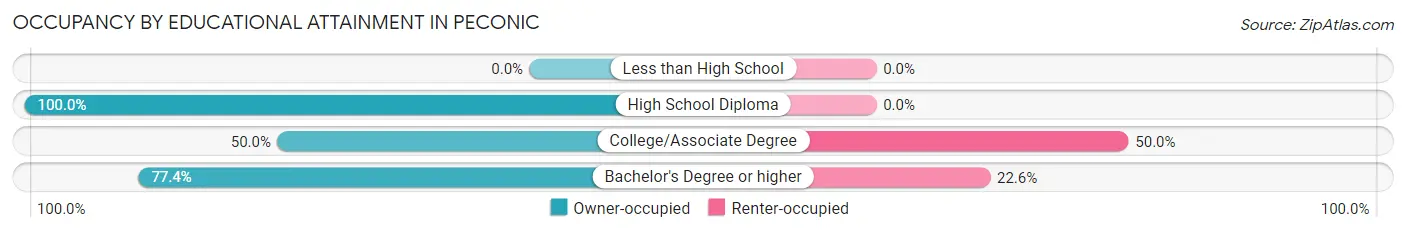
| Household Size | Owner-occupied | Renter-occupied |
| Less than High School | 0 (0.0%) | 0 (0.0%) |
| High School Diploma | 45 (100.0%) | 0 (0.0%) |
| College/Associate Degree | 65 (50.0%) | 65 (50.0%) |
| Bachelor's Degree or higher | 120 (77.4%) | 35 (22.6%) |
Occupancy by Age of Householder in Peconic
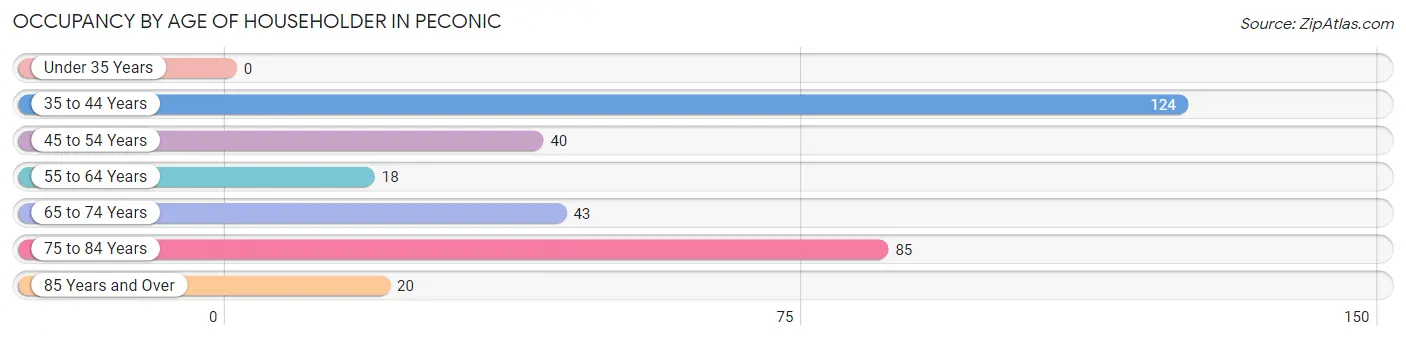
| Age Bracket | # Households | % Households |
| Under 35 Years | 0 | 0.0% |
| 35 to 44 Years | 124 | 37.6% |
| 45 to 54 Years | 40 | 12.1% |
| 55 to 64 Years | 18 | 5.4% |
| 65 to 74 Years | 43 | 13.0% |
| 75 to 84 Years | 85 | 25.8% |
| 85 Years and Over | 20 | 6.1% |
| Total | 330 | 100.0% |
Housing Finances in Peconic
Median Income by Occupancy in Peconic
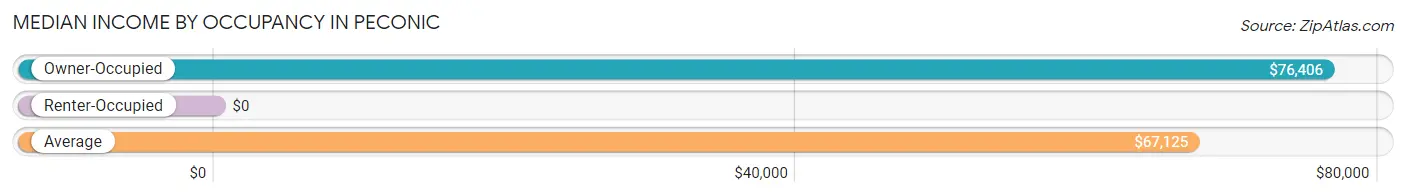
| Occupancy Type | # Households | Median Income |
| Owner-Occupied | 230 (69.7%) | $76,406 |
| Renter-Occupied | 100 (30.3%) | $0 |
| Average | 330 (100.0%) | $67,125 |
Occupancy by Householder Income Bracket in Peconic
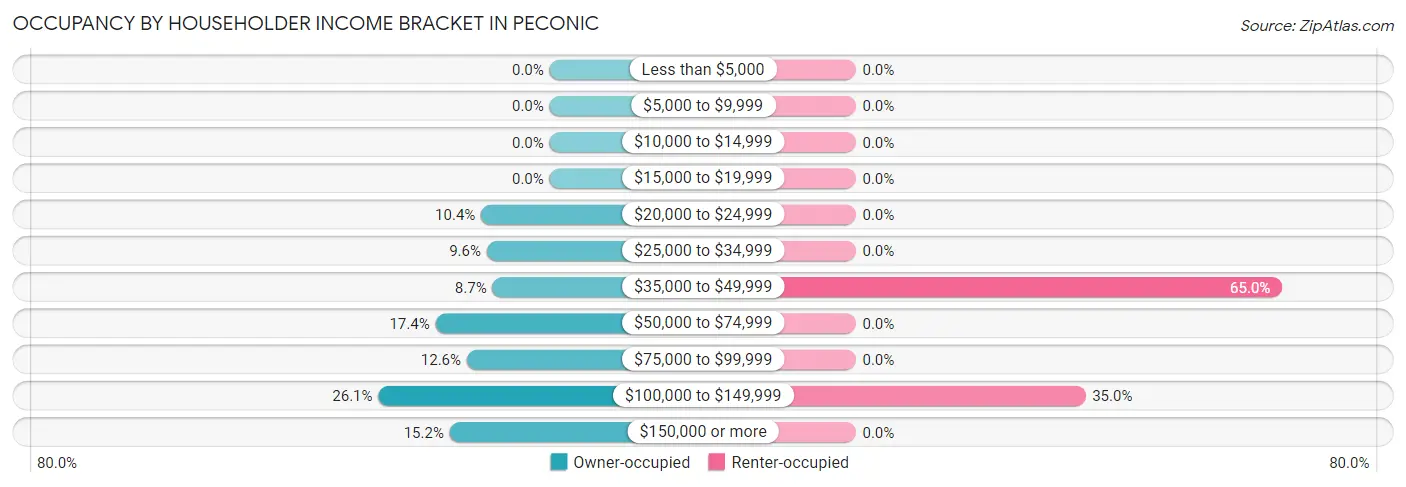
| Income Bracket | Owner-occupied | Renter-occupied |
| Less than $5,000 | 0 (0.0%) | 0 (0.0%) |
| $5,000 to $9,999 | 0 (0.0%) | 0 (0.0%) |
| $10,000 to $14,999 | 0 (0.0%) | 0 (0.0%) |
| $15,000 to $19,999 | 0 (0.0%) | 0 (0.0%) |
| $20,000 to $24,999 | 24 (10.4%) | 0 (0.0%) |
| $25,000 to $34,999 | 22 (9.6%) | 0 (0.0%) |
| $35,000 to $49,999 | 20 (8.7%) | 65 (65.0%) |
| $50,000 to $74,999 | 40 (17.4%) | 0 (0.0%) |
| $75,000 to $99,999 | 29 (12.6%) | 0 (0.0%) |
| $100,000 to $149,999 | 60 (26.1%) | 35 (35.0%) |
| $150,000 or more | 35 (15.2%) | 0 (0.0%) |
| Total | 230 (100.0%) | 100 (100.0%) |
Monthly Housing Cost Tiers in Peconic
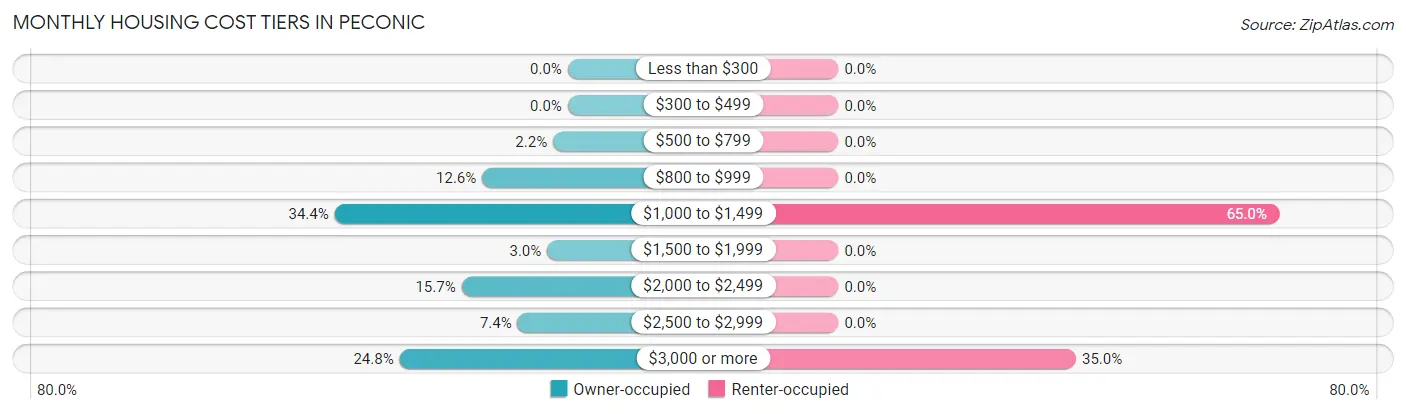
| Monthly Cost | Owner-occupied | Renter-occupied |
| Less than $300 | 0 (0.0%) | 0 (0.0%) |
| $300 to $499 | 0 (0.0%) | 0 (0.0%) |
| $500 to $799 | 5 (2.2%) | 0 (0.0%) |
| $800 to $999 | 29 (12.6%) | 0 (0.0%) |
| $1,000 to $1,499 | 79 (34.4%) | 65 (65.0%) |
| $1,500 to $1,999 | 7 (3.0%) | 0 (0.0%) |
| $2,000 to $2,499 | 36 (15.7%) | 0 (0.0%) |
| $2,500 to $2,999 | 17 (7.4%) | 0 (0.0%) |
| $3,000 or more | 57 (24.8%) | 35 (35.0%) |
| Total | 230 (100.0%) | 100 (100.0%) |
Physical Housing Characteristics in Peconic
Housing Structures in Peconic
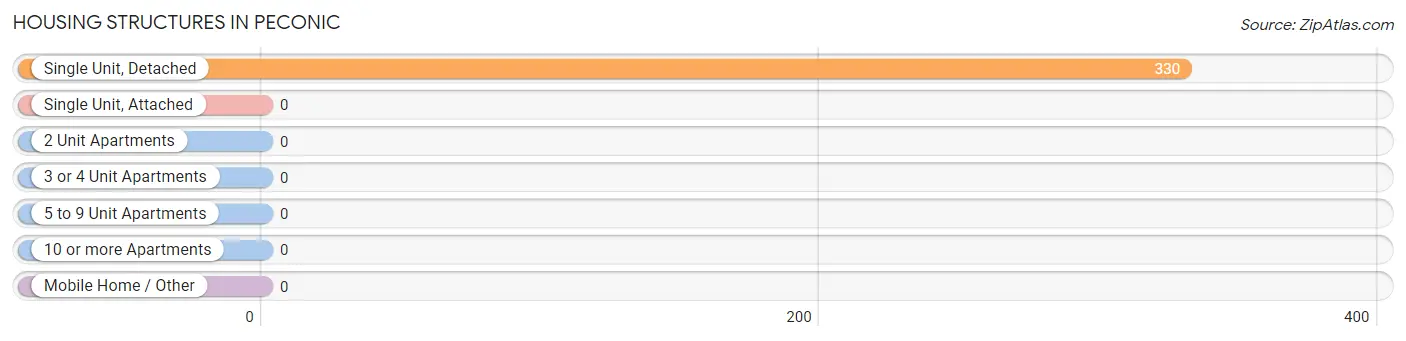
| Structure Type | # Housing Units | % Housing Units |
| Single Unit, Detached | 330 | 100.0% |
| Single Unit, Attached | 0 | 0.0% |
| 2 Unit Apartments | 0 | 0.0% |
| 3 or 4 Unit Apartments | 0 | 0.0% |
| 5 to 9 Unit Apartments | 0 | 0.0% |
| 10 or more Apartments | 0 | 0.0% |
| Mobile Home / Other | 0 | 0.0% |
| Total | 330 | 100.0% |
Housing Structures by Occupancy in Peconic
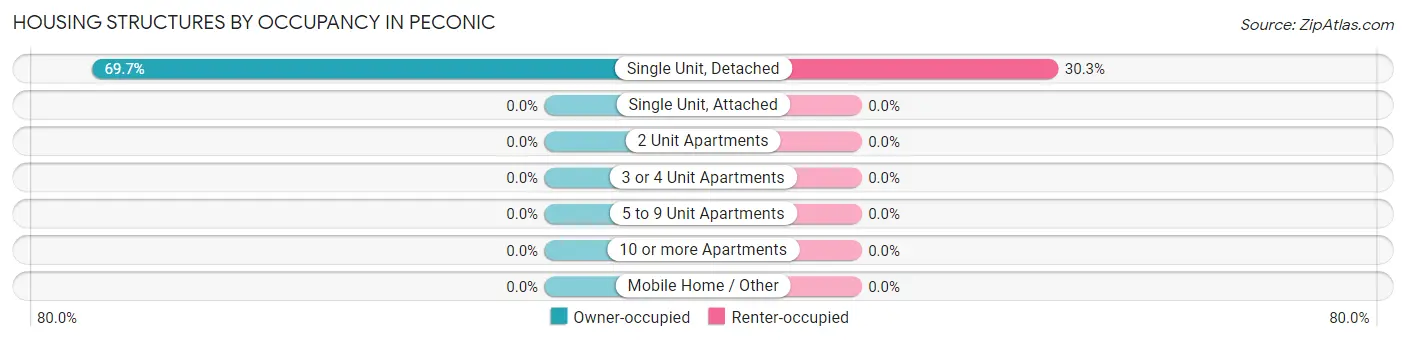
| Structure Type | Owner-occupied | Renter-occupied |
| Single Unit, Detached | 230 (69.7%) | 100 (30.3%) |
| Single Unit, Attached | 0 (0.0%) | 0 (0.0%) |
| 2 Unit Apartments | 0 (0.0%) | 0 (0.0%) |
| 3 or 4 Unit Apartments | 0 (0.0%) | 0 (0.0%) |
| 5 to 9 Unit Apartments | 0 (0.0%) | 0 (0.0%) |
| 10 or more Apartments | 0 (0.0%) | 0 (0.0%) |
| Mobile Home / Other | 0 (0.0%) | 0 (0.0%) |
| Total | 230 (69.7%) | 100 (30.3%) |
Housing Structures by Number of Rooms in Peconic
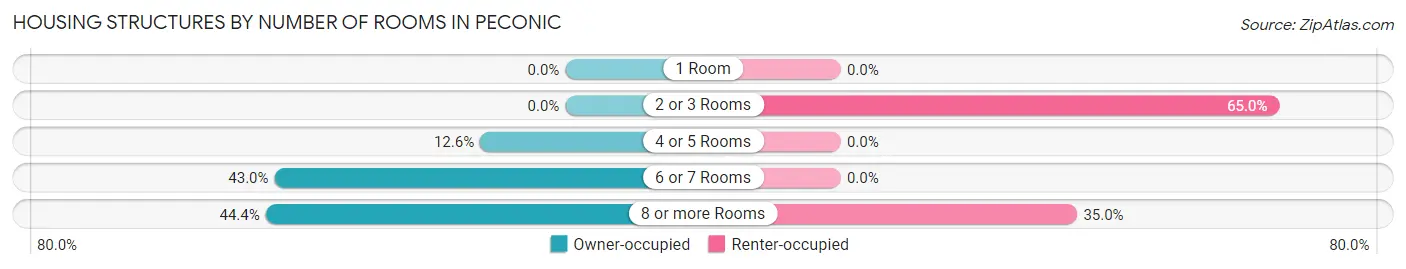
| Number of Rooms | Owner-occupied | Renter-occupied |
| 1 Room | 0 (0.0%) | 0 (0.0%) |
| 2 or 3 Rooms | 0 (0.0%) | 65 (65.0%) |
| 4 or 5 Rooms | 29 (12.6%) | 0 (0.0%) |
| 6 or 7 Rooms | 99 (43.0%) | 0 (0.0%) |
| 8 or more Rooms | 102 (44.4%) | 35 (35.0%) |
| Total | 230 (100.0%) | 100 (100.0%) |
Housing Structure by Heating Type in Peconic
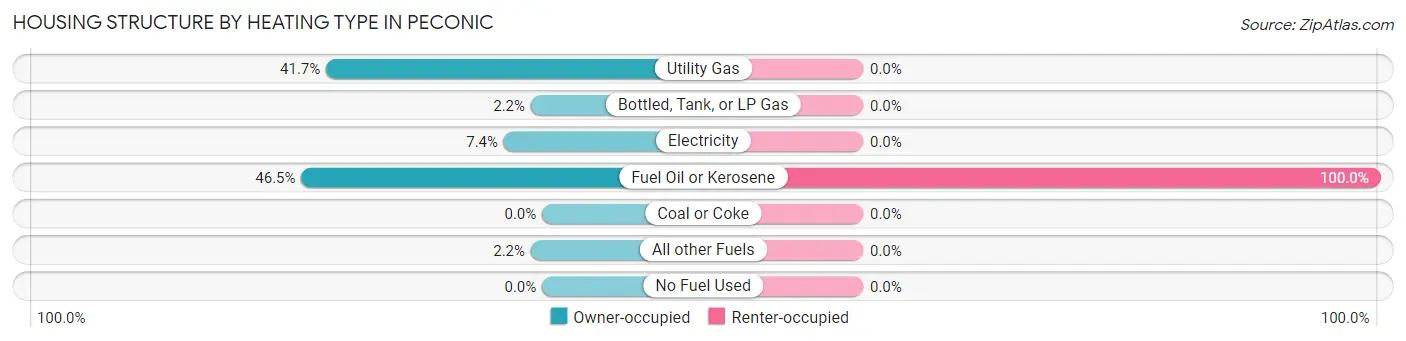
| Heating Type | Owner-occupied | Renter-occupied |
| Utility Gas | 96 (41.7%) | 0 (0.0%) |
| Bottled, Tank, or LP Gas | 5 (2.2%) | 0 (0.0%) |
| Electricity | 17 (7.4%) | 0 (0.0%) |
| Fuel Oil or Kerosene | 107 (46.5%) | 100 (100.0%) |
| Coal or Coke | 0 (0.0%) | 0 (0.0%) |
| All other Fuels | 5 (2.2%) | 0 (0.0%) |
| No Fuel Used | 0 (0.0%) | 0 (0.0%) |
| Total | 230 (100.0%) | 100 (100.0%) |
Household Vehicle Usage in Peconic
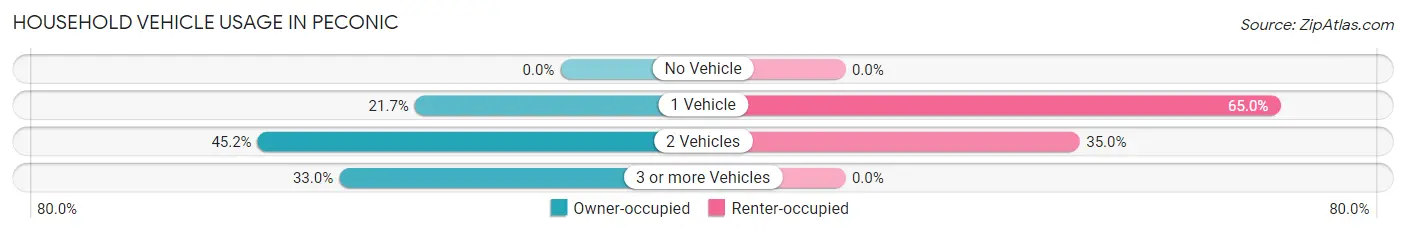
| Vehicles per Household | Owner-occupied | Renter-occupied |
| No Vehicle | 0 (0.0%) | 0 (0.0%) |
| 1 Vehicle | 50 (21.7%) | 65 (65.0%) |
| 2 Vehicles | 104 (45.2%) | 35 (35.0%) |
| 3 or more Vehicles | 76 (33.0%) | 0 (0.0%) |
| Total | 230 (100.0%) | 100 (100.0%) |
Real Estate & Mortgages in Peconic
Real Estate and Mortgage Overview in Peconic
| Characteristic | Without Mortgage | With Mortgage |
| Housing Units | 120 | 110 |
| Median Property Value | $500,000 | $916,700 |
| Median Household Income | $67,188 | $17 |
| Monthly Housing Costs | $1,065 | $57 |
| Real Estate Taxes | $7,174 | $0 |
Property Value by Mortgage Status in Peconic
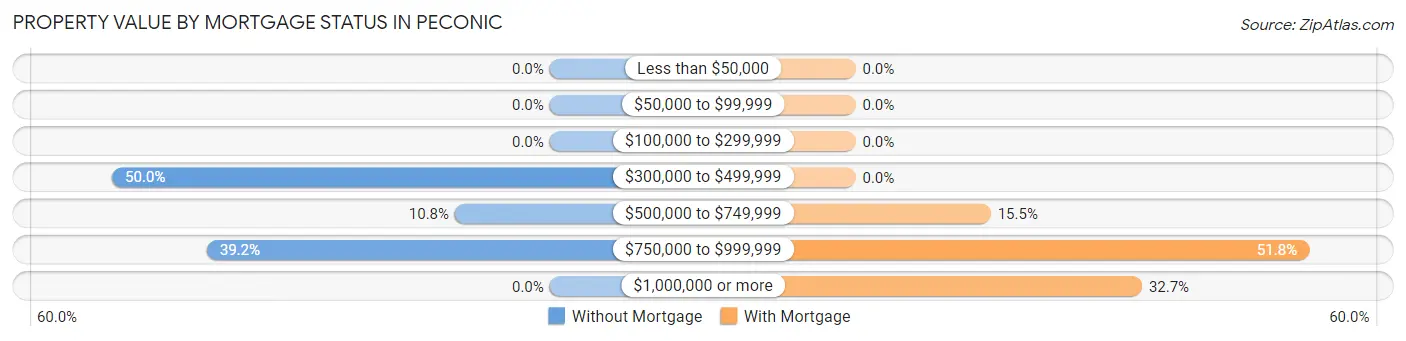
| Property Value | Without Mortgage | With Mortgage |
| Less than $50,000 | 0 (0.0%) | 0 (0.0%) |
| $50,000 to $99,999 | 0 (0.0%) | 0 (0.0%) |
| $100,000 to $299,999 | 0 (0.0%) | 0 (0.0%) |
| $300,000 to $499,999 | 60 (50.0%) | 0 (0.0%) |
| $500,000 to $749,999 | 13 (10.8%) | 17 (15.4%) |
| $750,000 to $999,999 | 47 (39.2%) | 57 (51.8%) |
| $1,000,000 or more | 0 (0.0%) | 36 (32.7%) |
| Total | 120 (100.0%) | 110 (100.0%) |
Household Income by Mortgage Status in Peconic
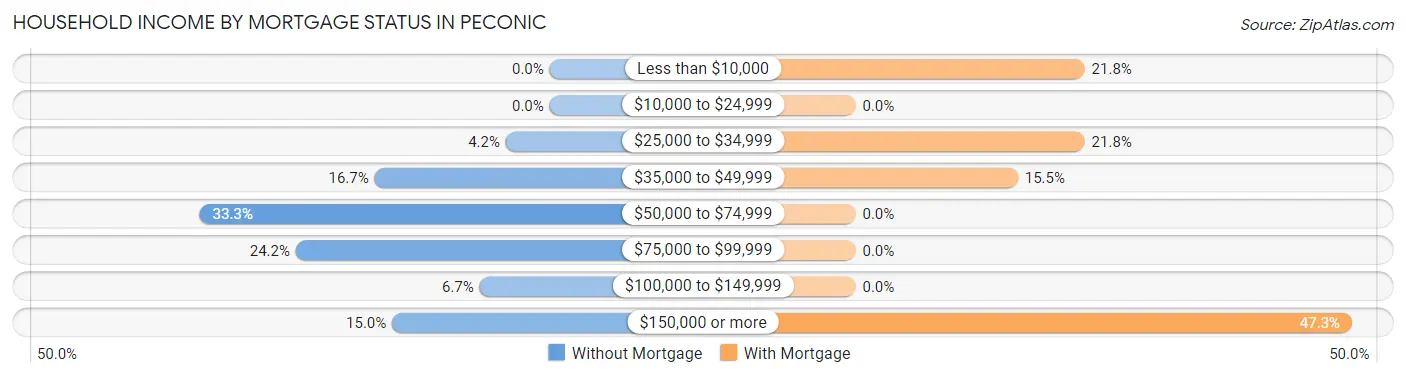
| Household Income | Without Mortgage | With Mortgage |
| Less than $10,000 | 0 (0.0%) | 24 (21.8%) |
| $10,000 to $24,999 | 0 (0.0%) | 0 (0.0%) |
| $25,000 to $34,999 | 5 (4.2%) | 24 (21.8%) |
| $35,000 to $49,999 | 20 (16.7%) | 17 (15.4%) |
| $50,000 to $74,999 | 40 (33.3%) | 0 (0.0%) |
| $75,000 to $99,999 | 29 (24.2%) | 0 (0.0%) |
| $100,000 to $149,999 | 8 (6.7%) | 0 (0.0%) |
| $150,000 or more | 18 (15.0%) | 52 (47.3%) |
| Total | 120 (100.0%) | 110 (100.0%) |
Property Value to Household Income Ratio in Peconic
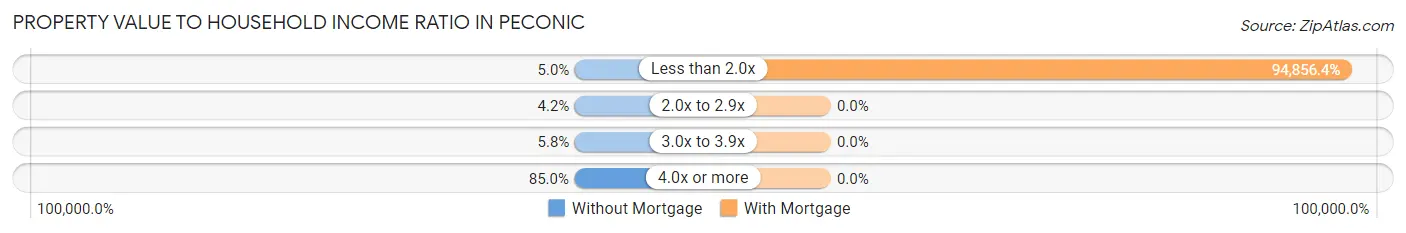
| Value-to-Income Ratio | Without Mortgage | With Mortgage |
| Less than 2.0x | 6 (5.0%) | 104,342 (94,856.4%) |
| 2.0x to 2.9x | 5 (4.2%) | 0 (0.0%) |
| 3.0x to 3.9x | 7 (5.8%) | 0 (0.0%) |
| 4.0x or more | 102 (85.0%) | 0 (0.0%) |
| Total | 120 (100.0%) | 110 (100.0%) |
Real Estate Taxes by Mortgage Status in Peconic
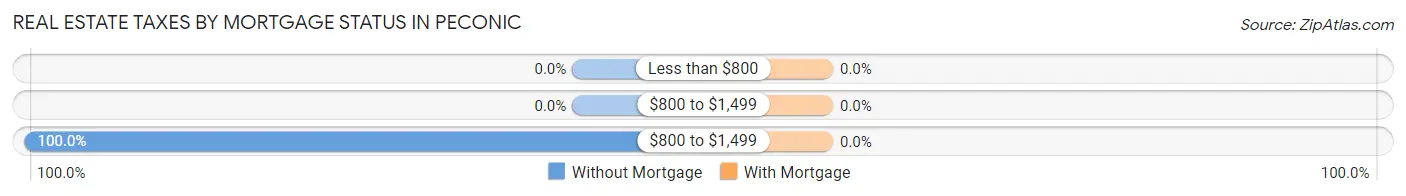
| Property Taxes | Without Mortgage | With Mortgage |
| Less than $800 | 0 (0.0%) | 0 (0.0%) |
| $800 to $1,499 | 0 (0.0%) | 0 (0.0%) |
| $800 to $1,499 | 120 (100.0%) | 0 (0.0%) |
| Total | 120 (100.0%) | 110 (100.0%) |
Health & Disability in Peconic
Health Insurance Coverage by Age in Peconic
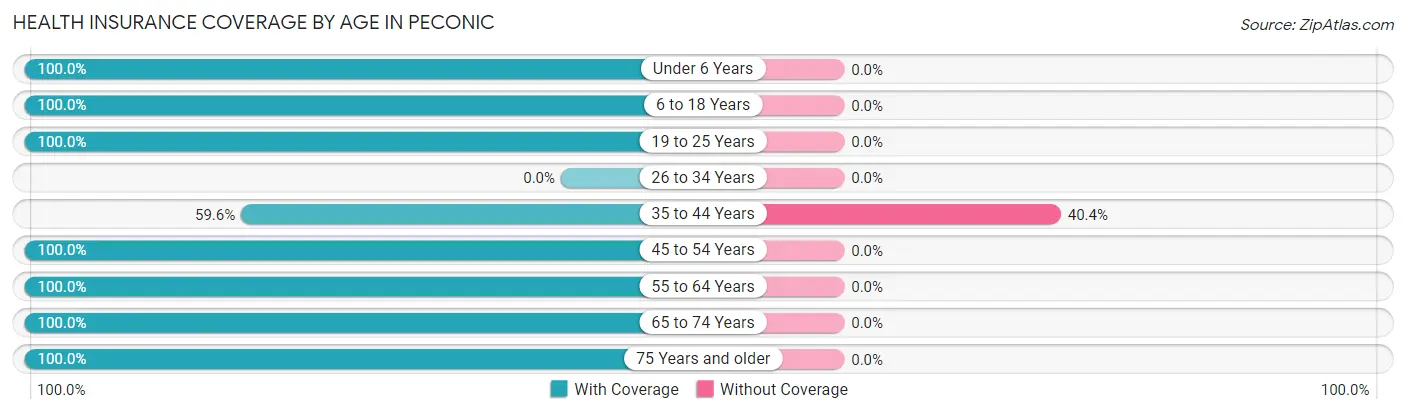
| Age Bracket | With Coverage | Without Coverage |
| Under 6 Years | 76 (100.0%) | 0 (0.0%) |
| 6 to 18 Years | 137 (100.0%) | 0 (0.0%) |
| 19 to 25 Years | 52 (100.0%) | 0 (0.0%) |
| 26 to 34 Years | 0 (0.0%) | 0 (0.0%) |
| 35 to 44 Years | 96 (59.6%) | 65 (40.4%) |
| 45 to 54 Years | 81 (100.0%) | 0 (0.0%) |
| 55 to 64 Years | 81 (100.0%) | 0 (0.0%) |
| 65 to 74 Years | 94 (100.0%) | 0 (0.0%) |
| 75 Years and older | 111 (100.0%) | 0 (0.0%) |
| Total | 728 (91.8%) | 65 (8.2%) |
Health Insurance Coverage by Citizenship Status in Peconic
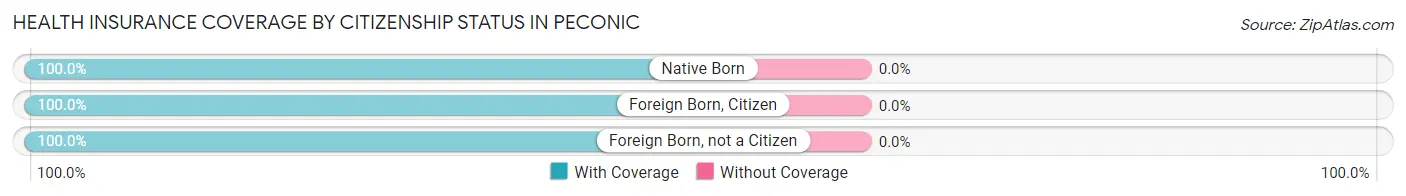
| Citizenship Status | With Coverage | Without Coverage |
| Native Born | 76 (100.0%) | 0 (0.0%) |
| Foreign Born, Citizen | 137 (100.0%) | 0 (0.0%) |
| Foreign Born, not a Citizen | 52 (100.0%) | 0 (0.0%) |
Health Insurance Coverage by Household Income in Peconic
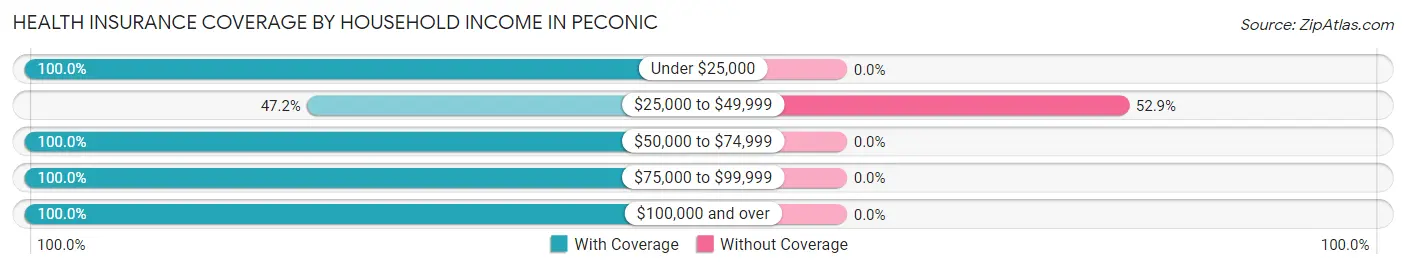
| Household Income | With Coverage | Without Coverage |
| Under $25,000 | 24 (100.0%) | 0 (0.0%) |
| $25,000 to $49,999 | 58 (47.1%) | 65 (52.8%) |
| $50,000 to $74,999 | 137 (100.0%) | 0 (0.0%) |
| $75,000 to $99,999 | 45 (100.0%) | 0 (0.0%) |
| $100,000 and over | 464 (100.0%) | 0 (0.0%) |
Public vs Private Health Insurance Coverage by Age in Peconic
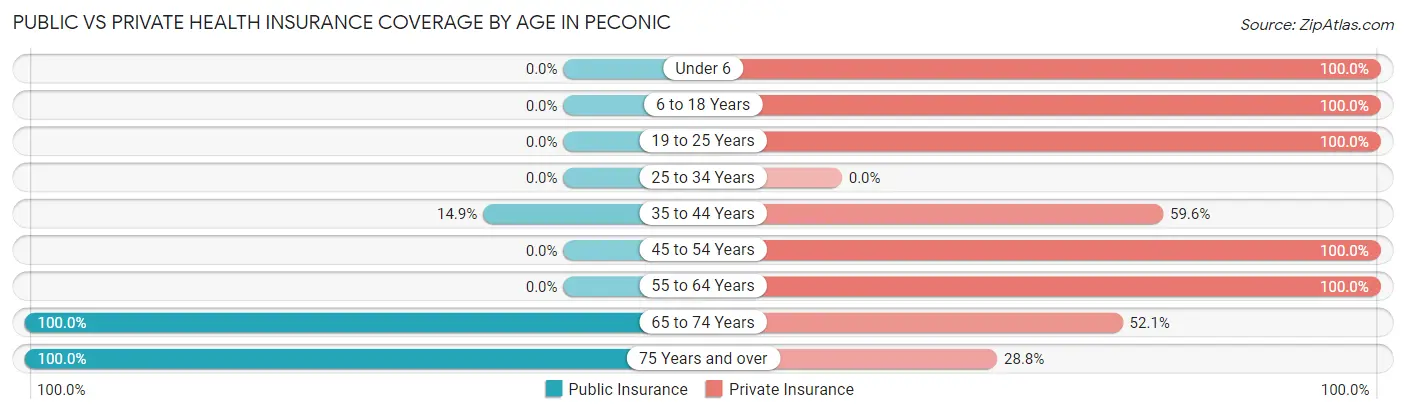
| Age Bracket | Public Insurance | Private Insurance |
| Under 6 | 0 (0.0%) | 76 (100.0%) |
| 6 to 18 Years | 0 (0.0%) | 137 (100.0%) |
| 19 to 25 Years | 0 (0.0%) | 52 (100.0%) |
| 25 to 34 Years | 0 (0.0%) | 0 (0.0%) |
| 35 to 44 Years | 24 (14.9%) | 96 (59.6%) |
| 45 to 54 Years | 0 (0.0%) | 81 (100.0%) |
| 55 to 64 Years | 0 (0.0%) | 81 (100.0%) |
| 65 to 74 Years | 94 (100.0%) | 49 (52.1%) |
| 75 Years and over | 111 (100.0%) | 32 (28.8%) |
| Total | 229 (28.9%) | 604 (76.2%) |
Disability Status by Sex by Age in Peconic
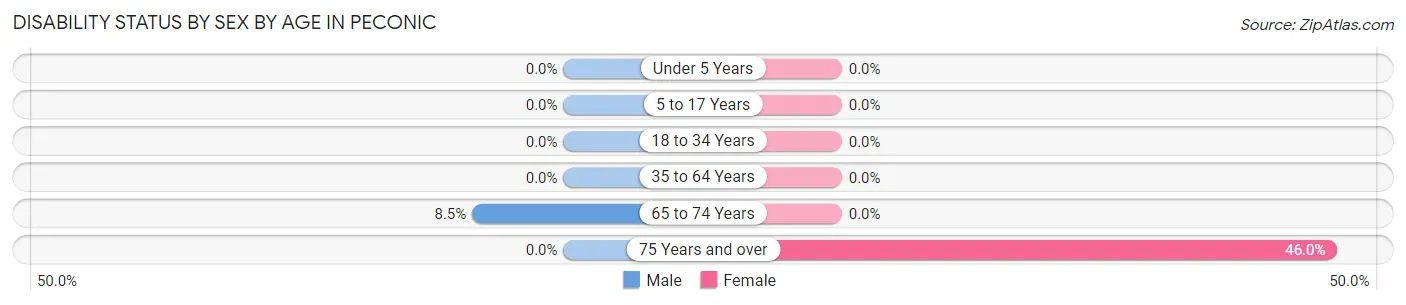
| Age Bracket | Male | Female |
| Under 5 Years | 0 (0.0%) | 0 (0.0%) |
| 5 to 17 Years | 0 (0.0%) | 0 (0.0%) |
| 18 to 34 Years | 0 (0.0%) | 0 (0.0%) |
| 35 to 64 Years | 0 (0.0%) | 0 (0.0%) |
| 65 to 74 Years | 5 (8.5%) | 0 (0.0%) |
| 75 Years and over | 0 (0.0%) | 40 (46.0%) |
Disability Class by Sex by Age in Peconic
Disability Class: Hearing Difficulty
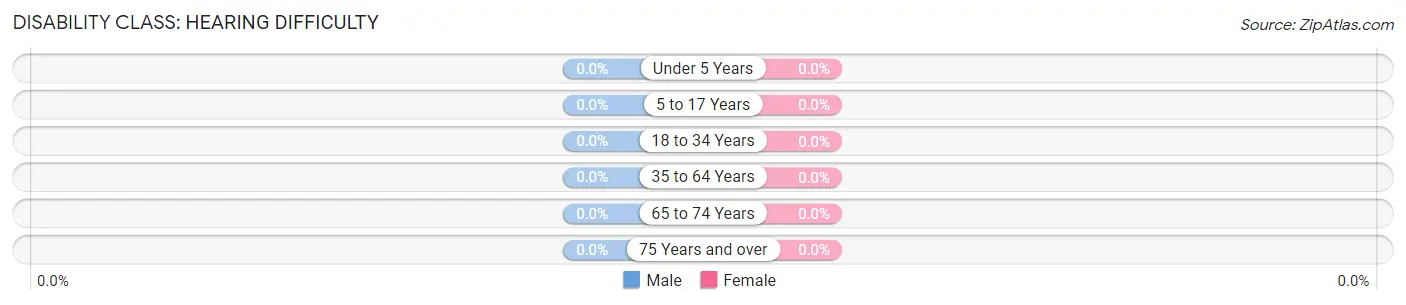
| Age Bracket | Male | Female |
| Under 5 Years | 0 (0.0%) | 0 (0.0%) |
| 5 to 17 Years | 0 (0.0%) | 0 (0.0%) |
| 18 to 34 Years | 0 (0.0%) | 0 (0.0%) |
| 35 to 64 Years | 0 (0.0%) | 0 (0.0%) |
| 65 to 74 Years | 0 (0.0%) | 0 (0.0%) |
| 75 Years and over | 0 (0.0%) | 0 (0.0%) |
Disability Class: Vision Difficulty
| Age Bracket | Male | Female |
| Under 5 Years | 0 (0.0%) | 0 (0.0%) |
| 5 to 17 Years | 0 (0.0%) | 0 (0.0%) |
| 18 to 34 Years | 0 (0.0%) | 0 (0.0%) |
| 35 to 64 Years | 0 (0.0%) | 0 (0.0%) |
| 65 to 74 Years | 0 (0.0%) | 0 (0.0%) |
| 75 Years and over | 0 (0.0%) | 0 (0.0%) |
Disability Class: Cognitive Difficulty
| Age Bracket | Male | Female |
| 5 to 17 Years | 0 (0.0%) | 0 (0.0%) |
| 18 to 34 Years | 0 (0.0%) | 0 (0.0%) |
| 35 to 64 Years | 0 (0.0%) | 0 (0.0%) |
| 65 to 74 Years | 0 (0.0%) | 0 (0.0%) |
| 75 Years and over | 0 (0.0%) | 0 (0.0%) |
Disability Class: Ambulatory Difficulty
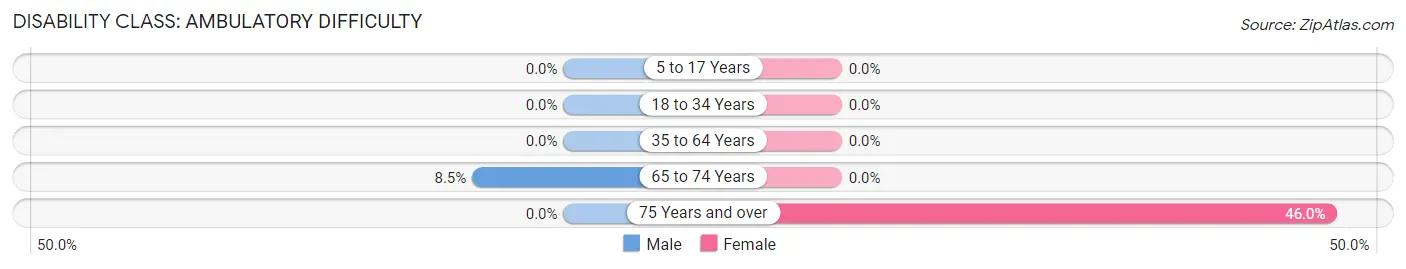
| Age Bracket | Male | Female |
| 5 to 17 Years | 0 (0.0%) | 0 (0.0%) |
| 18 to 34 Years | 0 (0.0%) | 0 (0.0%) |
| 35 to 64 Years | 0 (0.0%) | 0 (0.0%) |
| 65 to 74 Years | 5 (8.5%) | 0 (0.0%) |
| 75 Years and over | 0 (0.0%) | 40 (46.0%) |
Disability Class: Self-Care Difficulty
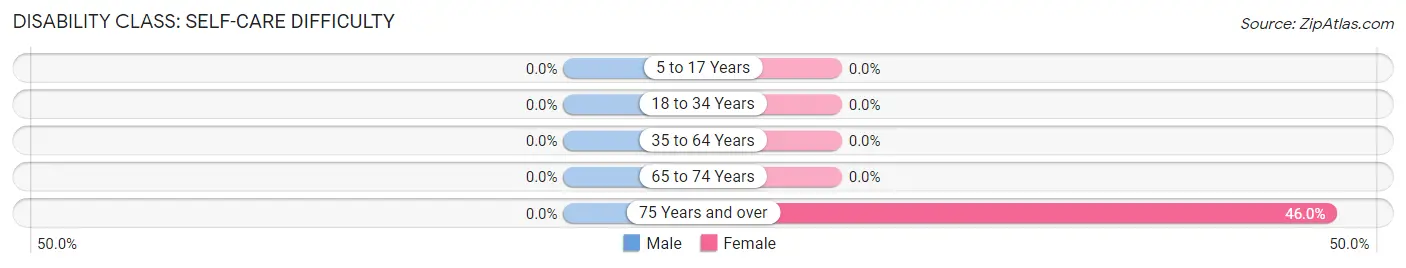
| Age Bracket | Male | Female |
| 5 to 17 Years | 0 (0.0%) | 0 (0.0%) |
| 18 to 34 Years | 0 (0.0%) | 0 (0.0%) |
| 35 to 64 Years | 0 (0.0%) | 0 (0.0%) |
| 65 to 74 Years | 0 (0.0%) | 0 (0.0%) |
| 75 Years and over | 0 (0.0%) | 40 (46.0%) |
Technology Access in Peconic
Computing Device Access in Peconic
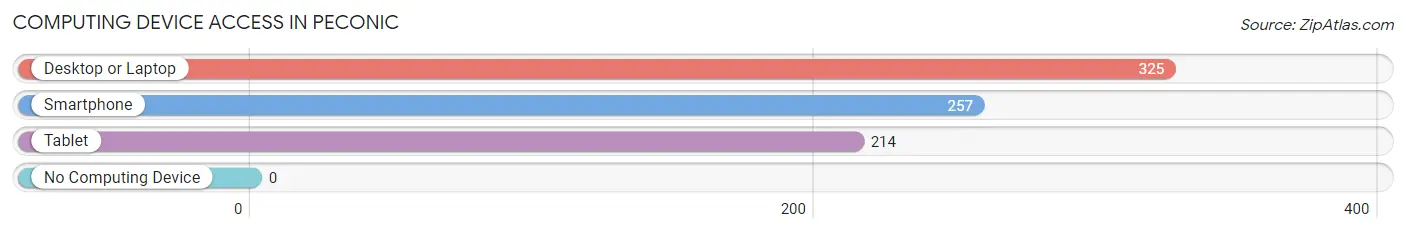
| Device Type | # Households | % Households |
| Desktop or Laptop | 325 | 98.5% |
| Smartphone | 257 | 77.9% |
| Tablet | 214 | 64.8% |
| No Computing Device | 0 | 0.0% |
| Total | 330 | 100.0% |
Internet Access in Peconic
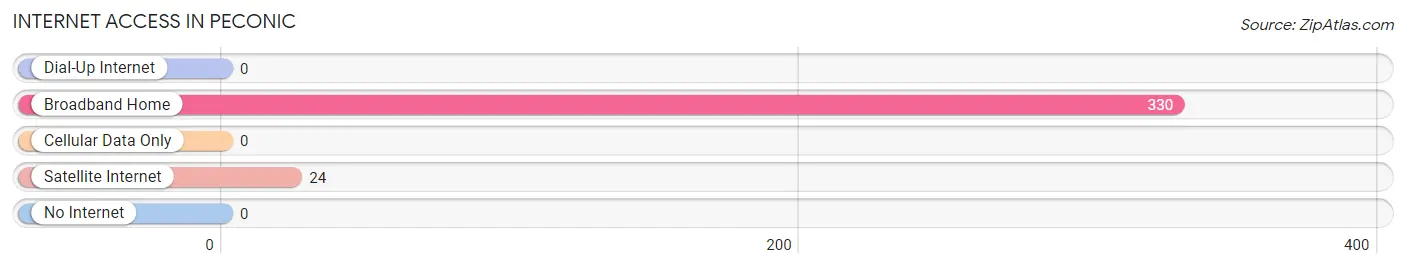
| Internet Type | # Households | % Households |
| Dial-Up Internet | 0 | 0.0% |
| Broadband Home | 330 | 100.0% |
| Cellular Data Only | 0 | 0.0% |
| Satellite Internet | 24 | 7.3% |
| No Internet | 0 | 0.0% |
| Total | 330 | 100.0% |
Peconic Summary
Peconic is a hamlet located in Suffolk County, New York, United States. It is situated in the Town of Southold, on the North Fork of Long Island. The hamlet is located on the Peconic Bay, which is part of the Great South Bay estuary system. The population of Peconic was 1,717 at the 2010 census.
History
The area now known as Peconic was originally inhabited by the Algonquian-speaking Manhanset Indians. The first European settlers arrived in the area in 1640, and the hamlet was officially established in 1649. The name Peconic is derived from the Algonquian word for “nut-bearing tree”, referring to the abundance of chestnut trees in the area.
In the late 19th century, Peconic was a popular summer resort destination for wealthy New Yorkers. The area was home to several grand hotels, including the Peconic House, the Peconic Hotel, and the Peconic Inn. The Peconic Inn was destroyed by fire in 1891, and the other two hotels were demolished in the early 20th century.
Geography
Peconic is located at 40°57'25" North, 72°37'17" West (40.9569, -72.6214). According to the United States Census Bureau, the hamlet has a total area of 2.2 square miles, all of it land.
The hamlet is located on the Peconic Bay, which is part of the Great South Bay estuary system. The bay is a popular destination for recreational activities such as fishing, boating, and swimming.
Economy
The economy of Peconic is largely based on tourism and agriculture. The hamlet is home to several wineries, including the Peconic Bay Winery, the Bedell Cellars, and the Macari Vineyards. The area is also home to several farms, including the Catapano Dairy Farm and the Sang Lee Farms.
The hamlet is also home to several restaurants, including the Peconic Bay Diner, the Peconic Bay Restaurant, and the Peconic Bay Oyster Bar.
Demographics
As of the 2010 census, there were 1,717 people, 717 households, and 463 families residing in the hamlet. The population density was 776.4 people per square mile. The racial makeup of the hamlet was 94.2% White, 1.2% African American, 0.5% Native American, 0.7% Asian, 0.1% Pacific Islander, 1.2% from other races, and 2.1% from two or more races. Hispanic or Latino of any race were 5.2% of the population.
The median age in Peconic was 46.2 years. 22.2% of residents were under the age of 18; 5.7% were between the ages of 18 and 24; 20.3% were from 25 to 44; 33.2% were from 45 to 64; and 18.6% were 65 years of age or older. The gender makeup of the hamlet was 48.2% male and 51.8% female.
The median income for a household in Peconic was $68,750, and the median income for a family was $77,500. Males had a median income of $50,000 versus $41,250 for females. The per capita income for the hamlet was $35,945. About 4.2% of families and 6.2% of the population were below the poverty line, including 8.3% of those under age 18 and 4.2% of those age 65 or over.
Common Questions
What is Per Capita Income in Peconic?
Per Capita income in Peconic is $39,468.
What is the Median Family Income in Peconic?
Median Family Income in Peconic is $104,934.
What is the Median Household income in Peconic?
Median Household Income in Peconic is $67,125.
What is Income or Wage Gap in Peconic?
Income or Wage Gap in Peconic is 52.4%.
Women in Peconic earn 47.6 cents for every dollar earned by a man.
What is Inequality or Gini Index in Peconic?
Inequality or Gini Index in Peconic is 0.38.
What is the Total Population of Peconic?
Total Population of Peconic is 793.
What is the Total Male Population of Peconic?
Total Male Population of Peconic is 331.
What is the Total Female Population of Peconic?
Total Female Population of Peconic is 462.
What is the Ratio of Males per 100 Females in Peconic?
There are 71.65 Males per 100 Females in Peconic.
What is the Ratio of Females per 100 Males in Peconic?
There are 139.58 Females per 100 Males in Peconic.
What is the Median Population Age in Peconic?
Median Population Age in Peconic is 37.7 Years.
What is the Average Family Size in Peconic
Average Family Size in Peconic is 3.5 People.
What is the Average Household Size in Peconic
Average Household Size in Peconic is 2.4 People.
How Large is the Labor Force in Peconic?
There are 314 People in the Labor Forcein in Peconic.
What is the Percentage of People in the Labor Force in Peconic?
51.6% of People are in the Labor Force in Peconic.