Downsville, NY Map & Demographics
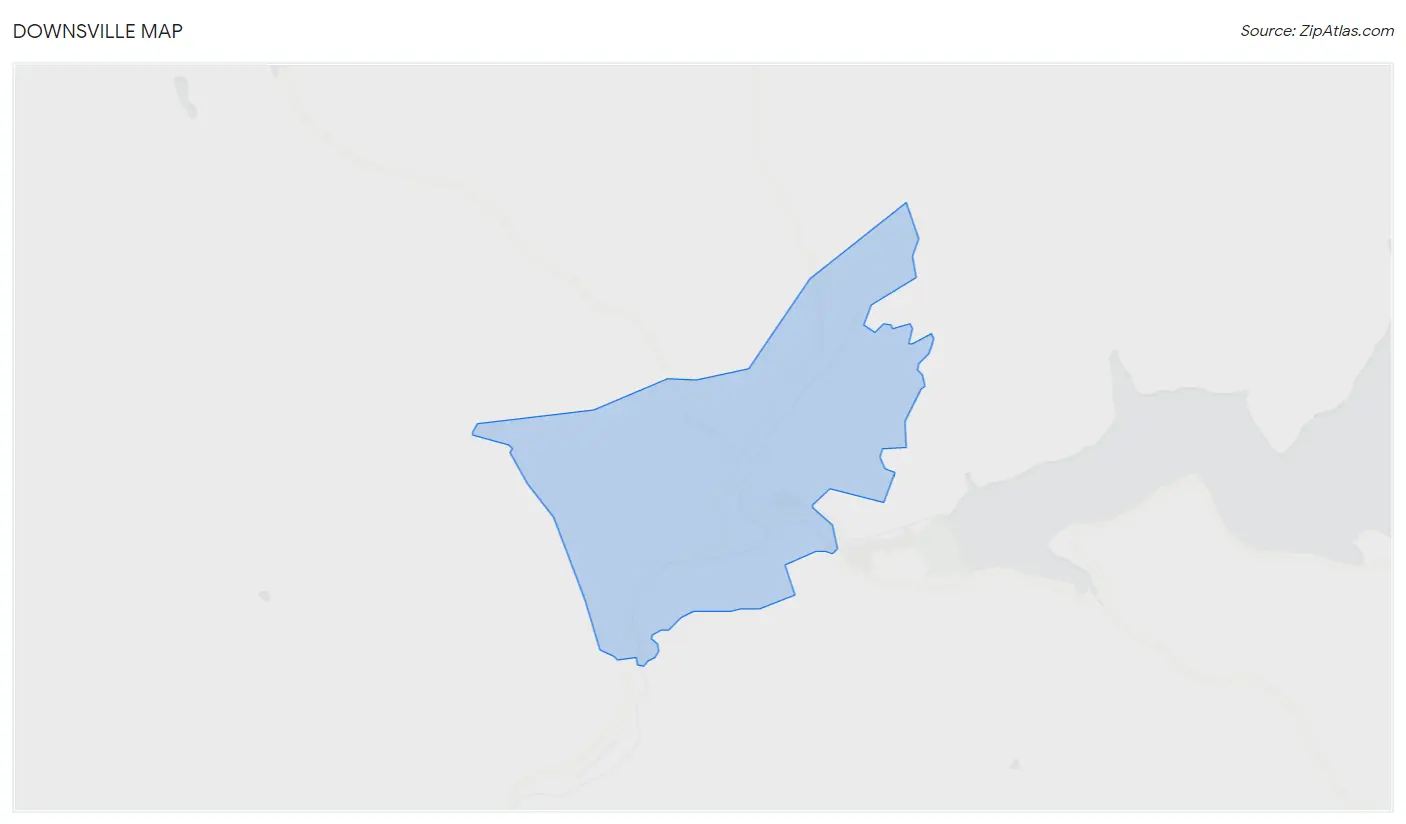
Downsville Map
Downsville Overview
$26,272
PER CAPITA INCOME
$68,482
AVG FAMILY INCOME
0.40
INEQUALITY / GINI INDEX
315
TOTAL POPULATION
150
MALE POPULATION
165
FEMALE POPULATION
90.91
MALES / 100 FEMALES
110.00
FEMALES / 100 MALES
61.3
MEDIAN AGE
2.7
AVG FAMILY SIZE
2.1
AVG HOUSEHOLD SIZE
137
LABOR FORCE [ PEOPLE ]
50.0%
PERCENT IN LABOR FORCE
4.4%
UNEMPLOYMENT RATE
Downsville Zip Codes
Downsville Area Codes
Income in Downsville
Income Overview in Downsville
| Characteristic | Number | Measure |
| Per Capita Income | 315 | $26,272 |
| Median Family Income | 101 | $68,482 |
| Mean Family Income | 101 | $62,508 |
| Median Household Income | 147 | $0 |
| Mean Household Income | 147 | $54,159 |
| Income Deficit | 101 | $0 |
| Wage / Income Gap (%) | 315 | 0.00% |
| Wage / Income Gap ($) | 315 | 100.00¢ per $1 |
| Gini / Inequality Index | 315 | 0.40 |
Earnings by Sex in Downsville
| Sex | Number | Average Earnings |
| Male | 99 (60.7%) | $0 |
| Female | 64 (39.3%) | $0 |
| Total | 163 (100.0%) | $0 |
Earnings by Sex by Income Bracket in Downsville
The most common earnings brackets in Downsville are $7,500 to $9,999 for men (25 | 25.3%) and $40,000 to $44,999 for women (21 | 32.8%).
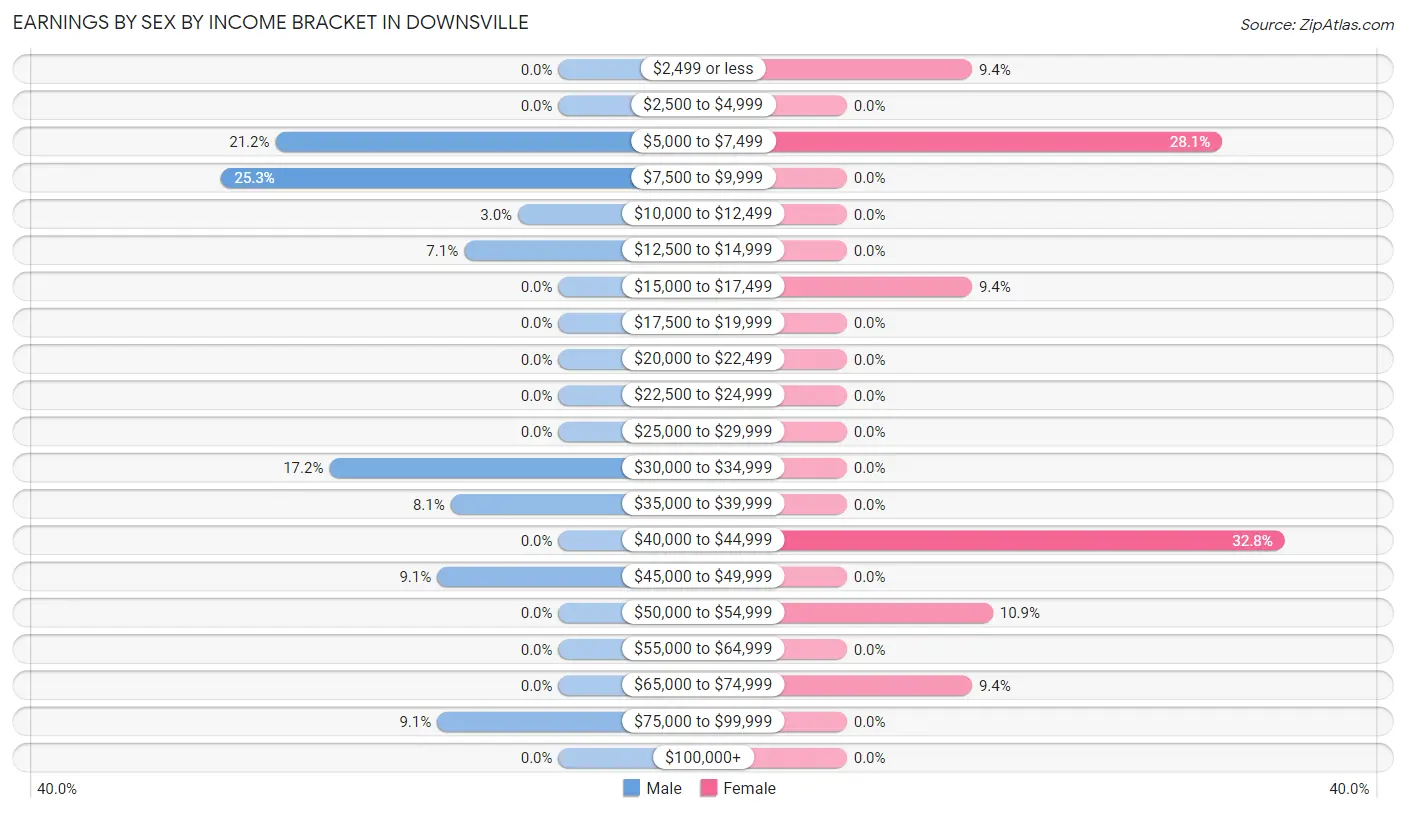
| Income | Male | Female |
| $2,499 or less | 0 (0.0%) | 6 (9.4%) |
| $2,500 to $4,999 | 0 (0.0%) | 0 (0.0%) |
| $5,000 to $7,499 | 21 (21.2%) | 18 (28.1%) |
| $7,500 to $9,999 | 25 (25.3%) | 0 (0.0%) |
| $10,000 to $12,499 | 3 (3.0%) | 0 (0.0%) |
| $12,500 to $14,999 | 7 (7.1%) | 0 (0.0%) |
| $15,000 to $17,499 | 0 (0.0%) | 6 (9.4%) |
| $17,500 to $19,999 | 0 (0.0%) | 0 (0.0%) |
| $20,000 to $22,499 | 0 (0.0%) | 0 (0.0%) |
| $22,500 to $24,999 | 0 (0.0%) | 0 (0.0%) |
| $25,000 to $29,999 | 0 (0.0%) | 0 (0.0%) |
| $30,000 to $34,999 | 17 (17.2%) | 0 (0.0%) |
| $35,000 to $39,999 | 8 (8.1%) | 0 (0.0%) |
| $40,000 to $44,999 | 0 (0.0%) | 21 (32.8%) |
| $45,000 to $49,999 | 9 (9.1%) | 0 (0.0%) |
| $50,000 to $54,999 | 0 (0.0%) | 7 (10.9%) |
| $55,000 to $64,999 | 0 (0.0%) | 0 (0.0%) |
| $65,000 to $74,999 | 0 (0.0%) | 6 (9.4%) |
| $75,000 to $99,999 | 9 (9.1%) | 0 (0.0%) |
| $100,000+ | 0 (0.0%) | 0 (0.0%) |
| Total | 99 (100.0%) | 64 (100.0%) |
Earnings by Sex by Educational Attainment in Downsville
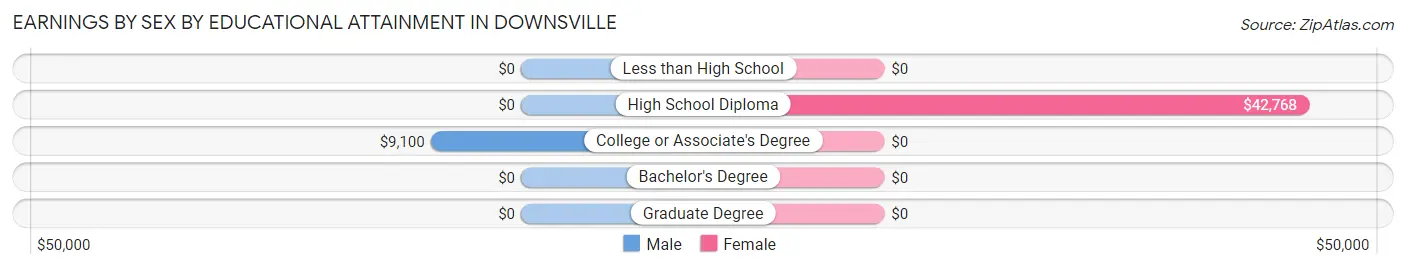
| Educational Attainment | Male Income | Female Income |
| Less than High School | - | - |
| High School Diploma | - | - |
| College or Associate's Degree | $9,100 | $0 |
| Bachelor's Degree | - | - |
| Graduate Degree | - | - |
| Total | - | - |
Family Income in Downsville
Family Income Brackets in Downsville
According to the Downsville family income data, there are 25 families falling into the less than $10,000 income range, which is the most common income bracket and makes up 24.7% of all families.
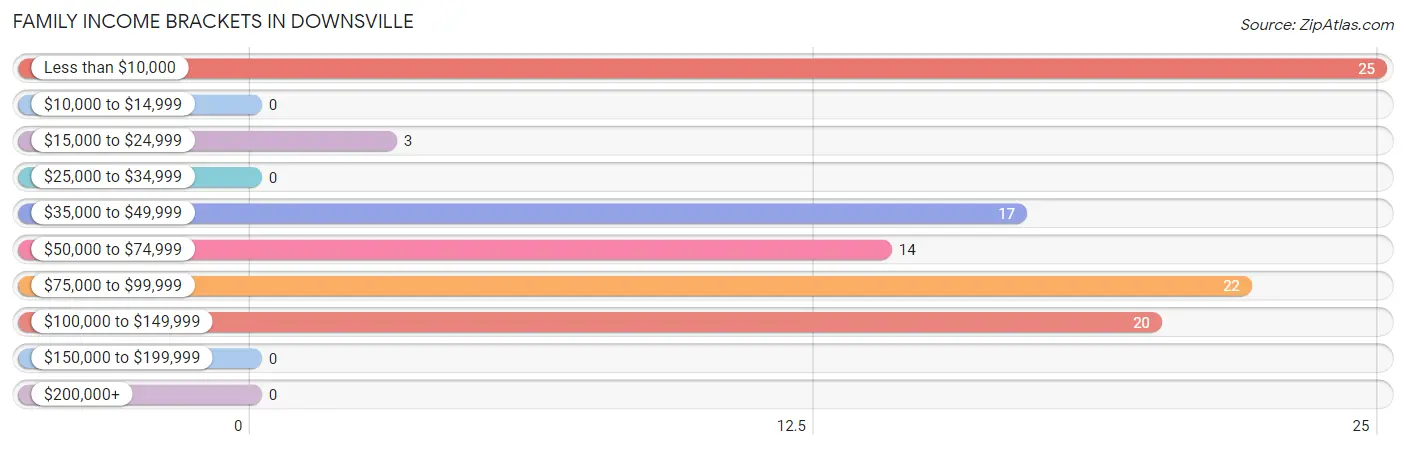
| Income Bracket | # Families | % Families |
| Less than $10,000 | 25 | 24.8% |
| $10,000 to $14,999 | 0 | 0.0% |
| $15,000 to $24,999 | 3 | 3.0% |
| $25,000 to $34,999 | 0 | 0.0% |
| $35,000 to $49,999 | 17 | 16.8% |
| $50,000 to $74,999 | 14 | 13.9% |
| $75,000 to $99,999 | 22 | 21.8% |
| $100,000 to $149,999 | 20 | 19.8% |
| $150,000 to $199,999 | 0 | 0.0% |
| $200,000+ | 0 | 0.0% |
Family Income by Famaliy Size in Downsville
| Income Bracket | # Families | Median Income |
| 2-Person Families | 62 (61.4%) | $0 |
| 3-Person Families | 32 (31.7%) | $0 |
| 4-Person Families | 0 (0.0%) | $0 |
| 5-Person Families | 7 (6.9%) | $0 |
| 6-Person Families | 0 (0.0%) | $0 |
| 7+ Person Families | 0 (0.0%) | $0 |
| Total | 101 (100.0%) | $68,482 |
Family Income by Number of Earners in Downsville
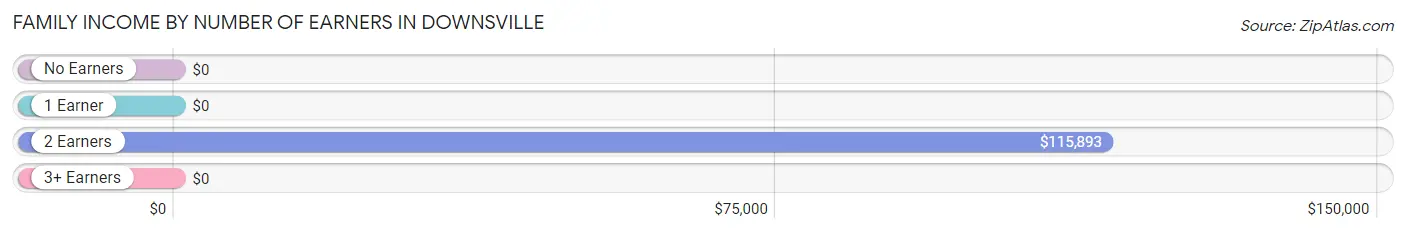
| Number of Earners | # Families | Median Income |
| No Earners | 14 (13.9%) | $0 |
| 1 Earner | 57 (56.4%) | $0 |
| 2 Earners | 23 (22.8%) | $115,893 |
| 3+ Earners | 7 (6.9%) | $0 |
| Total | 101 (100.0%) | $68,482 |
Household Income in Downsville
Household Income Brackets in Downsville
With 36 households falling in the category, the $75,000 to $99,999 income range is the most frequent in Downsville, accounting for 24.5% of all households.
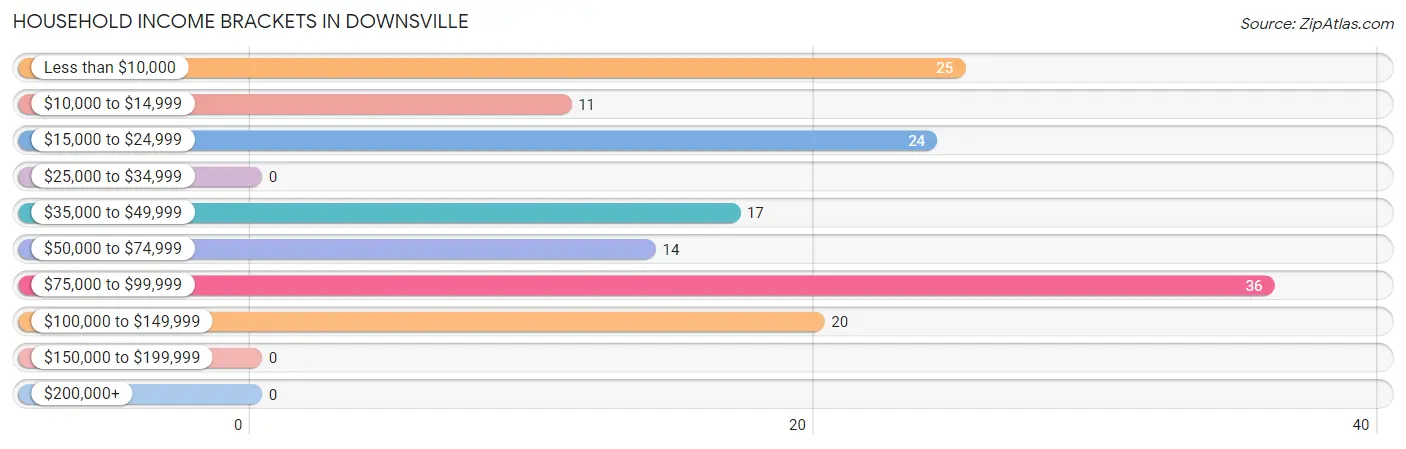
| Income Bracket | # Households | % Households |
| Less than $10,000 | 25 | 17.0% |
| $10,000 to $14,999 | 11 | 7.5% |
| $15,000 to $24,999 | 24 | 16.3% |
| $25,000 to $34,999 | 0 | 0.0% |
| $35,000 to $49,999 | 17 | 11.6% |
| $50,000 to $74,999 | 14 | 9.5% |
| $75,000 to $99,999 | 36 | 24.5% |
| $100,000 to $149,999 | 20 | 13.6% |
| $150,000 to $199,999 | 0 | 0.0% |
| $200,000+ | 0 | 0.0% |
Household Income by Householder Age in Downsville
| Income Bracket | # Households | Median Income |
| 15 to 24 Years | 0 (0.0%) | $0 |
| 25 to 44 Years | 44 (29.9%) | $0 |
| 45 to 64 Years | 23 (15.7%) | $0 |
| 65+ Years | 80 (54.4%) | $0 |
| Total | 147 (100.0%) | $0 |
Poverty in Downsville
Income Below Poverty by Sex and Age in Downsville
With 31.3% poverty level for males and 3.6% for females among the residents of Downsville, 12 to 14 year old males and 18 to 24 year old females are the most vulnerable to poverty, with 19 males (100.0%) and 6 females (100.0%) in their respective age groups living below the poverty level.
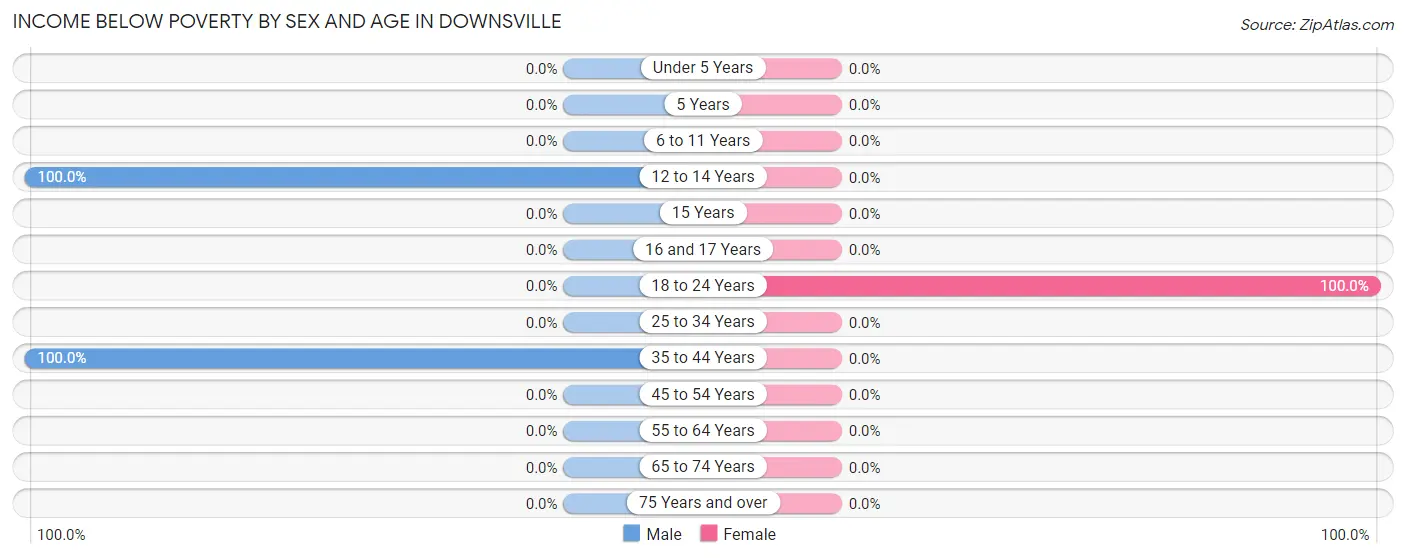
| Age Bracket | Male | Female |
| Under 5 Years | 0 (0.0%) | 0 (0.0%) |
| 5 Years | 0 (0.0%) | 0 (0.0%) |
| 6 to 11 Years | 0 (0.0%) | 0 (0.0%) |
| 12 to 14 Years | 19 (100.0%) | 0 (0.0%) |
| 15 Years | 0 (0.0%) | 0 (0.0%) |
| 16 and 17 Years | 0 (0.0%) | 0 (0.0%) |
| 18 to 24 Years | 0 (0.0%) | 6 (100.0%) |
| 25 to 34 Years | 0 (0.0%) | 0 (0.0%) |
| 35 to 44 Years | 28 (100.0%) | 0 (0.0%) |
| 45 to 54 Years | 0 (0.0%) | 0 (0.0%) |
| 55 to 64 Years | 0 (0.0%) | 0 (0.0%) |
| 65 to 74 Years | 0 (0.0%) | 0 (0.0%) |
| 75 Years and over | 0 (0.0%) | 0 (0.0%) |
| Total | 47 (31.3%) | 6 (3.6%) |
Income Above Poverty by Sex and Age in Downsville
According to the poverty statistics in Downsville, males aged 6 to 11 years and females aged under 5 years are the age groups that are most secure financially, with 100.0% of males and 100.0% of females in these age groups living above the poverty line.
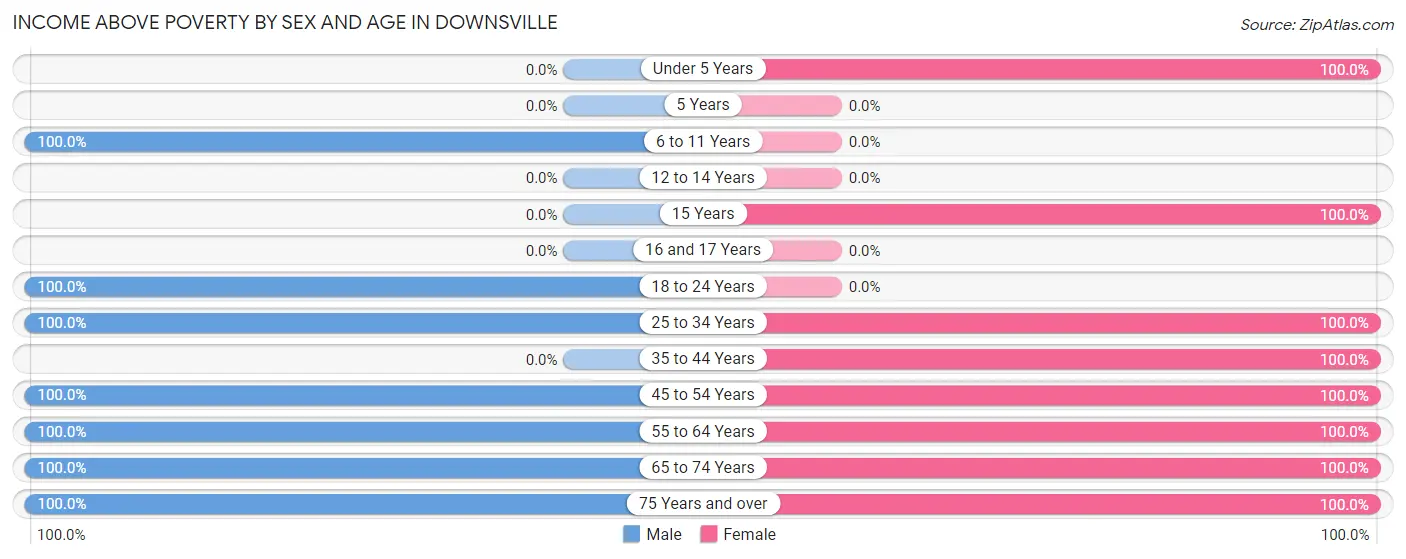
| Age Bracket | Male | Female |
| Under 5 Years | 0 (0.0%) | 7 (100.0%) |
| 5 Years | 0 (0.0%) | 0 (0.0%) |
| 6 to 11 Years | 6 (100.0%) | 0 (0.0%) |
| 12 to 14 Years | 0 (0.0%) | 0 (0.0%) |
| 15 Years | 0 (0.0%) | 9 (100.0%) |
| 16 and 17 Years | 0 (0.0%) | 0 (0.0%) |
| 18 to 24 Years | 12 (100.0%) | 0 (0.0%) |
| 25 to 34 Years | 18 (100.0%) | 9 (100.0%) |
| 35 to 44 Years | 0 (0.0%) | 7 (100.0%) |
| 45 to 54 Years | 8 (100.0%) | 17 (100.0%) |
| 55 to 64 Years | 17 (100.0%) | 31 (100.0%) |
| 65 to 74 Years | 21 (100.0%) | 61 (100.0%) |
| 75 Years and over | 21 (100.0%) | 18 (100.0%) |
| Total | 103 (68.7%) | 159 (96.4%) |
Income Below Poverty Among Married-Couple Families in Downsville
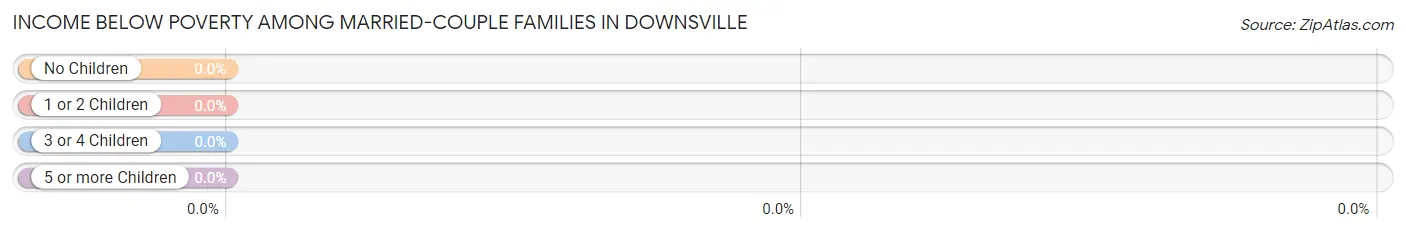
| Children | Above Poverty | Below Poverty |
| No Children | 57 (100.0%) | 0 (0.0%) |
| 1 or 2 Children | 16 (100.0%) | 0 (0.0%) |
| 3 or 4 Children | 0 (0.0%) | 0 (0.0%) |
| 5 or more Children | 0 (0.0%) | 0 (0.0%) |
| Total | 73 (100.0%) | 0 (0.0%) |
Income Below Poverty Among Single-Parent Households in Downsville
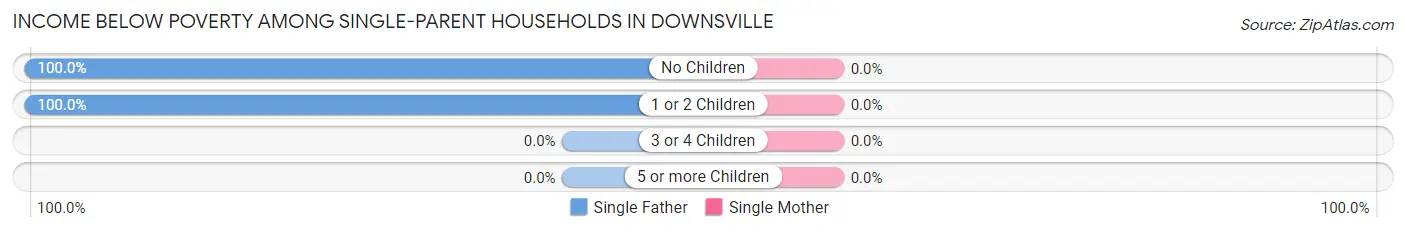
| Children | Single Father | Single Mother |
| No Children | 3 (100.0%) | 0 (0.0%) |
| 1 or 2 Children | 25 (100.0%) | 0 (0.0%) |
| 3 or 4 Children | 0 (0.0%) | 0 (0.0%) |
| 5 or more Children | 0 (0.0%) | 0 (0.0%) |
| Total | 28 (100.0%) | 0 (0.0%) |
Income Below Poverty Among Married-Couple vs Single-Parent Households in Downsville
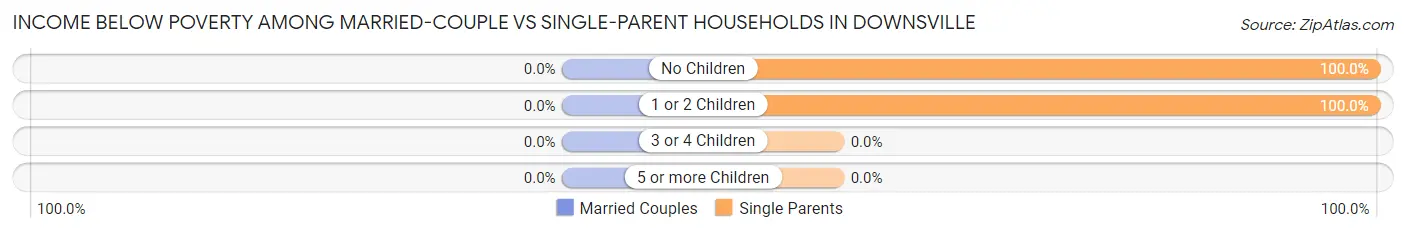
| Children | Married-Couple Families | Single-Parent Households |
| No Children | 0 (0.0%) | 3 (100.0%) |
| 1 or 2 Children | 0 (0.0%) | 25 (100.0%) |
| 3 or 4 Children | 0 (0.0%) | 0 (0.0%) |
| 5 or more Children | 0 (0.0%) | 0 (0.0%) |
| Total | 0 (0.0%) | 28 (100.0%) |
Race in Downsville
The most populous races in Downsville are White / Caucasian (304 | 96.5%), and Two or more Races (11 | 3.5%).
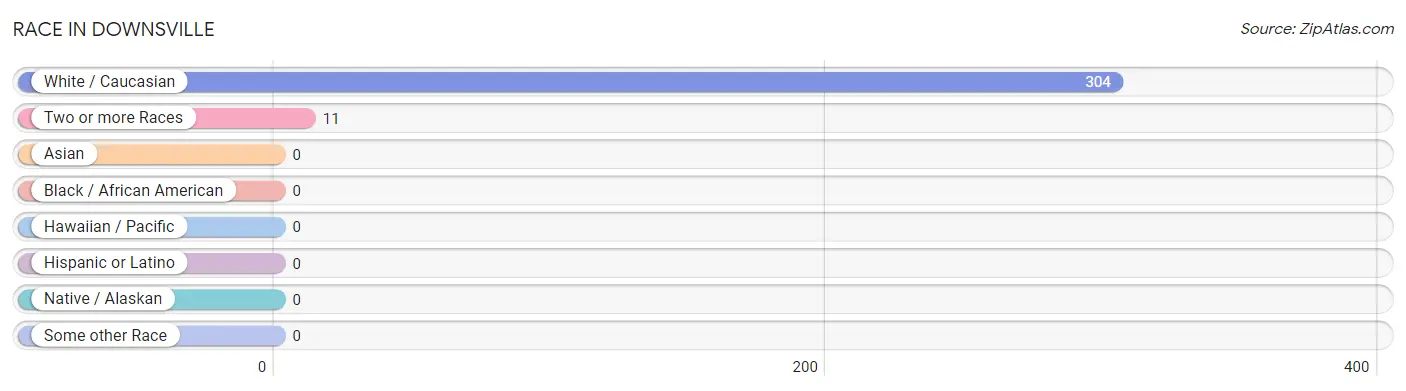
| Race | # Population | % Population |
| Asian | 0 | 0.0% |
| Black / African American | 0 | 0.0% |
| Hawaiian / Pacific | 0 | 0.0% |
| Hispanic or Latino | 0 | 0.0% |
| Native / Alaskan | 0 | 0.0% |
| White / Caucasian | 304 | 96.5% |
| Two or more Races | 11 | 3.5% |
| Some other Race | 0 | 0.0% |
| Total | 315 | 100.0% |
Ancestry in Downsville
The most populous ancestries reported in Downsville are German (122 | 38.7%), Italian (70 | 22.2%), Irish (69 | 21.9%), English (27 | 8.6%), and Scottish (19 | 6.0%), together accounting for 97.4% of all Downsville residents.
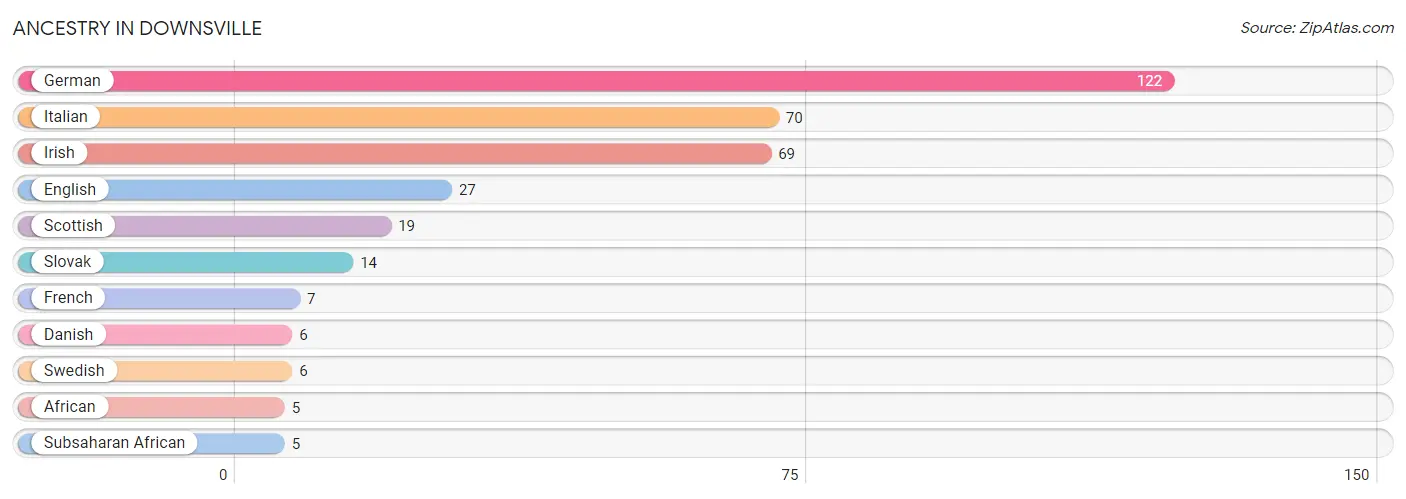
| Ancestry | # Population | % Population |
| African | 5 | 1.6% |
| Danish | 6 | 1.9% |
| English | 27 | 8.6% |
| French | 7 | 2.2% |
| German | 122 | 38.7% |
| Irish | 69 | 21.9% |
| Italian | 70 | 22.2% |
| Scottish | 19 | 6.0% |
| Slovak | 14 | 4.4% |
| Subsaharan African | 5 | 1.6% |
| Swedish | 6 | 1.9% | View All 11 Rows |
Immigrants in Downsville
The most numerous immigrant groups reported in Downsville came from , and Europe (16 | 5.1%), together accounting for 5.1% of all Downsville residents.

| Immigration Origin | # Population | % Population |
| Europe | 16 | 5.1% | View All 1 Rows |
Sex and Age in Downsville
Sex and Age in Downsville
The most populous age groups in Downsville are 40 to 44 Years (28 | 18.7%) for men and 65 to 69 Years (43 | 26.1%) for women.
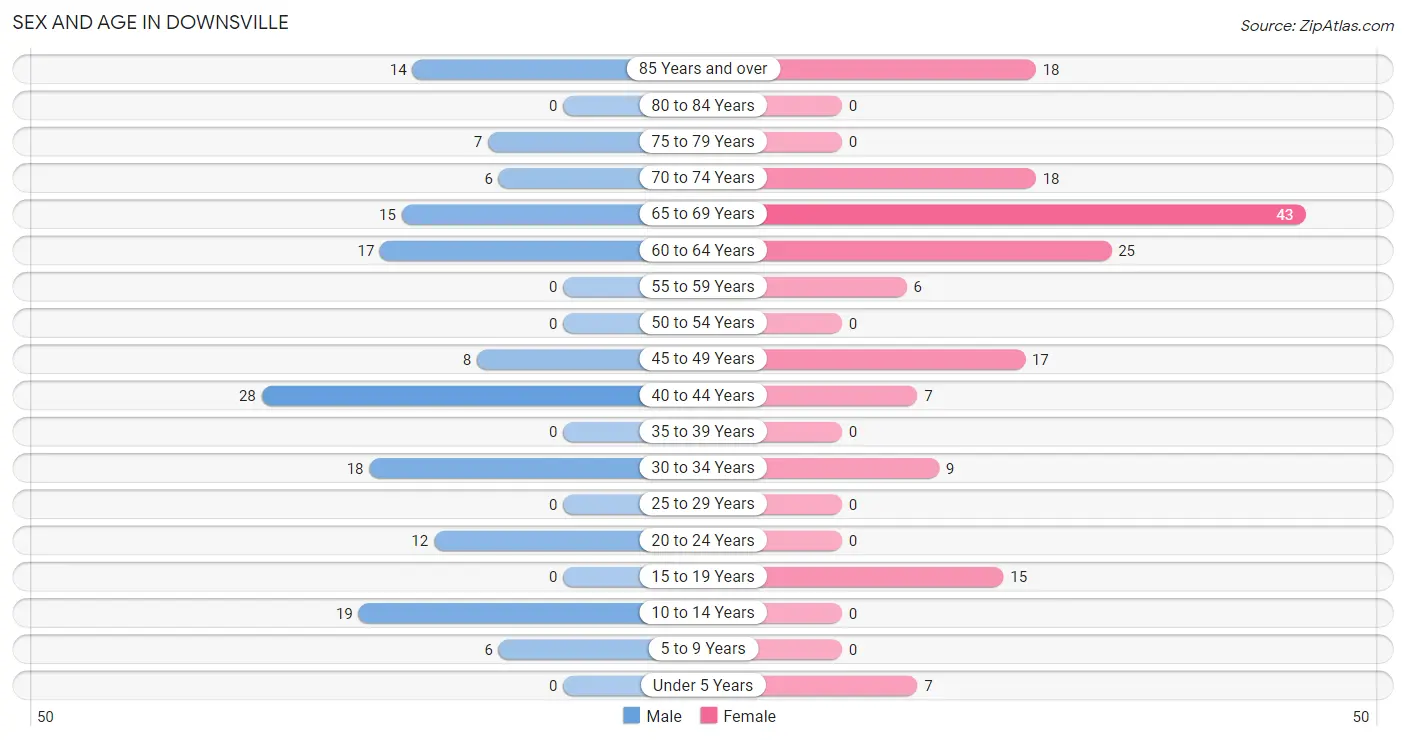
| Age Bracket | Male | Female |
| Under 5 Years | 0 (0.0%) | 7 (4.2%) |
| 5 to 9 Years | 6 (4.0%) | 0 (0.0%) |
| 10 to 14 Years | 19 (12.7%) | 0 (0.0%) |
| 15 to 19 Years | 0 (0.0%) | 15 (9.1%) |
| 20 to 24 Years | 12 (8.0%) | 0 (0.0%) |
| 25 to 29 Years | 0 (0.0%) | 0 (0.0%) |
| 30 to 34 Years | 18 (12.0%) | 9 (5.4%) |
| 35 to 39 Years | 0 (0.0%) | 0 (0.0%) |
| 40 to 44 Years | 28 (18.7%) | 7 (4.2%) |
| 45 to 49 Years | 8 (5.3%) | 17 (10.3%) |
| 50 to 54 Years | 0 (0.0%) | 0 (0.0%) |
| 55 to 59 Years | 0 (0.0%) | 6 (3.6%) |
| 60 to 64 Years | 17 (11.3%) | 25 (15.1%) |
| 65 to 69 Years | 15 (10.0%) | 43 (26.1%) |
| 70 to 74 Years | 6 (4.0%) | 18 (10.9%) |
| 75 to 79 Years | 7 (4.7%) | 0 (0.0%) |
| 80 to 84 Years | 0 (0.0%) | 0 (0.0%) |
| 85 Years and over | 14 (9.3%) | 18 (10.9%) |
| Total | 150 (100.0%) | 165 (100.0%) |
Families and Households in Downsville
Median Family Size in Downsville
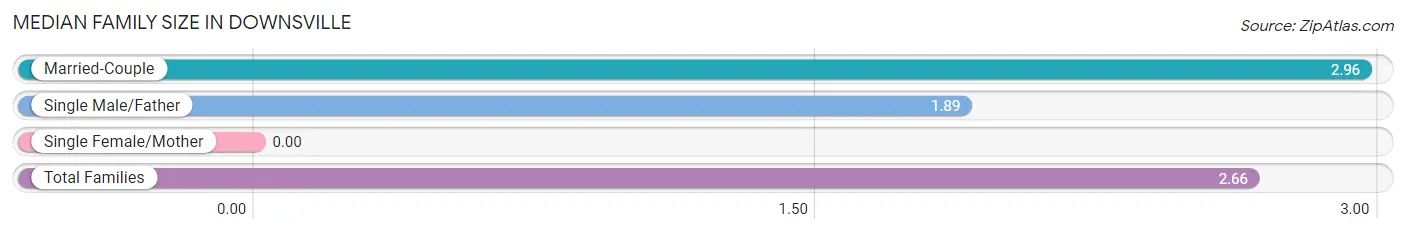
| Family Type | # Families | Family Size |
| Married-Couple | 73 (72.3%) | 2.96 |
| Single Male/Father | 28 (27.7%) | 1.89 |
| Single Female/Mother | 0 (0.0%) | - |
| Total Families | 101 (100.0%) | 2.66 |
Median Household Size in Downsville
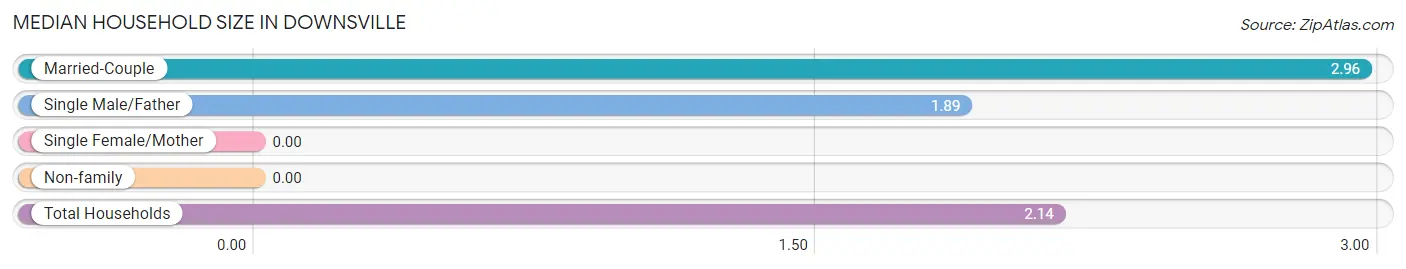
| Household Type | # Households | Household Size |
| Married-Couple | 73 (49.7%) | 2.96 |
| Single Male/Father | 28 (19.1%) | 1.89 |
| Single Female/Mother | 0 (0.0%) | - |
| Non-family | 46 (31.3%) | - |
| Total Households | 147 (100.0%) | 2.14 |
Household Size by Marriage Status in Downsville
Out of a total of 147 households in Downsville, 101 (68.7%) are family households, while 46 (31.3%) are nonfamily households. The most numerous type of family households are 2-person households, comprising 62, and the most common type of nonfamily households are 1-person households, comprising 46.
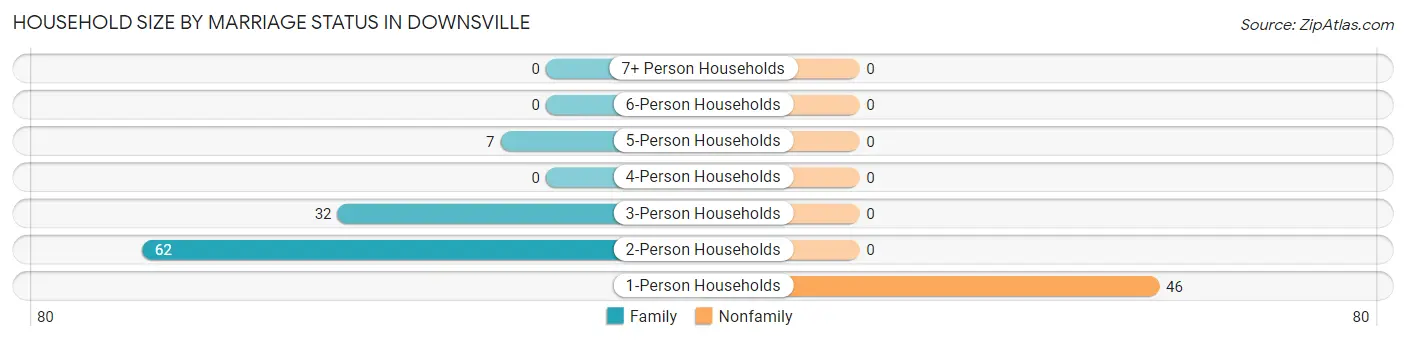
| Household Size | Family Households | Nonfamily Households |
| 1-Person Households | - | 46 (31.3%) |
| 2-Person Households | 62 (42.2%) | 0 (0.0%) |
| 3-Person Households | 32 (21.8%) | 0 (0.0%) |
| 4-Person Households | 0 (0.0%) | 0 (0.0%) |
| 5-Person Households | 7 (4.8%) | 0 (0.0%) |
| 6-Person Households | 0 (0.0%) | 0 (0.0%) |
| 7+ Person Households | 0 (0.0%) | 0 (0.0%) |
| Total | 101 (68.7%) | 46 (31.3%) |
Female Fertility in Downsville
Fertility by Age in Downsville
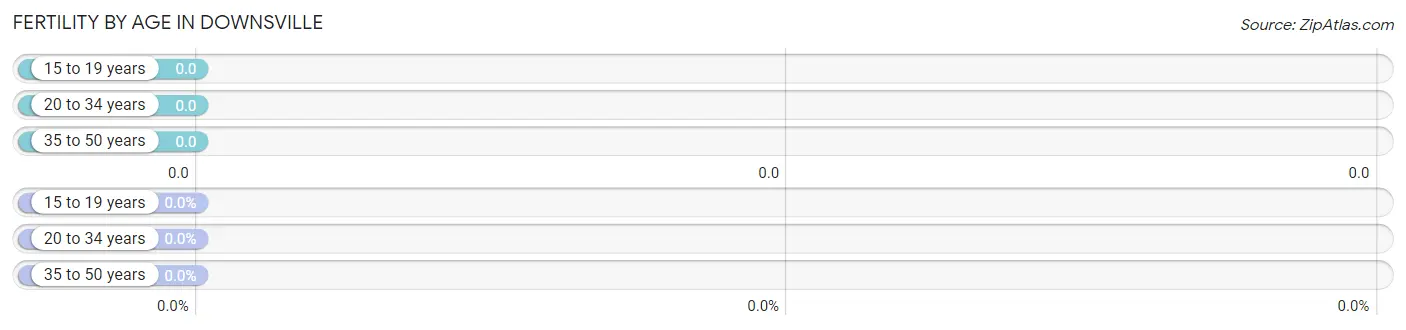
| Age Bracket | Women with Births | Births / 1,000 Women |
| 15 to 19 years | 0 (0.0%) | 0.0 |
| 20 to 34 years | 0 (0.0%) | 0.0 |
| 35 to 50 years | 0 (0.0%) | 0.0 |
| Total | 0 (0.0%) | 0.0 |
Fertility by Age by Marriage Status in Downsville
| Age Bracket | Married | Unmarried |
| 15 to 19 years | 0 (0.0%) | 0 (0.0%) |
| 20 to 34 years | 0 (0.0%) | 0 (0.0%) |
| 35 to 50 years | 0 (0.0%) | 0 (0.0%) |
| Total | 0 (0.0%) | 0 (0.0%) |
Fertility by Education in Downsville
| Educational Attainment | Women with Births | Births / 1,000 Women |
| Less than High School | 0 (0.0%) | 0.0 |
| High School Diploma | 0 (0.0%) | 0.0 |
| College or Associate's Degree | 0 (0.0%) | 0.0 |
| Bachelor's Degree | 0 (0.0%) | 0.0 |
| Graduate Degree | 0 (0.0%) | 0.0 |
| Total | 0 (0.0%) | 0.0 |
Fertility by Education by Marriage Status in Downsville
| Educational Attainment | Married | Unmarried |
| Less than High School | 0 (0.0%) | 0 (0.0%) |
| High School Diploma | 0 (0.0%) | 0 (0.0%) |
| College or Associate's Degree | 0 (0.0%) | 0 (0.0%) |
| Bachelor's Degree | 0 (0.0%) | 0 (0.0%) |
| Graduate Degree | 0 (0.0%) | 0 (0.0%) |
| Total | 0 (0.0%) | 0 (0.0%) |
Employment Characteristics in Downsville
Employment by Class of Employer in Downsville
Among the 131 employed individuals in Downsville, private company employees (55 | 42.0%), local government employees (27 | 20.6%), and self-employed (incorporated) (25 | 19.1%) make up the most common classes of employment.
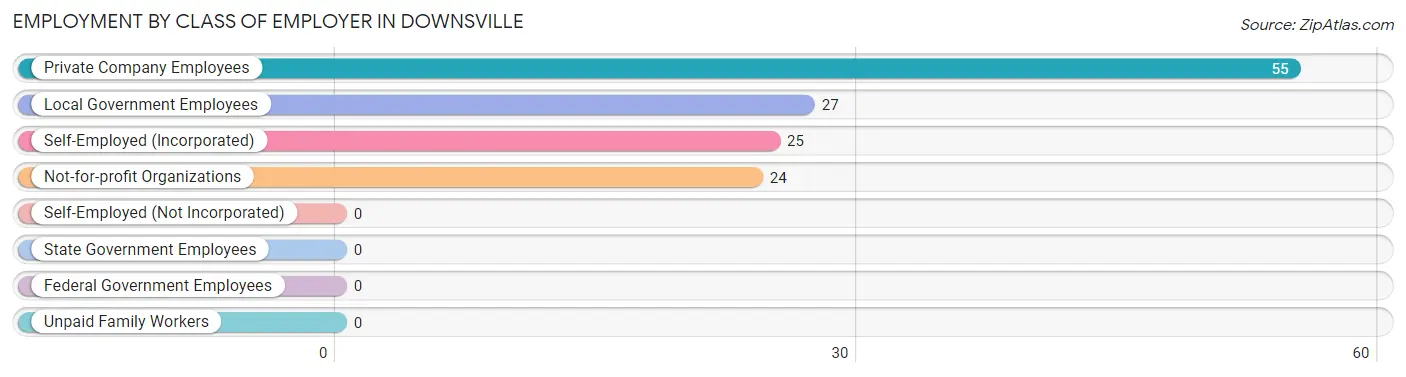
| Employer Class | # Employees | % Employees |
| Private Company Employees | 55 | 42.0% |
| Self-Employed (Incorporated) | 25 | 19.1% |
| Self-Employed (Not Incorporated) | 0 | 0.0% |
| Not-for-profit Organizations | 24 | 18.3% |
| Local Government Employees | 27 | 20.6% |
| State Government Employees | 0 | 0.0% |
| Federal Government Employees | 0 | 0.0% |
| Unpaid Family Workers | 0 | 0.0% |
| Total | 131 | 100.0% |
Employment Status by Age in Downsville
According to the labor force statistics for Downsville, out of the total population over 16 years of age (274), 50.0% or 137 individuals are in the labor force, with 4.4% or 6 of them unemployed. The age group with the highest labor force participation rate is 16 to 19 years, with 100.0% or 6 individuals in the labor force. Within the labor force, the 16 to 19 years age range has the highest percentage of unemployed individuals, with 100.0% or 6 of them being unemployed.
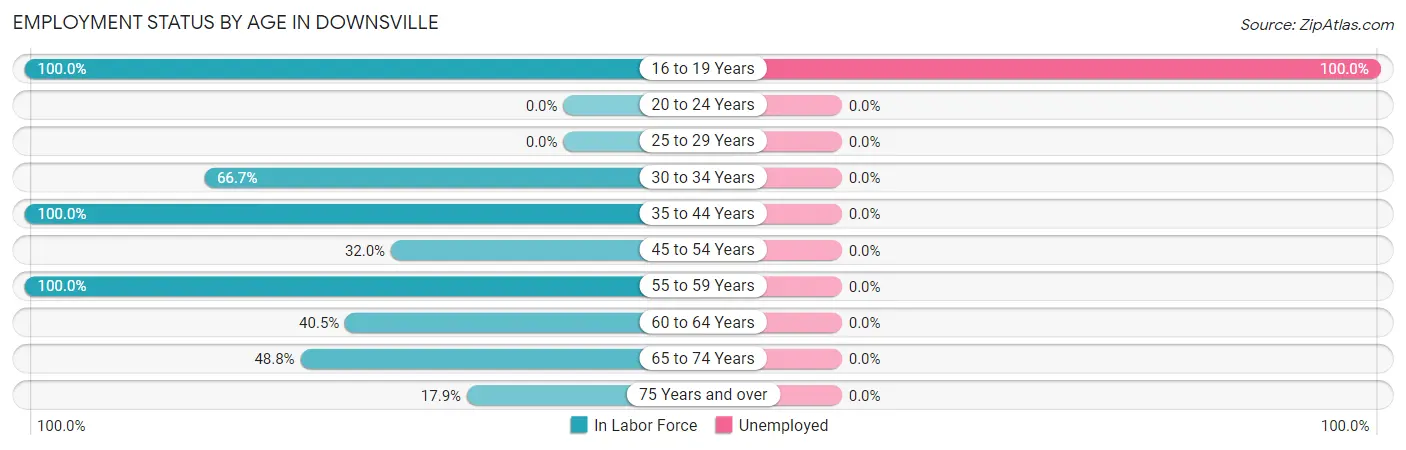
| Age Bracket | In Labor Force | Unemployed |
| 16 to 19 Years | 6 (100.0%) | 6 (100.0%) |
| 20 to 24 Years | 0 (0.0%) | 0 (0.0%) |
| 25 to 29 Years | 0 (0.0%) | 0 (0.0%) |
| 30 to 34 Years | 18 (66.7%) | 0 (0.0%) |
| 35 to 44 Years | 35 (100.0%) | 0 (0.0%) |
| 45 to 54 Years | 8 (32.0%) | 0 (0.0%) |
| 55 to 59 Years | 6 (100.0%) | 0 (0.0%) |
| 60 to 64 Years | 17 (40.5%) | 0 (0.0%) |
| 65 to 74 Years | 40 (48.8%) | 0 (0.0%) |
| 75 Years and over | 7 (17.9%) | 0 (0.0%) |
| Total | 137 (50.0%) | 6 (4.4%) |
Employment Status by Educational Attainment in Downsville
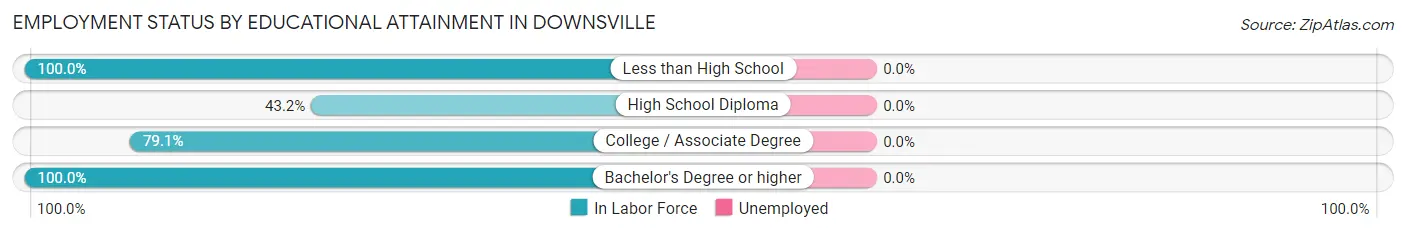
| Educational Attainment | In Labor Force | Unemployed |
| Less than High School | 3 (100.0%) | 0 (0.0%) |
| High School Diploma | 32 (43.2%) | 0 (0.0%) |
| College / Associate Degree | 34 (79.1%) | 0 (0.0%) |
| Bachelor's Degree or higher | 15 (100.0%) | 0 (0.0%) |
| Total | 84 (62.2%) | 0 (0.0%) |
Employment Occupations by Sex in Downsville
Management, Business, Science and Arts Occupations
The most common Management, Business, Science and Arts occupations in Downsville are Management (34 | 26.0%), Community & Social Service (14 | 10.7%), Health Diagnosing & Treating (13 | 9.9%), Legal Services & Support (7 | 5.3%), and Arts, Media & Entertainment (7 | 5.3%).
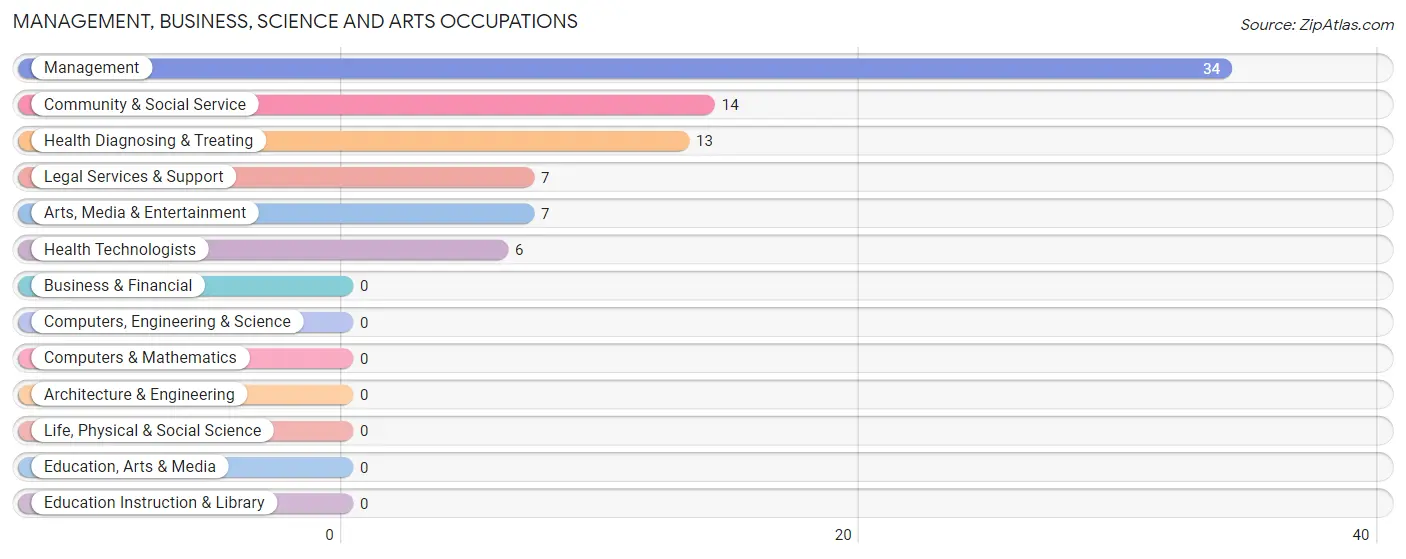
Management, Business, Science and Arts Occupations by Sex
Within the Management, Business, Science and Arts occupations in Downsville, the most male-oriented occupations are Management (100.0%), Legal Services & Support (100.0%), and Community & Social Service (50.0%), while the most female-oriented occupations are Arts, Media & Entertainment (100.0%), Health Diagnosing & Treating (100.0%), and Health Technologists (100.0%).
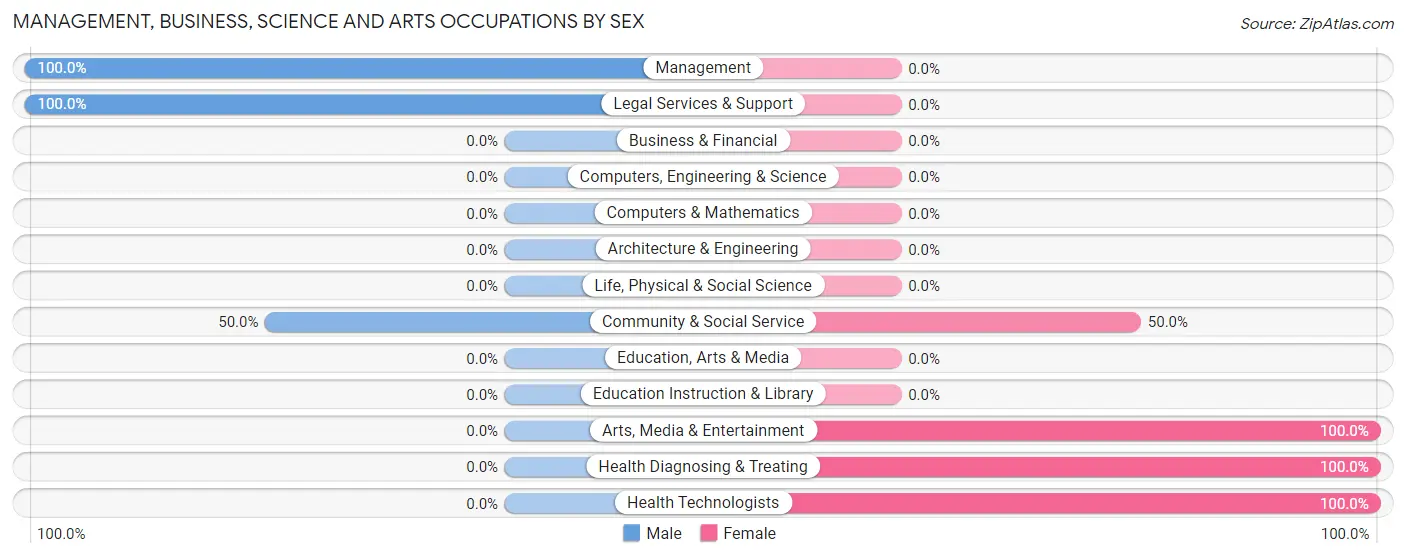
| Occupation | Male | Female |
| Management | 34 (100.0%) | 0 (0.0%) |
| Business & Financial | 0 (0.0%) | 0 (0.0%) |
| Computers, Engineering & Science | 0 (0.0%) | 0 (0.0%) |
| Computers & Mathematics | 0 (0.0%) | 0 (0.0%) |
| Architecture & Engineering | 0 (0.0%) | 0 (0.0%) |
| Life, Physical & Social Science | 0 (0.0%) | 0 (0.0%) |
| Community & Social Service | 7 (50.0%) | 7 (50.0%) |
| Education, Arts & Media | 0 (0.0%) | 0 (0.0%) |
| Legal Services & Support | 7 (100.0%) | 0 (0.0%) |
| Education Instruction & Library | 0 (0.0%) | 0 (0.0%) |
| Arts, Media & Entertainment | 0 (0.0%) | 7 (100.0%) |
| Health Diagnosing & Treating | 0 (0.0%) | 13 (100.0%) |
| Health Technologists | 0 (0.0%) | 6 (100.0%) |
| Total (Category) | 41 (67.2%) | 20 (32.8%) |
| Total (Overall) | 87 (66.4%) | 44 (33.6%) |
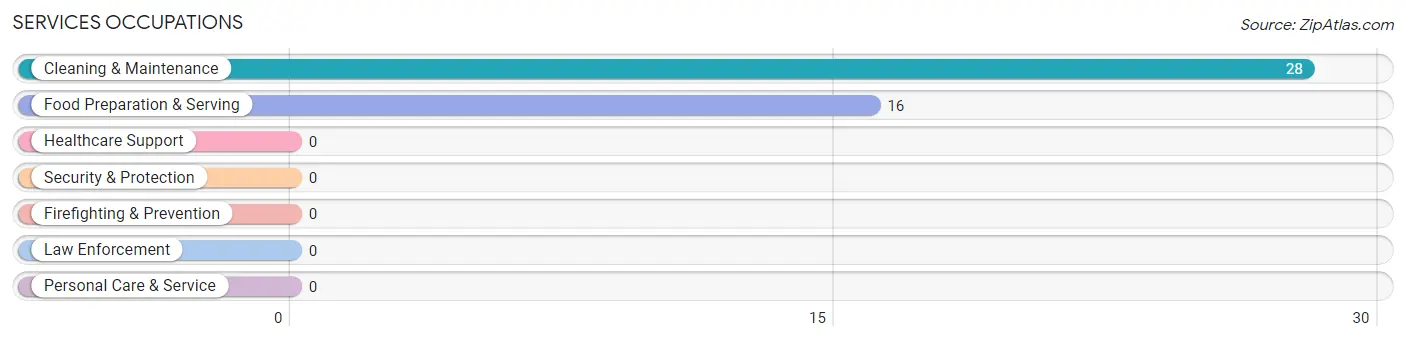
Services Occupations
The most common Services occupations in Downsville are Cleaning & Maintenance (28 | 21.4%), and Food Preparation & Serving (16 | 12.2%).
Services Occupations by Sex
Within the Services occupations in Downsville, the most male-oriented occupations are Cleaning & Maintenance (60.7%), and Food Preparation & Serving (56.2%), while the most female-oriented occupations are Food Preparation & Serving (43.8%), and Cleaning & Maintenance (39.3%).
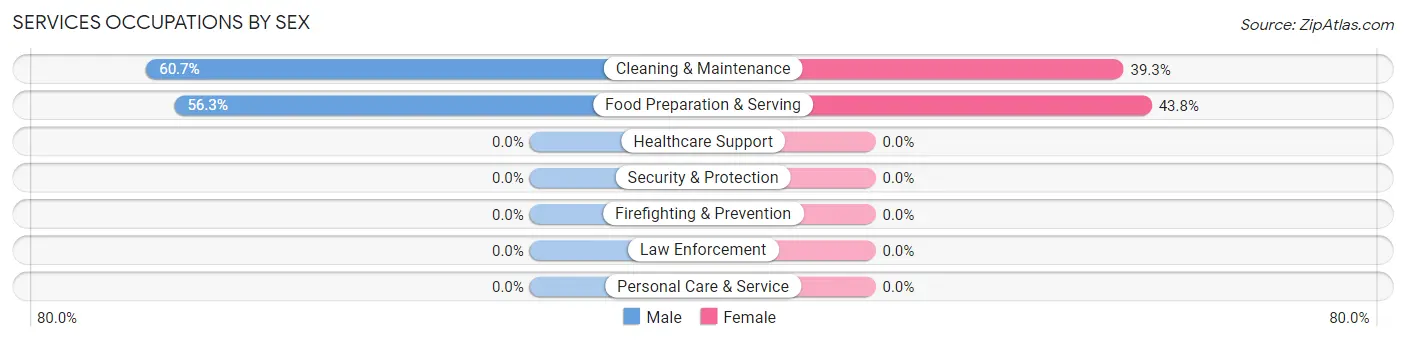
| Occupation | Male | Female |
| Healthcare Support | 0 (0.0%) | 0 (0.0%) |
| Security & Protection | 0 (0.0%) | 0 (0.0%) |
| Firefighting & Prevention | 0 (0.0%) | 0 (0.0%) |
| Law Enforcement | 0 (0.0%) | 0 (0.0%) |
| Food Preparation & Serving | 9 (56.2%) | 7 (43.8%) |
| Cleaning & Maintenance | 17 (60.7%) | 11 (39.3%) |
| Personal Care & Service | 0 (0.0%) | 0 (0.0%) |
| Total (Category) | 26 (59.1%) | 18 (40.9%) |
| Total (Overall) | 87 (66.4%) | 44 (33.6%) |
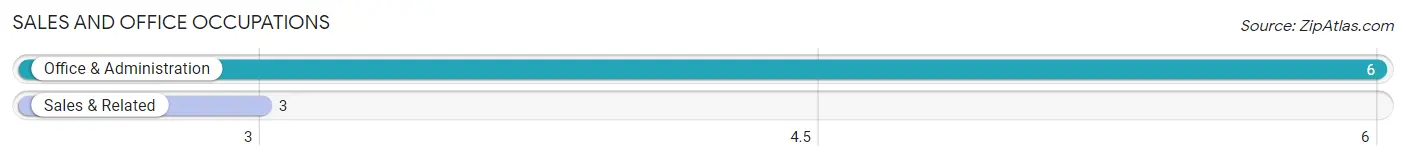
Sales and Office Occupations
The most common Sales and Office occupations in Downsville are Office & Administration (6 | 4.6%), and Sales & Related (3 | 2.3%).
Sales and Office Occupations by Sex
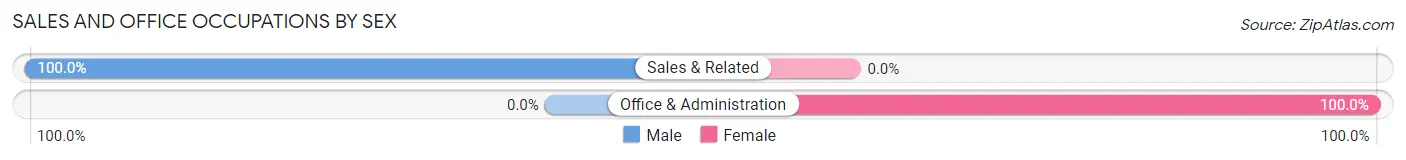
| Occupation | Male | Female |
| Sales & Related | 3 (100.0%) | 0 (0.0%) |
| Office & Administration | 0 (0.0%) | 6 (100.0%) |
| Total (Category) | 3 (33.3%) | 6 (66.7%) |
| Total (Overall) | 87 (66.4%) | 44 (33.6%) |
Natural Resources, Construction and Maintenance Occupations
The most common Natural Resources, Construction and Maintenance occupations in Downsville are , and Installation, Maintenance & Repair (9 | 6.9%).
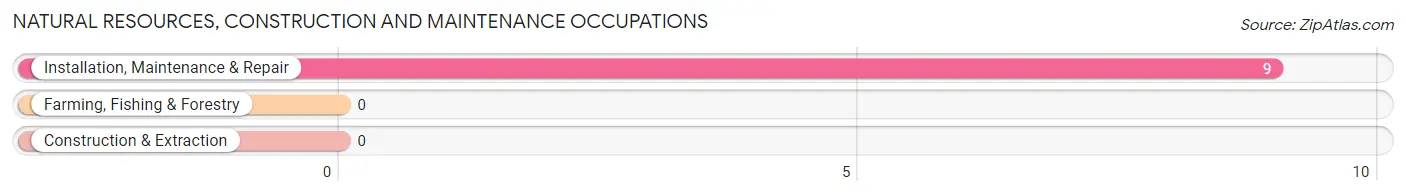
Natural Resources, Construction and Maintenance Occupations by Sex
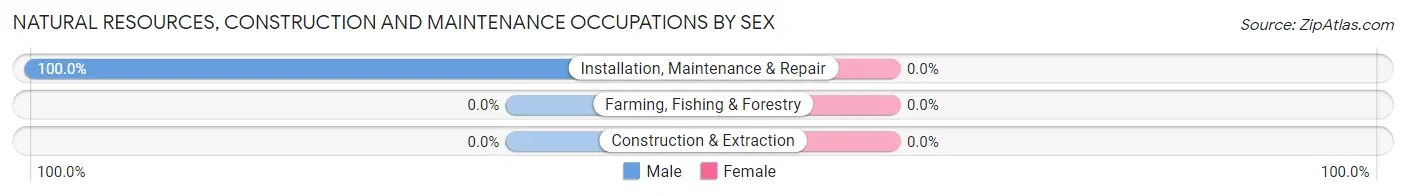
| Occupation | Male | Female |
| Farming, Fishing & Forestry | 0 (0.0%) | 0 (0.0%) |
| Construction & Extraction | 0 (0.0%) | 0 (0.0%) |
| Installation, Maintenance & Repair | 9 (100.0%) | 0 (0.0%) |
| Total (Category) | 9 (100.0%) | 0 (0.0%) |
| Total (Overall) | 87 (66.4%) | 44 (33.6%) |
Production, Transportation and Moving Occupations
The most common Production, Transportation and Moving occupations in Downsville are , and Transportation (8 | 6.1%).
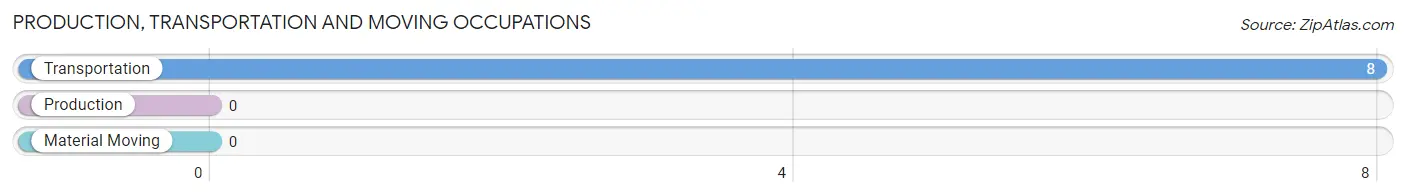
Production, Transportation and Moving Occupations by Sex
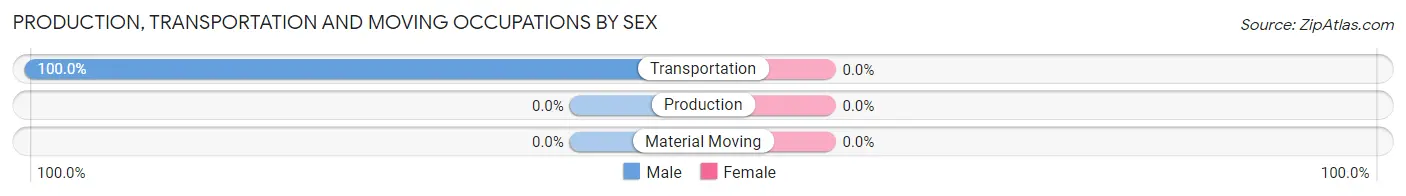
| Occupation | Male | Female |
| Production | 0 (0.0%) | 0 (0.0%) |
| Transportation | 8 (100.0%) | 0 (0.0%) |
| Material Moving | 0 (0.0%) | 0 (0.0%) |
| Total (Category) | 8 (100.0%) | 0 (0.0%) |
| Total (Overall) | 87 (66.4%) | 44 (33.6%) |
Employment Industries by Sex in Downsville
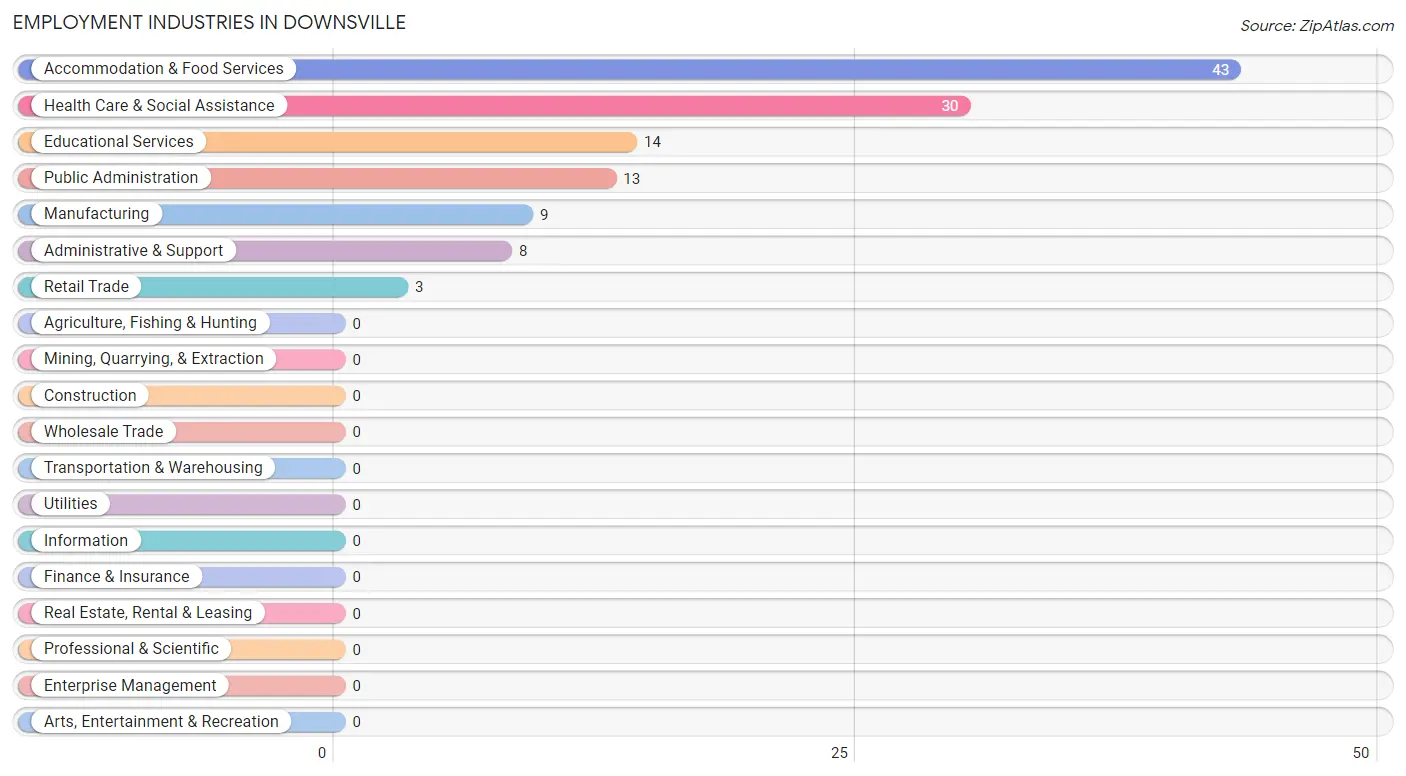
Employment Industries in Downsville
The major employment industries in Downsville include Accommodation & Food Services (43 | 32.8%), Health Care & Social Assistance (30 | 22.9%), Educational Services (14 | 10.7%), Public Administration (13 | 9.9%), and Manufacturing (9 | 6.9%).
Employment Industries by Sex in Downsville
The Downsville industries that see more men than women are Manufacturing (100.0%), Retail Trade (100.0%), and Administrative & Support (100.0%), whereas the industries that tend to have a higher number of women are Educational Services (100.0%), Public Administration (46.2%), and Health Care & Social Assistance (43.3%).
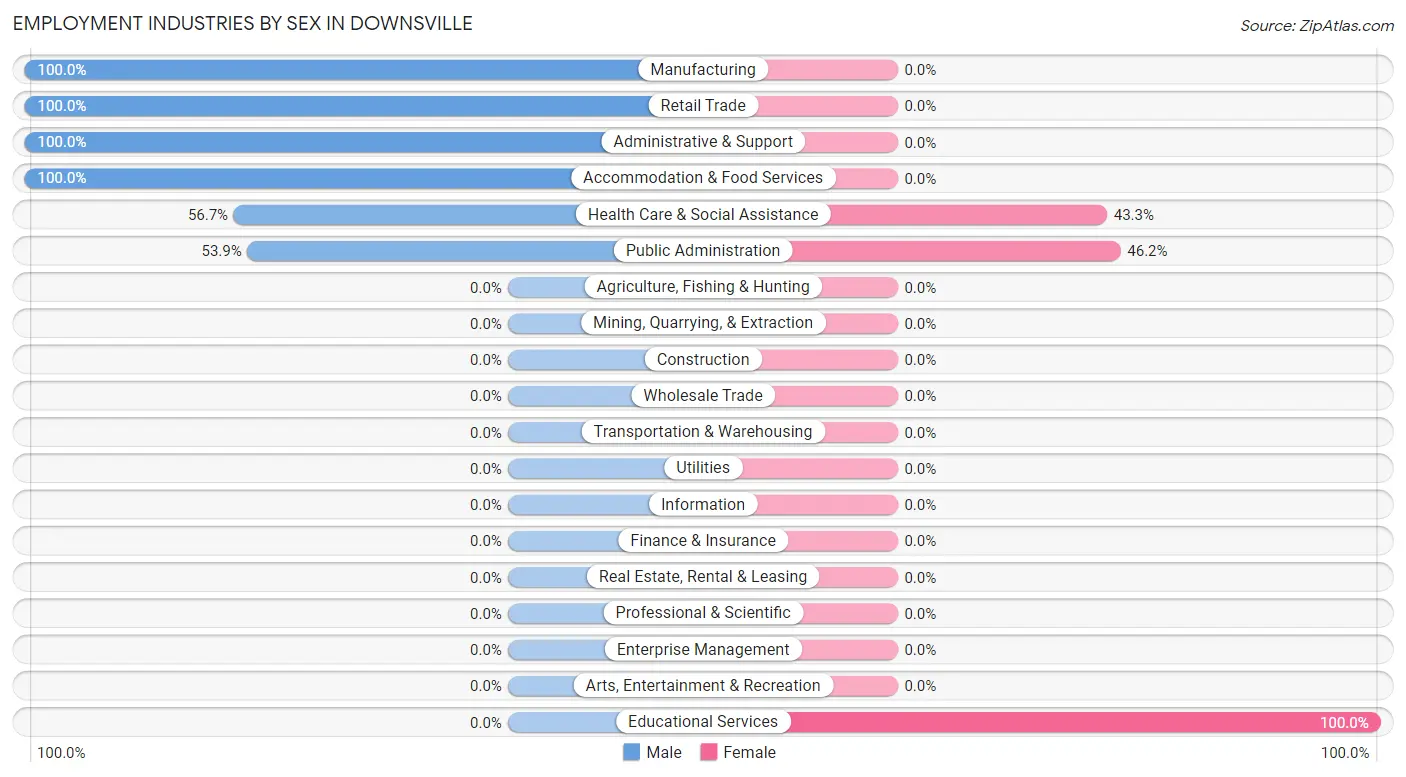
| Industry | Male | Female |
| Agriculture, Fishing & Hunting | 0 (0.0%) | 0 (0.0%) |
| Mining, Quarrying, & Extraction | 0 (0.0%) | 0 (0.0%) |
| Construction | 0 (0.0%) | 0 (0.0%) |
| Manufacturing | 9 (100.0%) | 0 (0.0%) |
| Wholesale Trade | 0 (0.0%) | 0 (0.0%) |
| Retail Trade | 3 (100.0%) | 0 (0.0%) |
| Transportation & Warehousing | 0 (0.0%) | 0 (0.0%) |
| Utilities | 0 (0.0%) | 0 (0.0%) |
| Information | 0 (0.0%) | 0 (0.0%) |
| Finance & Insurance | 0 (0.0%) | 0 (0.0%) |
| Real Estate, Rental & Leasing | 0 (0.0%) | 0 (0.0%) |
| Professional & Scientific | 0 (0.0%) | 0 (0.0%) |
| Enterprise Management | 0 (0.0%) | 0 (0.0%) |
| Administrative & Support | 8 (100.0%) | 0 (0.0%) |
| Educational Services | 0 (0.0%) | 14 (100.0%) |
| Health Care & Social Assistance | 17 (56.7%) | 13 (43.3%) |
| Arts, Entertainment & Recreation | 0 (0.0%) | 0 (0.0%) |
| Accommodation & Food Services | 43 (100.0%) | 0 (0.0%) |
| Public Administration | 7 (53.8%) | 6 (46.2%) |
| Total | 87 (66.4%) | 44 (33.6%) |
Education in Downsville
School Enrollment in Downsville
The most common levels of schooling among the 41 students in Downsville are high school (28 | 68.3%), nursery / preschool (7 | 17.1%), and elementary school (6 | 14.6%).
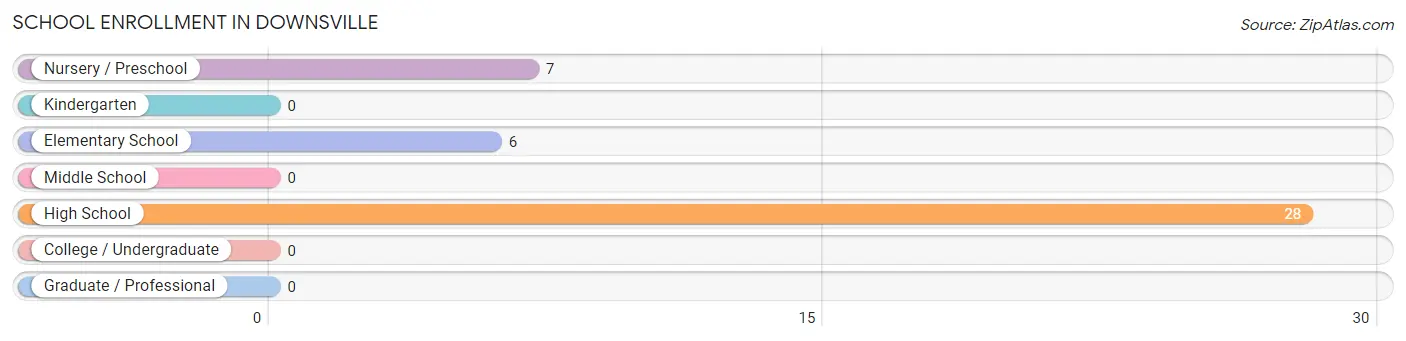
| School Level | # Students | % Students |
| Nursery / Preschool | 7 | 17.1% |
| Kindergarten | 0 | 0.0% |
| Elementary School | 6 | 14.6% |
| Middle School | 0 | 0.0% |
| High School | 28 | 68.3% |
| College / Undergraduate | 0 | 0.0% |
| Graduate / Professional | 0 | 0.0% |
| Total | 41 | 100.0% |
School Enrollment by Age by Funding Source in Downsville
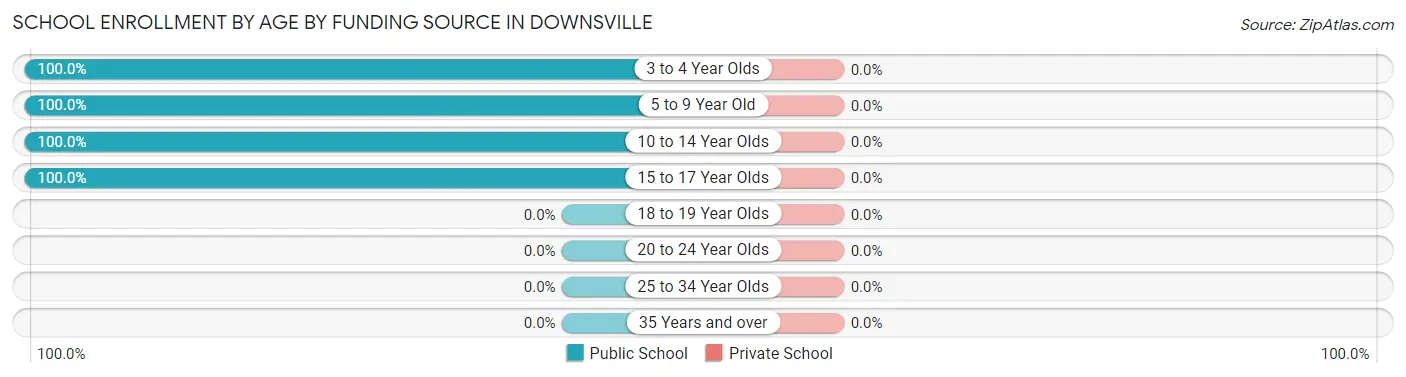
| Age Bracket | Public School | Private School |
| 3 to 4 Year Olds | 7 (100.0%) | 0 (0.0%) |
| 5 to 9 Year Old | 6 (100.0%) | 0 (0.0%) |
| 10 to 14 Year Olds | 19 (100.0%) | 0 (0.0%) |
| 15 to 17 Year Olds | 9 (100.0%) | 0 (0.0%) |
| 18 to 19 Year Olds | 0 (0.0%) | 0 (0.0%) |
| 20 to 24 Year Olds | 0 (0.0%) | 0 (0.0%) |
| 25 to 34 Year Olds | 0 (0.0%) | 0 (0.0%) |
| 35 Years and over | 0 (0.0%) | 0 (0.0%) |
| Total | 41 (100.0%) | 0 (0.0%) |
Educational Attainment by Field of Study in Downsville
Business (9 | 60.0%), and education (6 | 40.0%) are the most common fields of study among 15 individuals in Downsville who have obtained a bachelor's degree or higher.
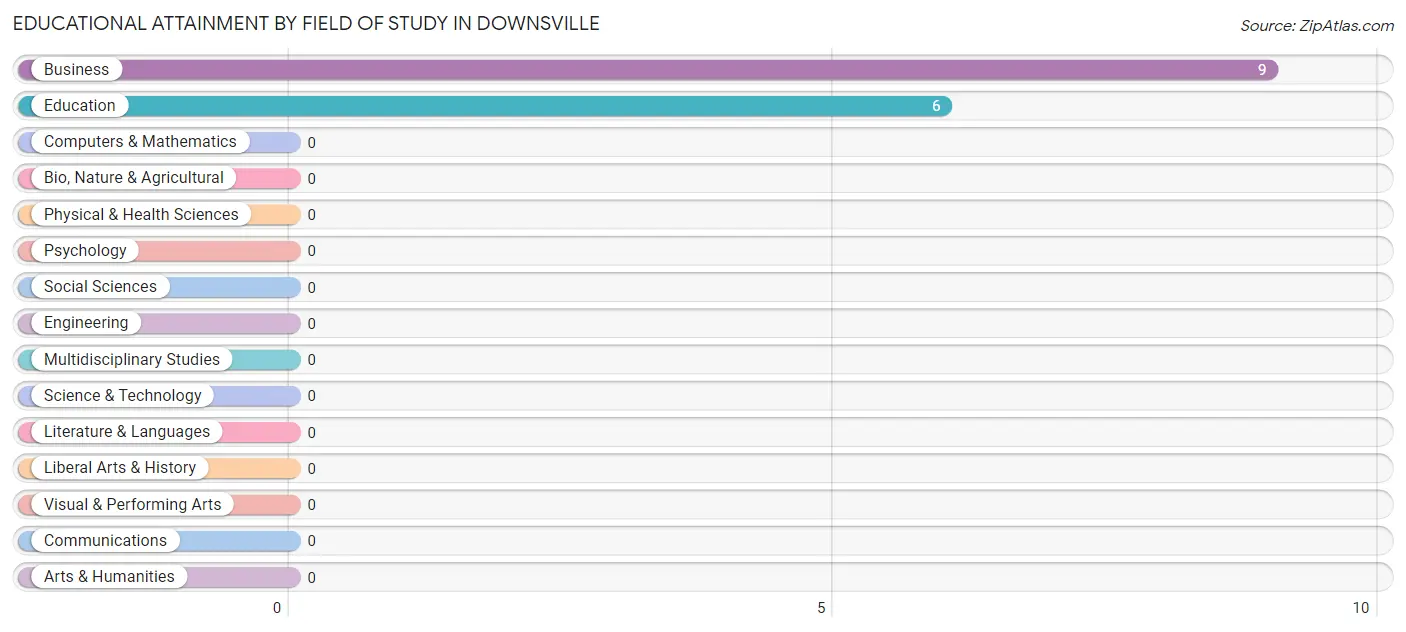
| Field of Study | # Graduates | % Graduates |
| Computers & Mathematics | 0 | 0.0% |
| Bio, Nature & Agricultural | 0 | 0.0% |
| Physical & Health Sciences | 0 | 0.0% |
| Psychology | 0 | 0.0% |
| Social Sciences | 0 | 0.0% |
| Engineering | 0 | 0.0% |
| Multidisciplinary Studies | 0 | 0.0% |
| Science & Technology | 0 | 0.0% |
| Business | 9 | 60.0% |
| Education | 6 | 40.0% |
| Literature & Languages | 0 | 0.0% |
| Liberal Arts & History | 0 | 0.0% |
| Visual & Performing Arts | 0 | 0.0% |
| Communications | 0 | 0.0% |
| Arts & Humanities | 0 | 0.0% |
| Total | 15 | 100.0% |
Transportation & Commute in Downsville
Vehicle Availability by Sex in Downsville
The most prevalent vehicle ownership categories in Downsville are males with 2 vehicles (42, accounting for 48.3%) and females with 2 vehicles (0, making up 95.5%).
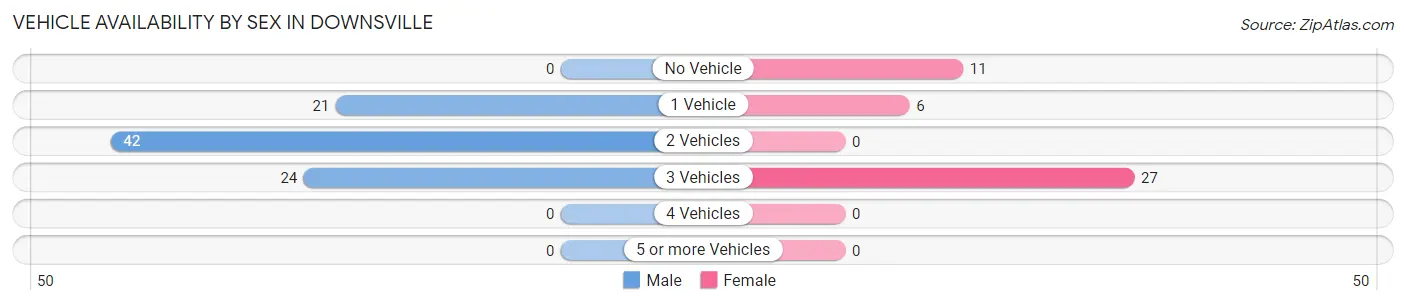
| Vehicles Available | Male | Female |
| No Vehicle | 0 (0.0%) | 11 (25.0%) |
| 1 Vehicle | 21 (24.1%) | 6 (13.6%) |
| 2 Vehicles | 42 (48.3%) | 0 (0.0%) |
| 3 Vehicles | 24 (27.6%) | 27 (61.4%) |
| 4 Vehicles | 0 (0.0%) | 0 (0.0%) |
| 5 or more Vehicles | 0 (0.0%) | 0 (0.0%) |
| Total | 87 (100.0%) | 44 (100.0%) |
Commute Time in Downsville
The most frequently occuring commute durations in Downsville are less than 5 minutes (43 commuters, 32.8%), 10 to 14 minutes (29 commuters, 22.1%), and 15 to 19 minutes (25 commuters, 19.1%).
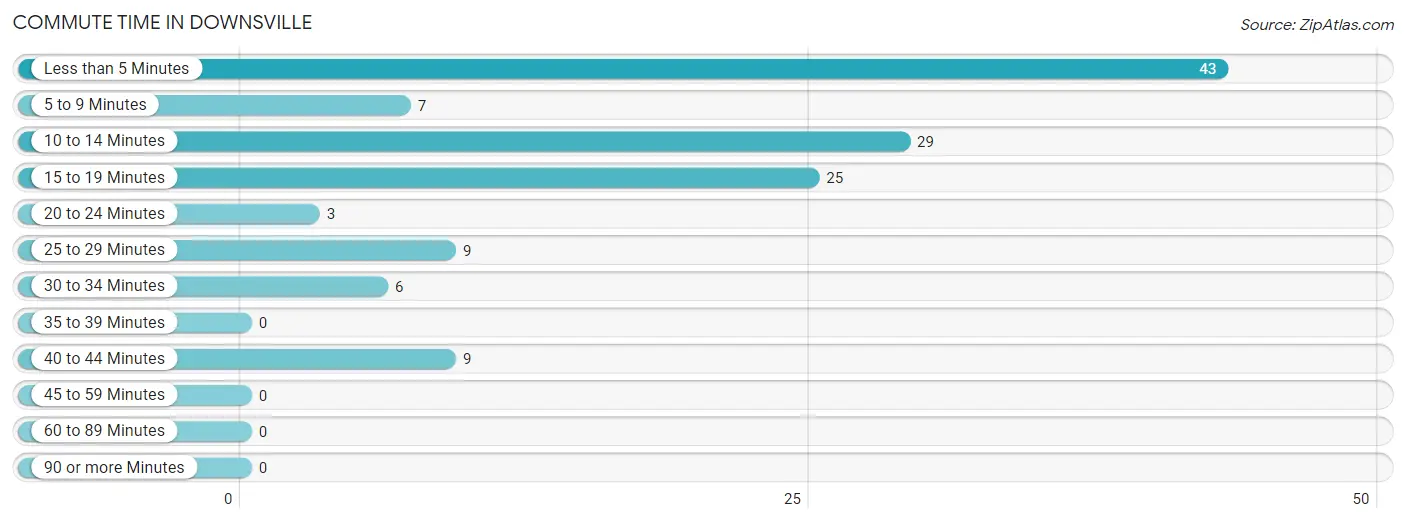
| Commute Time | # Commuters | % Commuters |
| Less than 5 Minutes | 43 | 32.8% |
| 5 to 9 Minutes | 7 | 5.3% |
| 10 to 14 Minutes | 29 | 22.1% |
| 15 to 19 Minutes | 25 | 19.1% |
| 20 to 24 Minutes | 3 | 2.3% |
| 25 to 29 Minutes | 9 | 6.9% |
| 30 to 34 Minutes | 6 | 4.6% |
| 35 to 39 Minutes | 0 | 0.0% |
| 40 to 44 Minutes | 9 | 6.9% |
| 45 to 59 Minutes | 0 | 0.0% |
| 60 to 89 Minutes | 0 | 0.0% |
| 90 or more Minutes | 0 | 0.0% |
Commute Time by Sex in Downsville
The most common commute times in Downsville are less than 5 minutes (25 commuters, 28.7%) for males and 10 to 14 minutes (20 commuters, 45.5%) for females.
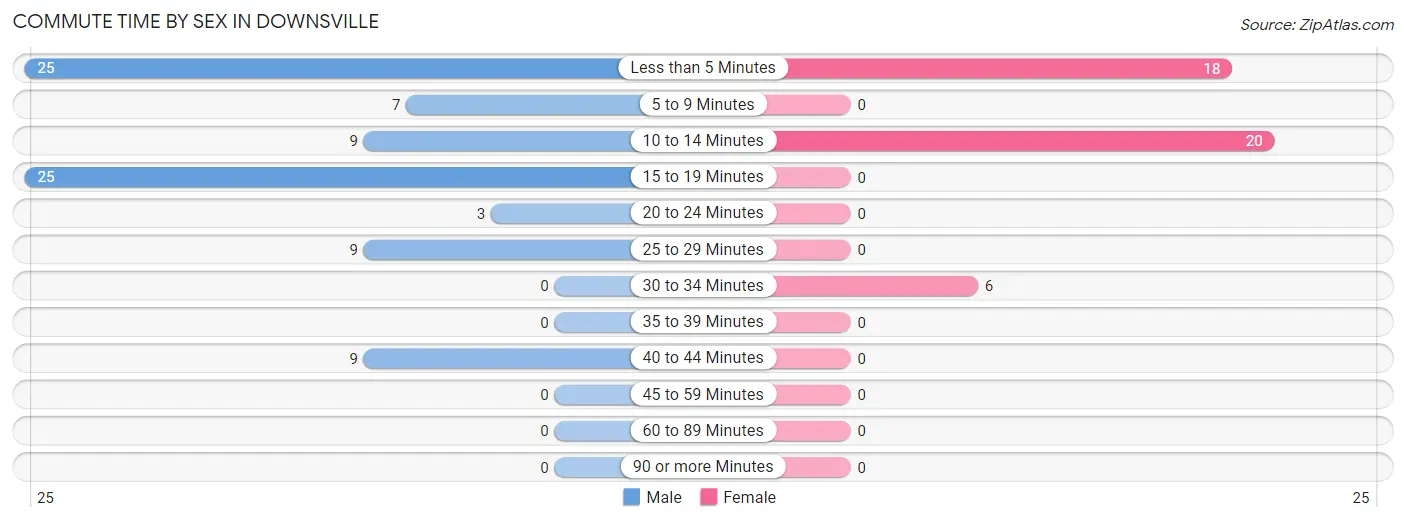
| Commute Time | Male | Female |
| Less than 5 Minutes | 25 (28.7%) | 18 (40.9%) |
| 5 to 9 Minutes | 7 (8.1%) | 0 (0.0%) |
| 10 to 14 Minutes | 9 (10.3%) | 20 (45.5%) |
| 15 to 19 Minutes | 25 (28.7%) | 0 (0.0%) |
| 20 to 24 Minutes | 3 (3.5%) | 0 (0.0%) |
| 25 to 29 Minutes | 9 (10.3%) | 0 (0.0%) |
| 30 to 34 Minutes | 0 (0.0%) | 6 (13.6%) |
| 35 to 39 Minutes | 0 (0.0%) | 0 (0.0%) |
| 40 to 44 Minutes | 9 (10.3%) | 0 (0.0%) |
| 45 to 59 Minutes | 0 (0.0%) | 0 (0.0%) |
| 60 to 89 Minutes | 0 (0.0%) | 0 (0.0%) |
| 90 or more Minutes | 0 (0.0%) | 0 (0.0%) |
Time of Departure to Work by Sex in Downsville
The most frequent times of departure to work in Downsville are 9:00 AM to 9:59 AM (32, 36.8%) for males and 7:30 AM to 7:59 AM (13, 29.5%) for females.
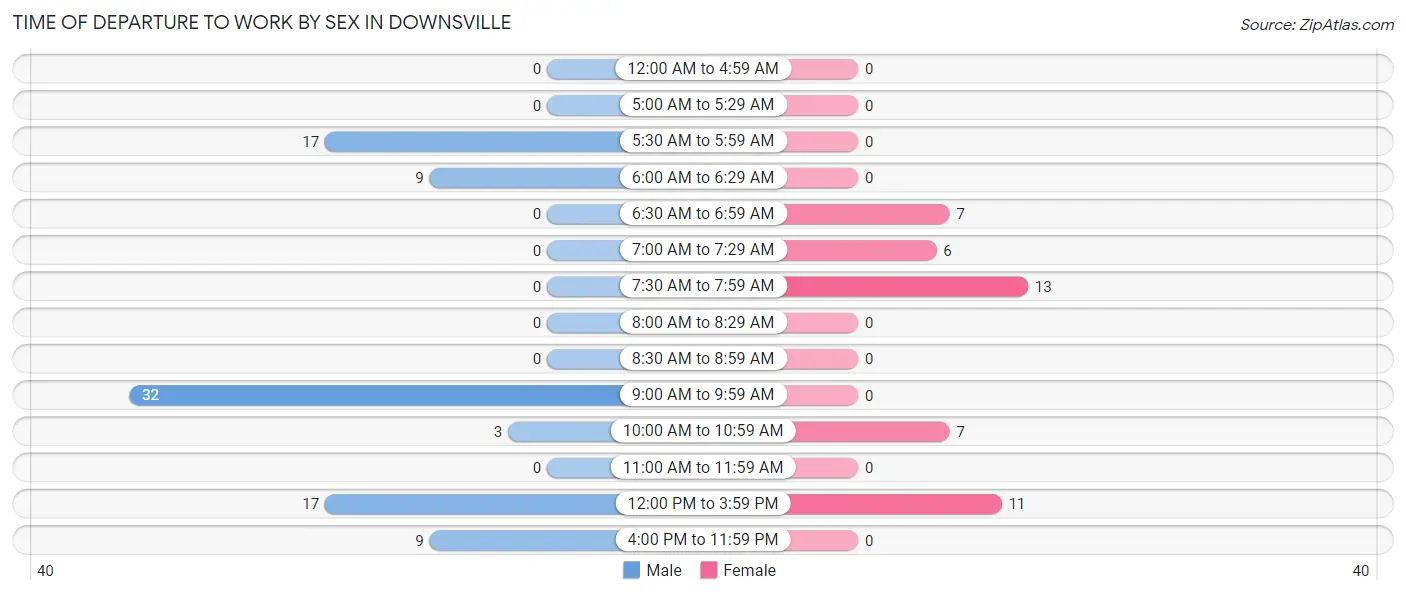
| Time of Departure | Male | Female |
| 12:00 AM to 4:59 AM | 0 (0.0%) | 0 (0.0%) |
| 5:00 AM to 5:29 AM | 0 (0.0%) | 0 (0.0%) |
| 5:30 AM to 5:59 AM | 17 (19.5%) | 0 (0.0%) |
| 6:00 AM to 6:29 AM | 9 (10.3%) | 0 (0.0%) |
| 6:30 AM to 6:59 AM | 0 (0.0%) | 7 (15.9%) |
| 7:00 AM to 7:29 AM | 0 (0.0%) | 6 (13.6%) |
| 7:30 AM to 7:59 AM | 0 (0.0%) | 13 (29.5%) |
| 8:00 AM to 8:29 AM | 0 (0.0%) | 0 (0.0%) |
| 8:30 AM to 8:59 AM | 0 (0.0%) | 0 (0.0%) |
| 9:00 AM to 9:59 AM | 32 (36.8%) | 0 (0.0%) |
| 10:00 AM to 10:59 AM | 3 (3.5%) | 7 (15.9%) |
| 11:00 AM to 11:59 AM | 0 (0.0%) | 0 (0.0%) |
| 12:00 PM to 3:59 PM | 17 (19.5%) | 11 (25.0%) |
| 4:00 PM to 11:59 PM | 9 (10.3%) | 0 (0.0%) |
| Total | 87 (100.0%) | 44 (100.0%) |
Housing Occupancy in Downsville
Occupancy by Ownership in Downsville
Of the total 147 dwellings in Downsville, owner-occupied units account for 95 (64.6%), while renter-occupied units make up 52 (35.4%).
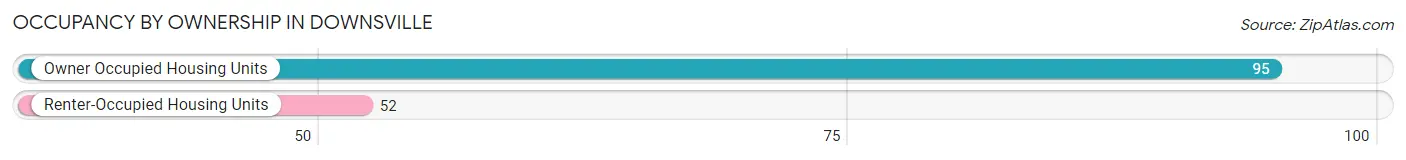
| Occupancy | # Housing Units | % Housing Units |
| Owner Occupied Housing Units | 95 | 64.6% |
| Renter-Occupied Housing Units | 52 | 35.4% |
| Total Occupied Housing Units | 147 | 100.0% |
Occupancy by Household Size in Downsville
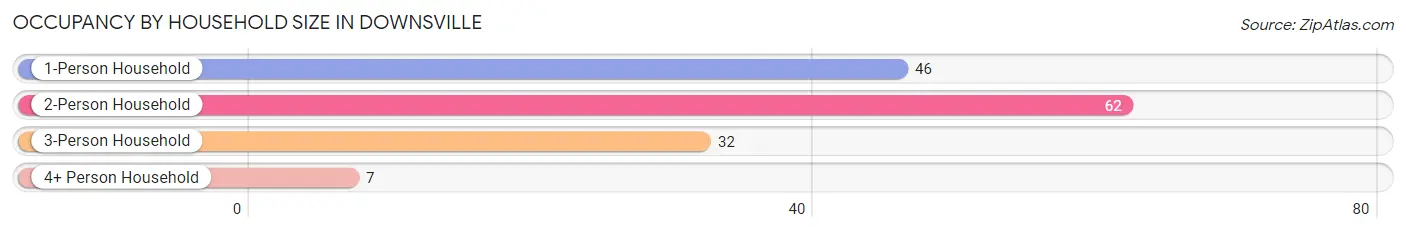
| Household Size | # Housing Units | % Housing Units |
| 1-Person Household | 46 | 31.3% |
| 2-Person Household | 62 | 42.2% |
| 3-Person Household | 32 | 21.8% |
| 4+ Person Household | 7 | 4.8% |
| Total Housing Units | 147 | 100.0% |
Occupancy by Ownership by Household Size in Downsville
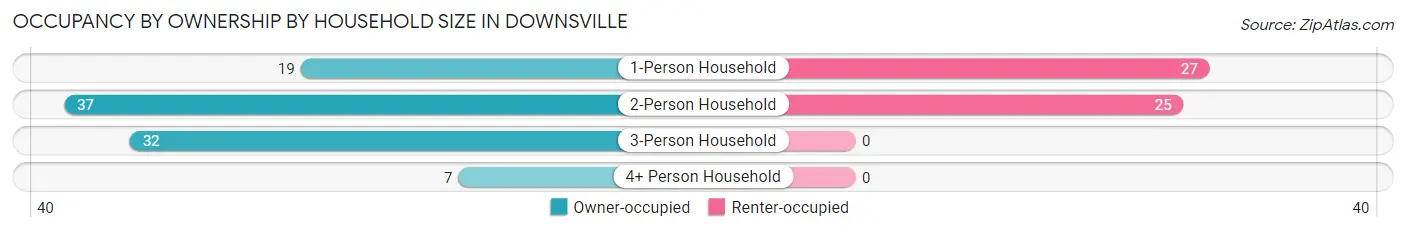
| Household Size | Owner-occupied | Renter-occupied |
| 1-Person Household | 19 (41.3%) | 27 (58.7%) |
| 2-Person Household | 37 (59.7%) | 25 (40.3%) |
| 3-Person Household | 32 (100.0%) | 0 (0.0%) |
| 4+ Person Household | 7 (100.0%) | 0 (0.0%) |
| Total Housing Units | 95 (64.6%) | 52 (35.4%) |
Occupancy by Educational Attainment in Downsville
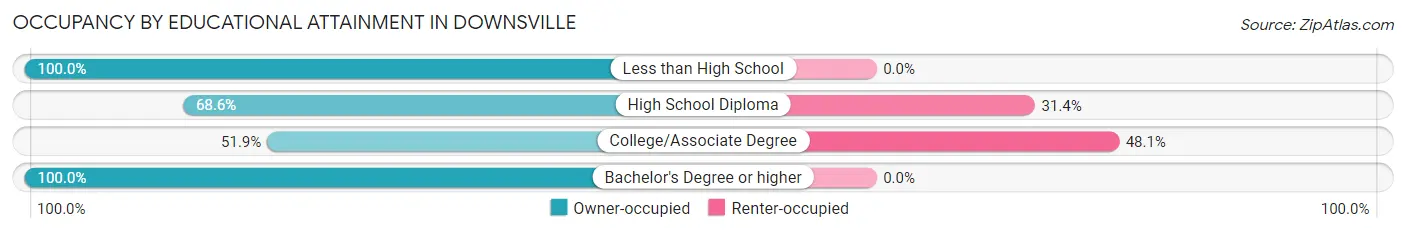
| Household Size | Owner-occupied | Renter-occupied |
| Less than High School | 3 (100.0%) | 0 (0.0%) |
| High School Diploma | 59 (68.6%) | 27 (31.4%) |
| College/Associate Degree | 27 (51.9%) | 25 (48.1%) |
| Bachelor's Degree or higher | 6 (100.0%) | 0 (0.0%) |
Occupancy by Age of Householder in Downsville
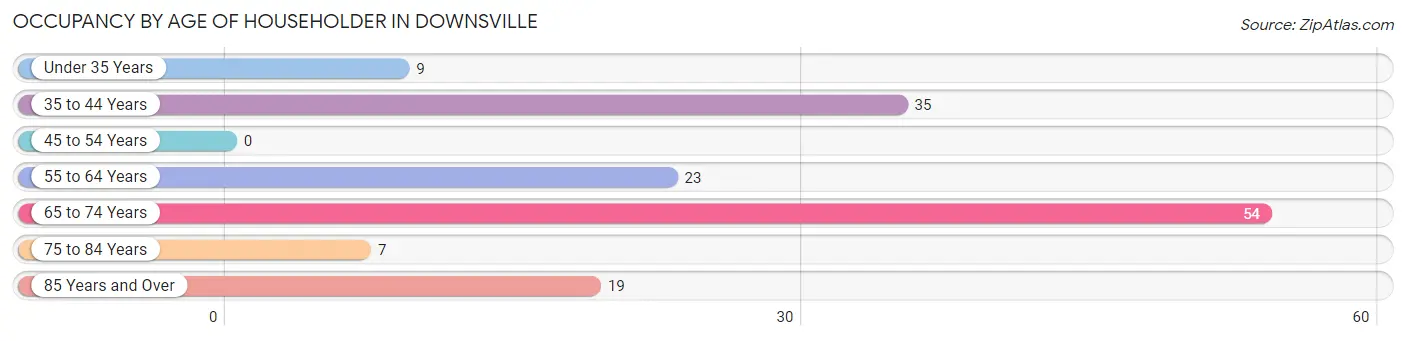
| Age Bracket | # Households | % Households |
| Under 35 Years | 9 | 6.1% |
| 35 to 44 Years | 35 | 23.8% |
| 45 to 54 Years | 0 | 0.0% |
| 55 to 64 Years | 23 | 15.7% |
| 65 to 74 Years | 54 | 36.7% |
| 75 to 84 Years | 7 | 4.8% |
| 85 Years and Over | 19 | 12.9% |
| Total | 147 | 100.0% |
Housing Finances in Downsville
Median Income by Occupancy in Downsville
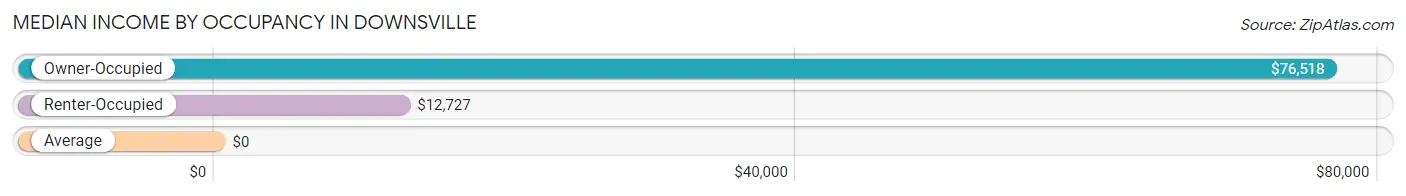
| Occupancy Type | # Households | Median Income |
| Owner-Occupied | 95 (64.6%) | $76,518 |
| Renter-Occupied | 52 (35.4%) | $12,727 |
| Average | 147 (100.0%) | $0 |
Occupancy by Householder Income Bracket in Downsville
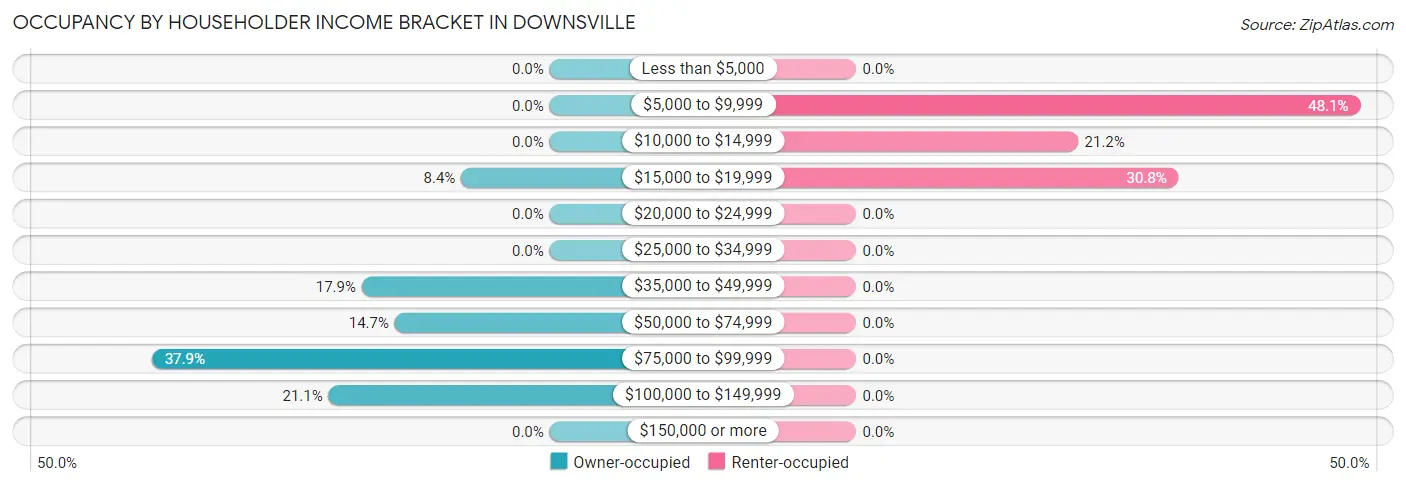
| Income Bracket | Owner-occupied | Renter-occupied |
| Less than $5,000 | 0 (0.0%) | 0 (0.0%) |
| $5,000 to $9,999 | 0 (0.0%) | 25 (48.1%) |
| $10,000 to $14,999 | 0 (0.0%) | 11 (21.1%) |
| $15,000 to $19,999 | 8 (8.4%) | 16 (30.8%) |
| $20,000 to $24,999 | 0 (0.0%) | 0 (0.0%) |
| $25,000 to $34,999 | 0 (0.0%) | 0 (0.0%) |
| $35,000 to $49,999 | 17 (17.9%) | 0 (0.0%) |
| $50,000 to $74,999 | 14 (14.7%) | 0 (0.0%) |
| $75,000 to $99,999 | 36 (37.9%) | 0 (0.0%) |
| $100,000 to $149,999 | 20 (21.0%) | 0 (0.0%) |
| $150,000 or more | 0 (0.0%) | 0 (0.0%) |
| Total | 95 (100.0%) | 52 (100.0%) |
Monthly Housing Cost Tiers in Downsville
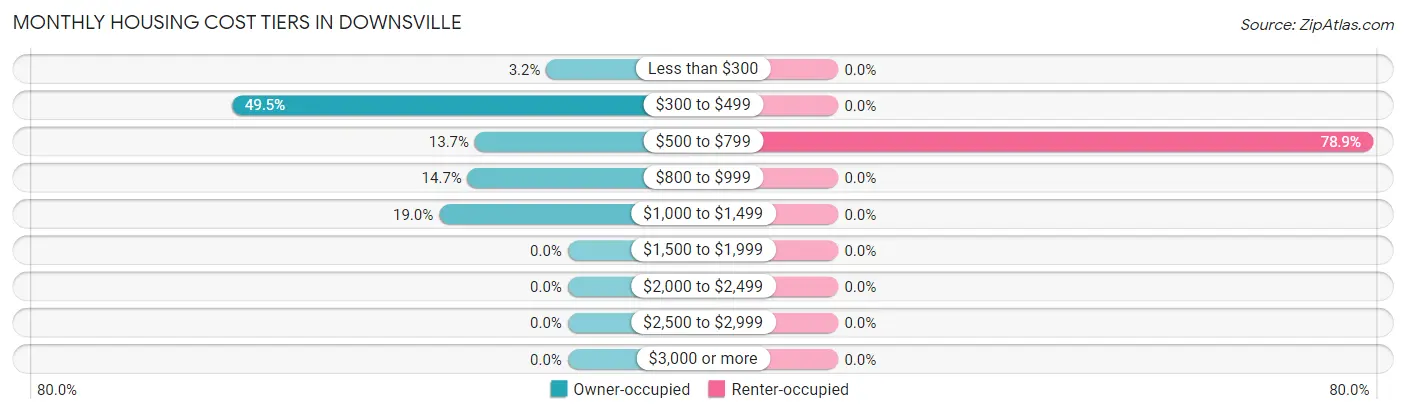
| Monthly Cost | Owner-occupied | Renter-occupied |
| Less than $300 | 3 (3.2%) | 0 (0.0%) |
| $300 to $499 | 47 (49.5%) | 0 (0.0%) |
| $500 to $799 | 13 (13.7%) | 41 (78.8%) |
| $800 to $999 | 14 (14.7%) | 0 (0.0%) |
| $1,000 to $1,499 | 18 (19.0%) | 0 (0.0%) |
| $1,500 to $1,999 | 0 (0.0%) | 0 (0.0%) |
| $2,000 to $2,499 | 0 (0.0%) | 0 (0.0%) |
| $2,500 to $2,999 | 0 (0.0%) | 0 (0.0%) |
| $3,000 or more | 0 (0.0%) | 0 (0.0%) |
| Total | 95 (100.0%) | 52 (100.0%) |
Physical Housing Characteristics in Downsville
Housing Structures in Downsville
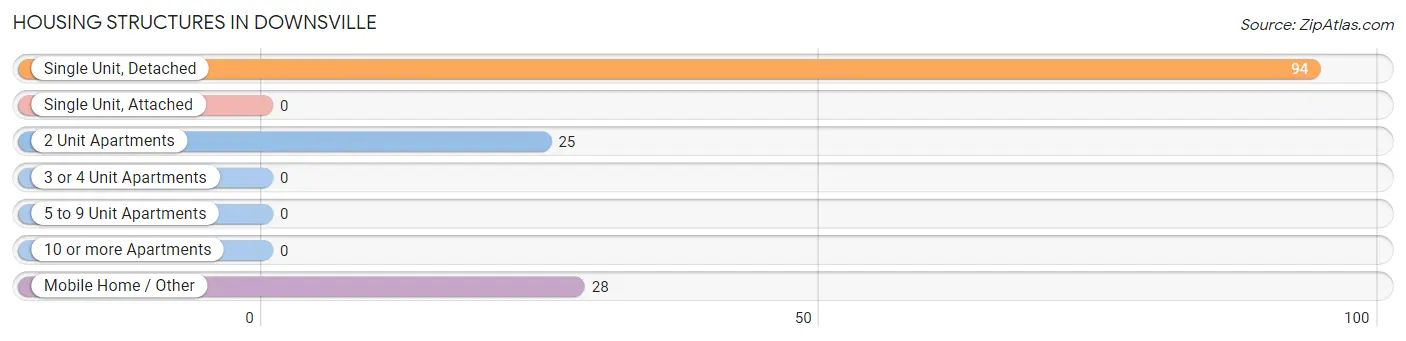
| Structure Type | # Housing Units | % Housing Units |
| Single Unit, Detached | 94 | 63.9% |
| Single Unit, Attached | 0 | 0.0% |
| 2 Unit Apartments | 25 | 17.0% |
| 3 or 4 Unit Apartments | 0 | 0.0% |
| 5 to 9 Unit Apartments | 0 | 0.0% |
| 10 or more Apartments | 0 | 0.0% |
| Mobile Home / Other | 28 | 19.1% |
| Total | 147 | 100.0% |
Housing Structures by Occupancy in Downsville
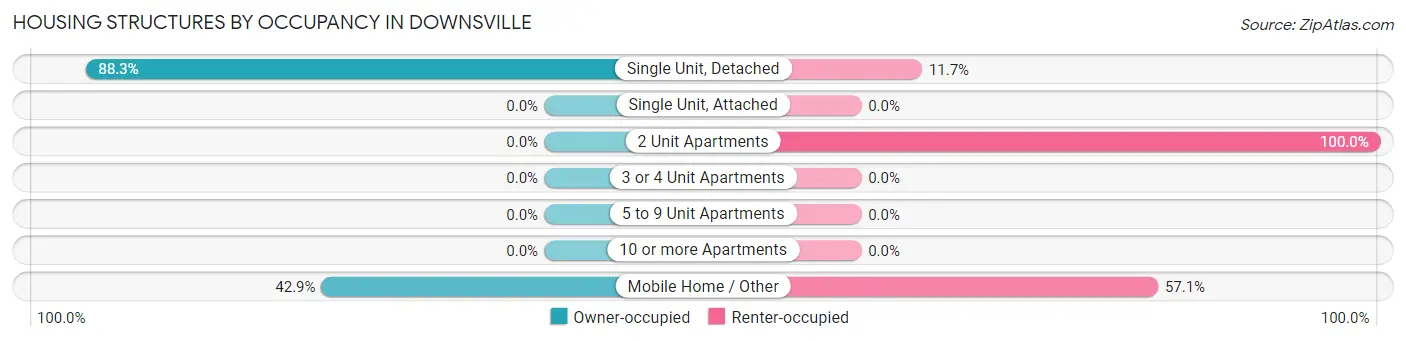
| Structure Type | Owner-occupied | Renter-occupied |
| Single Unit, Detached | 83 (88.3%) | 11 (11.7%) |
| Single Unit, Attached | 0 (0.0%) | 0 (0.0%) |
| 2 Unit Apartments | 0 (0.0%) | 25 (100.0%) |
| 3 or 4 Unit Apartments | 0 (0.0%) | 0 (0.0%) |
| 5 to 9 Unit Apartments | 0 (0.0%) | 0 (0.0%) |
| 10 or more Apartments | 0 (0.0%) | 0 (0.0%) |
| Mobile Home / Other | 12 (42.9%) | 16 (57.1%) |
| Total | 95 (64.6%) | 52 (35.4%) |
Housing Structures by Number of Rooms in Downsville
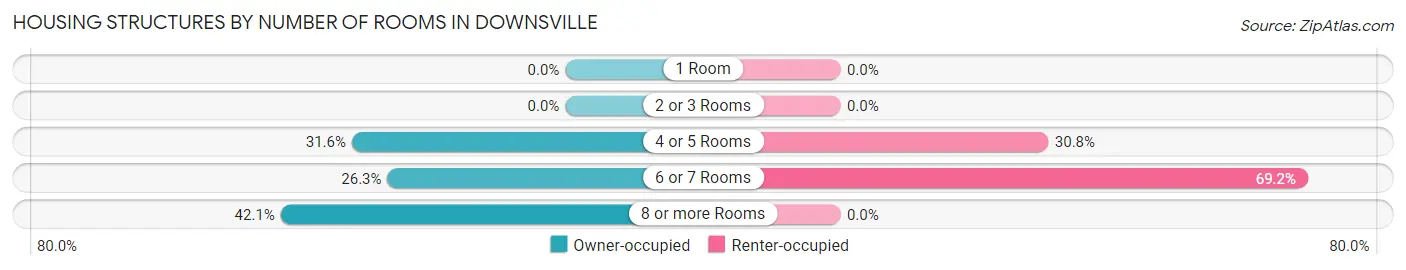
| Number of Rooms | Owner-occupied | Renter-occupied |
| 1 Room | 0 (0.0%) | 0 (0.0%) |
| 2 or 3 Rooms | 0 (0.0%) | 0 (0.0%) |
| 4 or 5 Rooms | 30 (31.6%) | 16 (30.8%) |
| 6 or 7 Rooms | 25 (26.3%) | 36 (69.2%) |
| 8 or more Rooms | 40 (42.1%) | 0 (0.0%) |
| Total | 95 (100.0%) | 52 (100.0%) |
Housing Structure by Heating Type in Downsville
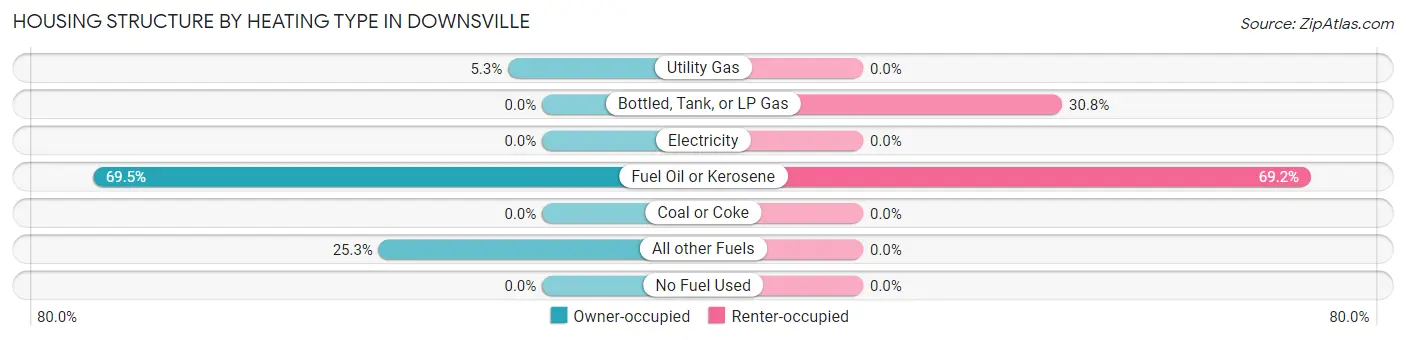
| Heating Type | Owner-occupied | Renter-occupied |
| Utility Gas | 5 (5.3%) | 0 (0.0%) |
| Bottled, Tank, or LP Gas | 0 (0.0%) | 16 (30.8%) |
| Electricity | 0 (0.0%) | 0 (0.0%) |
| Fuel Oil or Kerosene | 66 (69.5%) | 36 (69.2%) |
| Coal or Coke | 0 (0.0%) | 0 (0.0%) |
| All other Fuels | 24 (25.3%) | 0 (0.0%) |
| No Fuel Used | 0 (0.0%) | 0 (0.0%) |
| Total | 95 (100.0%) | 52 (100.0%) |
Household Vehicle Usage in Downsville
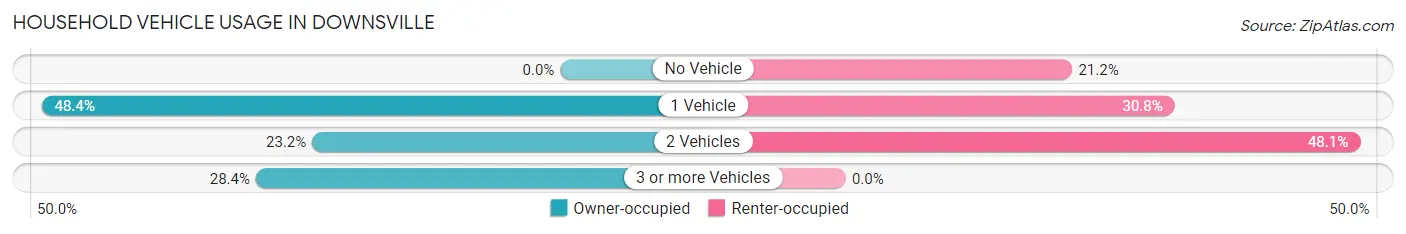
| Vehicles per Household | Owner-occupied | Renter-occupied |
| No Vehicle | 0 (0.0%) | 11 (21.1%) |
| 1 Vehicle | 46 (48.4%) | 16 (30.8%) |
| 2 Vehicles | 22 (23.2%) | 25 (48.1%) |
| 3 or more Vehicles | 27 (28.4%) | 0 (0.0%) |
| Total | 95 (100.0%) | 52 (100.0%) |
Real Estate & Mortgages in Downsville
Real Estate and Mortgage Overview in Downsville
| Characteristic | Without Mortgage | With Mortgage |
| Housing Units | 68 | 27 |
| Median Property Value | $126,600 | $201,800 |
| Median Household Income | $69,107 | $0 |
| Monthly Housing Costs | $430 | $0 |
| Real Estate Taxes | $1,238 | $0 |
Property Value by Mortgage Status in Downsville
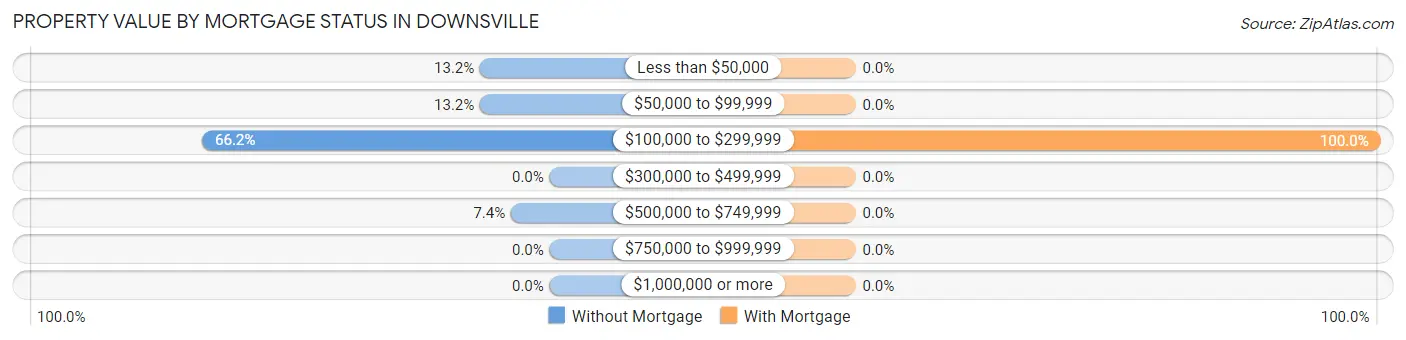
| Property Value | Without Mortgage | With Mortgage |
| Less than $50,000 | 9 (13.2%) | 0 (0.0%) |
| $50,000 to $99,999 | 9 (13.2%) | 0 (0.0%) |
| $100,000 to $299,999 | 45 (66.2%) | 27 (100.0%) |
| $300,000 to $499,999 | 0 (0.0%) | 0 (0.0%) |
| $500,000 to $749,999 | 5 (7.3%) | 0 (0.0%) |
| $750,000 to $999,999 | 0 (0.0%) | 0 (0.0%) |
| $1,000,000 or more | 0 (0.0%) | 0 (0.0%) |
| Total | 68 (100.0%) | 27 (100.0%) |
Household Income by Mortgage Status in Downsville
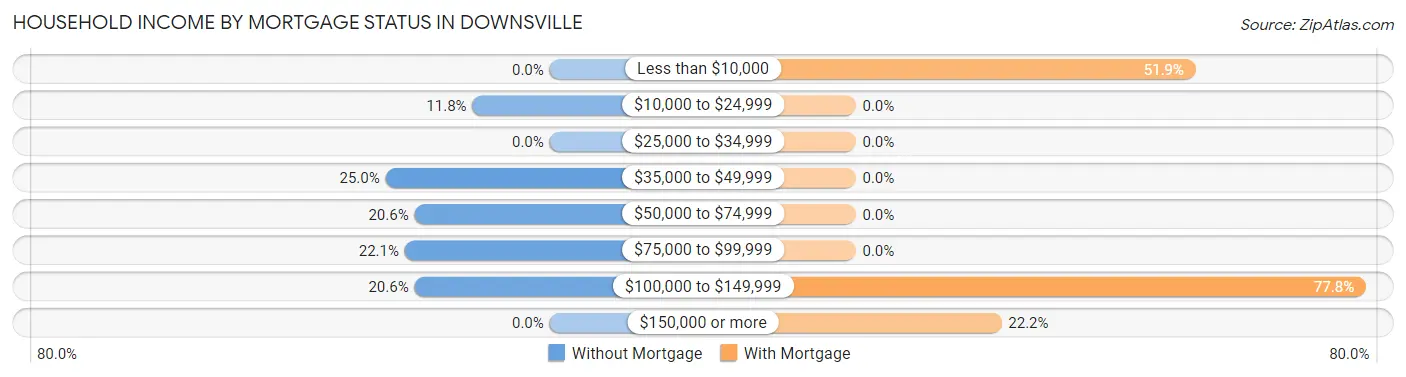
| Household Income | Without Mortgage | With Mortgage |
| Less than $10,000 | 0 (0.0%) | 14 (51.8%) |
| $10,000 to $24,999 | 8 (11.8%) | 0 (0.0%) |
| $25,000 to $34,999 | 0 (0.0%) | 0 (0.0%) |
| $35,000 to $49,999 | 17 (25.0%) | 0 (0.0%) |
| $50,000 to $74,999 | 14 (20.6%) | 0 (0.0%) |
| $75,000 to $99,999 | 15 (22.1%) | 0 (0.0%) |
| $100,000 to $149,999 | 14 (20.6%) | 21 (77.8%) |
| $150,000 or more | 0 (0.0%) | 6 (22.2%) |
| Total | 68 (100.0%) | 27 (100.0%) |
Property Value to Household Income Ratio in Downsville
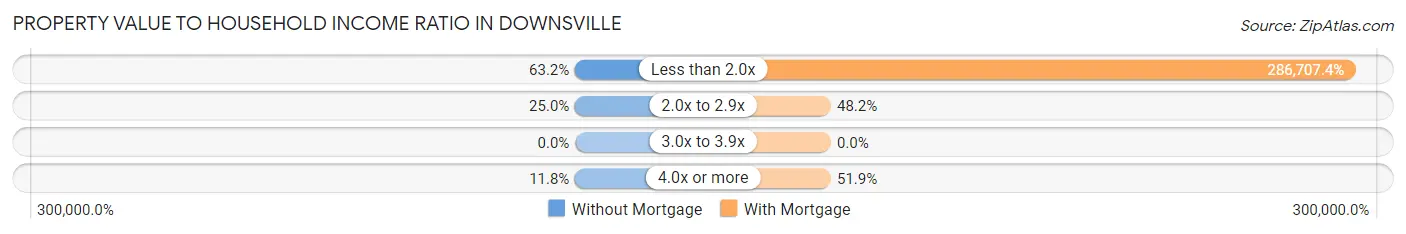
| Value-to-Income Ratio | Without Mortgage | With Mortgage |
| Less than 2.0x | 43 (63.2%) | 77,411 (286,707.4%) |
| 2.0x to 2.9x | 17 (25.0%) | 13 (48.1%) |
| 3.0x to 3.9x | 0 (0.0%) | 0 (0.0%) |
| 4.0x or more | 8 (11.8%) | 14 (51.8%) |
| Total | 68 (100.0%) | 27 (100.0%) |
Real Estate Taxes by Mortgage Status in Downsville
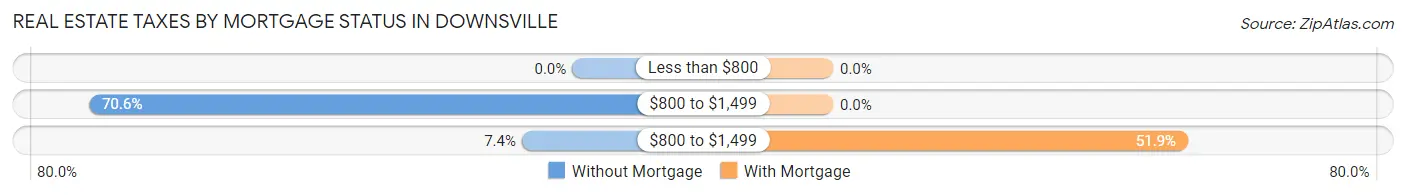
| Property Taxes | Without Mortgage | With Mortgage |
| Less than $800 | 0 (0.0%) | 0 (0.0%) |
| $800 to $1,499 | 48 (70.6%) | 0 (0.0%) |
| $800 to $1,499 | 5 (7.3%) | 14 (51.8%) |
| Total | 68 (100.0%) | 27 (100.0%) |
Health & Disability in Downsville
Health Insurance Coverage by Age in Downsville
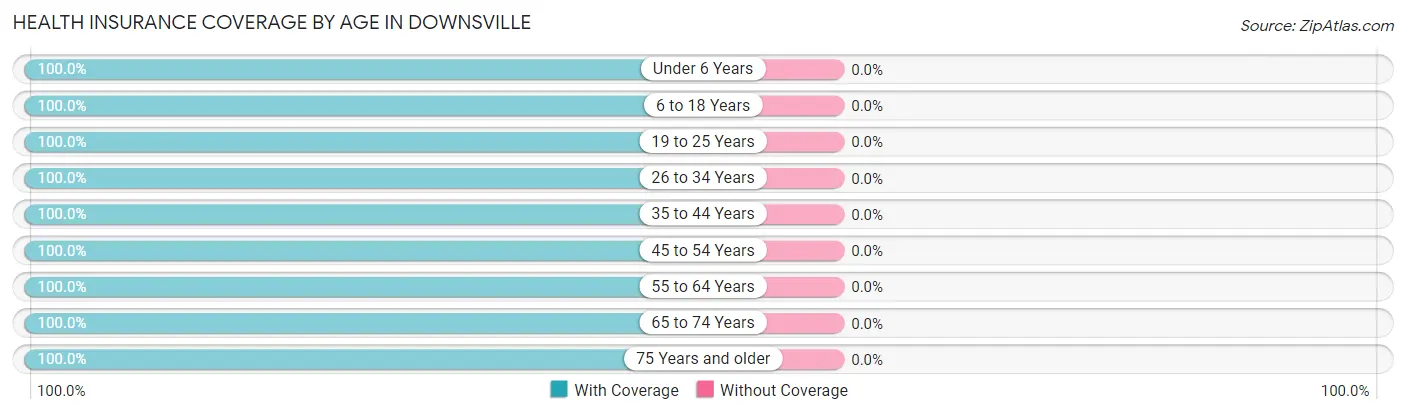
| Age Bracket | With Coverage | Without Coverage |
| Under 6 Years | 7 (100.0%) | 0 (0.0%) |
| 6 to 18 Years | 40 (100.0%) | 0 (0.0%) |
| 19 to 25 Years | 12 (100.0%) | 0 (0.0%) |
| 26 to 34 Years | 27 (100.0%) | 0 (0.0%) |
| 35 to 44 Years | 35 (100.0%) | 0 (0.0%) |
| 45 to 54 Years | 25 (100.0%) | 0 (0.0%) |
| 55 to 64 Years | 48 (100.0%) | 0 (0.0%) |
| 65 to 74 Years | 82 (100.0%) | 0 (0.0%) |
| 75 Years and older | 39 (100.0%) | 0 (0.0%) |
| Total | 315 (100.0%) | 0 (0.0%) |
Health Insurance Coverage by Citizenship Status in Downsville
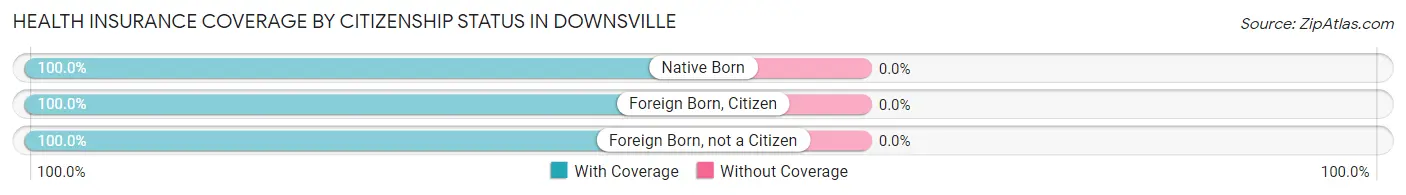
| Citizenship Status | With Coverage | Without Coverage |
| Native Born | 7 (100.0%) | 0 (0.0%) |
| Foreign Born, Citizen | 40 (100.0%) | 0 (0.0%) |
| Foreign Born, not a Citizen | 12 (100.0%) | 0 (0.0%) |
Health Insurance Coverage by Household Income in Downsville
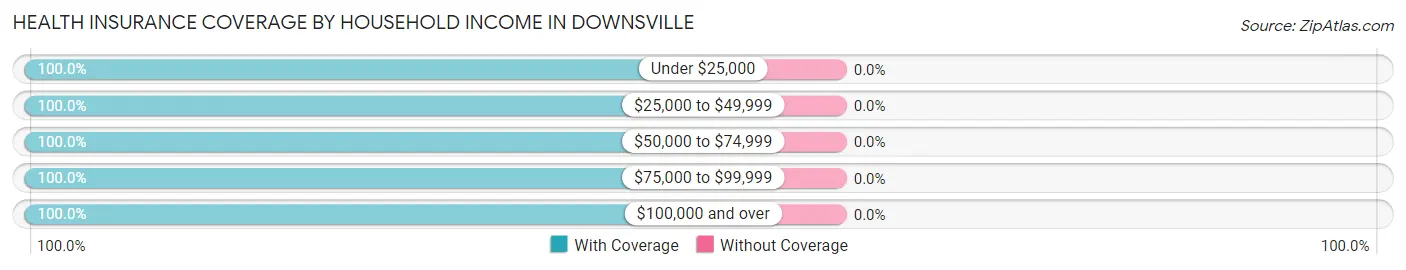
| Household Income | With Coverage | Without Coverage |
| Under $25,000 | 85 (100.0%) | 0 (0.0%) |
| $25,000 to $49,999 | 59 (100.0%) | 0 (0.0%) |
| $50,000 to $74,999 | 27 (100.0%) | 0 (0.0%) |
| $75,000 to $99,999 | 102 (100.0%) | 0 (0.0%) |
| $100,000 and over | 42 (100.0%) | 0 (0.0%) |
Public vs Private Health Insurance Coverage by Age in Downsville
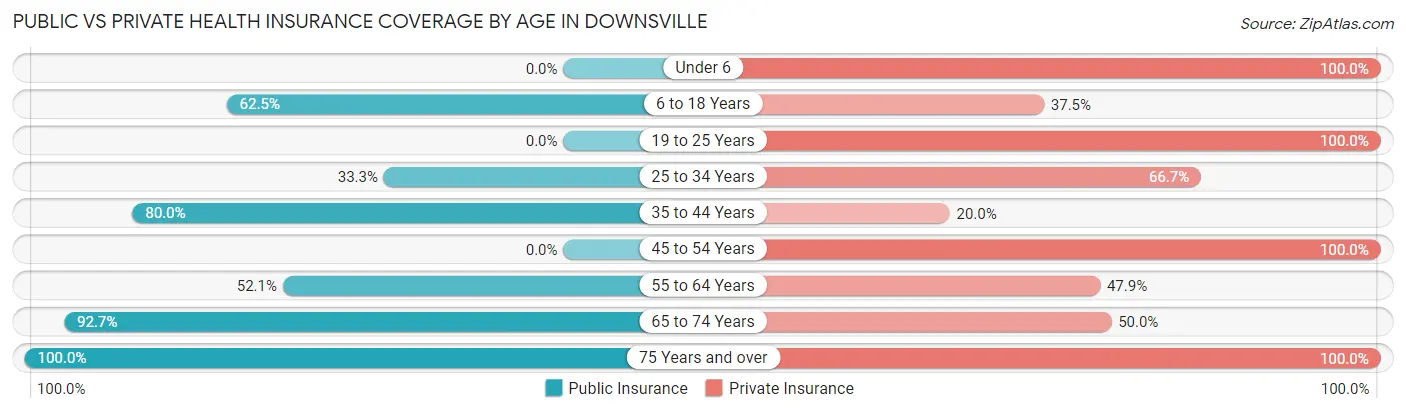
| Age Bracket | Public Insurance | Private Insurance |
| Under 6 | 0 (0.0%) | 7 (100.0%) |
| 6 to 18 Years | 25 (62.5%) | 15 (37.5%) |
| 19 to 25 Years | 0 (0.0%) | 12 (100.0%) |
| 25 to 34 Years | 9 (33.3%) | 18 (66.7%) |
| 35 to 44 Years | 28 (80.0%) | 7 (20.0%) |
| 45 to 54 Years | 0 (0.0%) | 25 (100.0%) |
| 55 to 64 Years | 25 (52.1%) | 23 (47.9%) |
| 65 to 74 Years | 76 (92.7%) | 41 (50.0%) |
| 75 Years and over | 39 (100.0%) | 39 (100.0%) |
| Total | 202 (64.1%) | 187 (59.4%) |
Disability Status by Sex by Age in Downsville
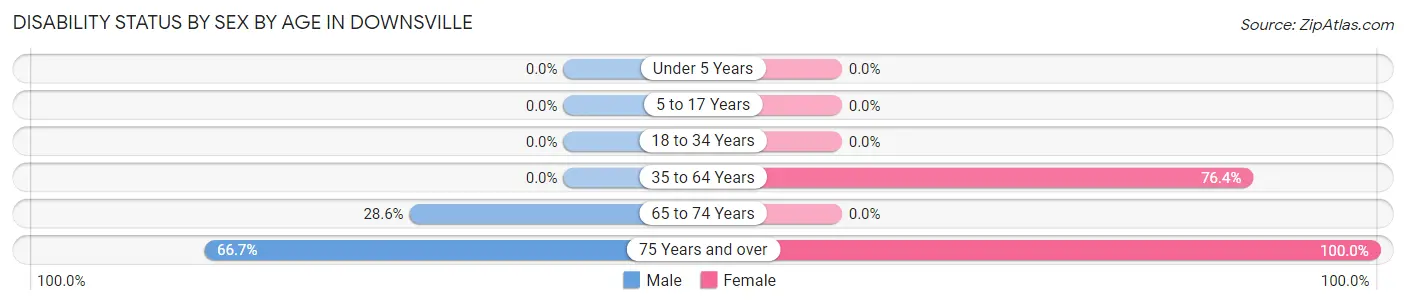
| Age Bracket | Male | Female |
| Under 5 Years | 0 (0.0%) | 0 (0.0%) |
| 5 to 17 Years | 0 (0.0%) | 0 (0.0%) |
| 18 to 34 Years | 0 (0.0%) | 0 (0.0%) |
| 35 to 64 Years | 0 (0.0%) | 42 (76.4%) |
| 65 to 74 Years | 6 (28.6%) | 0 (0.0%) |
| 75 Years and over | 14 (66.7%) | 18 (100.0%) |
Disability Class by Sex by Age in Downsville
Disability Class: Hearing Difficulty
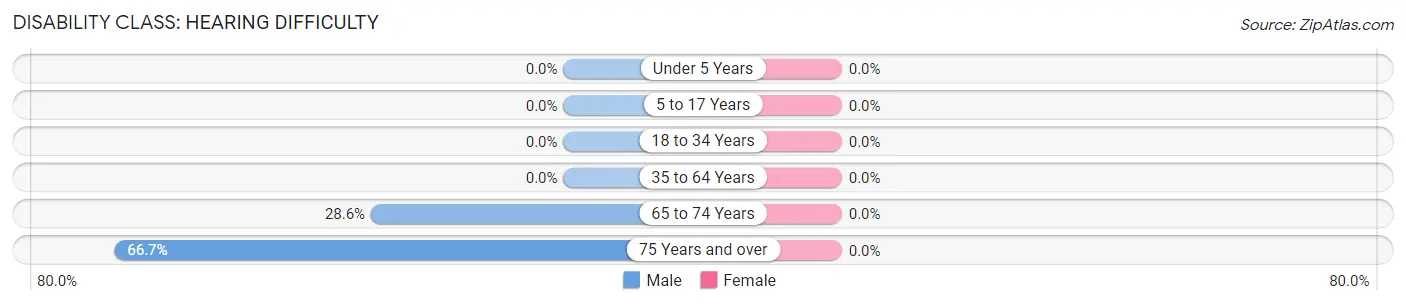
| Age Bracket | Male | Female |
| Under 5 Years | 0 (0.0%) | 0 (0.0%) |
| 5 to 17 Years | 0 (0.0%) | 0 (0.0%) |
| 18 to 34 Years | 0 (0.0%) | 0 (0.0%) |
| 35 to 64 Years | 0 (0.0%) | 0 (0.0%) |
| 65 to 74 Years | 6 (28.6%) | 0 (0.0%) |
| 75 Years and over | 14 (66.7%) | 0 (0.0%) |
Disability Class: Vision Difficulty
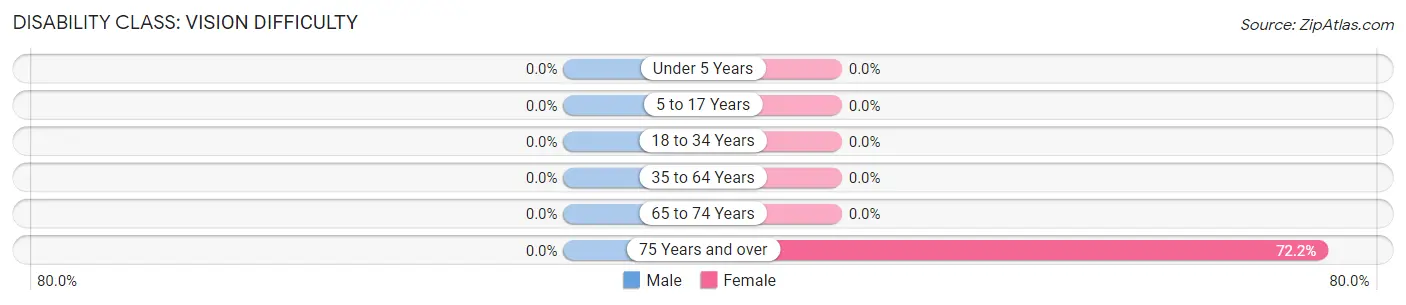
| Age Bracket | Male | Female |
| Under 5 Years | 0 (0.0%) | 0 (0.0%) |
| 5 to 17 Years | 0 (0.0%) | 0 (0.0%) |
| 18 to 34 Years | 0 (0.0%) | 0 (0.0%) |
| 35 to 64 Years | 0 (0.0%) | 0 (0.0%) |
| 65 to 74 Years | 0 (0.0%) | 0 (0.0%) |
| 75 Years and over | 0 (0.0%) | 13 (72.2%) |
Disability Class: Cognitive Difficulty
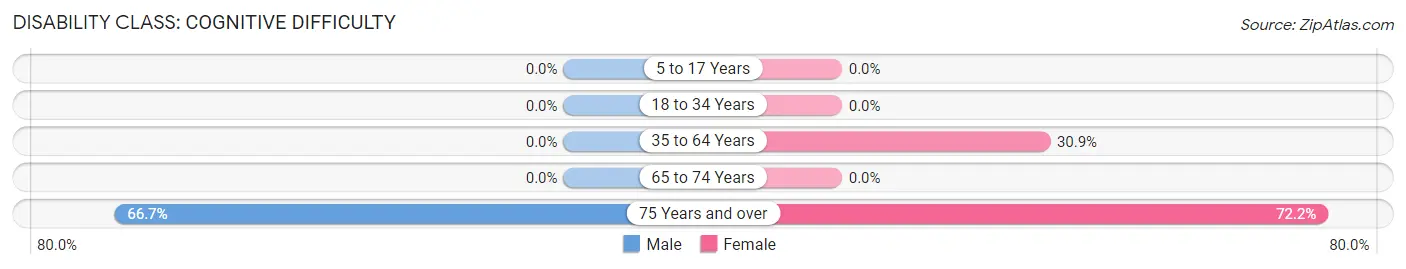
| Age Bracket | Male | Female |
| 5 to 17 Years | 0 (0.0%) | 0 (0.0%) |
| 18 to 34 Years | 0 (0.0%) | 0 (0.0%) |
| 35 to 64 Years | 0 (0.0%) | 17 (30.9%) |
| 65 to 74 Years | 0 (0.0%) | 0 (0.0%) |
| 75 Years and over | 14 (66.7%) | 13 (72.2%) |
Disability Class: Ambulatory Difficulty
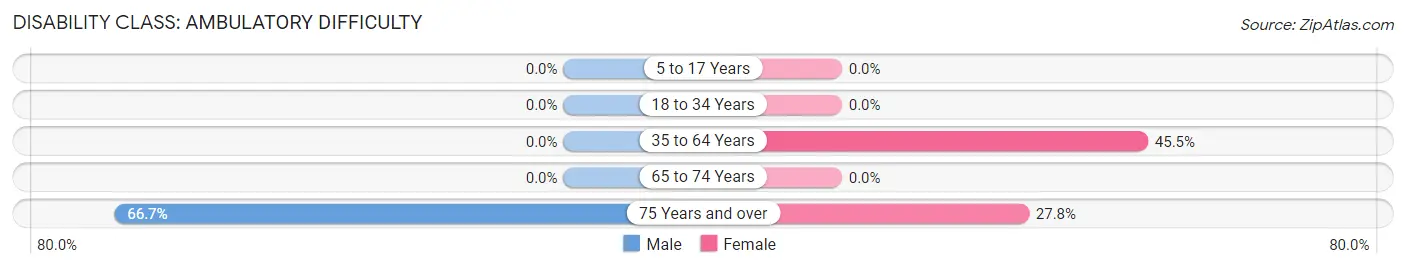
| Age Bracket | Male | Female |
| 5 to 17 Years | 0 (0.0%) | 0 (0.0%) |
| 18 to 34 Years | 0 (0.0%) | 0 (0.0%) |
| 35 to 64 Years | 0 (0.0%) | 25 (45.5%) |
| 65 to 74 Years | 0 (0.0%) | 0 (0.0%) |
| 75 Years and over | 14 (66.7%) | 5 (27.8%) |
Disability Class: Self-Care Difficulty
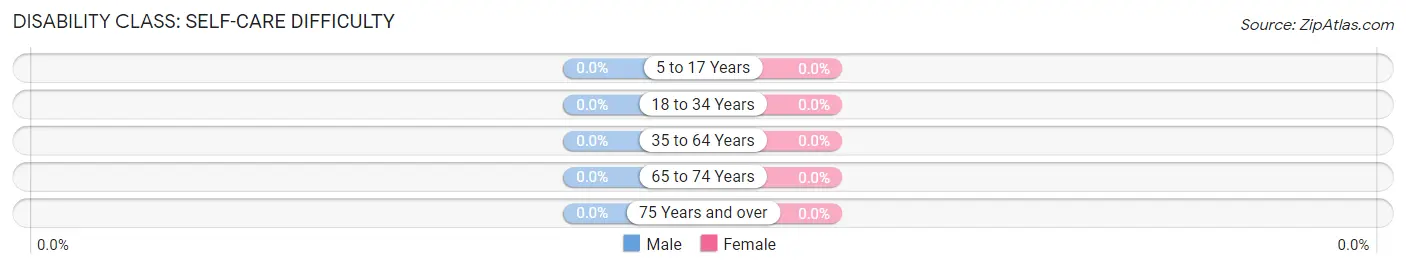
| Age Bracket | Male | Female |
| 5 to 17 Years | 0 (0.0%) | 0 (0.0%) |
| 18 to 34 Years | 0 (0.0%) | 0 (0.0%) |
| 35 to 64 Years | 0 (0.0%) | 0 (0.0%) |
| 65 to 74 Years | 0 (0.0%) | 0 (0.0%) |
| 75 Years and over | 0 (0.0%) | 0 (0.0%) |
Technology Access in Downsville
Computing Device Access in Downsville
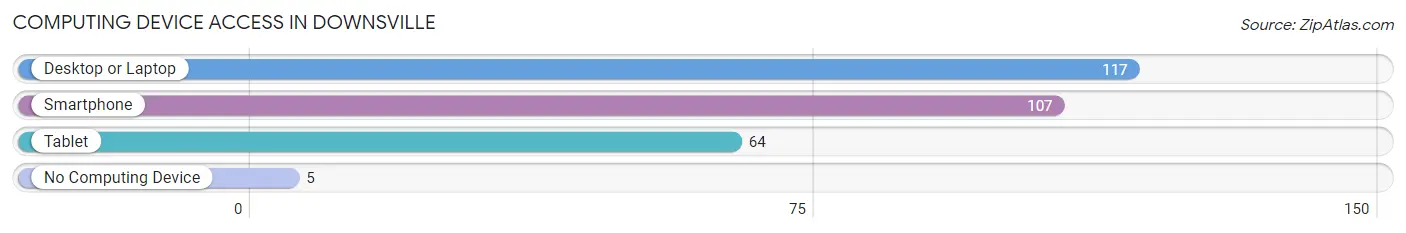
| Device Type | # Households | % Households |
| Desktop or Laptop | 117 | 79.6% |
| Smartphone | 107 | 72.8% |
| Tablet | 64 | 43.5% |
| No Computing Device | 5 | 3.4% |
| Total | 147 | 100.0% |
Internet Access in Downsville
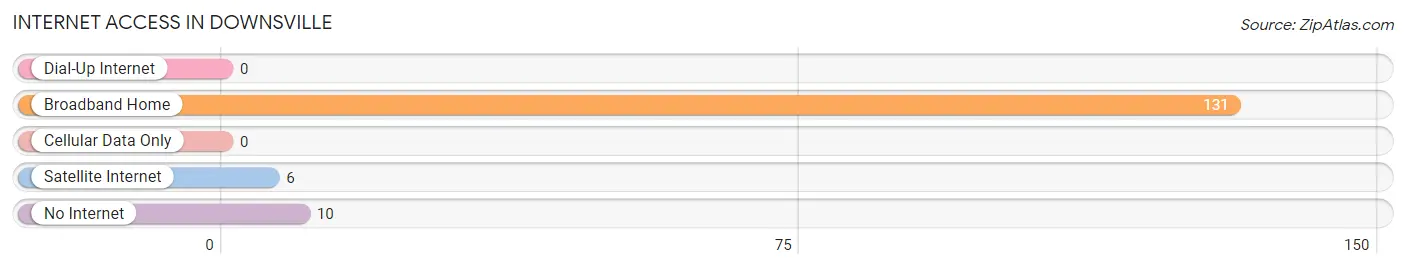
| Internet Type | # Households | % Households |
| Dial-Up Internet | 0 | 0.0% |
| Broadband Home | 131 | 89.1% |
| Cellular Data Only | 0 | 0.0% |
| Satellite Internet | 6 | 4.1% |
| No Internet | 10 | 6.8% |
| Total | 147 | 100.0% |
Downsville Summary
Downsville is a small hamlet located in the town of Colchester, Delaware County, New York. It is situated on the east bank of the Delaware River, approximately 10 miles north of the village of Hancock. The population of Downsville was estimated to be around 200 people in 2020.
History
Downsville was first settled in the late 1700s by a group of settlers from Connecticut. The town was named after the Downs family, who were among the first settlers. The Downs family owned a large tract of land in the area, which was used for farming and timber production.
In the early 1800s, the town was a thriving center of commerce and industry. The Delaware and Hudson Canal, which ran through the town, provided a means of transportation for goods and people. The canal also provided power for the many mills and factories that were located in the area.
In the late 1800s, the town began to decline as the canal was replaced by the railroad. The railroad was more efficient and cheaper to operate, and it eventually replaced the canal as the main form of transportation in the area.
Geography
Downsville is located in the Catskill Mountains region of New York. The town is situated on the east bank of the Delaware River, approximately 10 miles north of the village of Hancock. The terrain is mostly hilly and forested, with some open fields and meadows. The town is surrounded by the towns of Colchester, Hancock, and Deposit.
The climate in Downsville is generally mild, with cold winters and warm summers. The average annual temperature is around 50 degrees Fahrenheit. The average annual precipitation is around 40 inches.
Economy
The economy of Downsville is largely based on tourism and agriculture. The town is home to several small businesses, including a general store, a restaurant, and a bed and breakfast. The town also has a small airport, which is used for recreational flying.
Agriculture is an important part of the local economy. The town is home to several farms, which produce a variety of crops, including corn, soybeans, hay, and vegetables. The town also has a small winery, which produces a variety of wines.
Demographics
As of the 2020 census, the population of Downsville was estimated to be around 200 people. The racial makeup of the town was 97.5% White, 0.5% African American, 0.5% Native American, and 1.5% from other races. The median household income was $37,500, and the median home value was $125,000.
Conclusion
Downsville is a small hamlet located in the town of Colchester, Delaware County, New York. It is situated on the east bank of the Delaware River, approximately 10 miles north of the village of Hancock. The population of Downsville was estimated to be around 200 people in 2020. The economy of Downsville is largely based on tourism and agriculture, and the town is home to several small businesses. The racial makeup of the town was 97.5% White, 0.5% African American, 0.5% Native American, and 1.5% from other races. The median household income was $37,500, and the median home value was $125,000.
Common Questions
What is Per Capita Income in Downsville?
Per Capita income in Downsville is $26,272.
What is the Median Family Income in Downsville?
Median Family Income in Downsville is $68,482.
What is Inequality or Gini Index in Downsville?
Inequality or Gini Index in Downsville is 0.40.
What is the Total Population of Downsville?
Total Population of Downsville is 315.
What is the Total Male Population of Downsville?
Total Male Population of Downsville is 150.
What is the Total Female Population of Downsville?
Total Female Population of Downsville is 165.
What is the Ratio of Males per 100 Females in Downsville?
There are 90.91 Males per 100 Females in Downsville.
What is the Ratio of Females per 100 Males in Downsville?
There are 110.00 Females per 100 Males in Downsville.
What is the Median Population Age in Downsville?
Median Population Age in Downsville is 61.3 Years.
What is the Average Family Size in Downsville
Average Family Size in Downsville is 2.7 People.
What is the Average Household Size in Downsville
Average Household Size in Downsville is 2.1 People.
How Large is the Labor Force in Downsville?
There are 137 People in the Labor Forcein in Downsville.
What is the Percentage of People in the Labor Force in Downsville?
50.0% of People are in the Labor Force in Downsville.
What is the Unemployment Rate in Downsville?
Unemployment Rate in Downsville is 4.4%.