West Chazy, NY Map & Demographics
West Chazy Map
West Chazy Overview
$24,273
PER CAPITA INCOME
$85,438
AVG FAMILY INCOME
$85,125
AVG HOUSEHOLD INCOME
0.24
INEQUALITY / GINI INDEX
481
TOTAL POPULATION
266
MALE POPULATION
215
FEMALE POPULATION
123.72
MALES / 100 FEMALES
80.83
FEMALES / 100 MALES
57.7
MEDIAN AGE
2.8
AVG FAMILY SIZE
2.8
AVG HOUSEHOLD SIZE
196
LABOR FORCE [ PEOPLE ]
47.9%
PERCENT IN LABOR FORCE
West Chazy Zip Codes
West Chazy Area Codes
Income in West Chazy
Income Overview in West Chazy
Per Capita Income in West Chazy is $24,273, while median incomes of families and households are $85,438 and $85,125 respectively.
| Characteristic | Number | Measure |
| Per Capita Income | 481 | $24,273 |
| Median Family Income | 169 | $85,438 |
| Mean Family Income | 169 | $70,354 |
| Median Household Income | 174 | $85,125 |
| Mean Household Income | 174 | $69,464 |
| Income Deficit | 169 | $0 |
| Wage / Income Gap (%) | 481 | 0.00% |
| Wage / Income Gap ($) | 481 | 100.00¢ per $1 |
| Gini / Inequality Index | 481 | 0.24 |
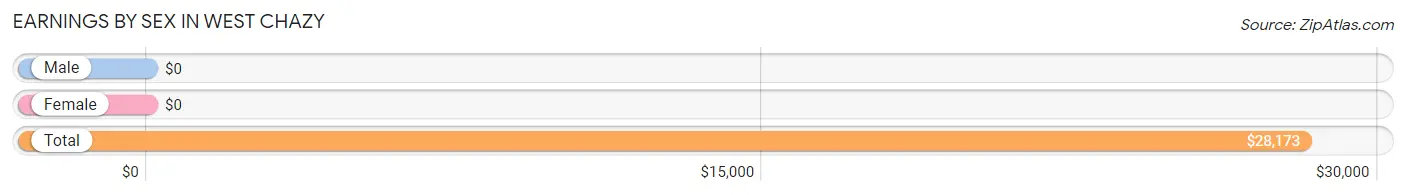
Earnings by Sex in West Chazy
| Sex | Number | Average Earnings |
| Male | 157 (65.4%) | $0 |
| Female | 83 (34.6%) | $0 |
| Total | 240 (100.0%) | $28,173 |
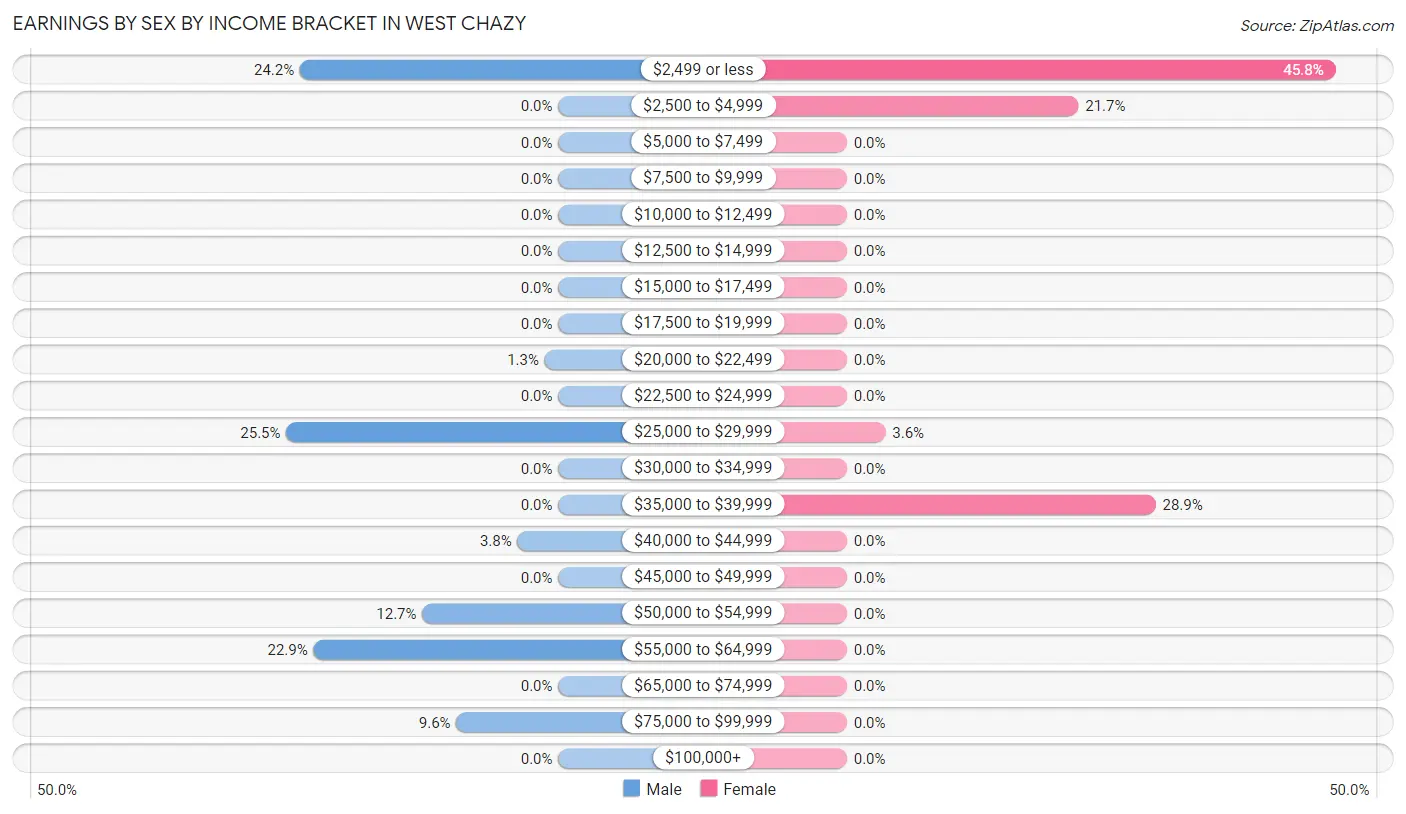
Earnings by Sex by Income Bracket in West Chazy
The most common earnings brackets in West Chazy are $25,000 to $29,999 for men (40 | 25.5%) and $2,499 or less for women (38 | 45.8%).
| Income | Male | Female |
| $2,499 or less | 38 (24.2%) | 38 (45.8%) |
| $2,500 to $4,999 | 0 (0.0%) | 18 (21.7%) |
| $5,000 to $7,499 | 0 (0.0%) | 0 (0.0%) |
| $7,500 to $9,999 | 0 (0.0%) | 0 (0.0%) |
| $10,000 to $12,499 | 0 (0.0%) | 0 (0.0%) |
| $12,500 to $14,999 | 0 (0.0%) | 0 (0.0%) |
| $15,000 to $17,499 | 0 (0.0%) | 0 (0.0%) |
| $17,500 to $19,999 | 0 (0.0%) | 0 (0.0%) |
| $20,000 to $22,499 | 2 (1.3%) | 0 (0.0%) |
| $22,500 to $24,999 | 0 (0.0%) | 0 (0.0%) |
| $25,000 to $29,999 | 40 (25.5%) | 3 (3.6%) |
| $30,000 to $34,999 | 0 (0.0%) | 0 (0.0%) |
| $35,000 to $39,999 | 0 (0.0%) | 24 (28.9%) |
| $40,000 to $44,999 | 6 (3.8%) | 0 (0.0%) |
| $45,000 to $49,999 | 0 (0.0%) | 0 (0.0%) |
| $50,000 to $54,999 | 20 (12.7%) | 0 (0.0%) |
| $55,000 to $64,999 | 36 (22.9%) | 0 (0.0%) |
| $65,000 to $74,999 | 0 (0.0%) | 0 (0.0%) |
| $75,000 to $99,999 | 15 (9.6%) | 0 (0.0%) |
| $100,000+ | 0 (0.0%) | 0 (0.0%) |
| Total | 157 (100.0%) | 83 (100.0%) |
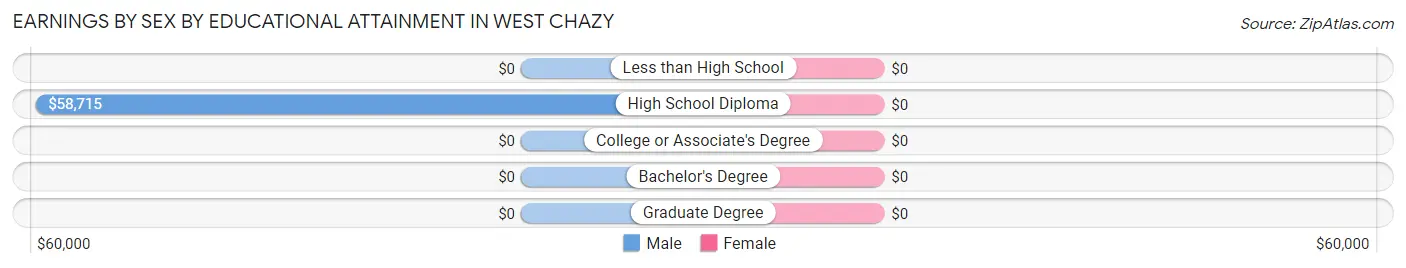
Earnings by Sex by Educational Attainment in West Chazy
| Educational Attainment | Male Income | Female Income |
| Less than High School | - | - |
| High School Diploma | $58,715 | $0 |
| College or Associate's Degree | - | - |
| Bachelor's Degree | - | - |
| Graduate Degree | - | - |
| Total | $51,438 | $0 |
Family Income in West Chazy
Family Income Brackets in West Chazy
According to the West Chazy family income data, there are 75 families falling into the $75,000 to $99,999 income range, which is the most common income bracket and makes up 44.4% of all families.
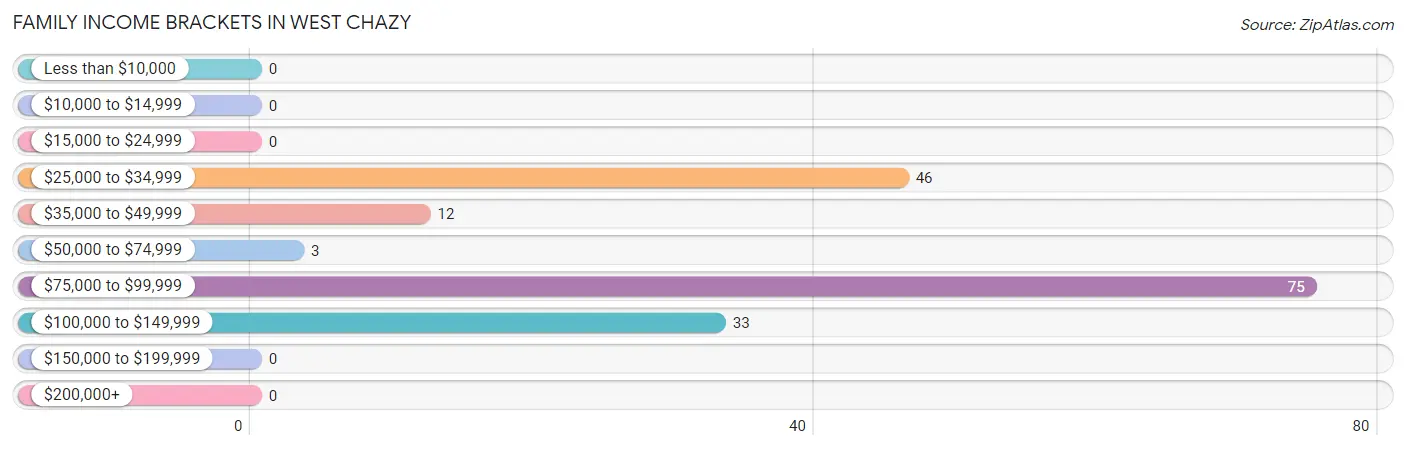
| Income Bracket | # Families | % Families |
| Less than $10,000 | 0 | 0.0% |
| $10,000 to $14,999 | 0 | 0.0% |
| $15,000 to $24,999 | 0 | 0.0% |
| $25,000 to $34,999 | 46 | 27.2% |
| $35,000 to $49,999 | 12 | 7.1% |
| $50,000 to $74,999 | 3 | 1.8% |
| $75,000 to $99,999 | 75 | 44.4% |
| $100,000 to $149,999 | 33 | 19.5% |
| $150,000 to $199,999 | 0 | 0.0% |
| $200,000+ | 0 | 0.0% |
Family Income by Famaliy Size in West Chazy
3-person families (34 | 20.1%) account for the highest median family income in West Chazy with $85,750 per family, while 3-person families (34 | 20.1%) have the highest median income of $28,583 per family member.
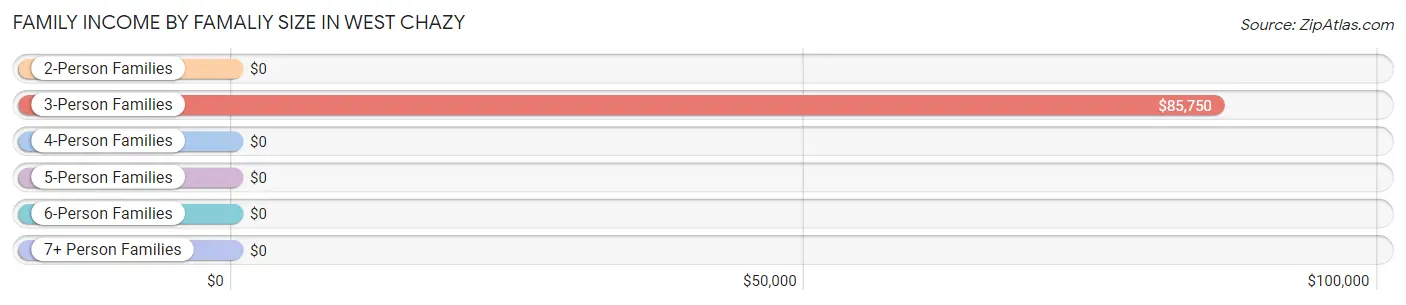
| Income Bracket | # Families | Median Income |
| 2-Person Families | 100 (59.2%) | $0 |
| 3-Person Families | 34 (20.1%) | $85,750 |
| 4-Person Families | 0 (0.0%) | $0 |
| 5-Person Families | 35 (20.7%) | $0 |
| 6-Person Families | 0 (0.0%) | $0 |
| 7+ Person Families | 0 (0.0%) | $0 |
| Total | 169 (100.0%) | $85,438 |
Family Income by Number of Earners in West Chazy
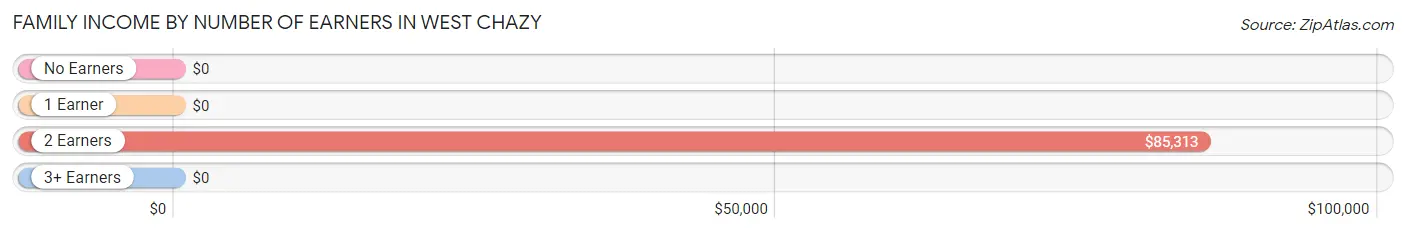
| Number of Earners | # Families | Median Income |
| No Earners | 81 (47.9%) | $0 |
| 1 Earner | 15 (8.9%) | $0 |
| 2 Earners | 35 (20.7%) | $85,313 |
| 3+ Earners | 38 (22.5%) | $0 |
| Total | 169 (100.0%) | $85,438 |
Household Income in West Chazy
Household Income Brackets in West Chazy
With 75 households falling in the category, the $75,000 to $99,999 income range is the most frequent in West Chazy, accounting for 43.1% of all households.
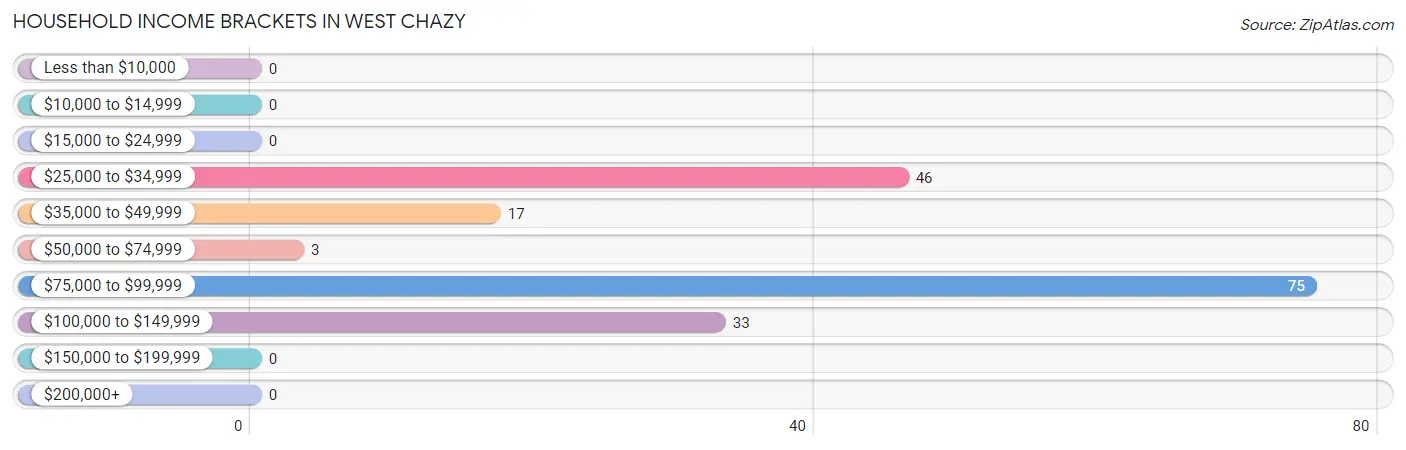
| Income Bracket | # Households | % Households |
| Less than $10,000 | 0 | 0.0% |
| $10,000 to $14,999 | 0 | 0.0% |
| $15,000 to $24,999 | 0 | 0.0% |
| $25,000 to $34,999 | 46 | 26.4% |
| $35,000 to $49,999 | 17 | 9.8% |
| $50,000 to $74,999 | 3 | 1.7% |
| $75,000 to $99,999 | 75 | 43.1% |
| $100,000 to $149,999 | 33 | 19.0% |
| $150,000 to $199,999 | 0 | 0.0% |
| $200,000+ | 0 | 0.0% |
Household Income by Householder Age in West Chazy
The median household income in West Chazy is $85,125, with the highest median household income of $90,821 found in the 45 to 64 years age bracket for the primary householder. A total of 53 households (30.5%) fall into this category.
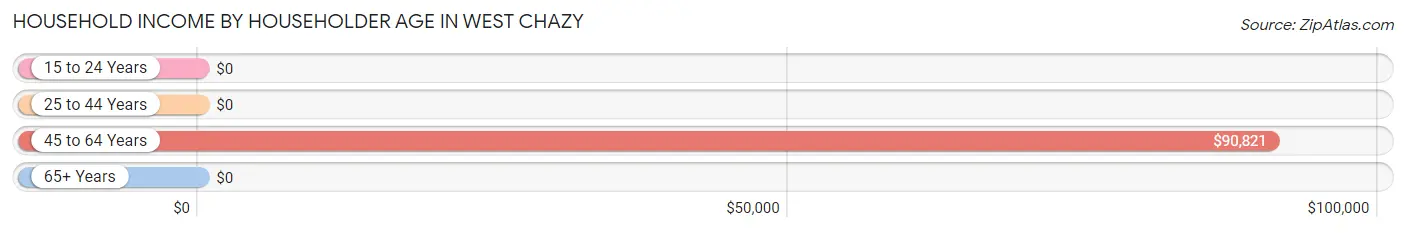
| Income Bracket | # Households | Median Income |
| 15 to 24 Years | 0 (0.0%) | $0 |
| 25 to 44 Years | 25 (14.4%) | $0 |
| 45 to 64 Years | 53 (30.5%) | $90,821 |
| 65+ Years | 96 (55.2%) | $0 |
| Total | 174 (100.0%) | $85,125 |
Poverty in West Chazy
Income Below Poverty by Sex and Age in West Chazy
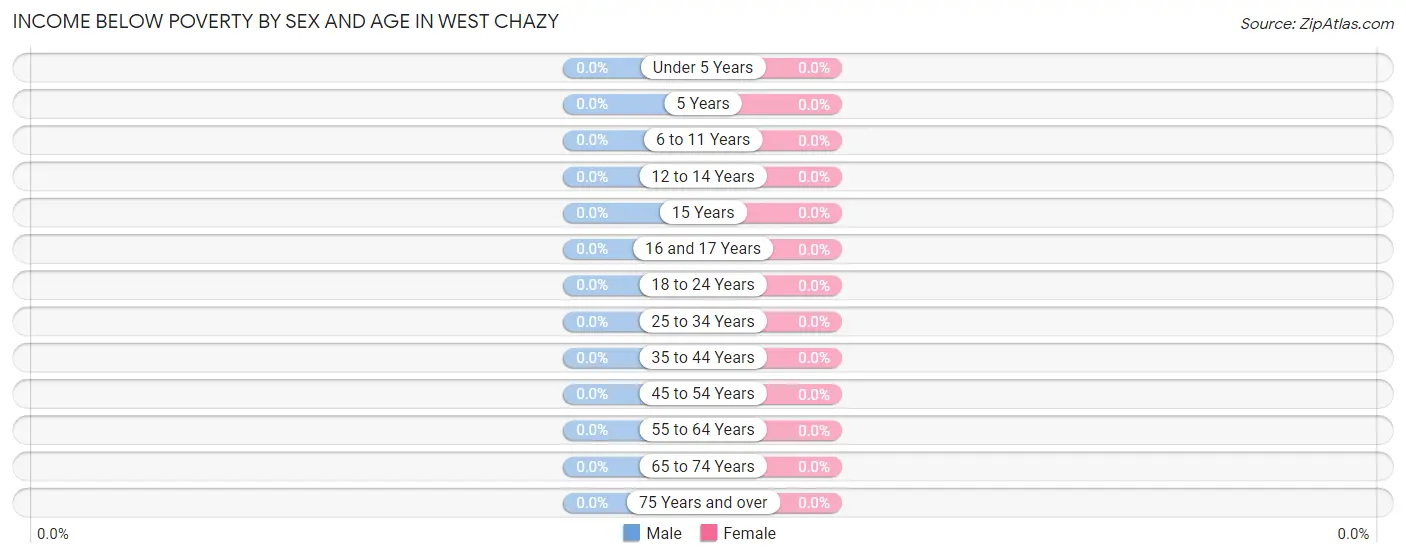
| Age Bracket | Male | Female |
| Under 5 Years | 0 (0.0%) | 0 (0.0%) |
| 5 Years | 0 (0.0%) | 0 (0.0%) |
| 6 to 11 Years | 0 (0.0%) | 0 (0.0%) |
| 12 to 14 Years | 0 (0.0%) | 0 (0.0%) |
| 15 Years | 0 (0.0%) | 0 (0.0%) |
| 16 and 17 Years | 0 (0.0%) | 0 (0.0%) |
| 18 to 24 Years | 0 (0.0%) | 0 (0.0%) |
| 25 to 34 Years | 0 (0.0%) | 0 (0.0%) |
| 35 to 44 Years | 0 (0.0%) | 0 (0.0%) |
| 45 to 54 Years | 0 (0.0%) | 0 (0.0%) |
| 55 to 64 Years | 0 (0.0%) | 0 (0.0%) |
| 65 to 74 Years | 0 (0.0%) | 0 (0.0%) |
| 75 Years and over | 0 (0.0%) | 0 (0.0%) |
| Total | 0 (0.0%) | 0 (0.0%) |
Income Above Poverty by Sex and Age in West Chazy
According to the poverty statistics in West Chazy, males aged under 5 years and females aged 6 to 11 years are the age groups that are most secure financially, with 100.0% of males and 100.0% of females in these age groups living above the poverty line.
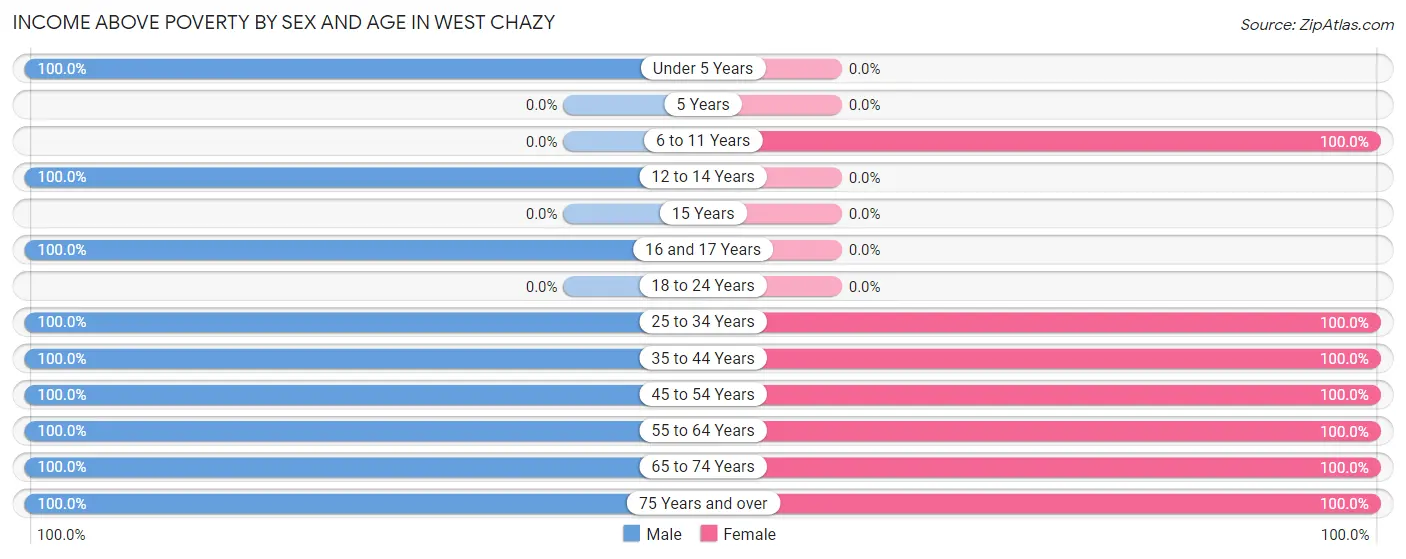
| Age Bracket | Male | Female |
| Under 5 Years | 18 (100.0%) | 0 (0.0%) |
| 5 Years | 0 (0.0%) | 0 (0.0%) |
| 6 to 11 Years | 0 (0.0%) | 41 (100.0%) |
| 12 to 14 Years | 13 (100.0%) | 0 (0.0%) |
| 15 Years | 0 (0.0%) | 0 (0.0%) |
| 16 and 17 Years | 38 (100.0%) | 0 (0.0%) |
| 18 to 24 Years | 0 (0.0%) | 0 (0.0%) |
| 25 to 34 Years | 22 (100.0%) | 19 (100.0%) |
| 35 to 44 Years | 14 (100.0%) | 5 (100.0%) |
| 45 to 54 Years | 2 (100.0%) | 6 (100.0%) |
| 55 to 64 Years | 81 (100.0%) | 53 (100.0%) |
| 65 to 74 Years | 35 (100.0%) | 81 (100.0%) |
| 75 Years and over | 43 (100.0%) | 10 (100.0%) |
| Total | 266 (100.0%) | 215 (100.0%) |
Income Below Poverty Among Married-Couple Families in West Chazy
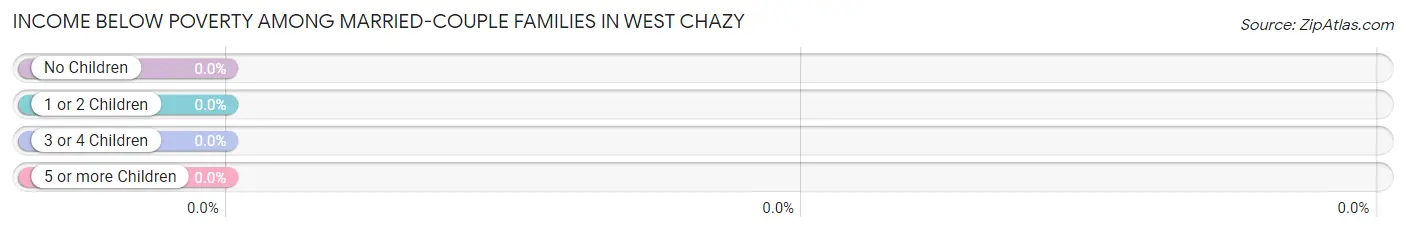
| Children | Above Poverty | Below Poverty |
| No Children | 111 (100.0%) | 0 (0.0%) |
| 1 or 2 Children | 58 (100.0%) | 0 (0.0%) |
| 3 or 4 Children | 0 (0.0%) | 0 (0.0%) |
| 5 or more Children | 0 (0.0%) | 0 (0.0%) |
| Total | 169 (100.0%) | 0 (0.0%) |
Income Below Poverty Among Single-Parent Households in West Chazy
| Children | Single Father | Single Mother |
| No Children | 0 (0.0%) | 0 (0.0%) |
| 1 or 2 Children | 0 (0.0%) | 0 (0.0%) |
| 3 or 4 Children | 0 (0.0%) | 0 (0.0%) |
| 5 or more Children | 0 (0.0%) | 0 (0.0%) |
| Total | 0 (0.0%) | 0 (0.0%) |
Income Below Poverty Among Married-Couple vs Single-Parent Households in West Chazy
| Children | Married-Couple Families | Single-Parent Households |
| No Children | 0 (0.0%) | 0 (0.0%) |
| 1 or 2 Children | 0 (0.0%) | 0 (0.0%) |
| 3 or 4 Children | 0 (0.0%) | 0 (0.0%) |
| 5 or more Children | 0 (0.0%) | 0 (0.0%) |
| Total | 0 (0.0%) | 0 (0.0%) |
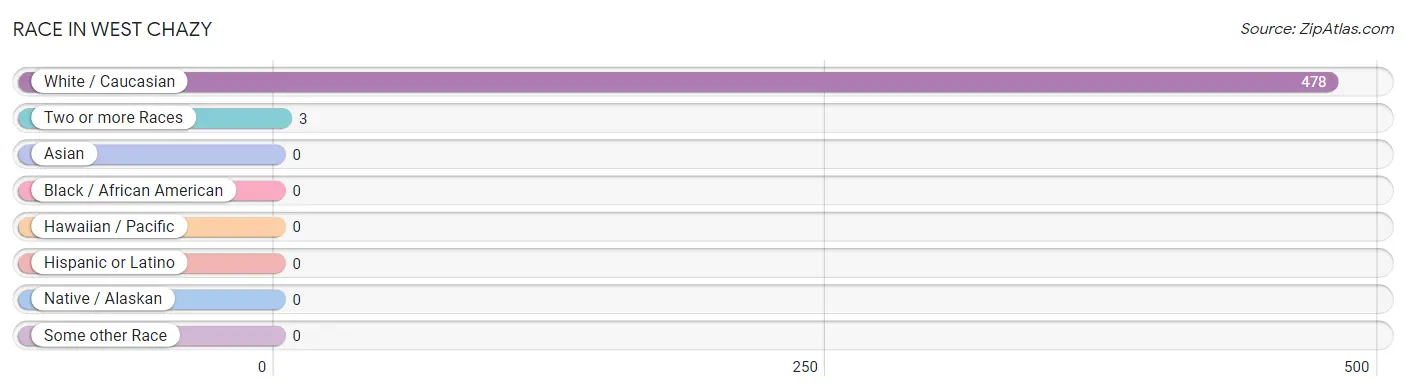
Race in West Chazy
The most populous races in West Chazy are White / Caucasian (478 | 99.4%), and Two or more Races (3 | 0.6%).
| Race | # Population | % Population |
| Asian | 0 | 0.0% |
| Black / African American | 0 | 0.0% |
| Hawaiian / Pacific | 0 | 0.0% |
| Hispanic or Latino | 0 | 0.0% |
| Native / Alaskan | 0 | 0.0% |
| White / Caucasian | 478 | 99.4% |
| Two or more Races | 3 | 0.6% |
| Some other Race | 0 | 0.0% |
| Total | 481 | 100.0% |
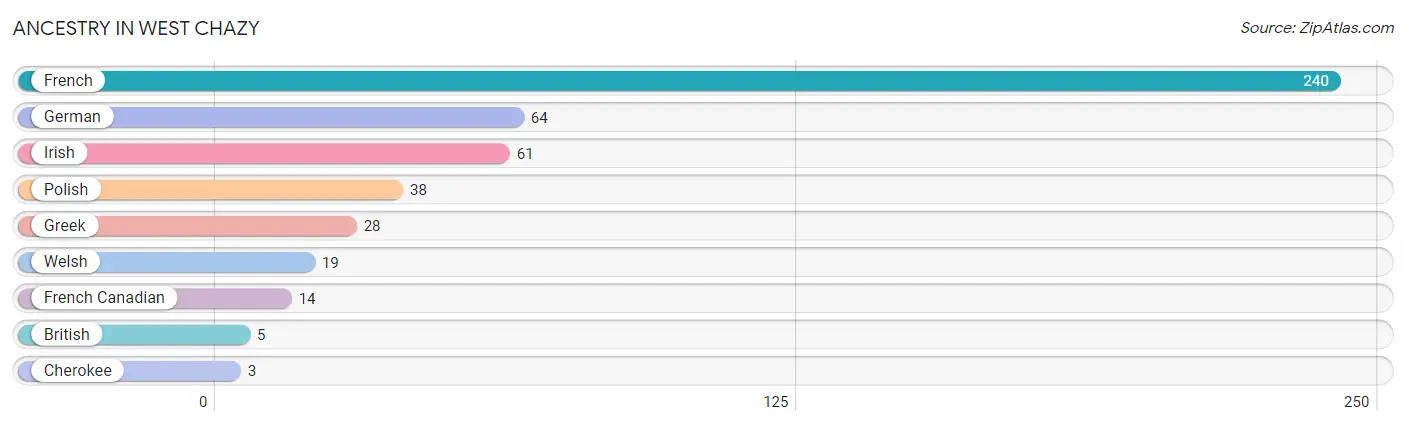
Ancestry in West Chazy
The most populous ancestries reported in West Chazy are French (240 | 49.9%), German (64 | 13.3%), Irish (61 | 12.7%), Polish (38 | 7.9%), and Greek (28 | 5.8%), together accounting for 89.6% of all West Chazy residents.
| Ancestry | # Population | % Population |
| British | 5 | 1.0% |
| Cherokee | 3 | 0.6% |
| French | 240 | 49.9% |
| French Canadian | 14 | 2.9% |
| German | 64 | 13.3% |
| Greek | 28 | 5.8% |
| Irish | 61 | 12.7% |
| Polish | 38 | 7.9% |
| Welsh | 19 | 4.0% | View All 9 Rows |
Immigrants in West Chazy
The most numerous immigrant groups reported in West Chazy came from , and Canada (24 | 5.0%), together accounting for 5.0% of all West Chazy residents.

| Immigration Origin | # Population | % Population |
| Canada | 24 | 5.0% | View All 1 Rows |
Sex and Age in West Chazy
Sex and Age in West Chazy
The most populous age groups in West Chazy are 55 to 59 Years (42 | 15.8%) for men and 65 to 69 Years (81 | 37.7%) for women.
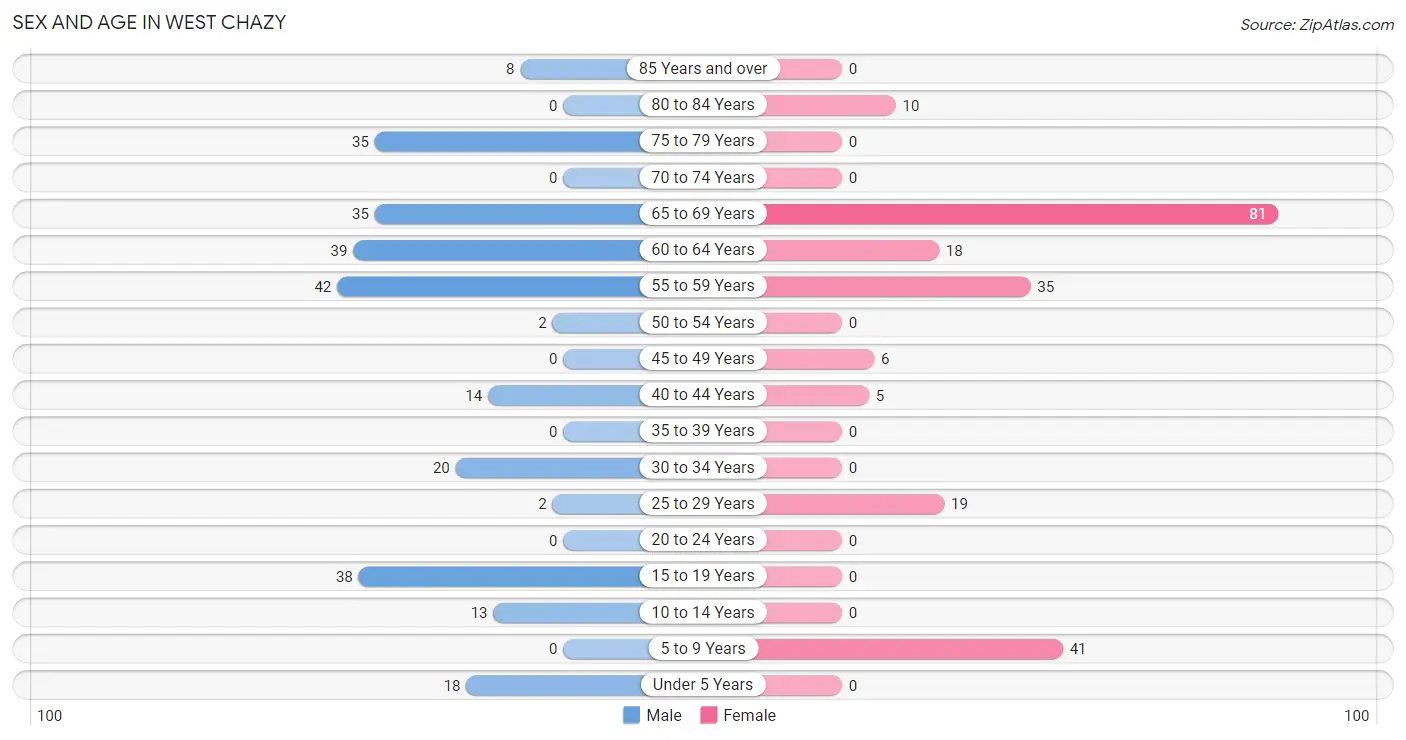
| Age Bracket | Male | Female |
| Under 5 Years | 18 (6.8%) | 0 (0.0%) |
| 5 to 9 Years | 0 (0.0%) | 41 (19.1%) |
| 10 to 14 Years | 13 (4.9%) | 0 (0.0%) |
| 15 to 19 Years | 38 (14.3%) | 0 (0.0%) |
| 20 to 24 Years | 0 (0.0%) | 0 (0.0%) |
| 25 to 29 Years | 2 (0.7%) | 19 (8.8%) |
| 30 to 34 Years | 20 (7.5%) | 0 (0.0%) |
| 35 to 39 Years | 0 (0.0%) | 0 (0.0%) |
| 40 to 44 Years | 14 (5.3%) | 5 (2.3%) |
| 45 to 49 Years | 0 (0.0%) | 6 (2.8%) |
| 50 to 54 Years | 2 (0.7%) | 0 (0.0%) |
| 55 to 59 Years | 42 (15.8%) | 35 (16.3%) |
| 60 to 64 Years | 39 (14.7%) | 18 (8.4%) |
| 65 to 69 Years | 35 (13.2%) | 81 (37.7%) |
| 70 to 74 Years | 0 (0.0%) | 0 (0.0%) |
| 75 to 79 Years | 35 (13.2%) | 0 (0.0%) |
| 80 to 84 Years | 0 (0.0%) | 10 (4.6%) |
| 85 Years and over | 8 (3.0%) | 0 (0.0%) |
| Total | 266 (100.0%) | 215 (100.0%) |
Families and Households in West Chazy
Median Family Size in West Chazy
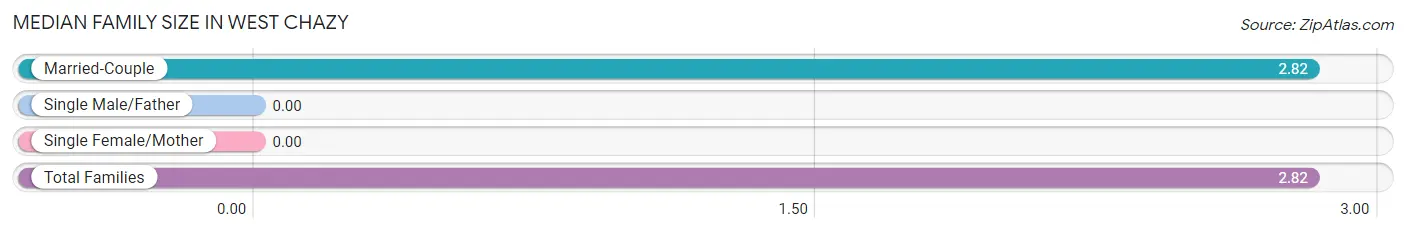
| Family Type | # Families | Family Size |
| Married-Couple | 169 (100.0%) | 2.82 |
| Single Male/Father | 0 (0.0%) | - |
| Single Female/Mother | 0 (0.0%) | - |
| Total Families | 169 (100.0%) | 2.82 |
Median Household Size in West Chazy
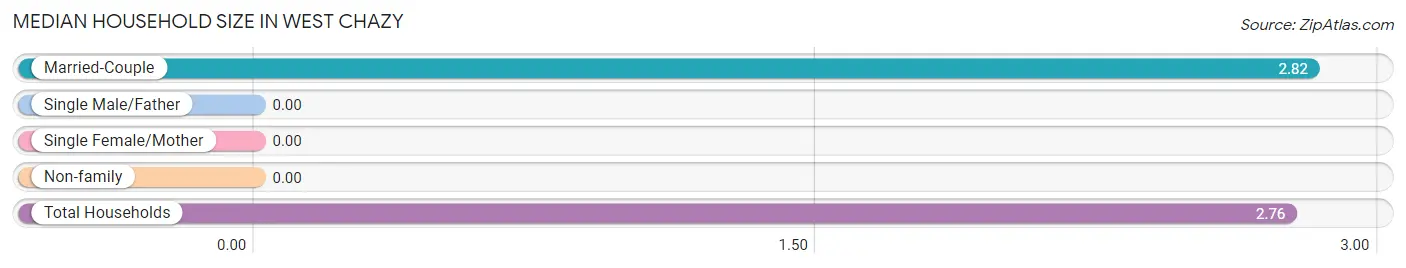
| Household Type | # Households | Household Size |
| Married-Couple | 169 (97.1%) | 2.82 |
| Single Male/Father | 0 (0.0%) | - |
| Single Female/Mother | 0 (0.0%) | - |
| Non-family | 5 (2.9%) | - |
| Total Households | 174 (100.0%) | 2.76 |
Household Size by Marriage Status in West Chazy
Out of a total of 174 households in West Chazy, 169 (97.1%) are family households, while 5 (2.9%) are nonfamily households. The most numerous type of family households are 2-person households, comprising 100, and the most common type of nonfamily households are 1-person households, comprising 5.
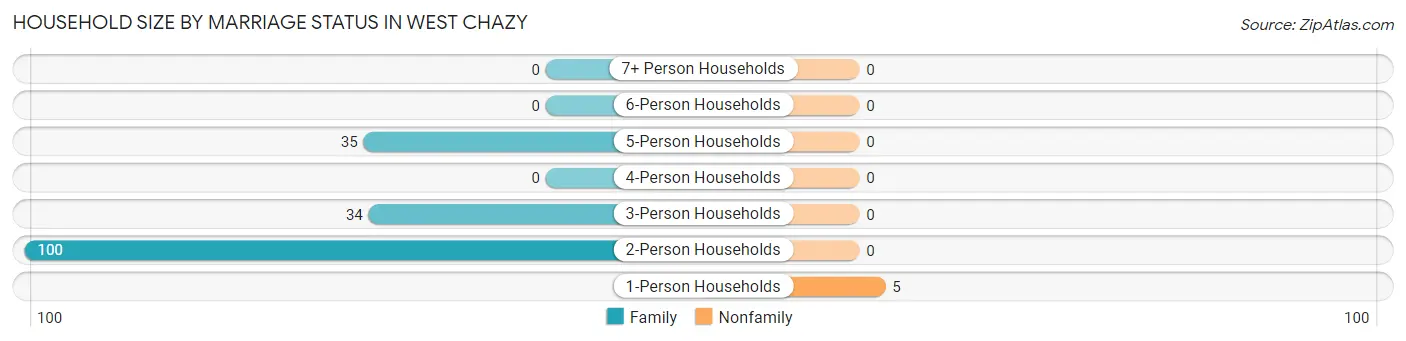
| Household Size | Family Households | Nonfamily Households |
| 1-Person Households | - | 5 (2.9%) |
| 2-Person Households | 100 (57.5%) | 0 (0.0%) |
| 3-Person Households | 34 (19.5%) | 0 (0.0%) |
| 4-Person Households | 0 (0.0%) | 0 (0.0%) |
| 5-Person Households | 35 (20.1%) | 0 (0.0%) |
| 6-Person Households | 0 (0.0%) | 0 (0.0%) |
| 7+ Person Households | 0 (0.0%) | 0 (0.0%) |
| Total | 169 (97.1%) | 5 (2.9%) |
Female Fertility in West Chazy
Fertility by Age in West Chazy
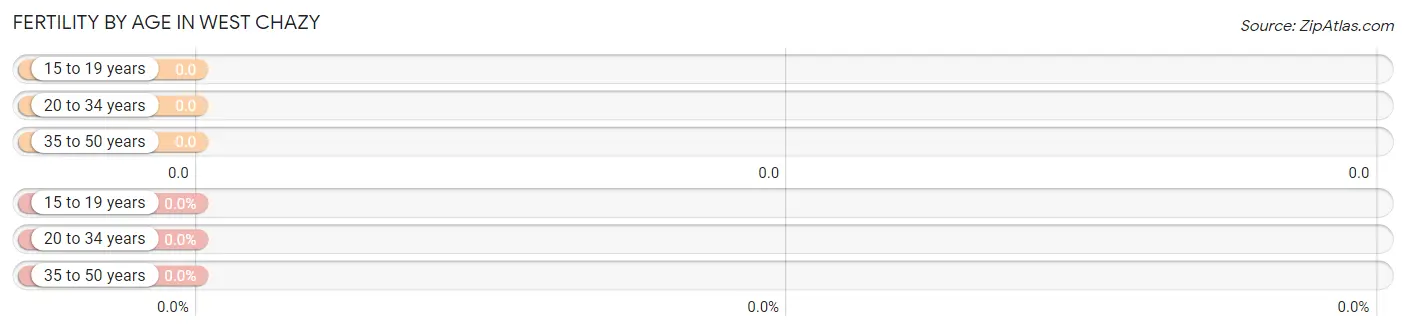
| Age Bracket | Women with Births | Births / 1,000 Women |
| 15 to 19 years | 0 (0.0%) | 0.0 |
| 20 to 34 years | 0 (0.0%) | 0.0 |
| 35 to 50 years | 0 (0.0%) | 0.0 |
| Total | 0 (0.0%) | 0.0 |
Fertility by Age by Marriage Status in West Chazy
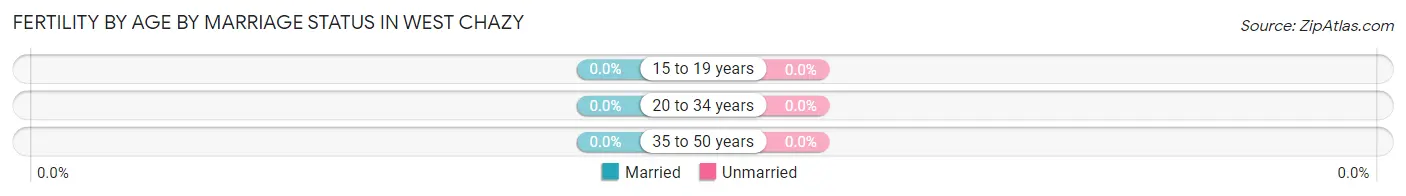
| Age Bracket | Married | Unmarried |
| 15 to 19 years | 0 (0.0%) | 0 (0.0%) |
| 20 to 34 years | 0 (0.0%) | 0 (0.0%) |
| 35 to 50 years | 0 (0.0%) | 0 (0.0%) |
| Total | 0 (0.0%) | 0 (0.0%) |
Fertility by Education in West Chazy
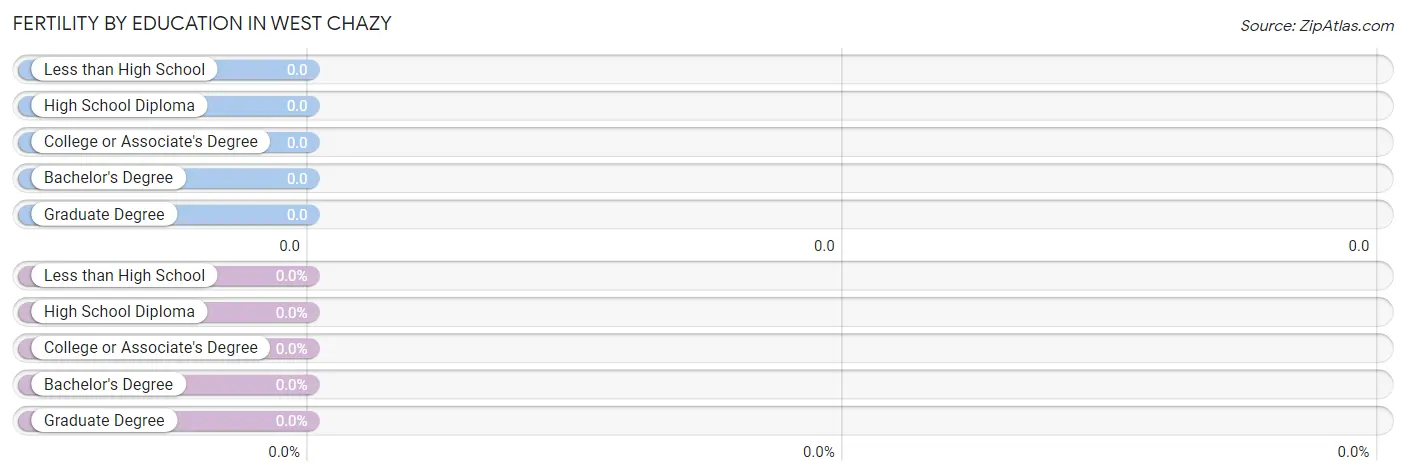
| Educational Attainment | Women with Births | Births / 1,000 Women |
| Less than High School | 0 (0.0%) | 0.0 |
| High School Diploma | 0 (0.0%) | 0.0 |
| College or Associate's Degree | 0 (0.0%) | 0.0 |
| Bachelor's Degree | 0 (0.0%) | 0.0 |
| Graduate Degree | 0 (0.0%) | 0.0 |
| Total | 0 (0.0%) | 0.0 |
Fertility by Education by Marriage Status in West Chazy
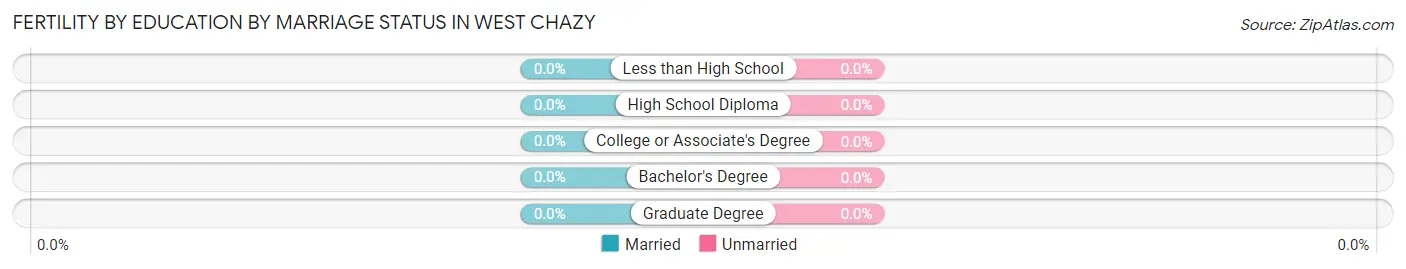
| Educational Attainment | Married | Unmarried |
| Less than High School | 0 (0.0%) | 0 (0.0%) |
| High School Diploma | 0 (0.0%) | 0 (0.0%) |
| College or Associate's Degree | 0 (0.0%) | 0 (0.0%) |
| Bachelor's Degree | 0 (0.0%) | 0 (0.0%) |
| Graduate Degree | 0 (0.0%) | 0 (0.0%) |
| Total | 0 (0.0%) | 0 (0.0%) |
Employment Characteristics in West Chazy
Employment by Class of Employer in West Chazy
Among the 196 employed individuals in West Chazy, private company employees (107 | 54.6%), self-employed (incorporated) (36 | 18.4%), and not-for-profit organizations (19 | 9.7%) make up the most common classes of employment.
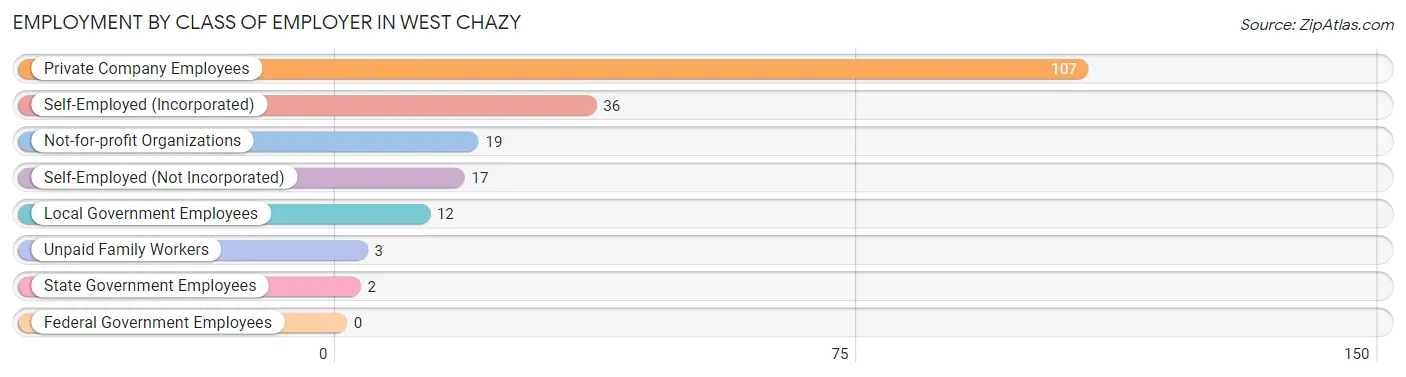
| Employer Class | # Employees | % Employees |
| Private Company Employees | 107 | 54.6% |
| Self-Employed (Incorporated) | 36 | 18.4% |
| Self-Employed (Not Incorporated) | 17 | 8.7% |
| Not-for-profit Organizations | 19 | 9.7% |
| Local Government Employees | 12 | 6.1% |
| State Government Employees | 2 | 1.0% |
| Federal Government Employees | 0 | 0.0% |
| Unpaid Family Workers | 3 | 1.5% |
| Total | 196 | 100.0% |
Employment Status by Age in West Chazy
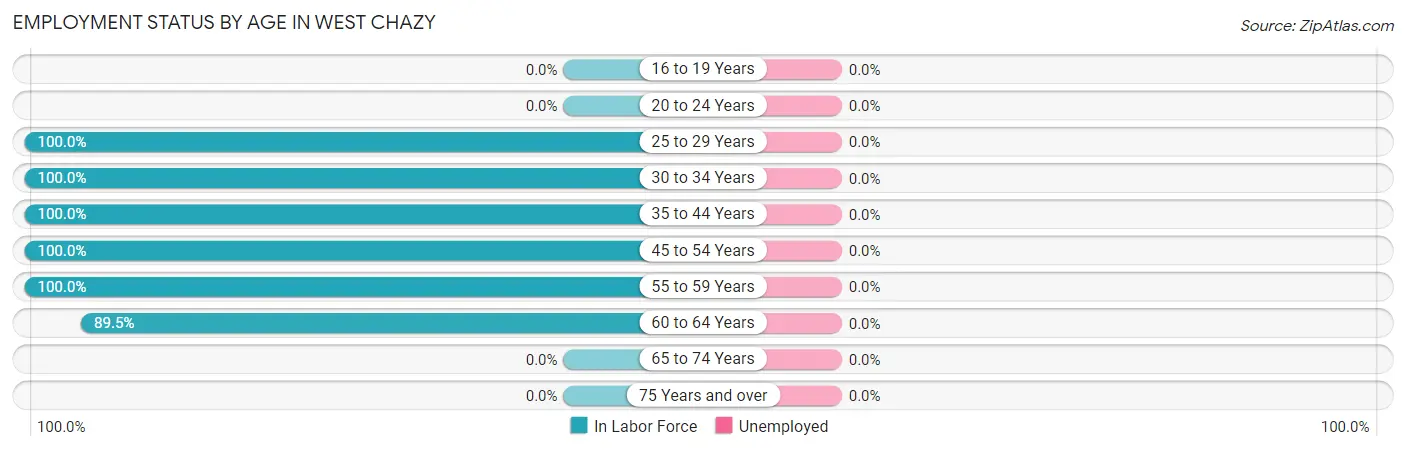
| Age Bracket | In Labor Force | Unemployed |
| 16 to 19 Years | 0 (0.0%) | 0 (0.0%) |
| 20 to 24 Years | 0 (0.0%) | 0 (0.0%) |
| 25 to 29 Years | 21 (100.0%) | 0 (0.0%) |
| 30 to 34 Years | 20 (100.0%) | 0 (0.0%) |
| 35 to 44 Years | 19 (100.0%) | 0 (0.0%) |
| 45 to 54 Years | 8 (100.0%) | 0 (0.0%) |
| 55 to 59 Years | 77 (100.0%) | 0 (0.0%) |
| 60 to 64 Years | 51 (89.5%) | 0 (0.0%) |
| 65 to 74 Years | 0 (0.0%) | 0 (0.0%) |
| 75 Years and over | 0 (0.0%) | 0 (0.0%) |
| Total | 196 (47.9%) | 0 (0.0%) |
Employment Status by Educational Attainment in West Chazy
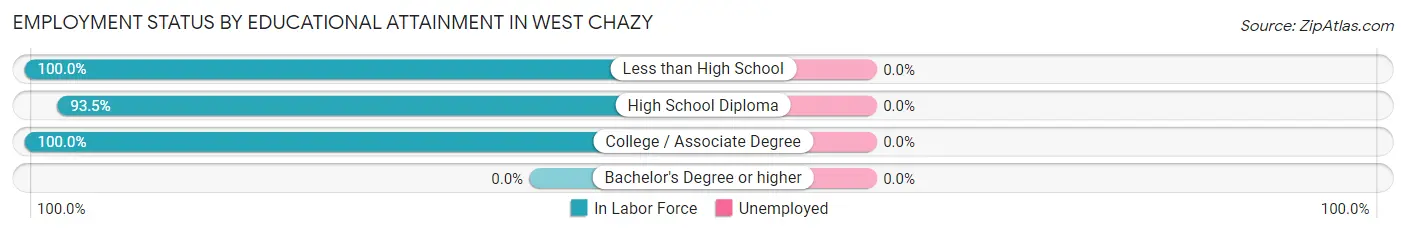
| Educational Attainment | In Labor Force | Unemployed |
| Less than High School | 67 (100.0%) | 0 (0.0%) |
| High School Diploma | 86 (93.5%) | 0 (0.0%) |
| College / Associate Degree | 43 (100.0%) | 0 (0.0%) |
| Bachelor's Degree or higher | 0 (0.0%) | 0 (0.0%) |
| Total | 196 (97.0%) | 0 (0.0%) |
Employment Occupations by Sex in West Chazy
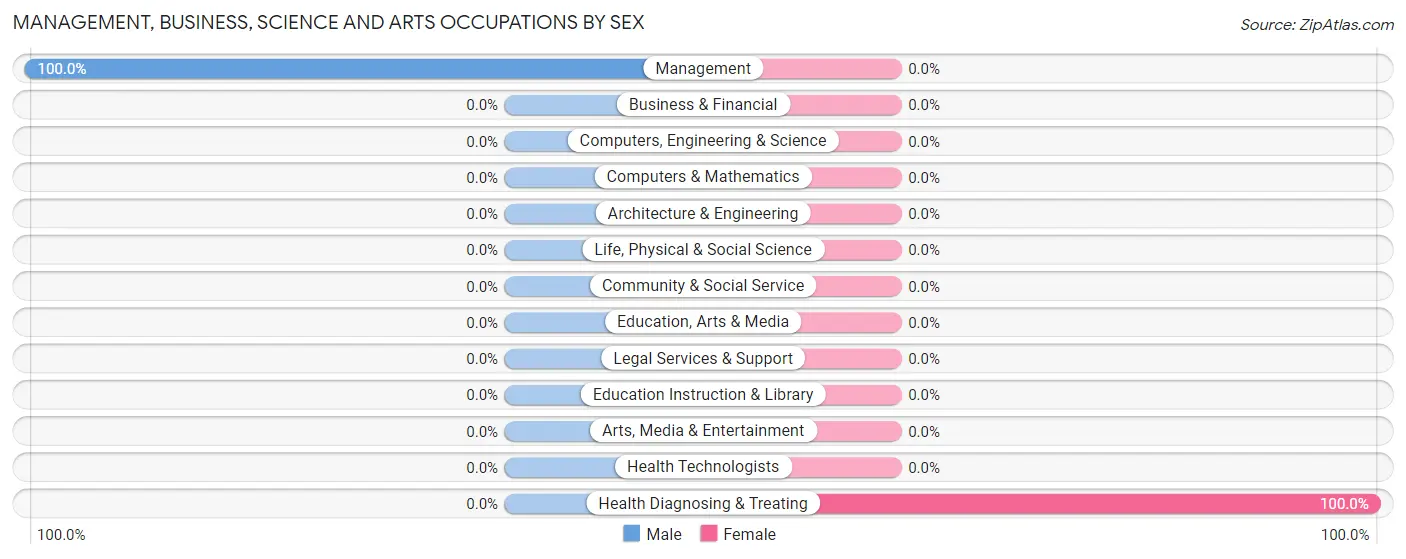
Management, Business, Science and Arts Occupations
The most common Management, Business, Science and Arts occupations in West Chazy are Health Diagnosing & Treating (19 | 9.7%), and Management (13 | 6.6%).
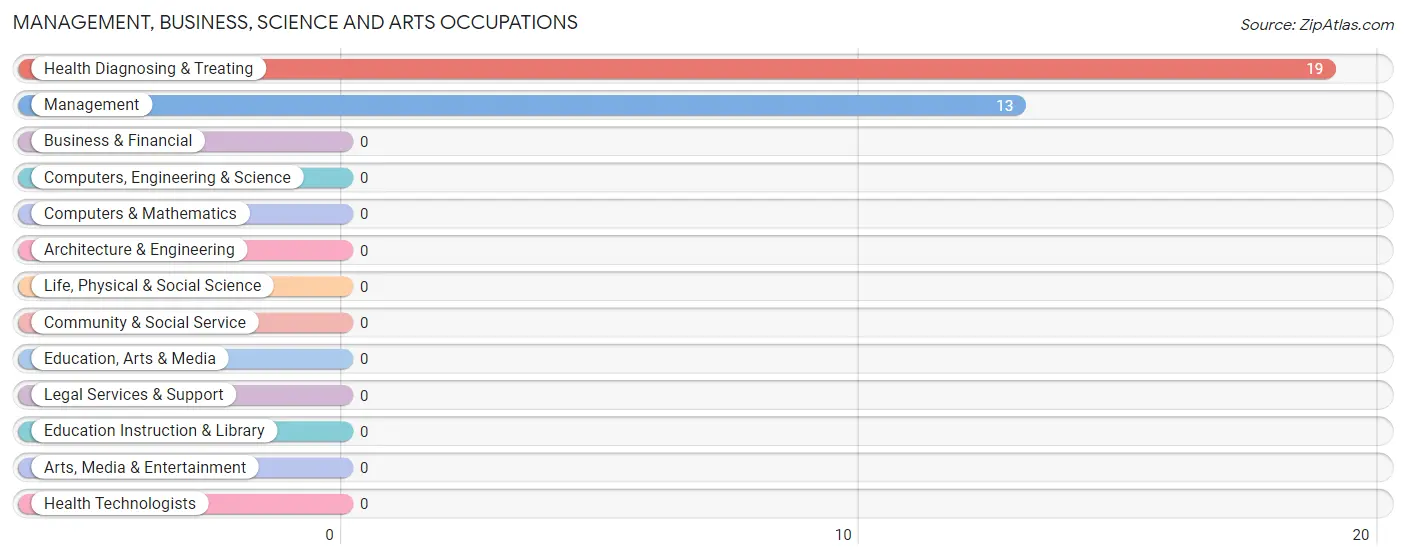
Management, Business, Science and Arts Occupations by Sex
| Occupation | Male | Female |
| Management | 13 (100.0%) | 0 (0.0%) |
| Business & Financial | 0 (0.0%) | 0 (0.0%) |
| Computers, Engineering & Science | 0 (0.0%) | 0 (0.0%) |
| Computers & Mathematics | 0 (0.0%) | 0 (0.0%) |
| Architecture & Engineering | 0 (0.0%) | 0 (0.0%) |
| Life, Physical & Social Science | 0 (0.0%) | 0 (0.0%) |
| Community & Social Service | 0 (0.0%) | 0 (0.0%) |
| Education, Arts & Media | 0 (0.0%) | 0 (0.0%) |
| Legal Services & Support | 0 (0.0%) | 0 (0.0%) |
| Education Instruction & Library | 0 (0.0%) | 0 (0.0%) |
| Arts, Media & Entertainment | 0 (0.0%) | 0 (0.0%) |
| Health Diagnosing & Treating | 0 (0.0%) | 19 (100.0%) |
| Health Technologists | 0 (0.0%) | 0 (0.0%) |
| Total (Category) | 13 (40.6%) | 19 (59.4%) |
| Total (Overall) | 119 (60.7%) | 77 (39.3%) |
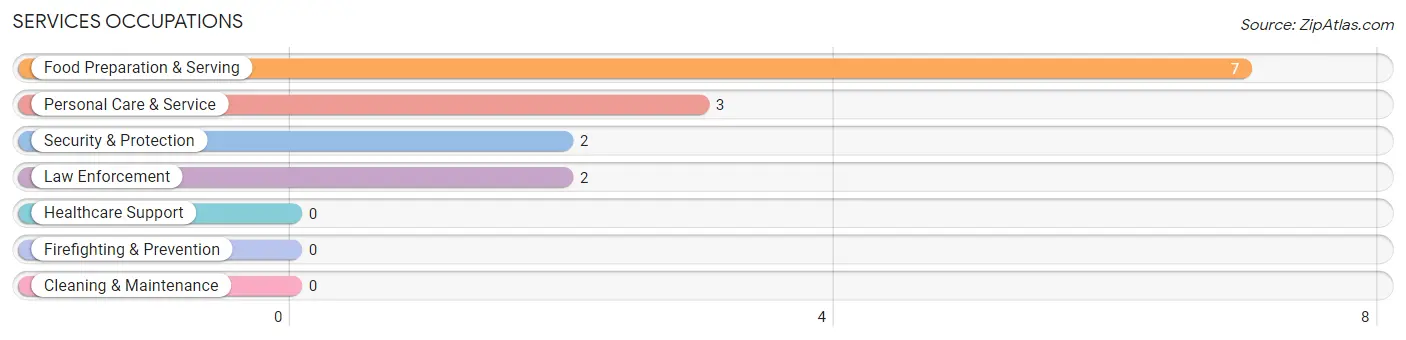
Services Occupations
The most common Services occupations in West Chazy are Food Preparation & Serving (7 | 3.6%), Personal Care & Service (3 | 1.5%), Security & Protection (2 | 1.0%), and Law Enforcement (2 | 1.0%).
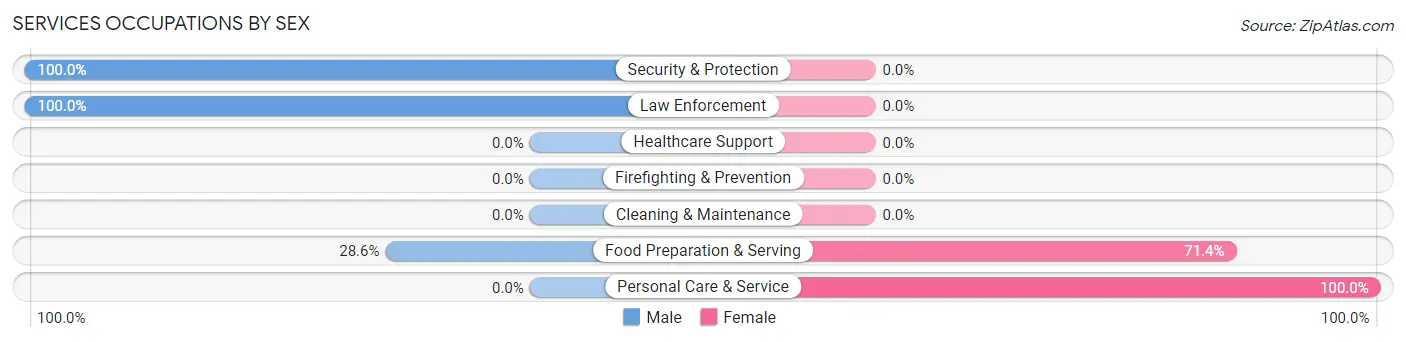
Services Occupations by Sex
Within the Services occupations in West Chazy, the most male-oriented occupations are Security & Protection (100.0%), Law Enforcement (100.0%), and Food Preparation & Serving (28.6%), while the most female-oriented occupations are Personal Care & Service (100.0%), and Food Preparation & Serving (71.4%).
| Occupation | Male | Female |
| Healthcare Support | 0 (0.0%) | 0 (0.0%) |
| Security & Protection | 2 (100.0%) | 0 (0.0%) |
| Firefighting & Prevention | 0 (0.0%) | 0 (0.0%) |
| Law Enforcement | 2 (100.0%) | 0 (0.0%) |
| Food Preparation & Serving | 2 (28.6%) | 5 (71.4%) |
| Cleaning & Maintenance | 0 (0.0%) | 0 (0.0%) |
| Personal Care & Service | 0 (0.0%) | 3 (100.0%) |
| Total (Category) | 4 (33.3%) | 8 (66.7%) |
| Total (Overall) | 119 (60.7%) | 77 (39.3%) |
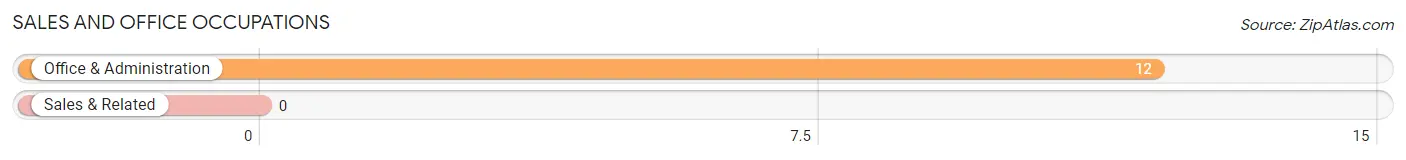
Sales and Office Occupations
The most common Sales and Office occupations in West Chazy are , and Office & Administration (12 | 6.1%).
Sales and Office Occupations by Sex
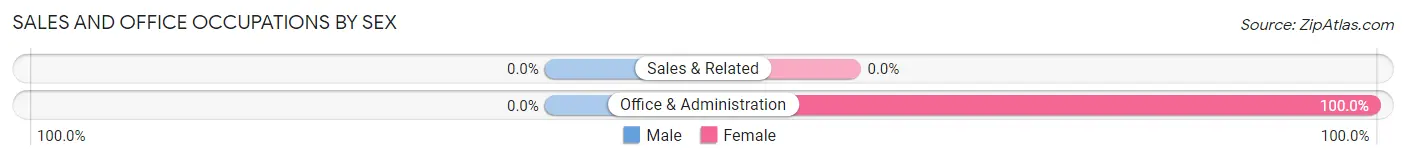
| Occupation | Male | Female |
| Sales & Related | 0 (0.0%) | 0 (0.0%) |
| Office & Administration | 0 (0.0%) | 12 (100.0%) |
| Total (Category) | 0 (0.0%) | 12 (100.0%) |
| Total (Overall) | 119 (60.7%) | 77 (39.3%) |
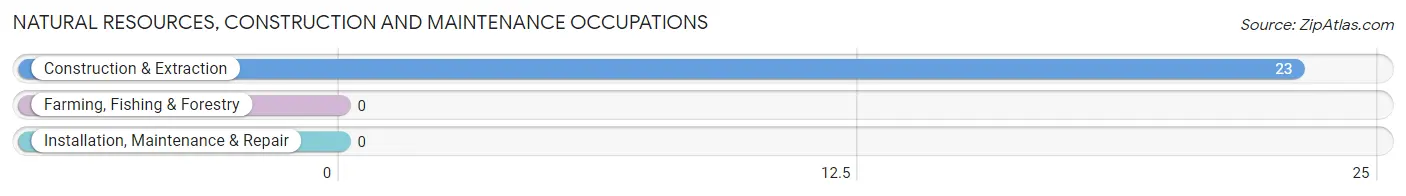
Natural Resources, Construction and Maintenance Occupations
The most common Natural Resources, Construction and Maintenance occupations in West Chazy are , and Construction & Extraction (23 | 11.7%).
Natural Resources, Construction and Maintenance Occupations by Sex
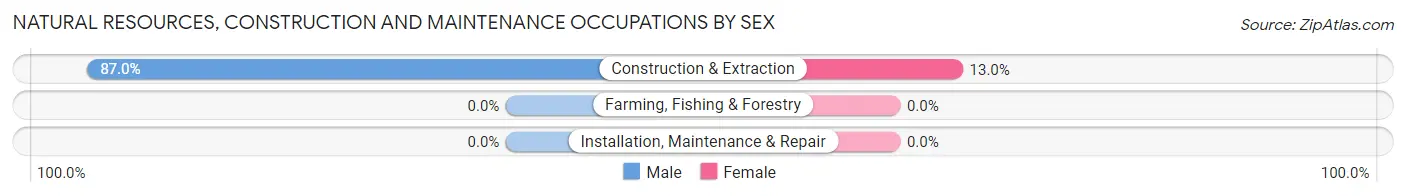
| Occupation | Male | Female |
| Farming, Fishing & Forestry | 0 (0.0%) | 0 (0.0%) |
| Construction & Extraction | 20 (87.0%) | 3 (13.0%) |
| Installation, Maintenance & Repair | 0 (0.0%) | 0 (0.0%) |
| Total (Category) | 20 (87.0%) | 3 (13.0%) |
| Total (Overall) | 119 (60.7%) | 77 (39.3%) |
Production, Transportation and Moving Occupations
The most common Production, Transportation and Moving occupations in West Chazy are Transportation (91 | 46.4%), and Production (26 | 13.3%).
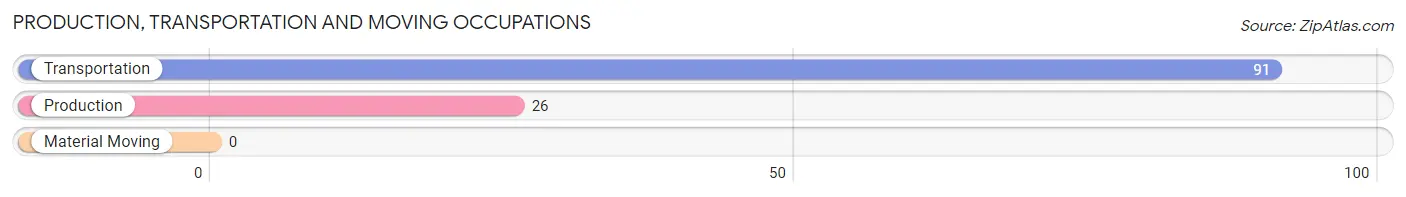
Production, Transportation and Moving Occupations by Sex
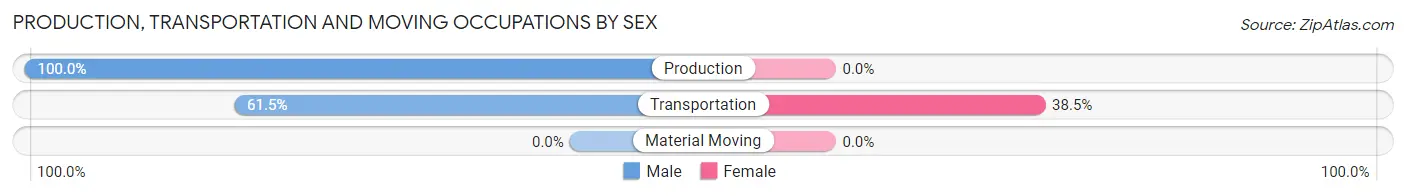
| Occupation | Male | Female |
| Production | 26 (100.0%) | 0 (0.0%) |
| Transportation | 56 (61.5%) | 35 (38.5%) |
| Material Moving | 0 (0.0%) | 0 (0.0%) |
| Total (Category) | 82 (70.1%) | 35 (29.9%) |
| Total (Overall) | 119 (60.7%) | 77 (39.3%) |
Employment Industries by Sex in West Chazy
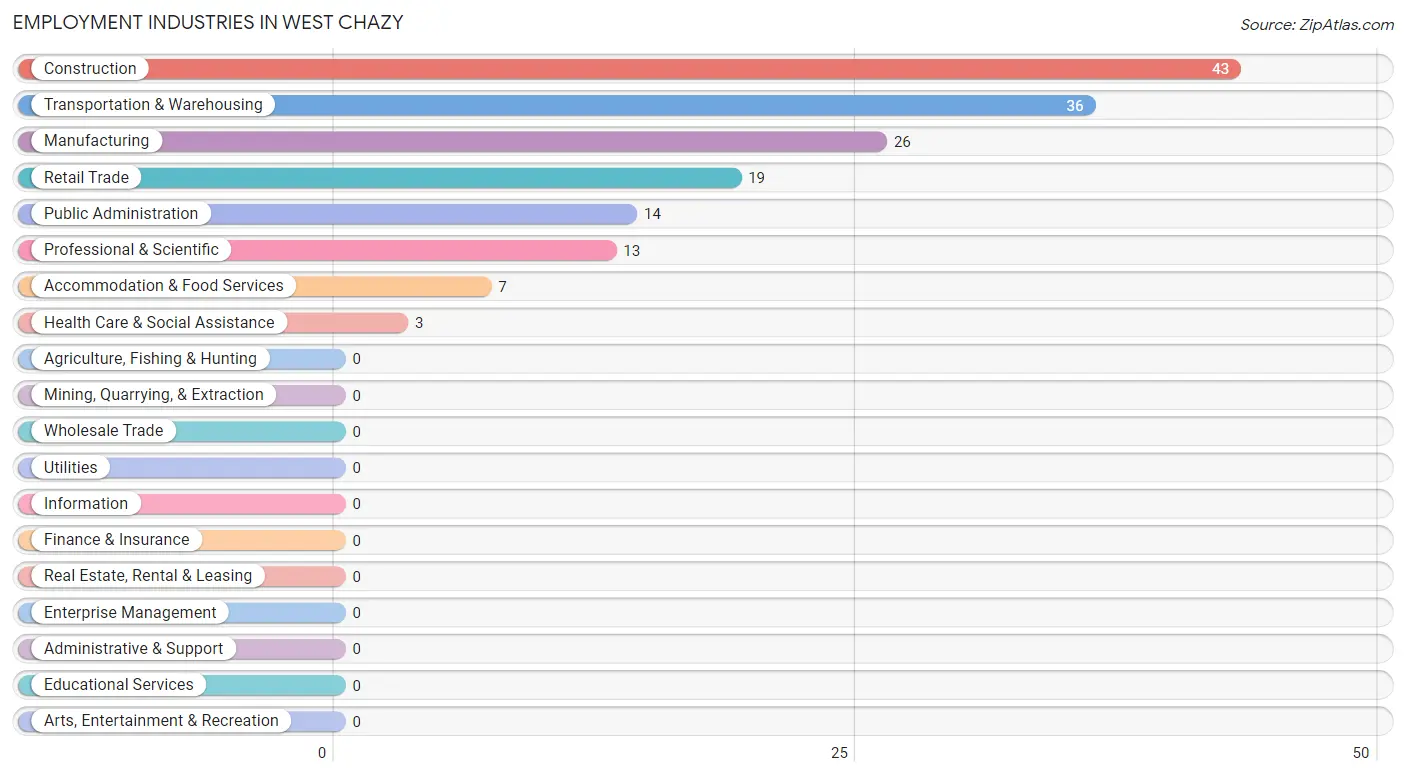
Employment Industries in West Chazy
The major employment industries in West Chazy include Construction (43 | 21.9%), Transportation & Warehousing (36 | 18.4%), Manufacturing (26 | 13.3%), Retail Trade (19 | 9.7%), and Public Administration (14 | 7.1%).
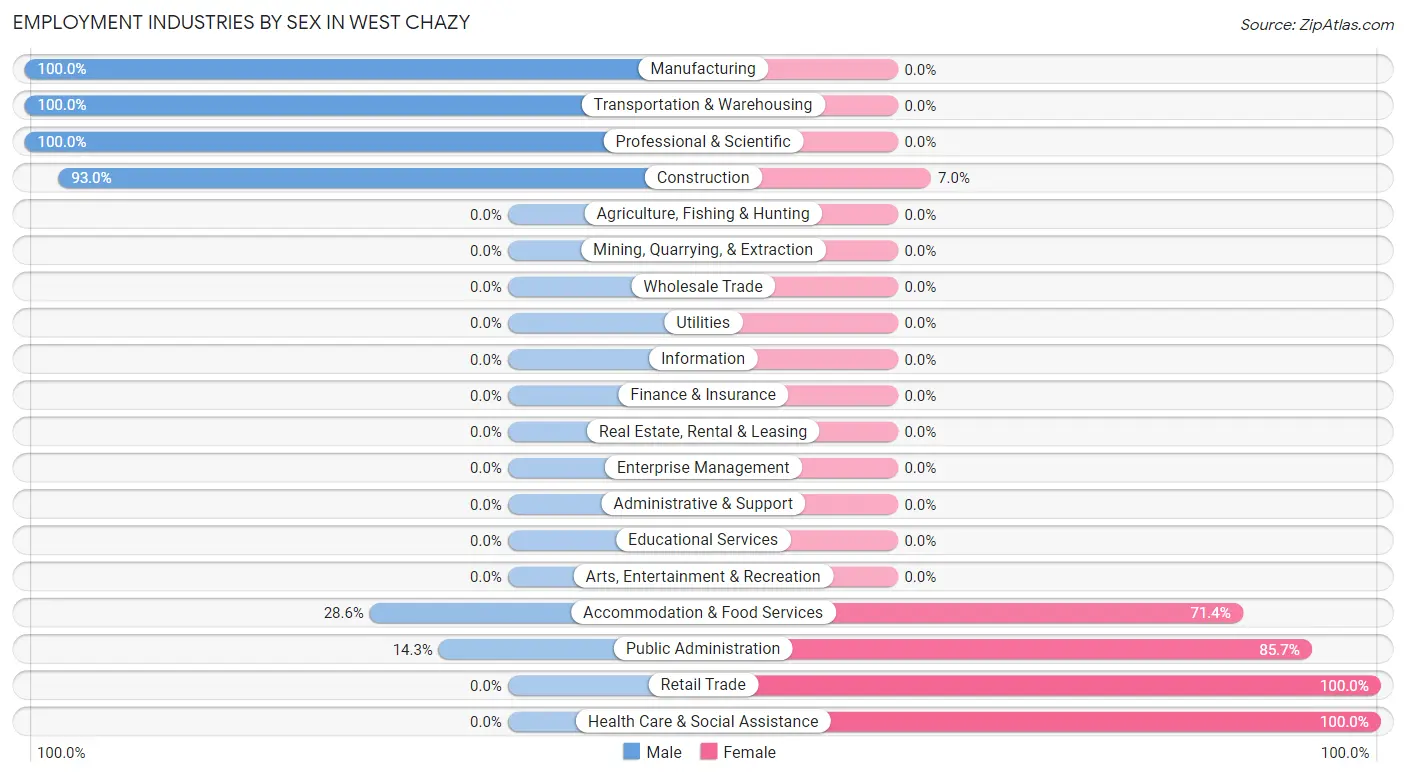
Employment Industries by Sex in West Chazy
The West Chazy industries that see more men than women are Manufacturing (100.0%), Transportation & Warehousing (100.0%), and Professional & Scientific (100.0%), whereas the industries that tend to have a higher number of women are Retail Trade (100.0%), Health Care & Social Assistance (100.0%), and Public Administration (85.7%).
| Industry | Male | Female |
| Agriculture, Fishing & Hunting | 0 (0.0%) | 0 (0.0%) |
| Mining, Quarrying, & Extraction | 0 (0.0%) | 0 (0.0%) |
| Construction | 40 (93.0%) | 3 (7.0%) |
| Manufacturing | 26 (100.0%) | 0 (0.0%) |
| Wholesale Trade | 0 (0.0%) | 0 (0.0%) |
| Retail Trade | 0 (0.0%) | 19 (100.0%) |
| Transportation & Warehousing | 36 (100.0%) | 0 (0.0%) |
| Utilities | 0 (0.0%) | 0 (0.0%) |
| Information | 0 (0.0%) | 0 (0.0%) |
| Finance & Insurance | 0 (0.0%) | 0 (0.0%) |
| Real Estate, Rental & Leasing | 0 (0.0%) | 0 (0.0%) |
| Professional & Scientific | 13 (100.0%) | 0 (0.0%) |
| Enterprise Management | 0 (0.0%) | 0 (0.0%) |
| Administrative & Support | 0 (0.0%) | 0 (0.0%) |
| Educational Services | 0 (0.0%) | 0 (0.0%) |
| Health Care & Social Assistance | 0 (0.0%) | 3 (100.0%) |
| Arts, Entertainment & Recreation | 0 (0.0%) | 0 (0.0%) |
| Accommodation & Food Services | 2 (28.6%) | 5 (71.4%) |
| Public Administration | 2 (14.3%) | 12 (85.7%) |
| Total | 119 (60.7%) | 77 (39.3%) |
Education in West Chazy
School Enrollment in West Chazy
The most common levels of schooling among the 92 students in West Chazy are high school (51 | 55.4%), and elementary school (41 | 44.6%).
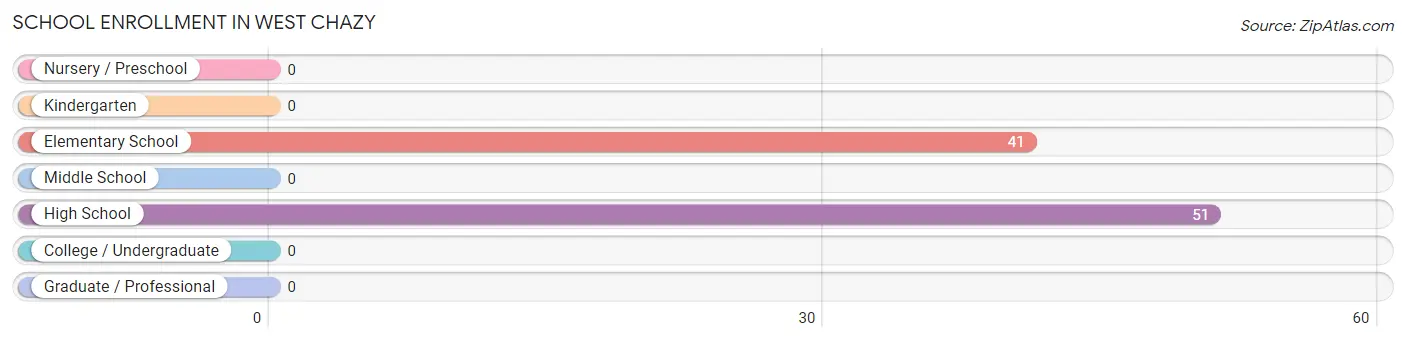
| School Level | # Students | % Students |
| Nursery / Preschool | 0 | 0.0% |
| Kindergarten | 0 | 0.0% |
| Elementary School | 41 | 44.6% |
| Middle School | 0 | 0.0% |
| High School | 51 | 55.4% |
| College / Undergraduate | 0 | 0.0% |
| Graduate / Professional | 0 | 0.0% |
| Total | 92 | 100.0% |
School Enrollment by Age by Funding Source in West Chazy
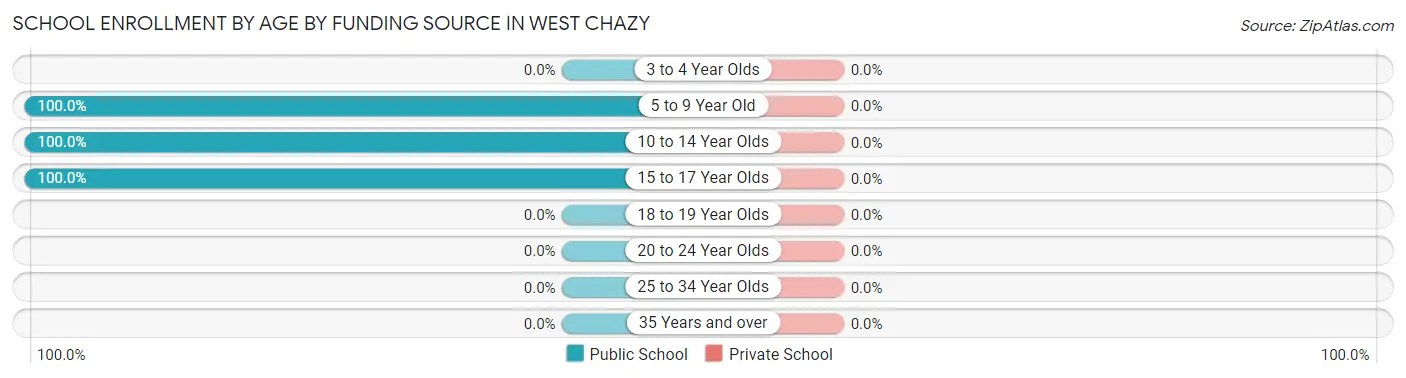
| Age Bracket | Public School | Private School |
| 3 to 4 Year Olds | 0 (0.0%) | 0 (0.0%) |
| 5 to 9 Year Old | 41 (100.0%) | 0 (0.0%) |
| 10 to 14 Year Olds | 13 (100.0%) | 0 (0.0%) |
| 15 to 17 Year Olds | 38 (100.0%) | 0 (0.0%) |
| 18 to 19 Year Olds | 0 (0.0%) | 0 (0.0%) |
| 20 to 24 Year Olds | 0 (0.0%) | 0 (0.0%) |
| 25 to 34 Year Olds | 0 (0.0%) | 0 (0.0%) |
| 35 Years and over | 0 (0.0%) | 0 (0.0%) |
| Total | 92 (100.0%) | 0 (0.0%) |
Educational Attainment by Field of Study in West Chazy
, and literature & languages (58 | 100.0%) are the most common fields of study among 58 individuals in West Chazy who have obtained a bachelor's degree or higher.
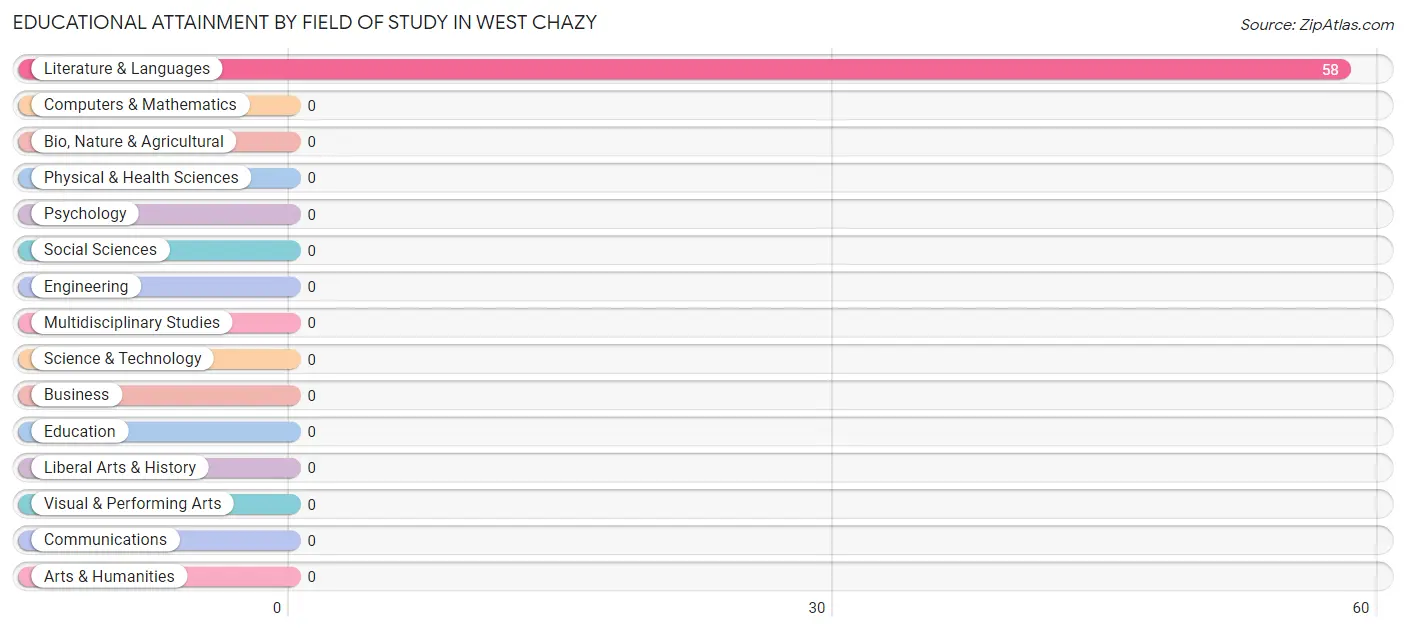
| Field of Study | # Graduates | % Graduates |
| Computers & Mathematics | 0 | 0.0% |
| Bio, Nature & Agricultural | 0 | 0.0% |
| Physical & Health Sciences | 0 | 0.0% |
| Psychology | 0 | 0.0% |
| Social Sciences | 0 | 0.0% |
| Engineering | 0 | 0.0% |
| Multidisciplinary Studies | 0 | 0.0% |
| Science & Technology | 0 | 0.0% |
| Business | 0 | 0.0% |
| Education | 0 | 0.0% |
| Literature & Languages | 58 | 100.0% |
| Liberal Arts & History | 0 | 0.0% |
| Visual & Performing Arts | 0 | 0.0% |
| Communications | 0 | 0.0% |
| Arts & Humanities | 0 | 0.0% |
| Total | 58 | 100.0% |
Transportation & Commute in West Chazy
Vehicle Availability by Sex in West Chazy
The most prevalent vehicle ownership categories in West Chazy are males with 2 vehicles (92, accounting for 77.3%) and females with 2 vehicles (57, making up 119.5%).
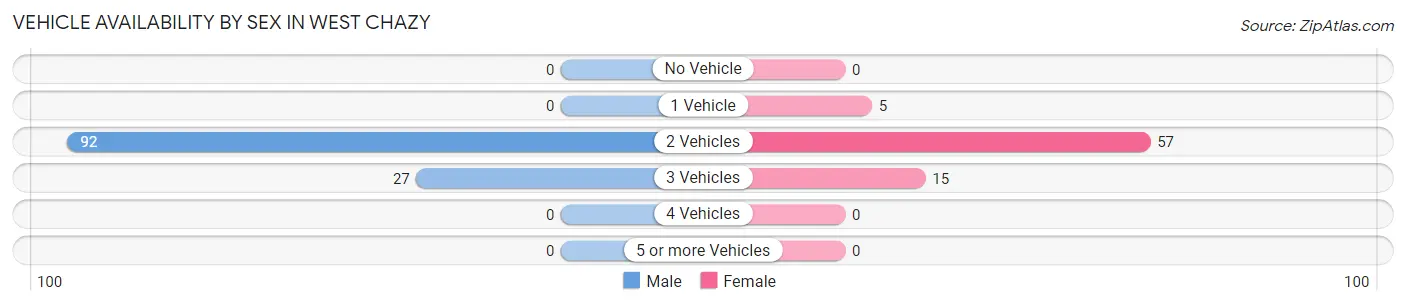
| Vehicles Available | Male | Female |
| No Vehicle | 0 (0.0%) | 0 (0.0%) |
| 1 Vehicle | 0 (0.0%) | 5 (6.5%) |
| 2 Vehicles | 92 (77.3%) | 57 (74.0%) |
| 3 Vehicles | 27 (22.7%) | 15 (19.5%) |
| 4 Vehicles | 0 (0.0%) | 0 (0.0%) |
| 5 or more Vehicles | 0 (0.0%) | 0 (0.0%) |
| Total | 119 (100.0%) | 77 (100.0%) |
Commute Time in West Chazy
The most frequently occuring commute durations in West Chazy are 15 to 19 minutes (53 commuters, 29.3%), 30 to 34 minutes (43 commuters, 23.8%), and 10 to 14 minutes (36 commuters, 19.9%).
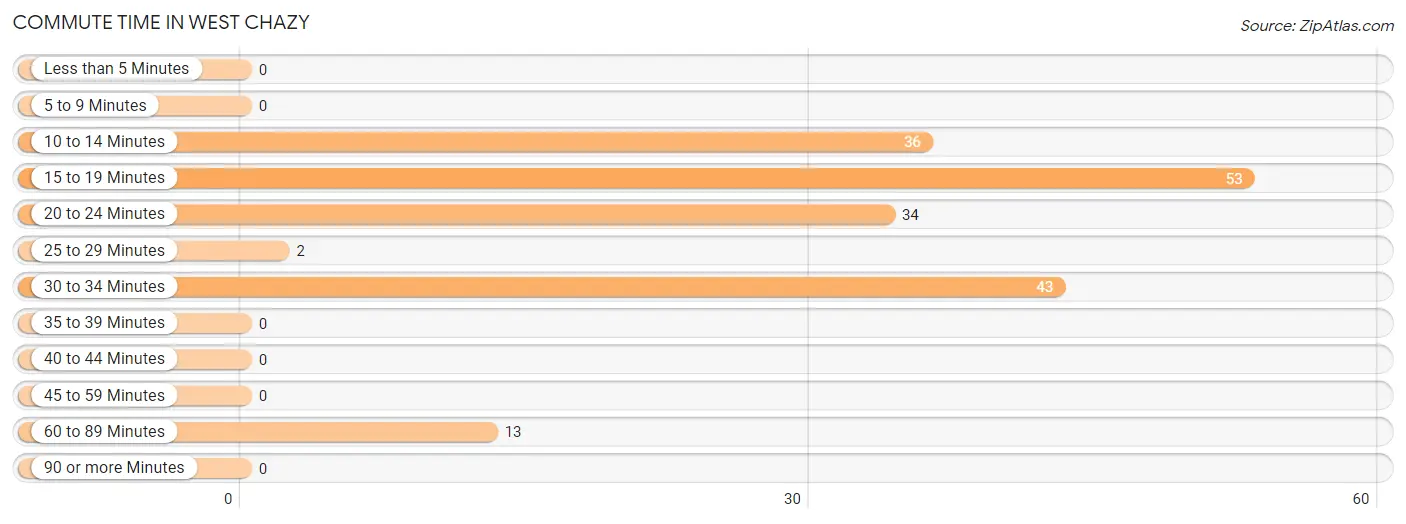
| Commute Time | # Commuters | % Commuters |
| Less than 5 Minutes | 0 | 0.0% |
| 5 to 9 Minutes | 0 | 0.0% |
| 10 to 14 Minutes | 36 | 19.9% |
| 15 to 19 Minutes | 53 | 29.3% |
| 20 to 24 Minutes | 34 | 18.8% |
| 25 to 29 Minutes | 2 | 1.1% |
| 30 to 34 Minutes | 43 | 23.8% |
| 35 to 39 Minutes | 0 | 0.0% |
| 40 to 44 Minutes | 0 | 0.0% |
| 45 to 59 Minutes | 0 | 0.0% |
| 60 to 89 Minutes | 13 | 7.2% |
| 90 or more Minutes | 0 | 0.0% |
Commute Time by Sex in West Chazy
The most common commute times in West Chazy are 10 to 14 minutes (36 commuters, 30.2%) for males and 30 to 34 minutes (43 commuters, 69.4%) for females.
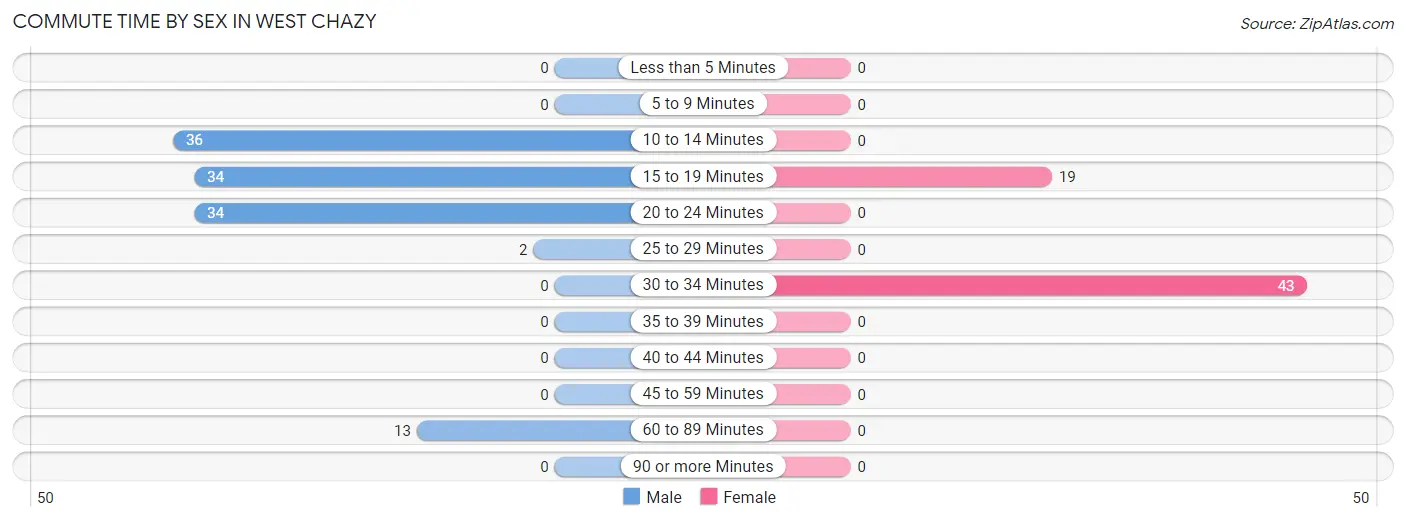
| Commute Time | Male | Female |
| Less than 5 Minutes | 0 (0.0%) | 0 (0.0%) |
| 5 to 9 Minutes | 0 (0.0%) | 0 (0.0%) |
| 10 to 14 Minutes | 36 (30.2%) | 0 (0.0%) |
| 15 to 19 Minutes | 34 (28.6%) | 19 (30.6%) |
| 20 to 24 Minutes | 34 (28.6%) | 0 (0.0%) |
| 25 to 29 Minutes | 2 (1.7%) | 0 (0.0%) |
| 30 to 34 Minutes | 0 (0.0%) | 43 (69.4%) |
| 35 to 39 Minutes | 0 (0.0%) | 0 (0.0%) |
| 40 to 44 Minutes | 0 (0.0%) | 0 (0.0%) |
| 45 to 59 Minutes | 0 (0.0%) | 0 (0.0%) |
| 60 to 89 Minutes | 13 (10.9%) | 0 (0.0%) |
| 90 or more Minutes | 0 (0.0%) | 0 (0.0%) |
Time of Departure to Work by Sex in West Chazy
The most frequent times of departure to work in West Chazy are 6:00 AM to 6:29 AM (62, 52.1%) for males and 7:00 AM to 7:29 AM (35, 56.5%) for females.
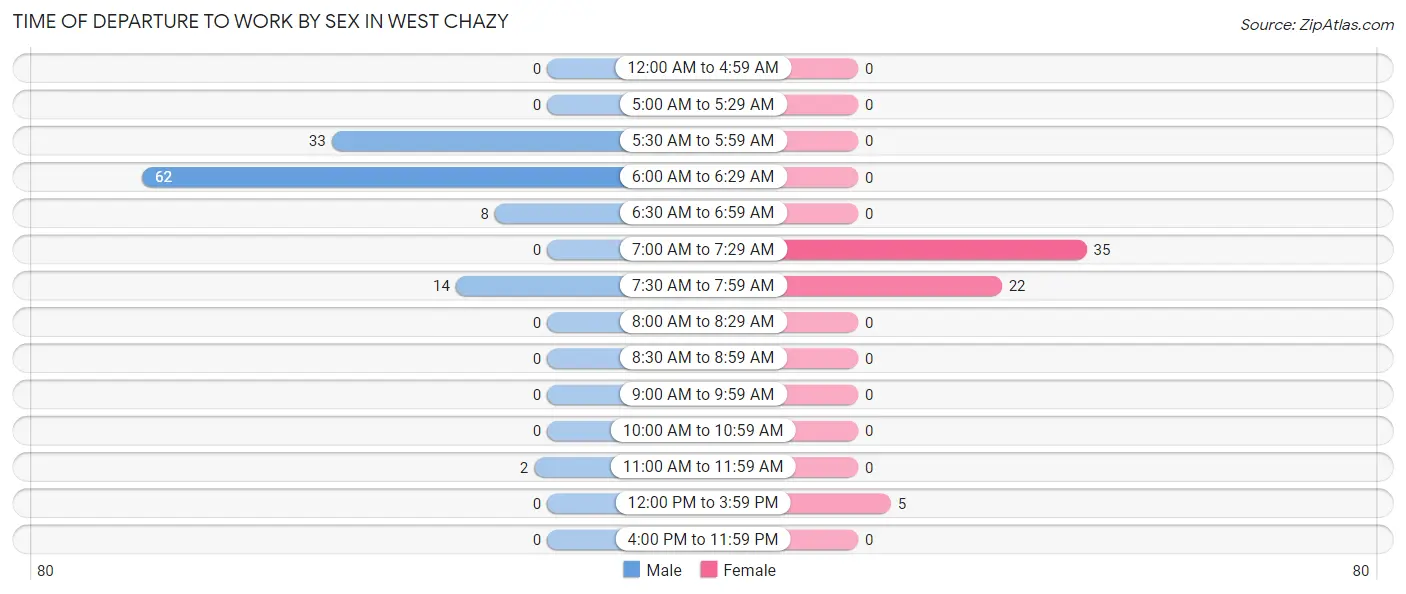
| Time of Departure | Male | Female |
| 12:00 AM to 4:59 AM | 0 (0.0%) | 0 (0.0%) |
| 5:00 AM to 5:29 AM | 0 (0.0%) | 0 (0.0%) |
| 5:30 AM to 5:59 AM | 33 (27.7%) | 0 (0.0%) |
| 6:00 AM to 6:29 AM | 62 (52.1%) | 0 (0.0%) |
| 6:30 AM to 6:59 AM | 8 (6.7%) | 0 (0.0%) |
| 7:00 AM to 7:29 AM | 0 (0.0%) | 35 (56.5%) |
| 7:30 AM to 7:59 AM | 14 (11.8%) | 22 (35.5%) |
| 8:00 AM to 8:29 AM | 0 (0.0%) | 0 (0.0%) |
| 8:30 AM to 8:59 AM | 0 (0.0%) | 0 (0.0%) |
| 9:00 AM to 9:59 AM | 0 (0.0%) | 0 (0.0%) |
| 10:00 AM to 10:59 AM | 0 (0.0%) | 0 (0.0%) |
| 11:00 AM to 11:59 AM | 2 (1.7%) | 0 (0.0%) |
| 12:00 PM to 3:59 PM | 0 (0.0%) | 5 (8.1%) |
| 4:00 PM to 11:59 PM | 0 (0.0%) | 0 (0.0%) |
| Total | 119 (100.0%) | 62 (100.0%) |
Housing Occupancy in West Chazy
Occupancy by Ownership in West Chazy
Of the total 174 dwellings in West Chazy, owner-occupied units account for 174 (100.0%), while renter-occupied units make up 0 (0.0%).
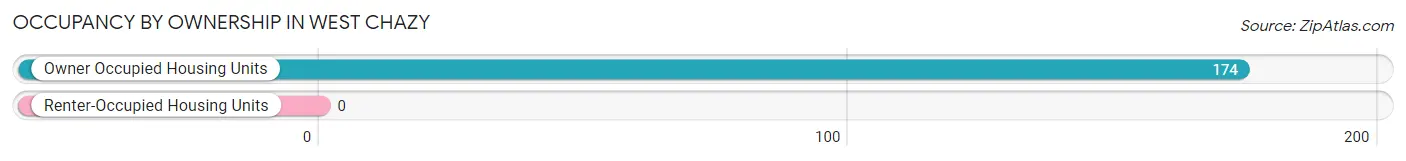
| Occupancy | # Housing Units | % Housing Units |
| Owner Occupied Housing Units | 174 | 100.0% |
| Renter-Occupied Housing Units | 0 | 0.0% |
| Total Occupied Housing Units | 174 | 100.0% |
Occupancy by Household Size in West Chazy
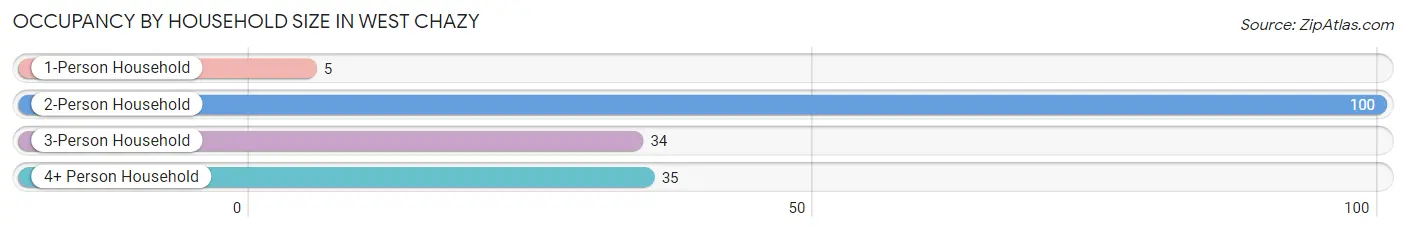
| Household Size | # Housing Units | % Housing Units |
| 1-Person Household | 5 | 2.9% |
| 2-Person Household | 100 | 57.5% |
| 3-Person Household | 34 | 19.5% |
| 4+ Person Household | 35 | 20.1% |
| Total Housing Units | 174 | 100.0% |
Occupancy by Ownership by Household Size in West Chazy
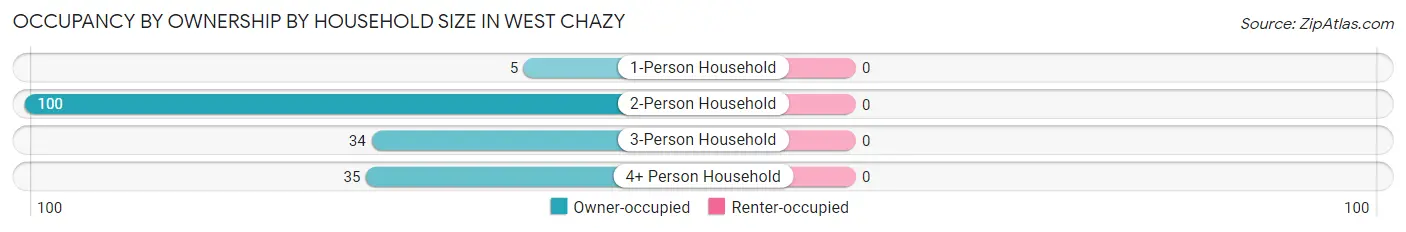
| Household Size | Owner-occupied | Renter-occupied |
| 1-Person Household | 5 (100.0%) | 0 (0.0%) |
| 2-Person Household | 100 (100.0%) | 0 (0.0%) |
| 3-Person Household | 34 (100.0%) | 0 (0.0%) |
| 4+ Person Household | 35 (100.0%) | 0 (0.0%) |
| Total Housing Units | 174 (100.0%) | 0 (0.0%) |
Occupancy by Educational Attainment in West Chazy
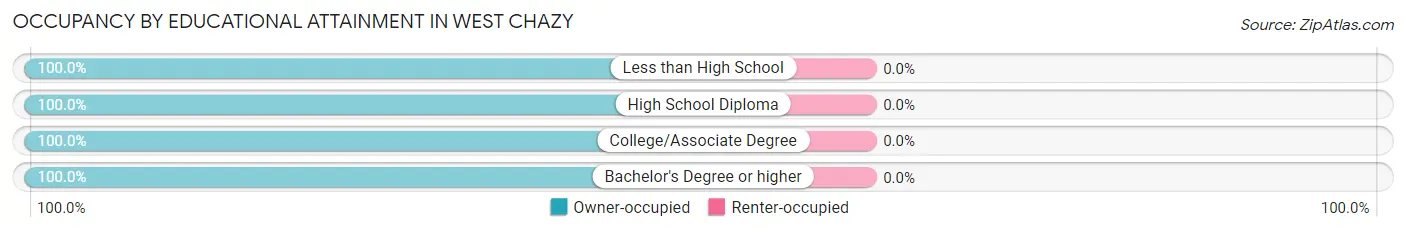
| Household Size | Owner-occupied | Renter-occupied |
| Less than High School | 74 (100.0%) | 0 (0.0%) |
| High School Diploma | 20 (100.0%) | 0 (0.0%) |
| College/Associate Degree | 50 (100.0%) | 0 (0.0%) |
| Bachelor's Degree or higher | 30 (100.0%) | 0 (0.0%) |
Occupancy by Age of Householder in West Chazy
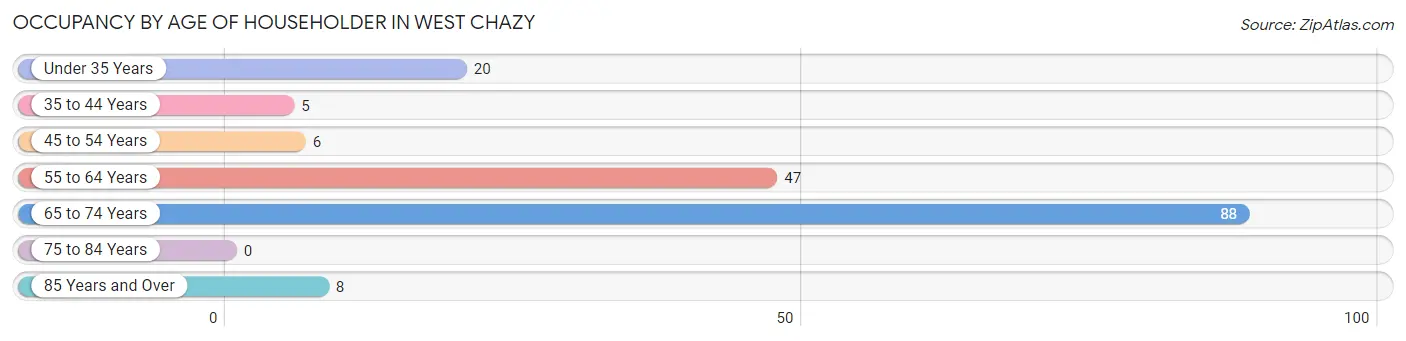
| Age Bracket | # Households | % Households |
| Under 35 Years | 20 | 11.5% |
| 35 to 44 Years | 5 | 2.9% |
| 45 to 54 Years | 6 | 3.5% |
| 55 to 64 Years | 47 | 27.0% |
| 65 to 74 Years | 88 | 50.6% |
| 75 to 84 Years | 0 | 0.0% |
| 85 Years and Over | 8 | 4.6% |
| Total | 174 | 100.0% |
Housing Finances in West Chazy
Median Income by Occupancy in West Chazy
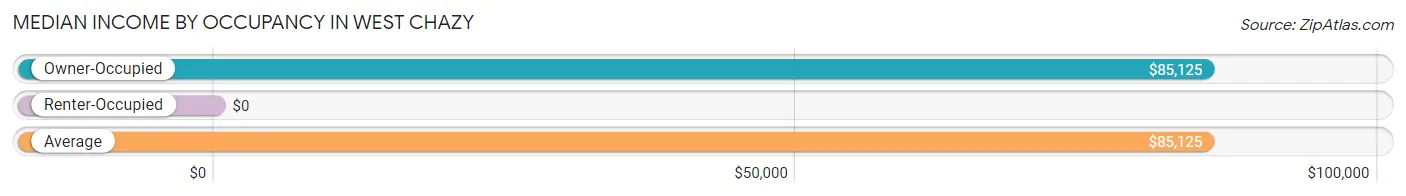
| Occupancy Type | # Households | Median Income |
| Owner-Occupied | 174 (100.0%) | $85,125 |
| Renter-Occupied | 0 (0.0%) | $0 |
| Average | 174 (100.0%) | $85,125 |
Occupancy by Householder Income Bracket in West Chazy
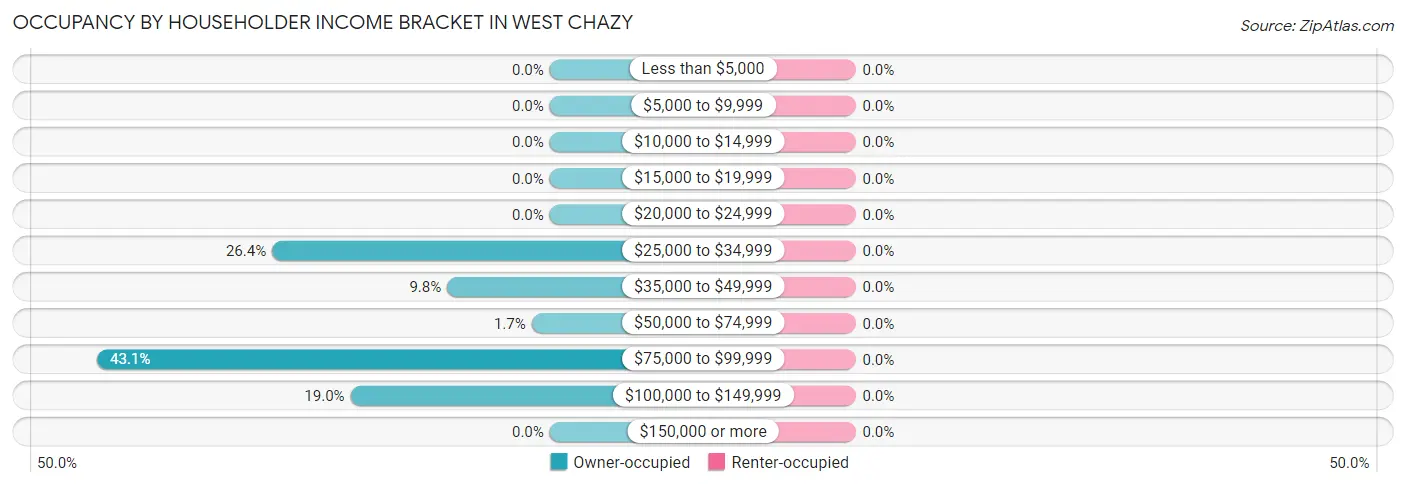
| Income Bracket | Owner-occupied | Renter-occupied |
| Less than $5,000 | 0 (0.0%) | 0 (0.0%) |
| $5,000 to $9,999 | 0 (0.0%) | 0 (0.0%) |
| $10,000 to $14,999 | 0 (0.0%) | 0 (0.0%) |
| $15,000 to $19,999 | 0 (0.0%) | 0 (0.0%) |
| $20,000 to $24,999 | 0 (0.0%) | 0 (0.0%) |
| $25,000 to $34,999 | 46 (26.4%) | 0 (0.0%) |
| $35,000 to $49,999 | 17 (9.8%) | 0 (0.0%) |
| $50,000 to $74,999 | 3 (1.7%) | 0 (0.0%) |
| $75,000 to $99,999 | 75 (43.1%) | 0 (0.0%) |
| $100,000 to $149,999 | 33 (19.0%) | 0 (0.0%) |
| $150,000 or more | 0 (0.0%) | 0 (0.0%) |
| Total | 174 (100.0%) | 0 (0.0%) |
Monthly Housing Cost Tiers in West Chazy
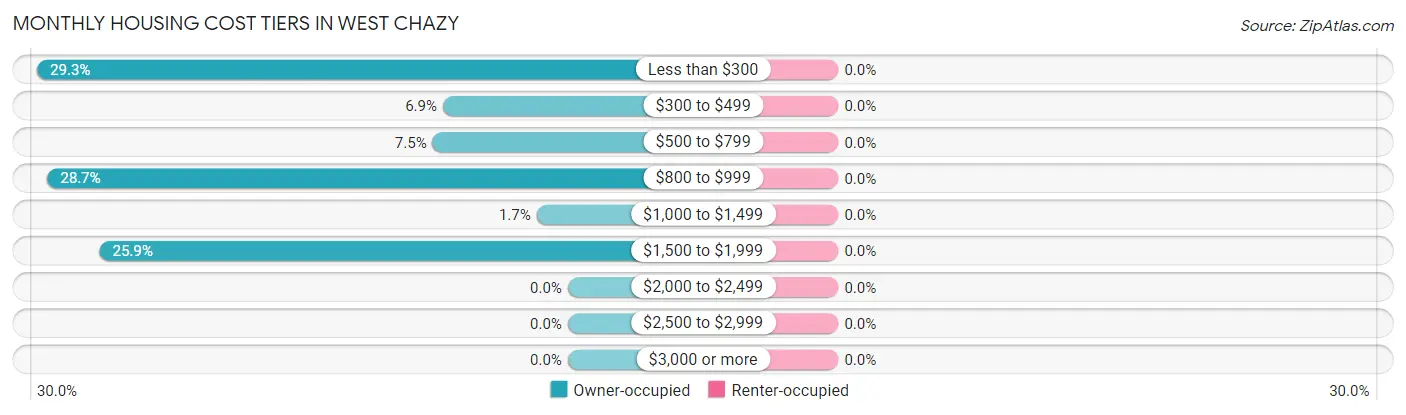
| Monthly Cost | Owner-occupied | Renter-occupied |
| Less than $300 | 51 (29.3%) | 0 (0.0%) |
| $300 to $499 | 12 (6.9%) | 0 (0.0%) |
| $500 to $799 | 13 (7.5%) | 0 (0.0%) |
| $800 to $999 | 50 (28.7%) | 0 (0.0%) |
| $1,000 to $1,499 | 3 (1.7%) | 0 (0.0%) |
| $1,500 to $1,999 | 45 (25.9%) | 0 (0.0%) |
| $2,000 to $2,499 | 0 (0.0%) | 0 (0.0%) |
| $2,500 to $2,999 | 0 (0.0%) | 0 (0.0%) |
| $3,000 or more | 0 (0.0%) | 0 (0.0%) |
| Total | 174 (100.0%) | 0 (0.0%) |
Physical Housing Characteristics in West Chazy
Housing Structures in West Chazy
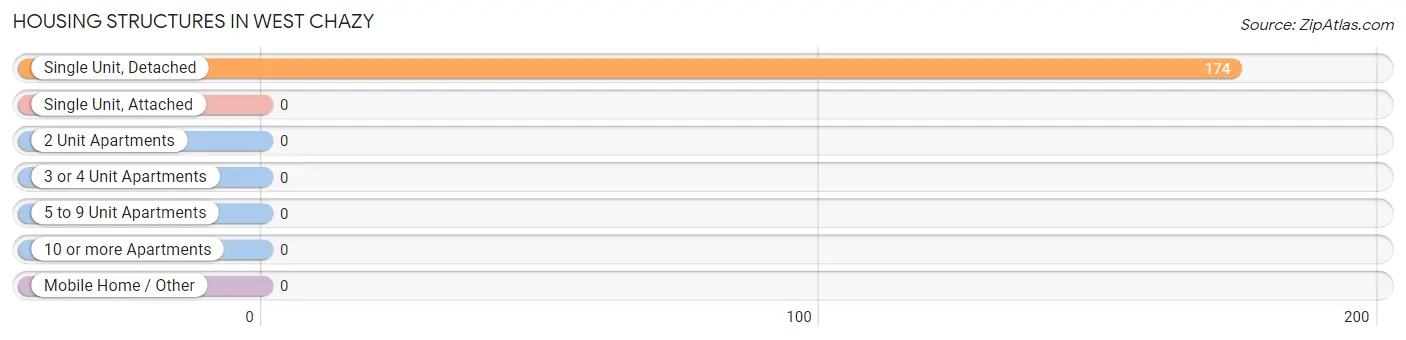
| Structure Type | # Housing Units | % Housing Units |
| Single Unit, Detached | 174 | 100.0% |
| Single Unit, Attached | 0 | 0.0% |
| 2 Unit Apartments | 0 | 0.0% |
| 3 or 4 Unit Apartments | 0 | 0.0% |
| 5 to 9 Unit Apartments | 0 | 0.0% |
| 10 or more Apartments | 0 | 0.0% |
| Mobile Home / Other | 0 | 0.0% |
| Total | 174 | 100.0% |
Housing Structures by Occupancy in West Chazy
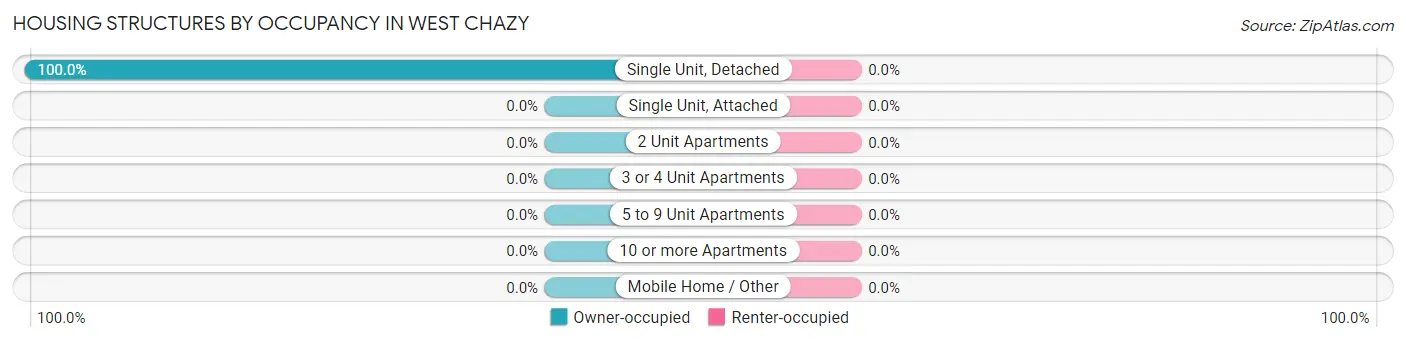
| Structure Type | Owner-occupied | Renter-occupied |
| Single Unit, Detached | 174 (100.0%) | 0 (0.0%) |
| Single Unit, Attached | 0 (0.0%) | 0 (0.0%) |
| 2 Unit Apartments | 0 (0.0%) | 0 (0.0%) |
| 3 or 4 Unit Apartments | 0 (0.0%) | 0 (0.0%) |
| 5 to 9 Unit Apartments | 0 (0.0%) | 0 (0.0%) |
| 10 or more Apartments | 0 (0.0%) | 0 (0.0%) |
| Mobile Home / Other | 0 (0.0%) | 0 (0.0%) |
| Total | 174 (100.0%) | 0 (0.0%) |
Housing Structures by Number of Rooms in West Chazy
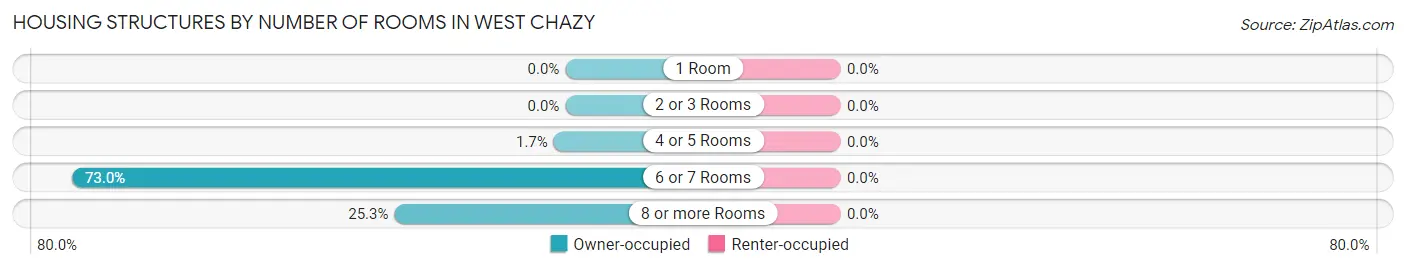
| Number of Rooms | Owner-occupied | Renter-occupied |
| 1 Room | 0 (0.0%) | 0 (0.0%) |
| 2 or 3 Rooms | 0 (0.0%) | 0 (0.0%) |
| 4 or 5 Rooms | 3 (1.7%) | 0 (0.0%) |
| 6 or 7 Rooms | 127 (73.0%) | 0 (0.0%) |
| 8 or more Rooms | 44 (25.3%) | 0 (0.0%) |
| Total | 174 (100.0%) | 0 (0.0%) |
Housing Structure by Heating Type in West Chazy
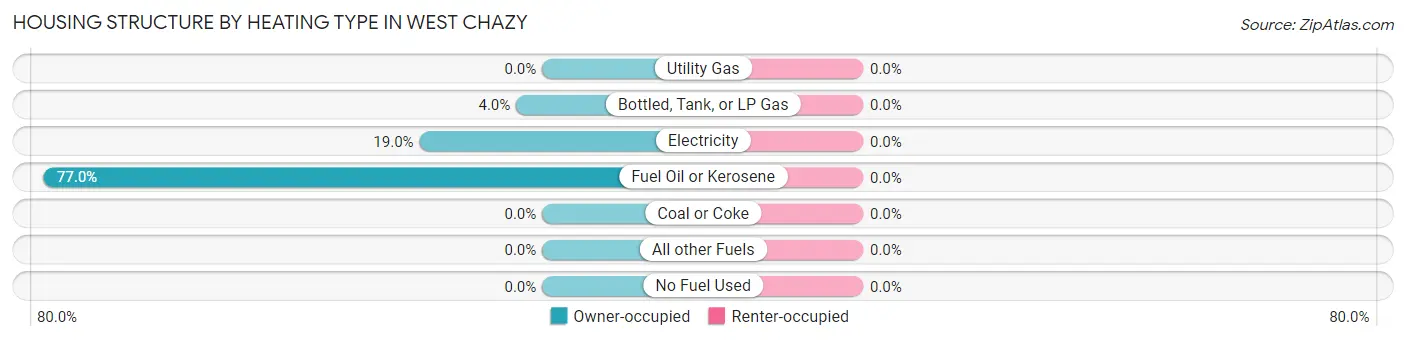
| Heating Type | Owner-occupied | Renter-occupied |
| Utility Gas | 0 (0.0%) | 0 (0.0%) |
| Bottled, Tank, or LP Gas | 7 (4.0%) | 0 (0.0%) |
| Electricity | 33 (19.0%) | 0 (0.0%) |
| Fuel Oil or Kerosene | 134 (77.0%) | 0 (0.0%) |
| Coal or Coke | 0 (0.0%) | 0 (0.0%) |
| All other Fuels | 0 (0.0%) | 0 (0.0%) |
| No Fuel Used | 0 (0.0%) | 0 (0.0%) |
| Total | 174 (100.0%) | 0 (0.0%) |
Household Vehicle Usage in West Chazy
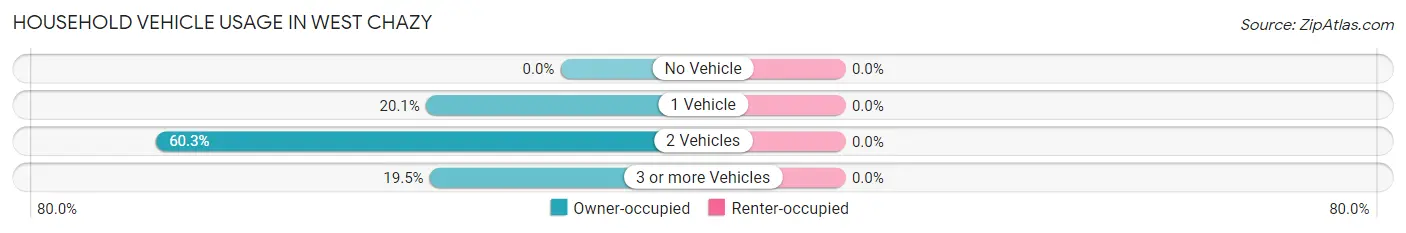
| Vehicles per Household | Owner-occupied | Renter-occupied |
| No Vehicle | 0 (0.0%) | 0 (0.0%) |
| 1 Vehicle | 35 (20.1%) | 0 (0.0%) |
| 2 Vehicles | 105 (60.3%) | 0 (0.0%) |
| 3 or more Vehicles | 34 (19.5%) | 0 (0.0%) |
| Total | 174 (100.0%) | 0 (0.0%) |
Real Estate & Mortgages in West Chazy
Real Estate and Mortgage Overview in West Chazy
| Characteristic | Without Mortgage | With Mortgage |
| Housing Units | 101 | 73 |
| Median Property Value | - | - |
| Median Household Income | - | - |
| Monthly Housing Costs | - | - |
| Real Estate Taxes | - | - |
Property Value by Mortgage Status in West Chazy
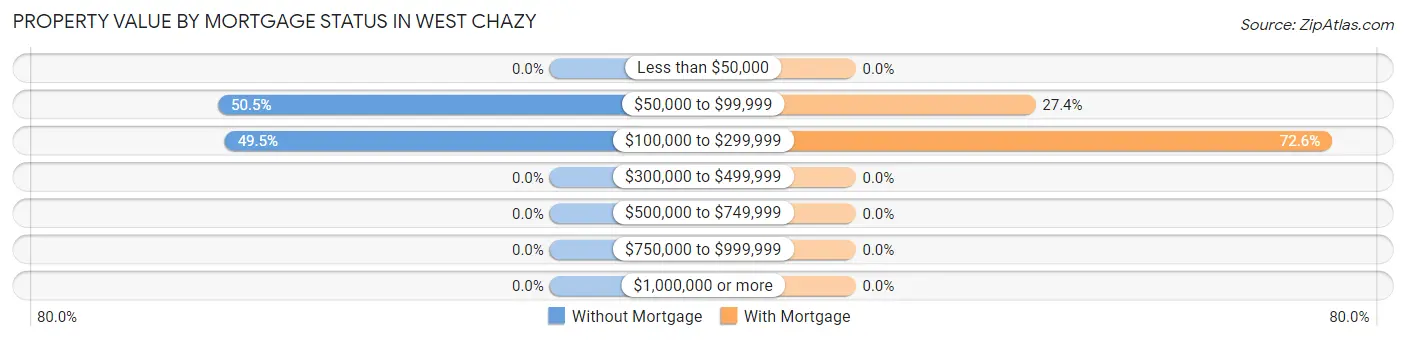
| Property Value | Without Mortgage | With Mortgage |
| Less than $50,000 | 0 (0.0%) | 0 (0.0%) |
| $50,000 to $99,999 | 51 (50.5%) | 20 (27.4%) |
| $100,000 to $299,999 | 50 (49.5%) | 53 (72.6%) |
| $300,000 to $499,999 | 0 (0.0%) | 0 (0.0%) |
| $500,000 to $749,999 | 0 (0.0%) | 0 (0.0%) |
| $750,000 to $999,999 | 0 (0.0%) | 0 (0.0%) |
| $1,000,000 or more | 0 (0.0%) | 0 (0.0%) |
| Total | 101 (100.0%) | 73 (100.0%) |
Household Income by Mortgage Status in West Chazy
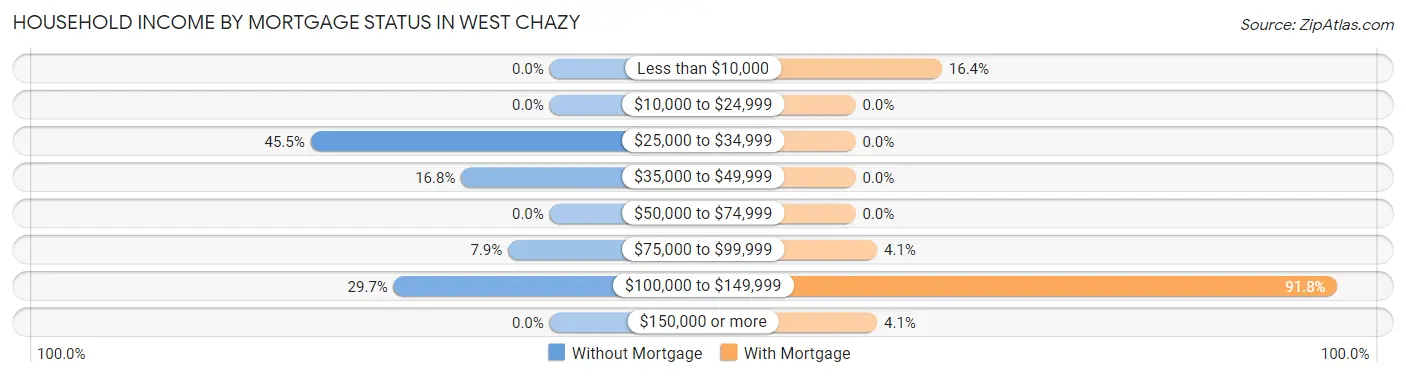
| Household Income | Without Mortgage | With Mortgage |
| Less than $10,000 | 0 (0.0%) | 12 (16.4%) |
| $10,000 to $24,999 | 0 (0.0%) | 0 (0.0%) |
| $25,000 to $34,999 | 46 (45.5%) | 0 (0.0%) |
| $35,000 to $49,999 | 17 (16.8%) | 0 (0.0%) |
| $50,000 to $74,999 | 0 (0.0%) | 0 (0.0%) |
| $75,000 to $99,999 | 8 (7.9%) | 3 (4.1%) |
| $100,000 to $149,999 | 30 (29.7%) | 67 (91.8%) |
| $150,000 or more | 0 (0.0%) | 3 (4.1%) |
| Total | 101 (100.0%) | 73 (100.0%) |
Property Value to Household Income Ratio in West Chazy
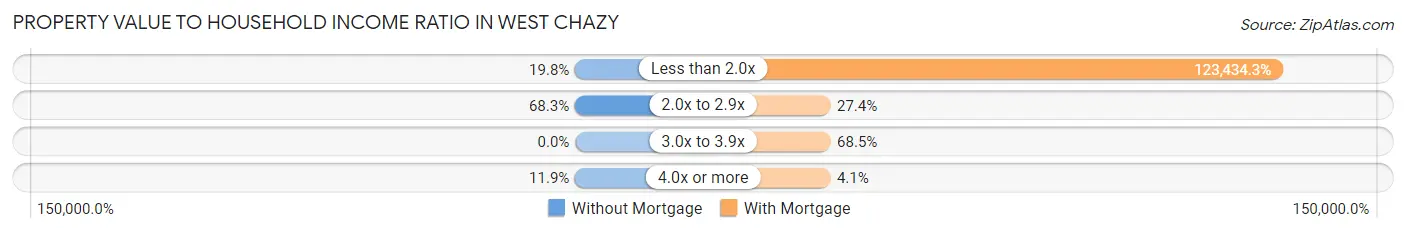
| Value-to-Income Ratio | Without Mortgage | With Mortgage |
| Less than 2.0x | 20 (19.8%) | 90,107 (123,434.2%) |
| 2.0x to 2.9x | 69 (68.3%) | 20 (27.4%) |
| 3.0x to 3.9x | 0 (0.0%) | 50 (68.5%) |
| 4.0x or more | 12 (11.9%) | 3 (4.1%) |
| Total | 101 (100.0%) | 73 (100.0%) |
Real Estate Taxes by Mortgage Status in West Chazy
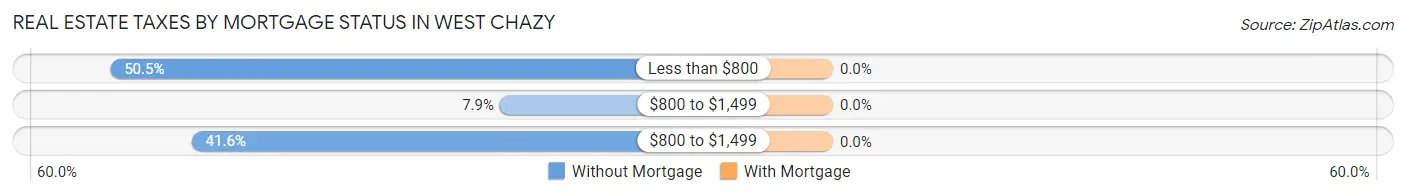
| Property Taxes | Without Mortgage | With Mortgage |
| Less than $800 | 51 (50.5%) | 0 (0.0%) |
| $800 to $1,499 | 8 (7.9%) | 0 (0.0%) |
| $800 to $1,499 | 42 (41.6%) | 0 (0.0%) |
| Total | 101 (100.0%) | 73 (100.0%) |
Health & Disability in West Chazy
Health Insurance Coverage by Age in West Chazy
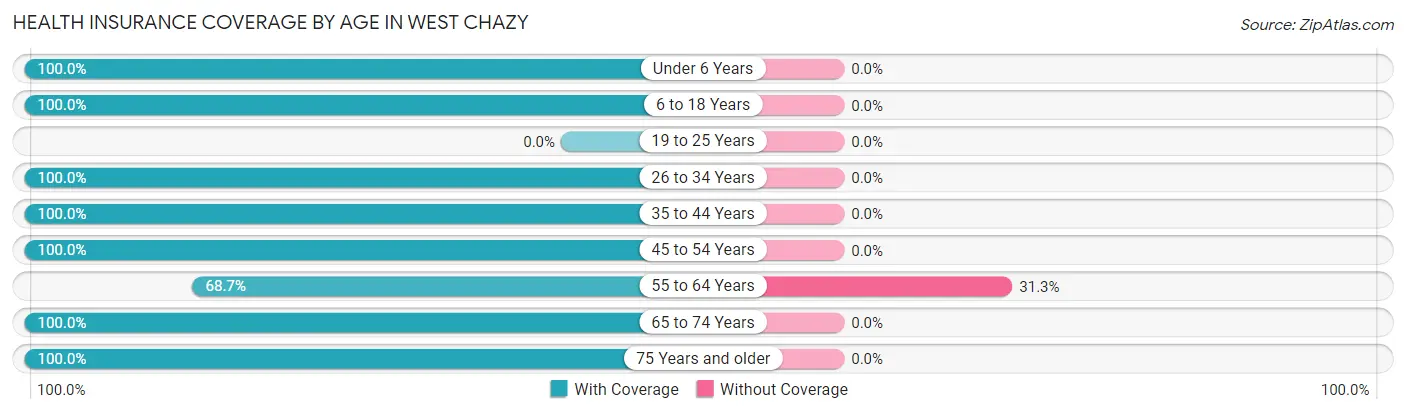
| Age Bracket | With Coverage | Without Coverage |
| Under 6 Years | 18 (100.0%) | 0 (0.0%) |
| 6 to 18 Years | 92 (100.0%) | 0 (0.0%) |
| 19 to 25 Years | 0 (0.0%) | 0 (0.0%) |
| 26 to 34 Years | 41 (100.0%) | 0 (0.0%) |
| 35 to 44 Years | 19 (100.0%) | 0 (0.0%) |
| 45 to 54 Years | 8 (100.0%) | 0 (0.0%) |
| 55 to 64 Years | 92 (68.7%) | 42 (31.3%) |
| 65 to 74 Years | 116 (100.0%) | 0 (0.0%) |
| 75 Years and older | 53 (100.0%) | 0 (0.0%) |
| Total | 439 (91.3%) | 42 (8.7%) |
Health Insurance Coverage by Citizenship Status in West Chazy
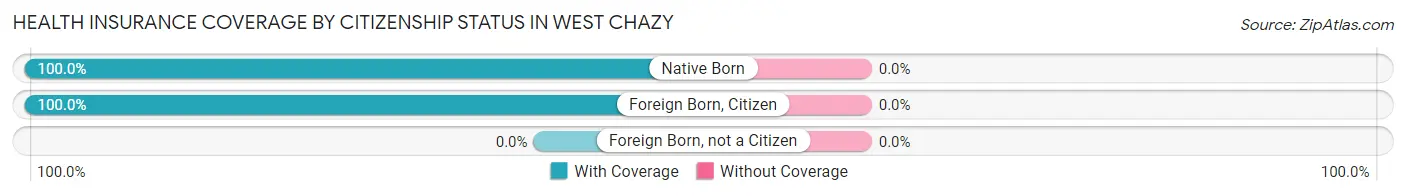
| Citizenship Status | With Coverage | Without Coverage |
| Native Born | 18 (100.0%) | 0 (0.0%) |
| Foreign Born, Citizen | 92 (100.0%) | 0 (0.0%) |
| Foreign Born, not a Citizen | 0 (0.0%) | 0 (0.0%) |
Health Insurance Coverage by Household Income in West Chazy
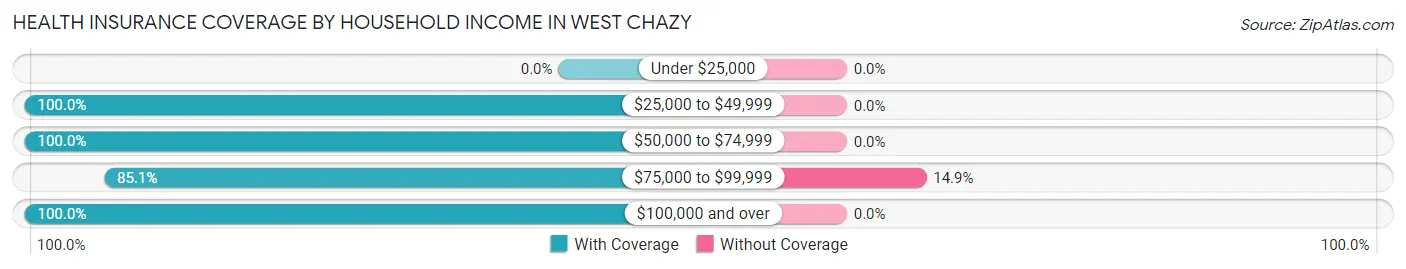
| Household Income | With Coverage | Without Coverage |
| Under $25,000 | 0 (0.0%) | 0 (0.0%) |
| $25,000 to $49,999 | 104 (100.0%) | 0 (0.0%) |
| $50,000 to $74,999 | 30 (100.0%) | 0 (0.0%) |
| $75,000 to $99,999 | 240 (85.1%) | 42 (14.9%) |
| $100,000 and over | 65 (100.0%) | 0 (0.0%) |
Public vs Private Health Insurance Coverage by Age in West Chazy
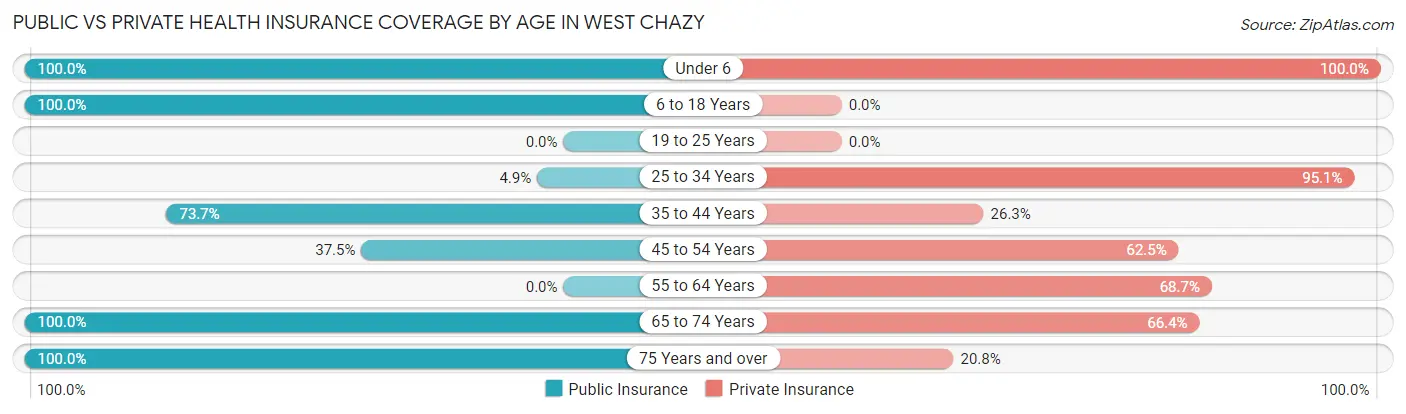
| Age Bracket | Public Insurance | Private Insurance |
| Under 6 | 18 (100.0%) | 18 (100.0%) |
| 6 to 18 Years | 92 (100.0%) | 0 (0.0%) |
| 19 to 25 Years | 0 (0.0%) | 0 (0.0%) |
| 25 to 34 Years | 2 (4.9%) | 39 (95.1%) |
| 35 to 44 Years | 14 (73.7%) | 5 (26.3%) |
| 45 to 54 Years | 3 (37.5%) | 5 (62.5%) |
| 55 to 64 Years | 0 (0.0%) | 92 (68.7%) |
| 65 to 74 Years | 116 (100.0%) | 77 (66.4%) |
| 75 Years and over | 53 (100.0%) | 11 (20.7%) |
| Total | 298 (62.0%) | 247 (51.3%) |
Disability Status by Sex by Age in West Chazy
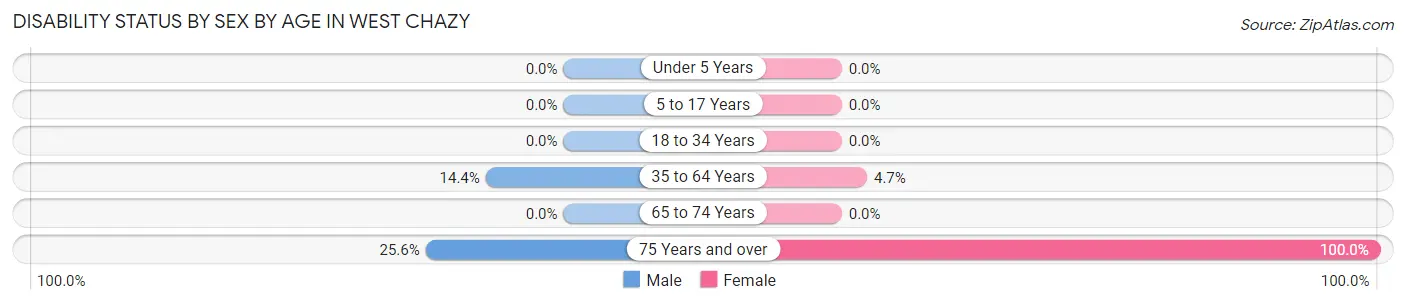
| Age Bracket | Male | Female |
| Under 5 Years | 0 (0.0%) | 0 (0.0%) |
| 5 to 17 Years | 0 (0.0%) | 0 (0.0%) |
| 18 to 34 Years | 0 (0.0%) | 0 (0.0%) |
| 35 to 64 Years | 14 (14.4%) | 3 (4.7%) |
| 65 to 74 Years | 0 (0.0%) | 0 (0.0%) |
| 75 Years and over | 11 (25.6%) | 10 (100.0%) |
Disability Class by Sex by Age in West Chazy
Disability Class: Hearing Difficulty
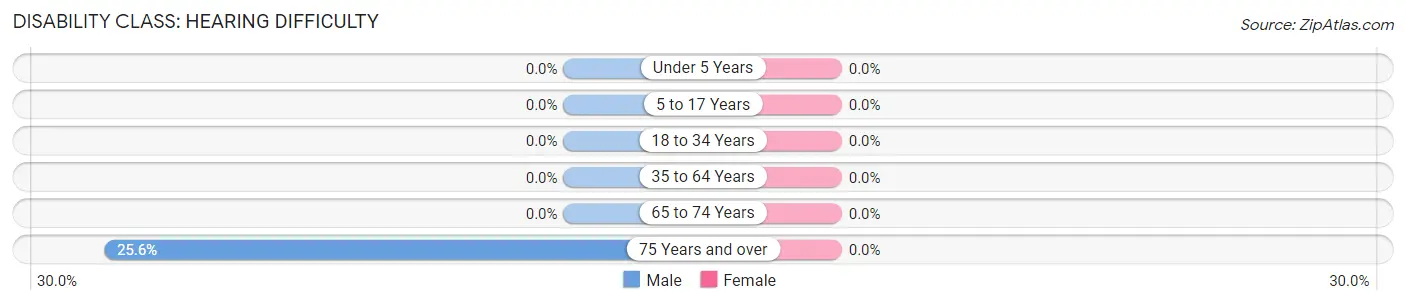
| Age Bracket | Male | Female |
| Under 5 Years | 0 (0.0%) | 0 (0.0%) |
| 5 to 17 Years | 0 (0.0%) | 0 (0.0%) |
| 18 to 34 Years | 0 (0.0%) | 0 (0.0%) |
| 35 to 64 Years | 0 (0.0%) | 0 (0.0%) |
| 65 to 74 Years | 0 (0.0%) | 0 (0.0%) |
| 75 Years and over | 11 (25.6%) | 0 (0.0%) |
Disability Class: Vision Difficulty
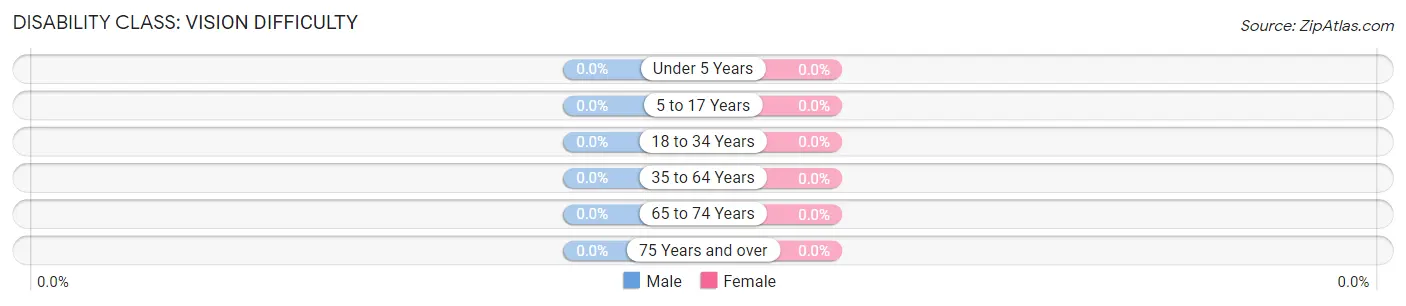
| Age Bracket | Male | Female |
| Under 5 Years | 0 (0.0%) | 0 (0.0%) |
| 5 to 17 Years | 0 (0.0%) | 0 (0.0%) |
| 18 to 34 Years | 0 (0.0%) | 0 (0.0%) |
| 35 to 64 Years | 0 (0.0%) | 0 (0.0%) |
| 65 to 74 Years | 0 (0.0%) | 0 (0.0%) |
| 75 Years and over | 0 (0.0%) | 0 (0.0%) |
Disability Class: Cognitive Difficulty
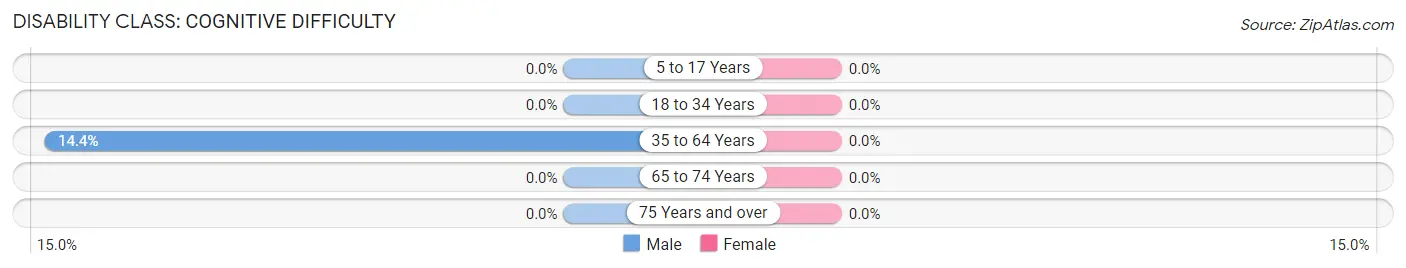
| Age Bracket | Male | Female |
| 5 to 17 Years | 0 (0.0%) | 0 (0.0%) |
| 18 to 34 Years | 0 (0.0%) | 0 (0.0%) |
| 35 to 64 Years | 14 (14.4%) | 0 (0.0%) |
| 65 to 74 Years | 0 (0.0%) | 0 (0.0%) |
| 75 Years and over | 0 (0.0%) | 0 (0.0%) |
Disability Class: Ambulatory Difficulty
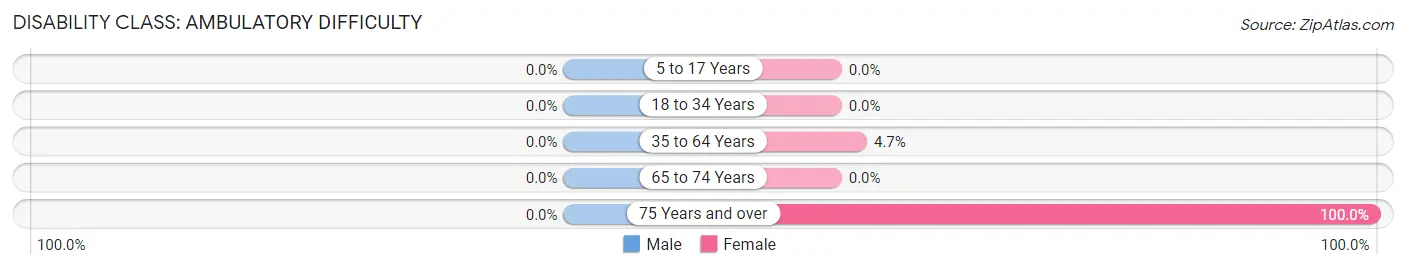
| Age Bracket | Male | Female |
| 5 to 17 Years | 0 (0.0%) | 0 (0.0%) |
| 18 to 34 Years | 0 (0.0%) | 0 (0.0%) |
| 35 to 64 Years | 0 (0.0%) | 3 (4.7%) |
| 65 to 74 Years | 0 (0.0%) | 0 (0.0%) |
| 75 Years and over | 0 (0.0%) | 10 (100.0%) |
Disability Class: Self-Care Difficulty
| Age Bracket | Male | Female |
| 5 to 17 Years | 0 (0.0%) | 0 (0.0%) |
| 18 to 34 Years | 0 (0.0%) | 0 (0.0%) |
| 35 to 64 Years | 0 (0.0%) | 0 (0.0%) |
| 65 to 74 Years | 0 (0.0%) | 0 (0.0%) |
| 75 Years and over | 0 (0.0%) | 0 (0.0%) |
Technology Access in West Chazy
Computing Device Access in West Chazy
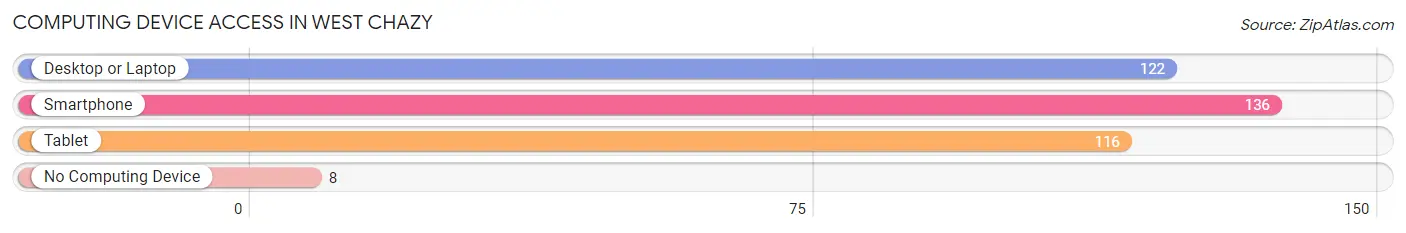
| Device Type | # Households | % Households |
| Desktop or Laptop | 122 | 70.1% |
| Smartphone | 136 | 78.2% |
| Tablet | 116 | 66.7% |
| No Computing Device | 8 | 4.6% |
| Total | 174 | 100.0% |
Internet Access in West Chazy
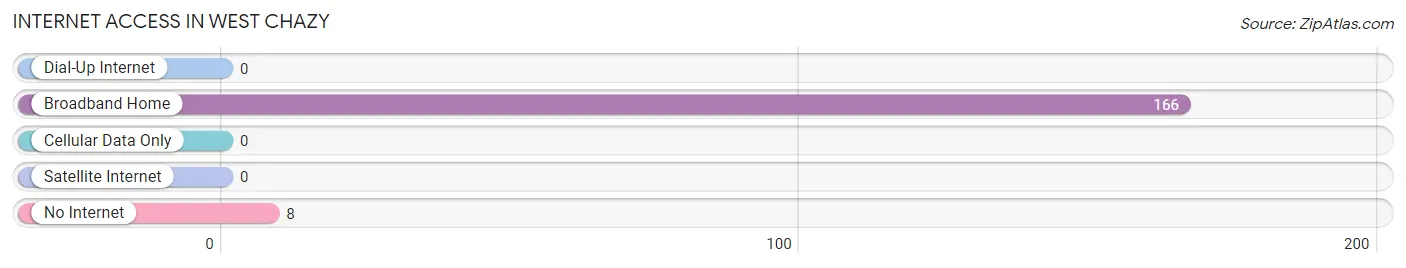
| Internet Type | # Households | % Households |
| Dial-Up Internet | 0 | 0.0% |
| Broadband Home | 166 | 95.4% |
| Cellular Data Only | 0 | 0.0% |
| Satellite Internet | 0 | 0.0% |
| No Internet | 8 | 4.6% |
| Total | 174 | 100.0% |
West Chazy Summary
West Chazy is a small town located in Clinton County, New York. It is situated on the western edge of the Adirondack Mountains and is part of the Plattsburgh Metropolitan Statistical Area. The town has a population of approximately 1,500 people and covers an area of about 10 square miles.
History
West Chazy was first settled in 1795 by a group of settlers from Vermont. The town was originally known as “Chazy” and was part of the town of Chazy. In 1817, the town was split into two parts, with the western portion becoming known as West Chazy. The town was officially incorporated in 1819.
The town was named after the Chazy River, which runs through the area. The river was named after the Chazy Indians, who were the original inhabitants of the area.
Geography
West Chazy is located in the western part of Clinton County, New York. It is situated on the western edge of the Adirondack Mountains and is part of the Plattsburgh Metropolitan Statistical Area. The town has a total area of 10.2 square miles, of which 10.1 square miles is land and 0.1 square miles is water.
The town is bordered by the towns of Chazy to the east, Altona to the south, and Mooers to the west. The town is also bordered by the Chazy River, which runs through the area.
Economy
The economy of West Chazy is largely based on agriculture and tourism. The town is home to several dairy farms, as well as a number of apple orchards. The town is also home to several small businesses, including a few restaurants and a few retail stores.
The town is also a popular tourist destination, as it is located near several popular attractions, including the Ausable Chasm, the Adirondack Mountains, and Lake Champlain.
Demographics
As of the 2010 census, the population of West Chazy was 1,521. The racial makeup of the town was 97.3% White, 0.7% African American, 0.3% Native American, 0.2% Asian, 0.1% Pacific Islander, 0.2% from other races, and 1.2% from two or more races. Hispanic or Latino of any race were 1.2% of the population.
The median household income in West Chazy was $45,938, and the median family income was $50,625. The per capita income for the town was $20,945. About 8.3% of families and 10.2% of the population were below the poverty line, including 14.2% of those under age 18 and 5.2% of those age 65 or over.
Common Questions
What is Per Capita Income in West Chazy?
Per Capita income in West Chazy is $24,273.
What is the Median Family Income in West Chazy?
Median Family Income in West Chazy is $85,438.
What is the Median Household income in West Chazy?
Median Household Income in West Chazy is $85,125.
What is Inequality or Gini Index in West Chazy?
Inequality or Gini Index in West Chazy is 0.24.
What is the Total Population of West Chazy?
Total Population of West Chazy is 481.
What is the Total Male Population of West Chazy?
Total Male Population of West Chazy is 266.
What is the Total Female Population of West Chazy?
Total Female Population of West Chazy is 215.
What is the Ratio of Males per 100 Females in West Chazy?
There are 123.72 Males per 100 Females in West Chazy.
What is the Ratio of Females per 100 Males in West Chazy?
There are 80.83 Females per 100 Males in West Chazy.
What is the Median Population Age in West Chazy?
Median Population Age in West Chazy is 57.7 Years.
What is the Average Family Size in West Chazy
Average Family Size in West Chazy is 2.8 People.
What is the Average Household Size in West Chazy
Average Household Size in West Chazy is 2.8 People.
How Large is the Labor Force in West Chazy?
There are 196 People in the Labor Forcein in West Chazy.
What is the Percentage of People in the Labor Force in West Chazy?
47.9% of People are in the Labor Force in West Chazy.