Cities with the Highest Percentage of Population Employed in Sales & Related in New York
RELATED REPORTS & OPTIONS
Sales & Related
New York
Compare Cities
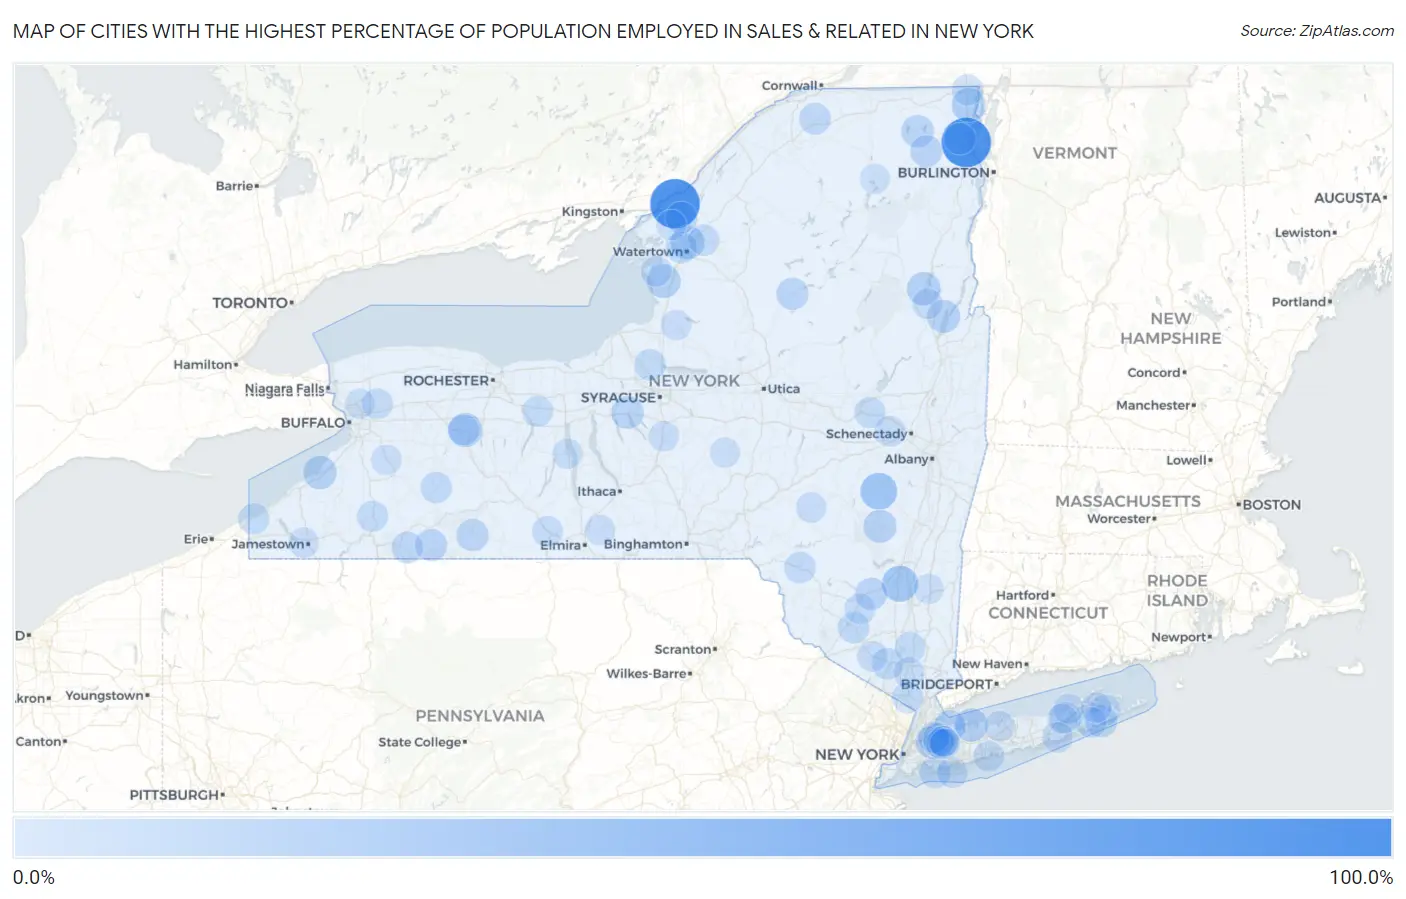
Map of Cities with the Highest Percentage of Population Employed in Sales & Related in New York
0.0%
100.0%
Cities with the Highest Percentage of Population Employed in Sales & Related in New York
| City | % Employed | vs State | vs National | |
| 1. | Parc | 100.0% | 9.0%(+91.0)#1 | 9.6%(+90.4)#6 |
| 2. | Fishers Landing | 100.0% | 9.0%(+91.0)#2 | 9.6%(+90.4)#18 |
| 3. | Portlandville | 75.6% | 9.0%(+66.6)#3 | 9.6%(+66.0)#53 |
| 4. | Oak Beach | 68.5% | 9.0%(+59.5)#4 | 9.6%(+58.9)#60 |
| 5. | Mongaup Valley | 50.0% | 9.0%(+41.0)#5 | 9.6%(+40.4)#171 |
| 6. | South Cairo | 48.2% | 9.0%(+39.1)#6 | 9.6%(+38.6)#203 |
| 7. | Preston Potter Hollow | 44.1% | 9.0%(+35.0)#7 | 9.6%(+34.5)#247 |
| 8. | Barryville | 42.7% | 9.0%(+33.6)#8 | 9.6%(+33.1)#274 |
| 9. | Rifton | 41.6% | 9.0%(+32.6)#9 | 9.6%(+32.0)#287 |
| 10. | Chazy | 33.3% | 9.0%(+24.3)#10 | 9.6%(+23.7)#473 |
| 11. | Piffard | 33.3% | 9.0%(+24.3)#11 | 9.6%(+23.7)#474 |
| 12. | Pamelia Center | 32.0% | 9.0%(+23.0)#12 | 9.6%(+22.4)#531 |
| 13. | Belleville | 31.9% | 9.0%(+22.8)#13 | 9.6%(+22.3)#541 |
| 14. | Hamilton College | 31.7% | 9.0%(+22.7)#14 | 9.6%(+22.1)#549 |
| 15. | Pottersville | 31.6% | 9.0%(+22.6)#15 | 9.6%(+22.1)#551 |
| 16. | Sunset Bay | 30.6% | 9.0%(+21.6)#16 | 9.6%(+21.0)#597 |
| 17. | Huntington Bay | 30.2% | 9.0%(+21.2)#17 | 9.6%(+20.7)#619 |
| 18. | Eldred | 29.7% | 9.0%(+20.7)#18 | 9.6%(+20.1)#656 |
| 19. | Bolton Landing | 29.5% | 9.0%(+20.5)#19 | 9.6%(+19.9)#665 |
| 20. | Hunter | 28.8% | 9.0%(+19.7)#20 | 9.6%(+19.2)#707 |
| 21. | Harbor Hills | 28.6% | 9.0%(+19.6)#21 | 9.6%(+19.0)#721 |
| 22. | South Lansing | 27.9% | 9.0%(+18.9)#22 | 9.6%(+18.3)#776 |
| 23. | Skaneateles | 27.2% | 9.0%(+18.2)#23 | 9.6%(+17.6)#818 |
| 24. | Lyon Mountain | 27.1% | 9.0%(+18.1)#24 | 9.6%(+17.5)#823 |
| 25. | North Bay | 27.1% | 9.0%(+18.1)#25 | 9.6%(+17.5)#824 |
| 26. | Springfield Center | 26.2% | 9.0%(+17.2)#26 | 9.6%(+16.6)#893 |
| 27. | Andover | 26.1% | 9.0%(+17.1)#27 | 9.6%(+16.5)#901 |
| 28. | Sagaponack | 26.0% | 9.0%(+17.0)#28 | 9.6%(+16.4)#910 |
| 29. | Old Forge | 25.4% | 9.0%(+16.4)#29 | 9.6%(+15.8)#964 |
| 30. | Redford | 25.3% | 9.0%(+16.3)#30 | 9.6%(+15.7)#971 |
| 31. | Kerhonkson | 25.1% | 9.0%(+16.1)#31 | 9.6%(+15.6)#983 |
| 32. | Richburg | 25.1% | 9.0%(+16.1)#32 | 9.6%(+15.5)#986 |
| 33. | Lattingtown | 24.4% | 9.0%(+15.4)#33 | 9.6%(+14.8)#1,072 |
| 34. | Weston Mills | 24.1% | 9.0%(+15.1)#34 | 9.6%(+14.5)#1,105 |
| 35. | La Fargeville | 23.8% | 9.0%(+14.8)#35 | 9.6%(+14.2)#1,128 |
| 36. | Brasher Falls | 23.8% | 9.0%(+14.8)#36 | 9.6%(+14.2)#1,131 |
| 37. | Plattsburgh West | 23.6% | 9.0%(+14.6)#37 | 9.6%(+14.1)#1,144 |
| 38. | Glen Park | 23.5% | 9.0%(+14.4)#38 | 9.6%(+13.9)#1,166 |
| 39. | Roscoe | 23.3% | 9.0%(+14.2)#39 | 9.6%(+13.7)#1,190 |
| 40. | Sand Ridge | 23.0% | 9.0%(+14.0)#40 | 9.6%(+13.4)#1,224 |
| 41. | Harriman | 22.9% | 9.0%(+13.9)#41 | 9.6%(+13.3)#1,237 |
| 42. | Bloomingburg | 22.9% | 9.0%(+13.9)#42 | 9.6%(+13.3)#1,248 |
| 43. | Plandome Manor | 22.6% | 9.0%(+13.6)#43 | 9.6%(+13.0)#1,296 |
| 44. | Fillmore | 22.4% | 9.0%(+13.4)#44 | 9.6%(+12.8)#1,329 |
| 45. | West Nyack | 22.3% | 9.0%(+13.3)#45 | 9.6%(+12.7)#1,337 |
| 46. | Atlantic Beach | 22.3% | 9.0%(+13.2)#46 | 9.6%(+12.7)#1,343 |
| 47. | Jamesport | 22.3% | 9.0%(+13.2)#47 | 9.6%(+12.7)#1,344 |
| 48. | Champlain | 21.9% | 9.0%(+12.8)#48 | 9.6%(+12.3)#1,410 |
| 49. | Tribes Hill | 21.8% | 9.0%(+12.8)#49 | 9.6%(+12.2)#1,426 |
| 50. | Shorehaven | 21.7% | 9.0%(+12.6)#50 | 9.6%(+12.1)#1,450 |
| 51. | Roslyn Estates | 21.4% | 9.0%(+12.4)#51 | 9.6%(+11.8)#1,487 |
| 52. | Fort Drum | 21.3% | 9.0%(+12.3)#52 | 9.6%(+11.7)#1,514 |
| 53. | Ripley | 21.1% | 9.0%(+12.1)#53 | 9.6%(+11.5)#1,546 |
| 54. | Shortsville | 21.1% | 9.0%(+12.1)#54 | 9.6%(+11.5)#1,553 |
| 55. | Ellicottville | 21.1% | 9.0%(+12.0)#55 | 9.6%(+11.5)#1,565 |
| 56. | Cold Spring | 20.9% | 9.0%(+11.9)#56 | 9.6%(+11.3)#1,590 |
| 57. | Northwest Harbor | 20.8% | 9.0%(+11.8)#57 | 9.6%(+11.2)#1,615 |
| 58. | Mariaville Lake | 20.7% | 9.0%(+11.7)#58 | 9.6%(+11.1)#1,631 |
| 59. | Cragsmoor | 20.7% | 9.0%(+11.7)#59 | 9.6%(+11.1)#1,635 |
| 60. | Kings Point | 20.6% | 9.0%(+11.5)#60 | 9.6%(+11.0)#1,663 |
| 61. | Coopers Plains | 20.0% | 9.0%(+11.0)#61 | 9.6%(+10.4)#1,770 |
| 62. | Retsof | 19.9% | 9.0%(+10.9)#62 | 9.6%(+10.3)#1,819 |
| 63. | Clarence Center | 19.9% | 9.0%(+10.8)#63 | 9.6%(+10.3)#1,826 |
| 64. | West Bay Shore | 19.8% | 9.0%(+10.8)#64 | 9.6%(+10.2)#1,836 |
| 65. | Chester | 19.7% | 9.0%(+10.7)#65 | 9.6%(+10.1)#1,849 |
| 66. | Henderson | 19.7% | 9.0%(+10.7)#66 | 9.6%(+10.1)#1,859 |
| 67. | Water Mill | 19.6% | 9.0%(+10.6)#67 | 9.6%(+10.0)#1,877 |
| 68. | Greenville Cdp Greene County | 19.6% | 9.0%(+10.6)#68 | 9.6%(+10.00)#1,887 |
| 69. | Westhampton | 19.5% | 9.0%(+10.5)#69 | 9.6%(+9.88)#1,919 |
| 70. | Chestertown | 19.4% | 9.0%(+10.4)#70 | 9.6%(+9.85)#1,925 |
| 71. | Erin | 19.4% | 9.0%(+10.4)#71 | 9.6%(+9.82)#1,936 |
| 72. | Point Lookout | 19.3% | 9.0%(+10.3)#72 | 9.6%(+9.74)#1,962 |
| 73. | Tully | 19.3% | 9.0%(+10.3)#73 | 9.6%(+9.72)#1,968 |
| 74. | Celoron | 19.3% | 9.0%(+10.3)#74 | 9.6%(+9.70)#1,976 |
| 75. | Newfield | 19.3% | 9.0%(+10.2)#75 | 9.6%(+9.66)#1,984 |
| 76. | Altmar | 19.2% | 9.0%(+10.2)#76 | 9.6%(+9.64)#1,995 |
| 77. | Manhasset | 19.1% | 9.0%(+10.1)#77 | 9.6%(+9.48)#2,035 |
| 78. | Verplanck | 18.9% | 9.0%(+9.92)#78 | 9.6%(+9.35)#2,077 |
| 79. | Head Of The Harbor | 18.8% | 9.0%(+9.82)#79 | 9.6%(+9.25)#2,108 |
| 80. | Bloomville | 18.8% | 9.0%(+9.73)#80 | 9.6%(+9.15)#2,132 |
| 81. | Hankins | 18.8% | 9.0%(+9.73)#81 | 9.6%(+9.15)#2,137 |
| 82. | Holland | 18.6% | 9.0%(+9.59)#82 | 9.6%(+9.02)#2,177 |
| 83. | Depauville | 18.5% | 9.0%(+9.52)#83 | 9.6%(+8.95)#2,205 |
| 84. | Garrattsville | 18.5% | 9.0%(+9.49)#84 | 9.6%(+8.92)#2,213 |
| 85. | North Hills | 18.5% | 9.0%(+9.46)#85 | 9.6%(+8.89)#2,223 |
| 86. | North Haven | 18.3% | 9.0%(+9.28)#86 | 9.6%(+8.71)#2,261 |
| 87. | Brooktondale | 18.2% | 9.0%(+9.19)#87 | 9.6%(+8.62)#2,287 |
| 88. | Dresden | 18.2% | 9.0%(+9.16)#88 | 9.6%(+8.59)#2,296 |
| 89. | University At Buffalo | 18.0% | 9.0%(+8.96)#89 | 9.6%(+8.39)#2,356 |
| 90. | Salt Point | 17.9% | 9.0%(+8.89)#90 | 9.6%(+8.32)#2,383 |
| 91. | Tioga Terrace | 17.9% | 9.0%(+8.87)#91 | 9.6%(+8.30)#2,385 |
| 92. | Mattituck | 17.8% | 9.0%(+8.81)#92 | 9.6%(+8.24)#2,408 |
| 93. | Roslyn | 17.8% | 9.0%(+8.77)#93 | 9.6%(+8.20)#2,417 |
| 94. | Wingdale | 17.8% | 9.0%(+8.74)#94 | 9.6%(+8.17)#2,430 |
| 95. | Aquebogue | 17.7% | 9.0%(+8.71)#95 | 9.6%(+8.14)#2,436 |
| 96. | Niagara University | 17.6% | 9.0%(+8.59)#96 | 9.6%(+8.02)#2,470 |
| 97. | Ruby | 17.6% | 9.0%(+8.59)#97 | 9.6%(+8.02)#2,471 |
| 98. | Smyrna | 17.5% | 9.0%(+8.48)#98 | 9.6%(+7.90)#2,508 |
| 99. | Roslyn Heights | 17.5% | 9.0%(+8.44)#99 | 9.6%(+7.87)#2,519 |
| 100. | Paul Smiths | 17.5% | 9.0%(+8.43)#100 | 9.6%(+7.86)#2,526 |
Common Questions
What are the Top 10 Cities with the Highest Percentage of Population Employed in Sales & Related in New York?
Top 10 Cities with the Highest Percentage of Population Employed in Sales & Related in New York are:
#1
100.0%
#2
100.0%
#3
44.1%
#4
41.6%
#5
33.3%
#6
33.3%
#7
32.0%
#8
31.9%
#9
31.6%
#10
30.6%
What city has the Highest Percentage of Population Employed in Sales & Related in New York?
Parc has the Highest Percentage of Population Employed in Sales & Related in New York with 100.0%.
What is the Percentage of Population Employed in Sales & Related in the State of New York?
Percentage of Population Employed in Sales & Related in New York is 9.0%.
What is the Percentage of Population Employed in Sales & Related in the United States?
Percentage of Population Employed in Sales & Related in the United States is 9.6%.