Andover, NY Map & Demographics
Andover Map
Andover Overview
$34,704
PER CAPITA INCOME
$72,750
AVG FAMILY INCOME
$61,172
AVG HOUSEHOLD INCOME
32.4%
WAGE / INCOME GAP [ % ]
67.6¢/ $1
WAGE / INCOME GAP [ $ ]
0.45
INEQUALITY / GINI INDEX
1,018
TOTAL POPULATION
537
MALE POPULATION
481
FEMALE POPULATION
111.64
MALES / 100 FEMALES
89.57
FEMALES / 100 MALES
41.9
MEDIAN AGE
3.3
AVG FAMILY SIZE
2.8
AVG HOUSEHOLD SIZE
521
LABOR FORCE [ PEOPLE ]
62.5%
PERCENT IN LABOR FORCE
10.0%
UNEMPLOYMENT RATE
Andover Zip Codes
Andover Area Codes
Income in Andover
Income Overview in Andover
Per Capita Income in Andover is $34,704, while median incomes of families and households are $72,750 and $61,172 respectively.
| Characteristic | Number | Measure |
| Per Capita Income | 1,018 | $34,704 |
| Median Family Income | 250 | $72,750 |
| Mean Family Income | 250 | $100,204 |
| Median Household Income | 359 | $61,172 |
| Mean Household Income | 359 | $89,811 |
| Income Deficit | 250 | $0 |
| Wage / Income Gap (%) | 1,018 | 32.41% |
| Wage / Income Gap ($) | 1,018 | 67.59¢ per $1 |
| Gini / Inequality Index | 1,018 | 0.45 |
Earnings by Sex in Andover
Average Earnings in Andover are $30,833, $35,962 for men and $24,306 for women, a difference of 32.4%.
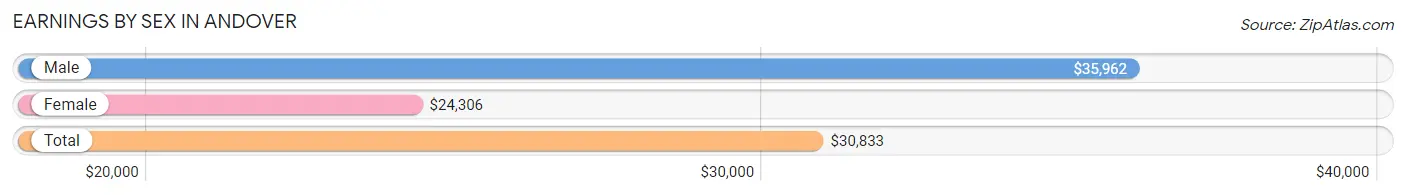
| Sex | Number | Average Earnings |
| Male | 328 (60.7%) | $35,962 |
| Female | 212 (39.3%) | $24,306 |
| Total | 540 (100.0%) | $30,833 |
Earnings by Sex by Income Bracket in Andover
The most common earnings brackets in Andover are $100,000+ for men (76 | 23.2%) and $5,000 to $7,499 for women (38 | 17.9%).
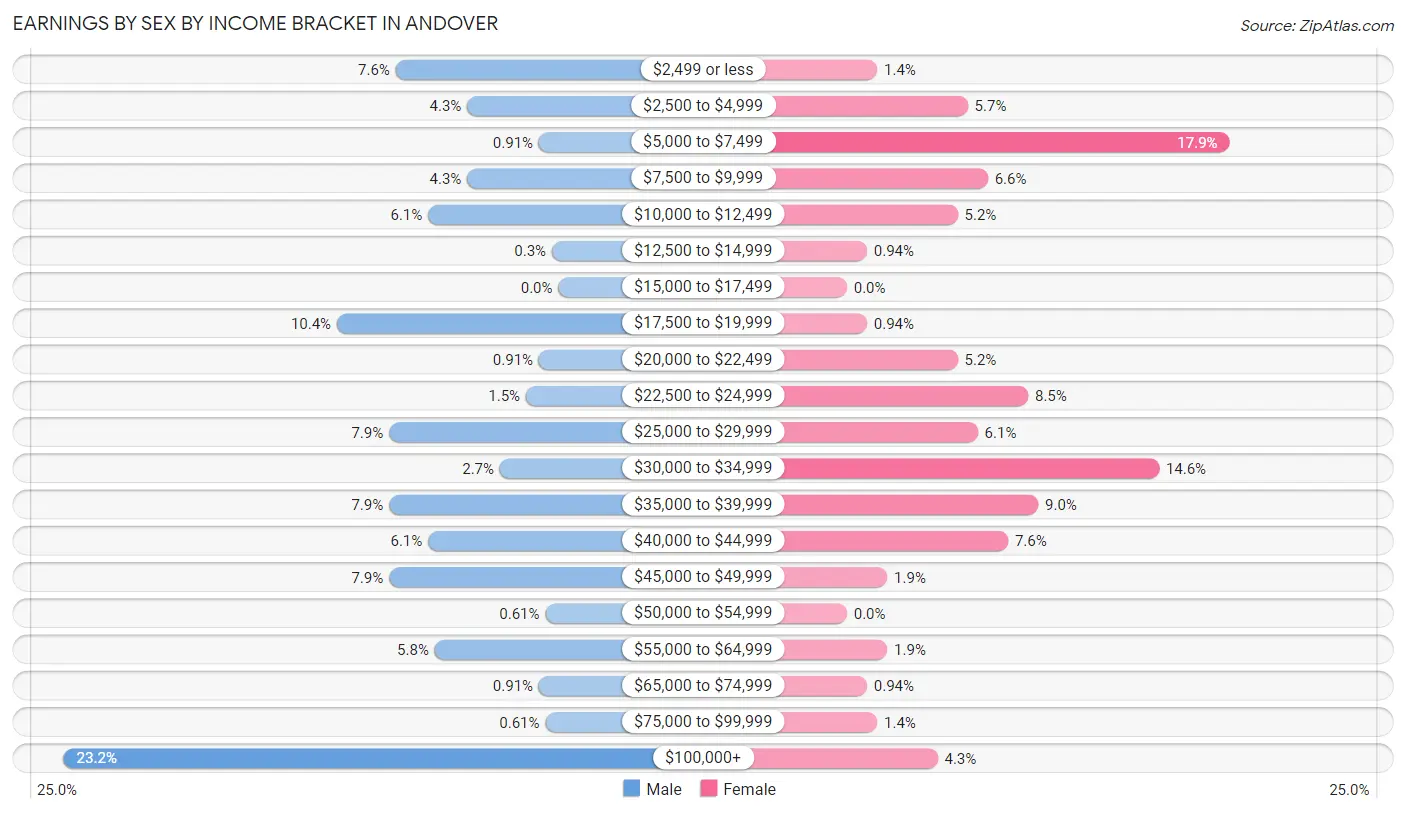
| Income | Male | Female |
| $2,499 or less | 25 (7.6%) | 3 (1.4%) |
| $2,500 to $4,999 | 14 (4.3%) | 12 (5.7%) |
| $5,000 to $7,499 | 3 (0.9%) | 38 (17.9%) |
| $7,500 to $9,999 | 14 (4.3%) | 14 (6.6%) |
| $10,000 to $12,499 | 20 (6.1%) | 11 (5.2%) |
| $12,500 to $14,999 | 1 (0.3%) | 2 (0.9%) |
| $15,000 to $17,499 | 0 (0.0%) | 0 (0.0%) |
| $17,500 to $19,999 | 34 (10.4%) | 2 (0.9%) |
| $20,000 to $22,499 | 3 (0.9%) | 11 (5.2%) |
| $22,500 to $24,999 | 5 (1.5%) | 18 (8.5%) |
| $25,000 to $29,999 | 26 (7.9%) | 13 (6.1%) |
| $30,000 to $34,999 | 9 (2.7%) | 31 (14.6%) |
| $35,000 to $39,999 | 26 (7.9%) | 19 (9.0%) |
| $40,000 to $44,999 | 20 (6.1%) | 16 (7.5%) |
| $45,000 to $49,999 | 26 (7.9%) | 4 (1.9%) |
| $50,000 to $54,999 | 2 (0.6%) | 0 (0.0%) |
| $55,000 to $64,999 | 19 (5.8%) | 4 (1.9%) |
| $65,000 to $74,999 | 3 (0.9%) | 2 (0.9%) |
| $75,000 to $99,999 | 2 (0.6%) | 3 (1.4%) |
| $100,000+ | 76 (23.2%) | 9 (4.3%) |
| Total | 328 (100.0%) | 212 (100.0%) |
Earnings by Sex by Educational Attainment in Andover
Average earnings in Andover are $36,806 for men and $26,875 for women, a difference of 27.0%. Men with an educational attainment of bachelor's degree enjoy the highest average annual earnings of $142,712, while those with high school diploma education earn the least with $28,365. Women with an educational attainment of college or associate's degree earn the most with the average annual earnings of $33,542, while those with high school diploma education have the smallest earnings of $24,500.
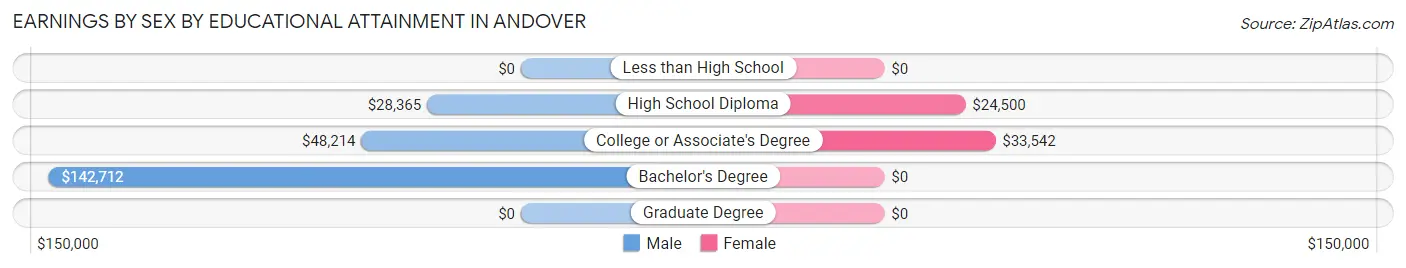
| Educational Attainment | Male Income | Female Income |
| Less than High School | - | - |
| High School Diploma | $28,365 | $24,500 |
| College or Associate's Degree | $48,214 | $33,542 |
| Bachelor's Degree | $142,712 | $0 |
| Graduate Degree | - | - |
| Total | $36,806 | $26,875 |
Family Income in Andover
Family Income Brackets in Andover
According to the Andover family income data, there are 52 families falling into the $50,000 to $74,999 income range, which is the most common income bracket and makes up 20.8% of all families. Conversely, the $10,000 to $14,999 income bracket is the least frequent group with only 4 families (1.6%) belonging to this category.
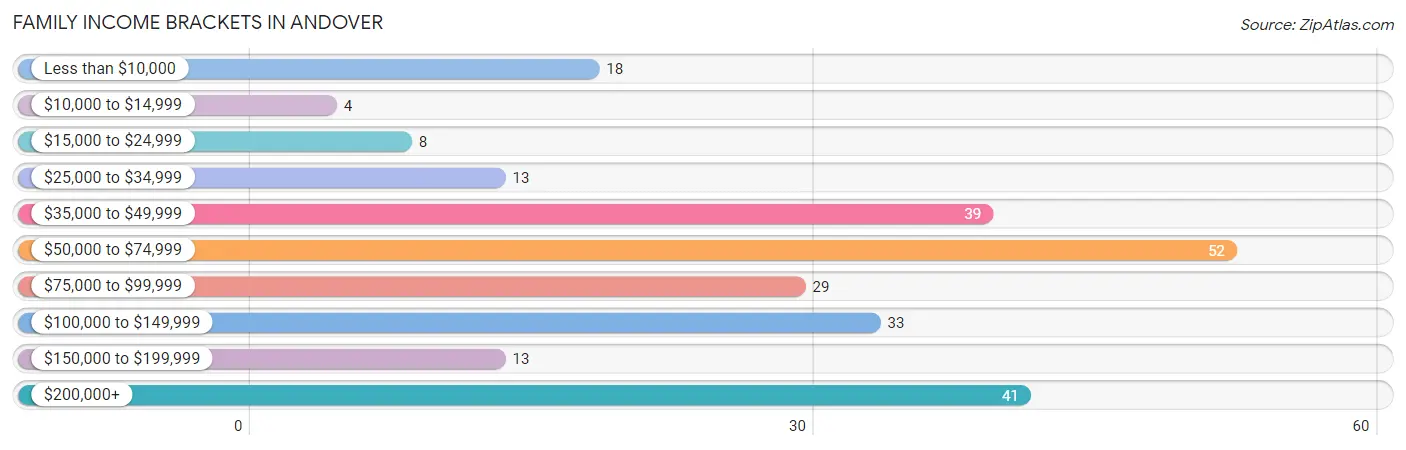
| Income Bracket | # Families | % Families |
| Less than $10,000 | 18 | 7.2% |
| $10,000 to $14,999 | 4 | 1.6% |
| $15,000 to $24,999 | 8 | 3.2% |
| $25,000 to $34,999 | 13 | 5.2% |
| $35,000 to $49,999 | 39 | 15.6% |
| $50,000 to $74,999 | 52 | 20.8% |
| $75,000 to $99,999 | 29 | 11.6% |
| $100,000 to $149,999 | 33 | 13.2% |
| $150,000 to $199,999 | 13 | 5.2% |
| $200,000+ | 41 | 16.4% |
Family Income by Famaliy Size in Andover
4-person families (35 | 14.0%) account for the highest median family income in Andover with $117,813 per family, while 2-person families (95 | 38.0%) have the highest median income of $36,875 per family member.
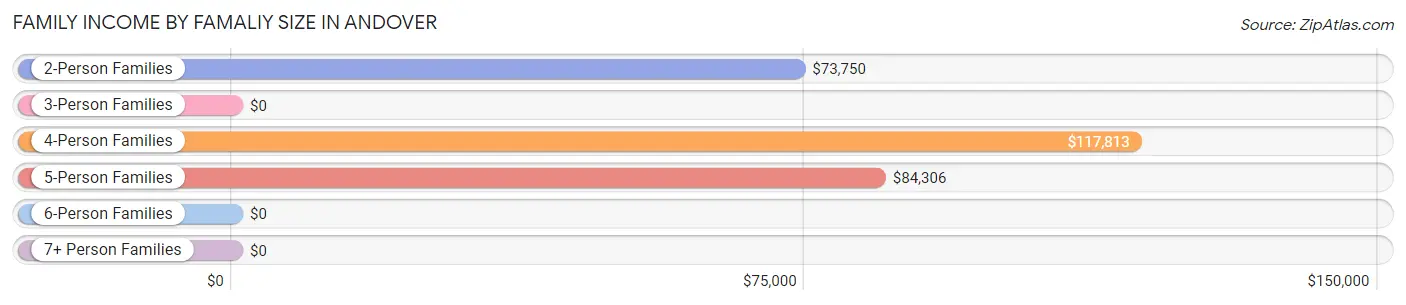
| Income Bracket | # Families | Median Income |
| 2-Person Families | 95 (38.0%) | $73,750 |
| 3-Person Families | 100 (40.0%) | $0 |
| 4-Person Families | 35 (14.0%) | $117,813 |
| 5-Person Families | 17 (6.8%) | $84,306 |
| 6-Person Families | 3 (1.2%) | $0 |
| 7+ Person Families | 0 (0.0%) | $0 |
| Total | 250 (100.0%) | $72,750 |
Family Income by Number of Earners in Andover
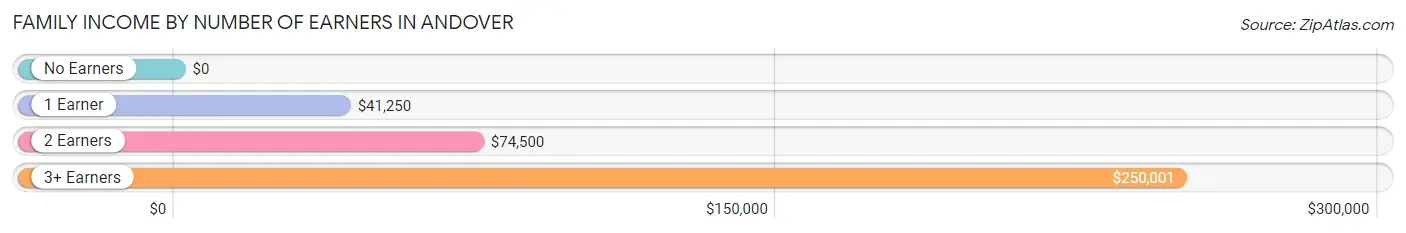
| Number of Earners | # Families | Median Income |
| No Earners | 49 (19.6%) | $0 |
| 1 Earner | 67 (26.8%) | $41,250 |
| 2 Earners | 78 (31.2%) | $74,500 |
| 3+ Earners | 56 (22.4%) | $250,001 |
| Total | 250 (100.0%) | $72,750 |
Household Income in Andover
Household Income Brackets in Andover
With 69 households falling in the category, the $50,000 to $74,999 income range is the most frequent in Andover, accounting for 19.2% of all households. In contrast, only 6 households (1.7%) fall into the $10,000 to $14,999 income bracket, making it the least populous group.
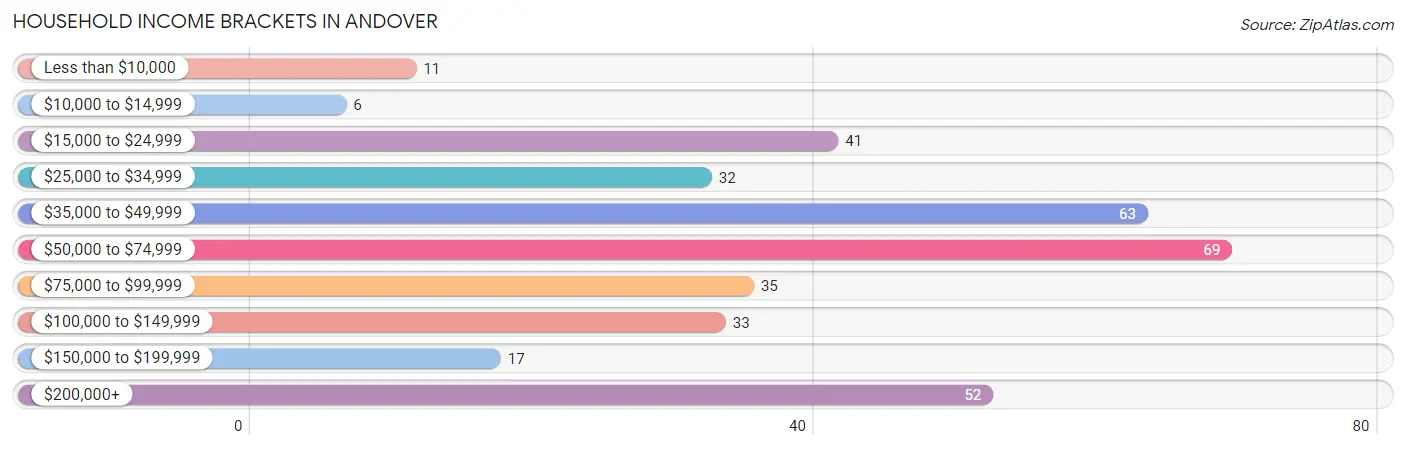
| Income Bracket | # Households | % Households |
| Less than $10,000 | 11 | 3.1% |
| $10,000 to $14,999 | 6 | 1.7% |
| $15,000 to $24,999 | 41 | 11.4% |
| $25,000 to $34,999 | 32 | 8.9% |
| $35,000 to $49,999 | 63 | 17.5% |
| $50,000 to $74,999 | 69 | 19.2% |
| $75,000 to $99,999 | 35 | 9.7% |
| $100,000 to $149,999 | 33 | 9.2% |
| $150,000 to $199,999 | 17 | 4.7% |
| $200,000+ | 52 | 14.5% |
Household Income by Householder Age in Andover
The median household income in Andover is $61,172, with the highest median household income of $71,250 found in the 45 to 64 years age bracket for the primary householder. A total of 202 households (56.3%) fall into this category. Meanwhile, the 15 to 24 years age bracket for the primary householder has the lowest median household income of $0, with 3 households (0.8%) in this group.
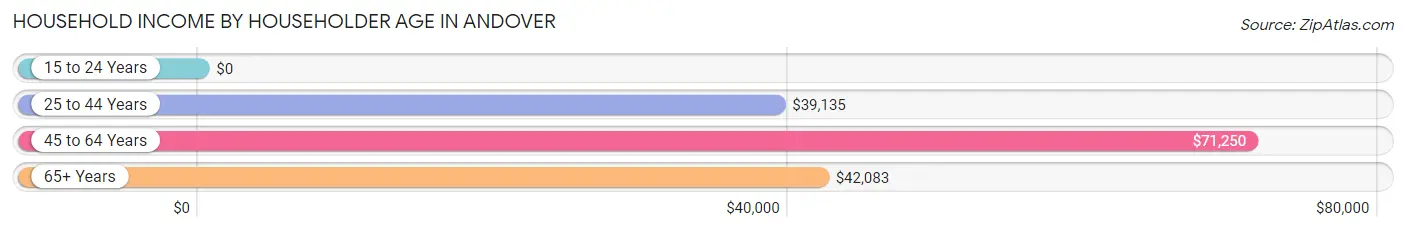
| Income Bracket | # Households | Median Income |
| 15 to 24 Years | 3 (0.8%) | $0 |
| 25 to 44 Years | 65 (18.1%) | $39,135 |
| 45 to 64 Years | 202 (56.3%) | $71,250 |
| 65+ Years | 89 (24.8%) | $42,083 |
| Total | 359 (100.0%) | $61,172 |
Poverty in Andover
Income Below Poverty by Sex and Age in Andover
With 16.8% poverty level for males and 13.5% for females among the residents of Andover, 15 year old males and 12 to 14 year old females are the most vulnerable to poverty, with 5 males (100.0%) and 9 females (28.1%) in their respective age groups living below the poverty level.
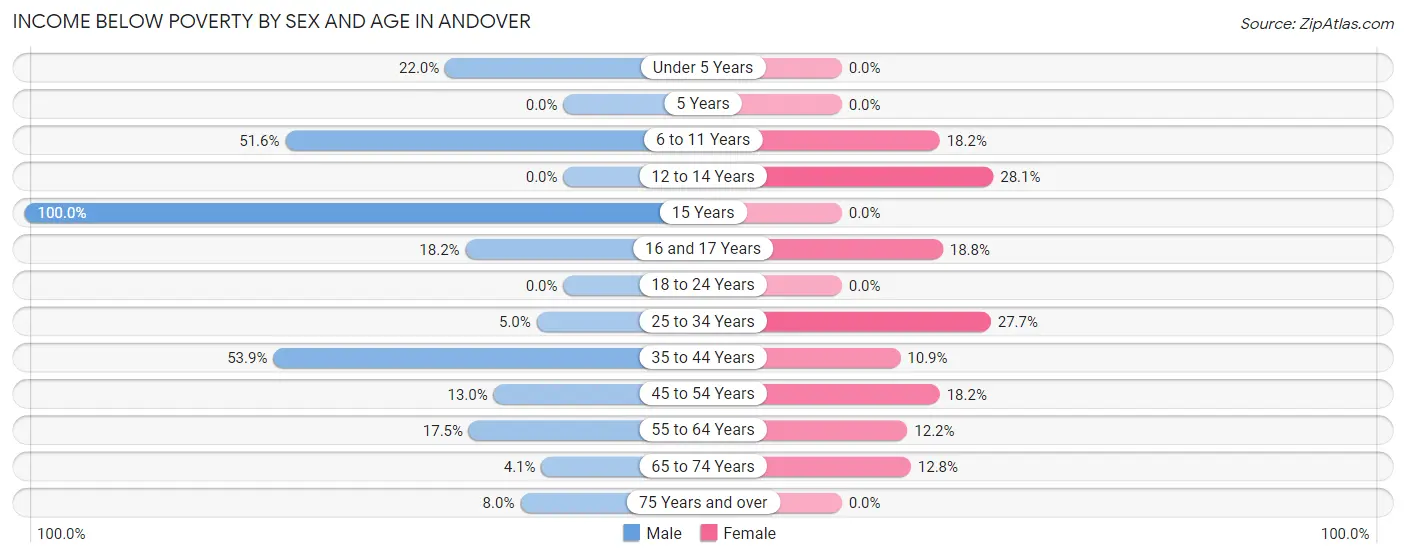
| Age Bracket | Male | Female |
| Under 5 Years | 9 (22.0%) | 0 (0.0%) |
| 5 Years | 0 (0.0%) | 0 (0.0%) |
| 6 to 11 Years | 16 (51.6%) | 10 (18.2%) |
| 12 to 14 Years | 0 (0.0%) | 9 (28.1%) |
| 15 Years | 5 (100.0%) | 0 (0.0%) |
| 16 and 17 Years | 2 (18.2%) | 3 (18.8%) |
| 18 to 24 Years | 0 (0.0%) | 0 (0.0%) |
| 25 to 34 Years | 6 (5.0%) | 13 (27.7%) |
| 35 to 44 Years | 21 (53.8%) | 5 (10.9%) |
| 45 to 54 Years | 7 (13.0%) | 6 (18.2%) |
| 55 to 64 Years | 20 (17.5%) | 14 (12.2%) |
| 65 to 74 Years | 2 (4.1%) | 5 (12.8%) |
| 75 Years and over | 2 (8.0%) | 0 (0.0%) |
| Total | 90 (16.8%) | 65 (13.5%) |
Income Above Poverty by Sex and Age in Andover
According to the poverty statistics in Andover, males aged 12 to 14 years and females aged under 5 years are the age groups that are most secure financially, with 100.0% of males and 100.0% of females in these age groups living above the poverty line.
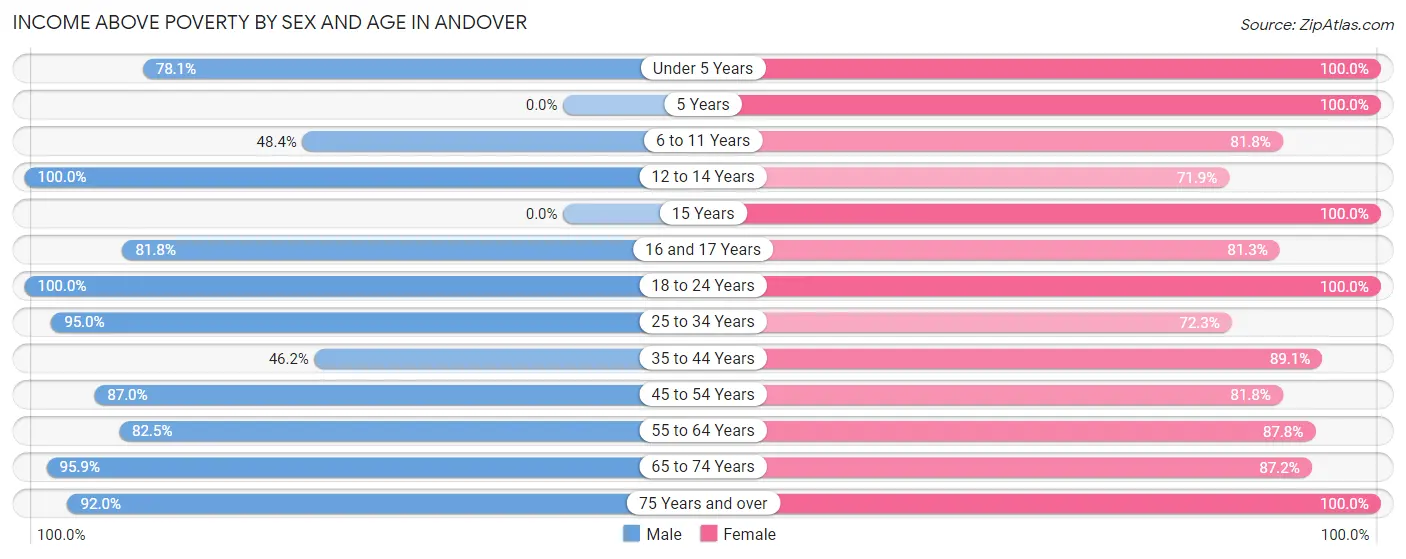
| Age Bracket | Male | Female |
| Under 5 Years | 32 (78.0%) | 6 (100.0%) |
| 5 Years | 0 (0.0%) | 2 (100.0%) |
| 6 to 11 Years | 15 (48.4%) | 45 (81.8%) |
| 12 to 14 Years | 9 (100.0%) | 23 (71.9%) |
| 15 Years | 0 (0.0%) | 3 (100.0%) |
| 16 and 17 Years | 9 (81.8%) | 13 (81.2%) |
| 18 to 24 Years | 38 (100.0%) | 16 (100.0%) |
| 25 to 34 Years | 115 (95.0%) | 34 (72.3%) |
| 35 to 44 Years | 18 (46.2%) | 41 (89.1%) |
| 45 to 54 Years | 47 (87.0%) | 27 (81.8%) |
| 55 to 64 Years | 94 (82.5%) | 101 (87.8%) |
| 65 to 74 Years | 47 (95.9%) | 34 (87.2%) |
| 75 Years and over | 23 (92.0%) | 71 (100.0%) |
| Total | 447 (83.2%) | 416 (86.5%) |
Income Below Poverty Among Married-Couple Families in Andover
The poverty statistics for married-couple families in Andover show that 3.3% or 6 of the total 180 families live below the poverty line. Families with 3 or 4 children have the highest poverty rate of 37.5%, comprising of 3 families. On the other hand, families with 1 or 2 children have the lowest poverty rate of 0.0%, which includes 0 families.
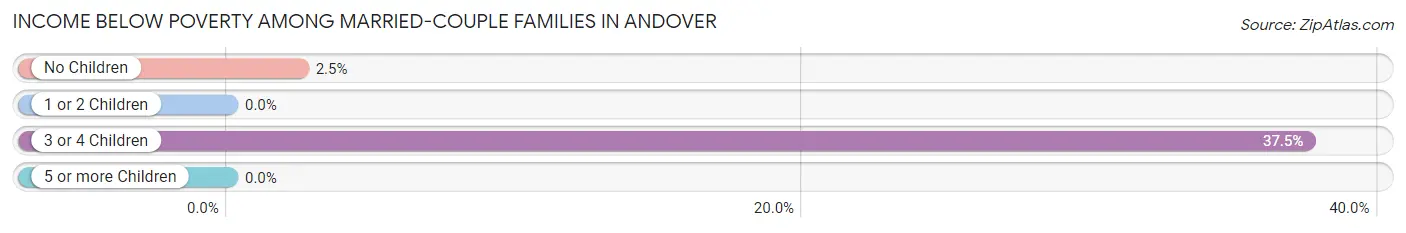
| Children | Above Poverty | Below Poverty |
| No Children | 119 (97.5%) | 3 (2.5%) |
| 1 or 2 Children | 50 (100.0%) | 0 (0.0%) |
| 3 or 4 Children | 5 (62.5%) | 3 (37.5%) |
| 5 or more Children | 0 (0.0%) | 0 (0.0%) |
| Total | 174 (96.7%) | 6 (3.3%) |
Income Below Poverty Among Single-Parent Households in Andover
According to the poverty data in Andover, 41.2% or 7 single-father households and 32.1% or 17 single-mother households are living below the poverty line. Among single-father households, those with 1 or 2 children have the highest poverty rate, with 3 households (50.0%) experiencing poverty. Likewise, among single-mother households, those with 3 or 4 children have the highest poverty rate, with 2 households (100.0%) falling below the poverty line.
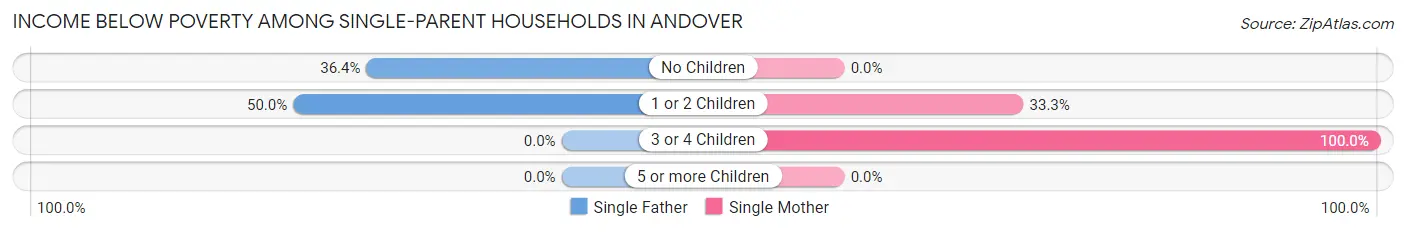
| Children | Single Father | Single Mother |
| No Children | 4 (36.4%) | 0 (0.0%) |
| 1 or 2 Children | 3 (50.0%) | 15 (33.3%) |
| 3 or 4 Children | 0 (0.0%) | 2 (100.0%) |
| 5 or more Children | 0 (0.0%) | 0 (0.0%) |
| Total | 7 (41.2%) | 17 (32.1%) |
Income Below Poverty Among Married-Couple vs Single-Parent Households in Andover
The poverty data for Andover shows that 6 of the married-couple family households (3.3%) and 24 of the single-parent households (34.3%) are living below the poverty level. Within the married-couple family households, those with 3 or 4 children have the highest poverty rate, with 3 households (37.5%) falling below the poverty line. Among the single-parent households, those with 3 or 4 children have the highest poverty rate, with 2 household (100.0%) living below poverty.
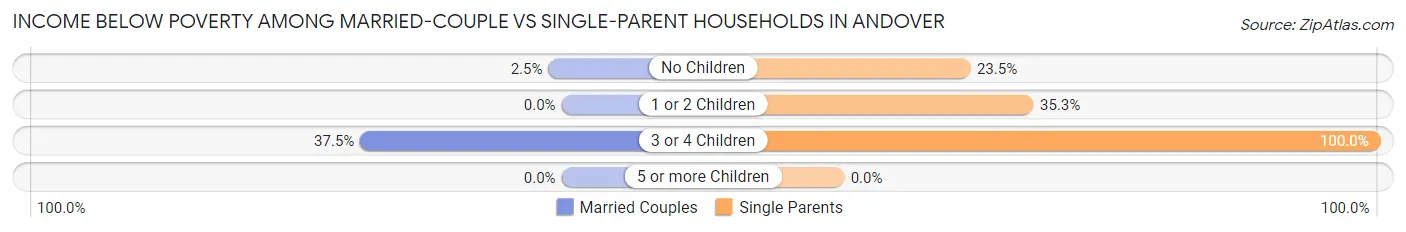
| Children | Married-Couple Families | Single-Parent Households |
| No Children | 3 (2.5%) | 4 (23.5%) |
| 1 or 2 Children | 0 (0.0%) | 18 (35.3%) |
| 3 or 4 Children | 3 (37.5%) | 2 (100.0%) |
| 5 or more Children | 0 (0.0%) | 0 (0.0%) |
| Total | 6 (3.3%) | 24 (34.3%) |
Race in Andover
The most populous races in Andover are White / Caucasian (991 | 97.4%), Two or more Races (26 | 2.5%), and Hispanic or Latino (20 | 2.0%).
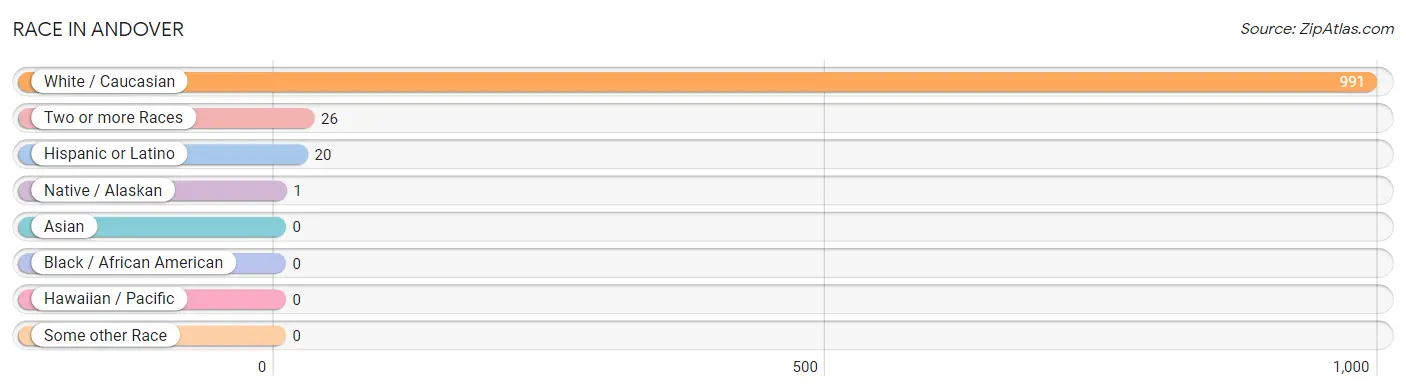
| Race | # Population | % Population |
| Asian | 0 | 0.0% |
| Black / African American | 0 | 0.0% |
| Hawaiian / Pacific | 0 | 0.0% |
| Hispanic or Latino | 20 | 2.0% |
| Native / Alaskan | 1 | 0.1% |
| White / Caucasian | 991 | 97.4% |
| Two or more Races | 26 | 2.5% |
| Some other Race | 0 | 0.0% |
| Total | 1,018 | 100.0% |
Ancestry in Andover
The most populous ancestries reported in Andover are English (268 | 26.3%), German (263 | 25.8%), Irish (156 | 15.3%), Swedish (102 | 10.0%), and American (85 | 8.4%), together accounting for 85.8% of all Andover residents.
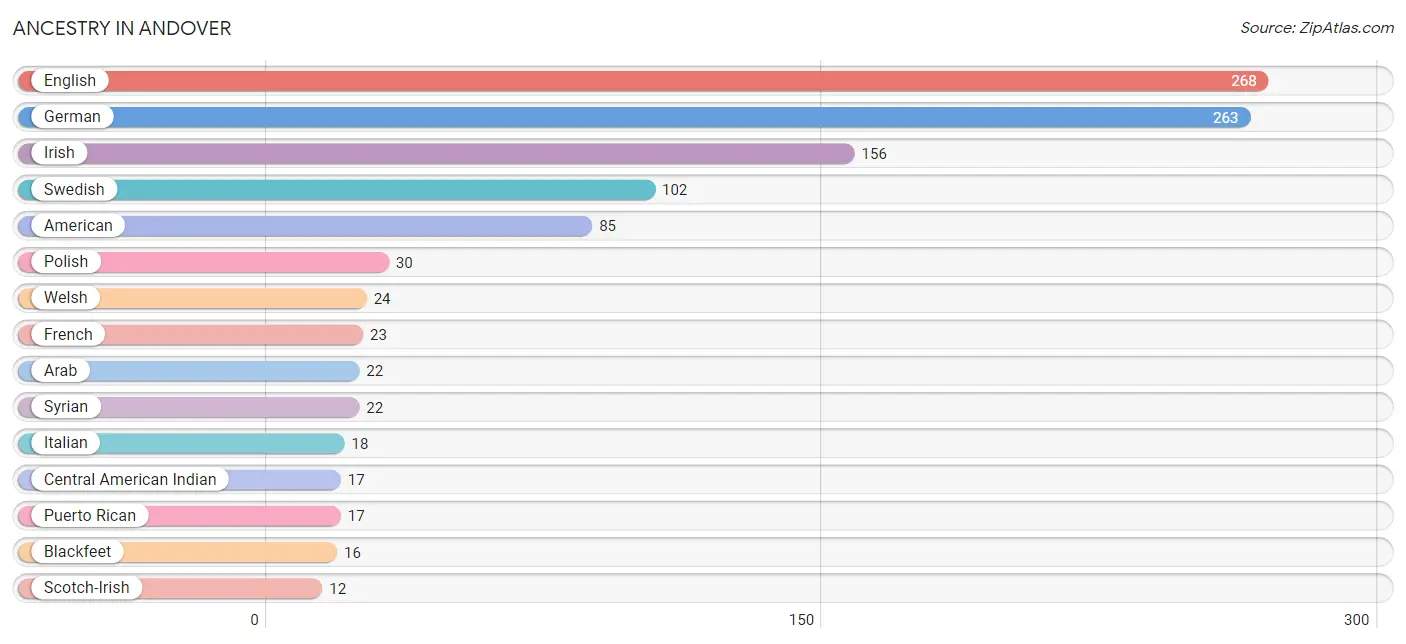
| Ancestry | # Population | % Population |
| American | 85 | 8.4% |
| Arab | 22 | 2.2% |
| Austrian | 2 | 0.2% |
| Blackfeet | 16 | 1.6% |
| British | 8 | 0.8% |
| Canadian | 3 | 0.3% |
| Central American Indian | 17 | 1.7% |
| Cherokee | 1 | 0.1% |
| Dutch | 4 | 0.4% |
| Eastern European | 2 | 0.2% |
| English | 268 | 26.3% |
| European | 8 | 0.8% |
| French | 23 | 2.3% |
| French American Indian | 1 | 0.1% |
| French Canadian | 6 | 0.6% |
| German | 263 | 25.8% |
| Irish | 156 | 15.3% |
| Italian | 18 | 1.8% |
| Mexican | 3 | 0.3% |
| Pennsylvania German | 11 | 1.1% |
| Polish | 30 | 2.9% |
| Puerto Rican | 17 | 1.7% |
| Scotch-Irish | 12 | 1.2% |
| Scottish | 6 | 0.6% |
| Swedish | 102 | 10.0% |
| Syrian | 22 | 2.2% |
| Welsh | 24 | 2.4% | View All 27 Rows |
Immigrants in Andover
The most numerous immigrant groups reported in Andover came from England (2 | 0.2%), Europe (2 | 0.2%), and Northern Europe (2 | 0.2%), together accounting for 0.6% of all Andover residents.
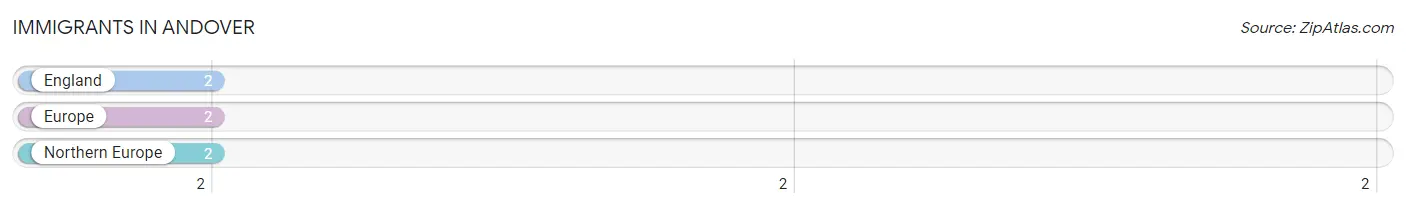
| Immigration Origin | # Population | % Population |
| England | 2 | 0.2% |
| Europe | 2 | 0.2% |
| Northern Europe | 2 | 0.2% | View All 3 Rows |
Sex and Age in Andover
Sex and Age in Andover
The most populous age groups in Andover are 30 to 34 Years (93 | 17.3%) for men and 55 to 59 Years (73 | 15.2%) for women.
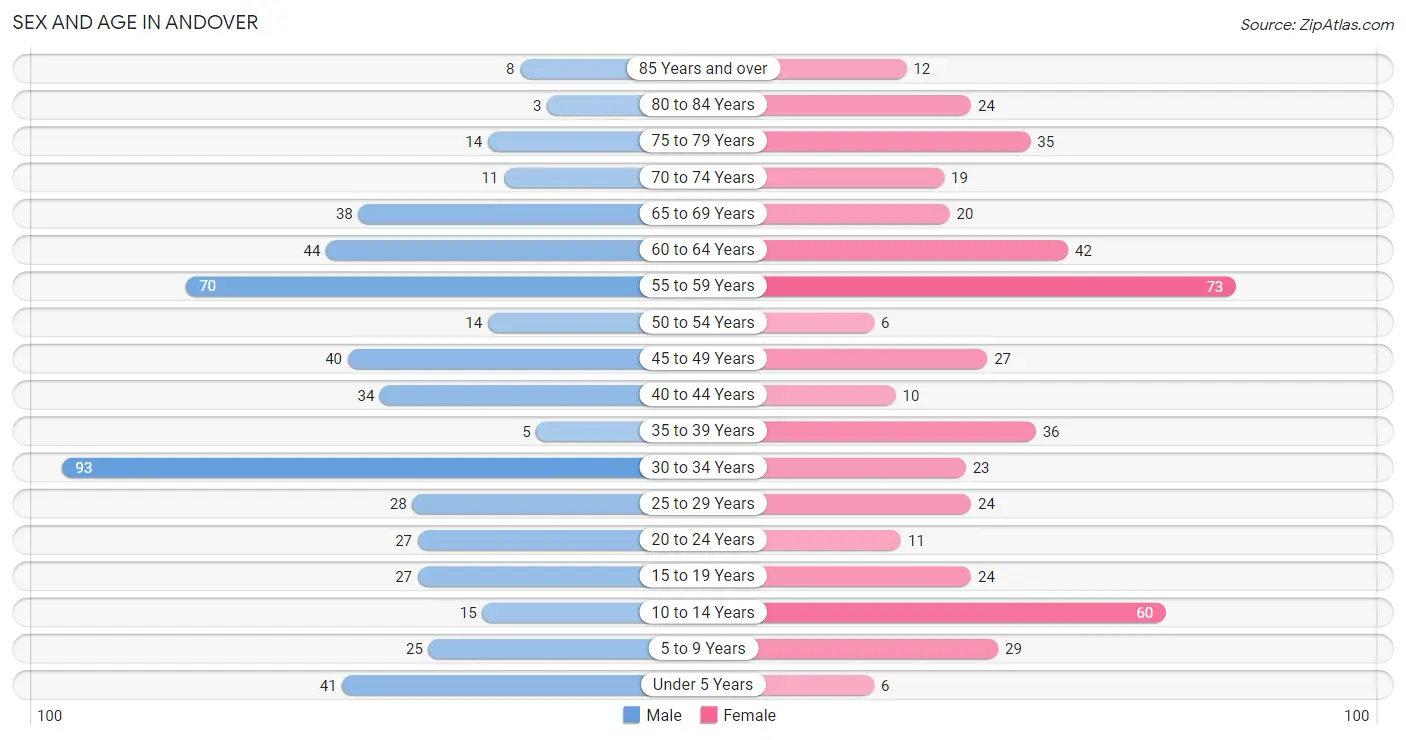
| Age Bracket | Male | Female |
| Under 5 Years | 41 (7.6%) | 6 (1.3%) |
| 5 to 9 Years | 25 (4.7%) | 29 (6.0%) |
| 10 to 14 Years | 15 (2.8%) | 60 (12.5%) |
| 15 to 19 Years | 27 (5.0%) | 24 (5.0%) |
| 20 to 24 Years | 27 (5.0%) | 11 (2.3%) |
| 25 to 29 Years | 28 (5.2%) | 24 (5.0%) |
| 30 to 34 Years | 93 (17.3%) | 23 (4.8%) |
| 35 to 39 Years | 5 (0.9%) | 36 (7.5%) |
| 40 to 44 Years | 34 (6.3%) | 10 (2.1%) |
| 45 to 49 Years | 40 (7.4%) | 27 (5.6%) |
| 50 to 54 Years | 14 (2.6%) | 6 (1.3%) |
| 55 to 59 Years | 70 (13.0%) | 73 (15.2%) |
| 60 to 64 Years | 44 (8.2%) | 42 (8.7%) |
| 65 to 69 Years | 38 (7.1%) | 20 (4.2%) |
| 70 to 74 Years | 11 (2.1%) | 19 (4.0%) |
| 75 to 79 Years | 14 (2.6%) | 35 (7.3%) |
| 80 to 84 Years | 3 (0.6%) | 24 (5.0%) |
| 85 Years and over | 8 (1.5%) | 12 (2.5%) |
| Total | 537 (100.0%) | 481 (100.0%) |
Families and Households in Andover
Median Family Size in Andover
The median family size in Andover is 3.30 persons per family, with single female/mother families (53 | 21.2%) accounting for the largest median family size of 3.68 persons per family. On the other hand, single male/father families (17 | 6.8%) represent the smallest median family size with 2.53 persons per family.
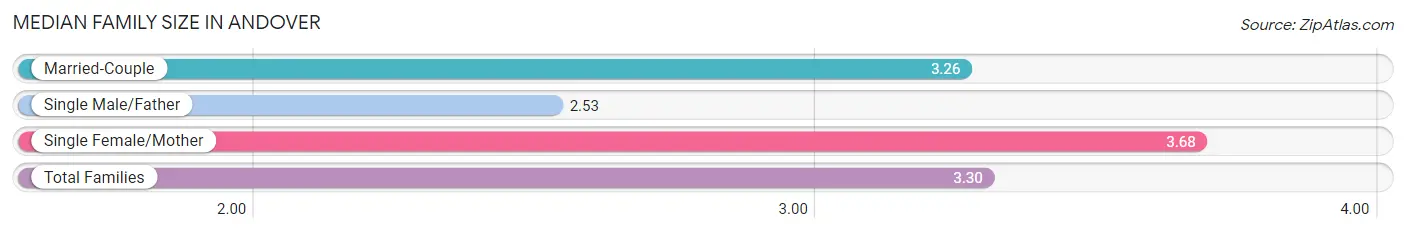
| Family Type | # Families | Family Size |
| Married-Couple | 180 (72.0%) | 3.26 |
| Single Male/Father | 17 (6.8%) | 2.53 |
| Single Female/Mother | 53 (21.2%) | 3.68 |
| Total Families | 250 (100.0%) | 3.30 |
Median Household Size in Andover
The median household size in Andover is 2.84 persons per household, with single female/mother households (53 | 14.8%) accounting for the largest median household size of 3.85 persons per household. non-family households (109 | 30.4%) represent the smallest median household size with 1.69 persons per household.
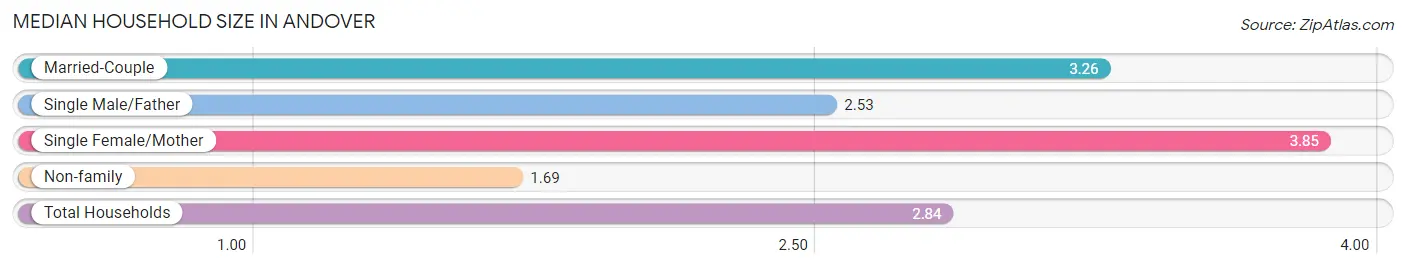
| Household Type | # Households | Household Size |
| Married-Couple | 180 (50.1%) | 3.26 |
| Single Male/Father | 17 (4.7%) | 2.53 |
| Single Female/Mother | 53 (14.8%) | 3.85 |
| Non-family | 109 (30.4%) | 1.69 |
| Total Households | 359 (100.0%) | 2.84 |
Household Size by Marriage Status in Andover
Out of a total of 359 households in Andover, 250 (69.6%) are family households, while 109 (30.4%) are nonfamily households. The most numerous type of family households are 2-person households, comprising 95, and the most common type of nonfamily households are 1-person households, comprising 80.
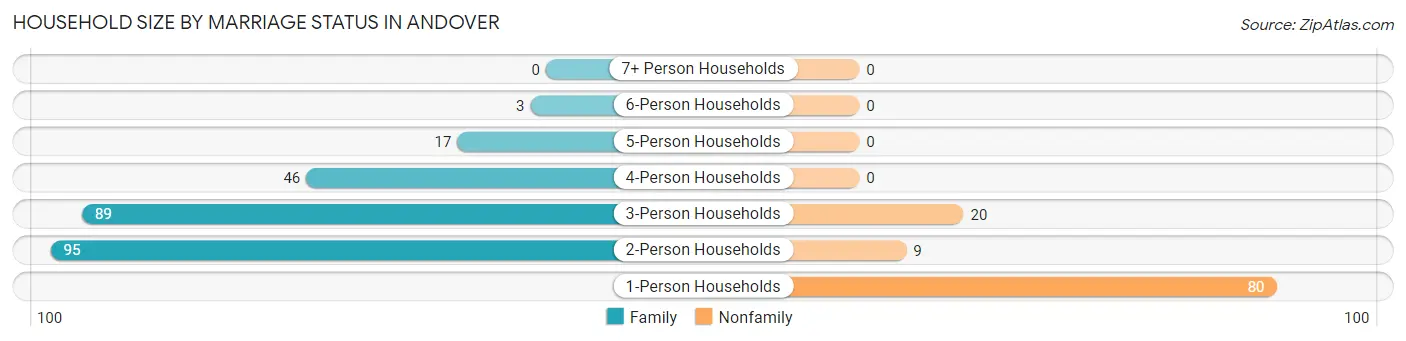
| Household Size | Family Households | Nonfamily Households |
| 1-Person Households | - | 80 (22.3%) |
| 2-Person Households | 95 (26.5%) | 9 (2.5%) |
| 3-Person Households | 89 (24.8%) | 20 (5.6%) |
| 4-Person Households | 46 (12.8%) | 0 (0.0%) |
| 5-Person Households | 17 (4.7%) | 0 (0.0%) |
| 6-Person Households | 3 (0.8%) | 0 (0.0%) |
| 7+ Person Households | 0 (0.0%) | 0 (0.0%) |
| Total | 250 (69.6%) | 109 (30.4%) |
Female Fertility in Andover
Fertility by Age in Andover
Average fertility rate in Andover is 39.0 births per 1,000 women. Women in the age bracket of 20 to 34 years have the highest fertility rate with 103.0 births per 1,000 women. Women in the age bracket of 20 to 34 years acount for 100.0% of all women with births.
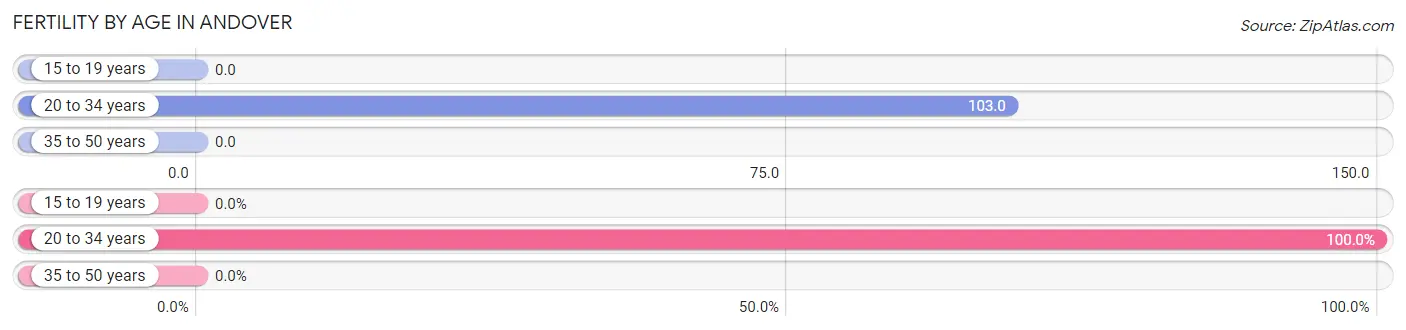
| Age Bracket | Women with Births | Births / 1,000 Women |
| 15 to 19 years | 0 (0.0%) | 0.0 |
| 20 to 34 years | 6 (100.0%) | 103.0 |
| 35 to 50 years | 0 (0.0%) | 0.0 |
| Total | 6 (100.0%) | 39.0 |
Fertility by Age by Marriage Status in Andover
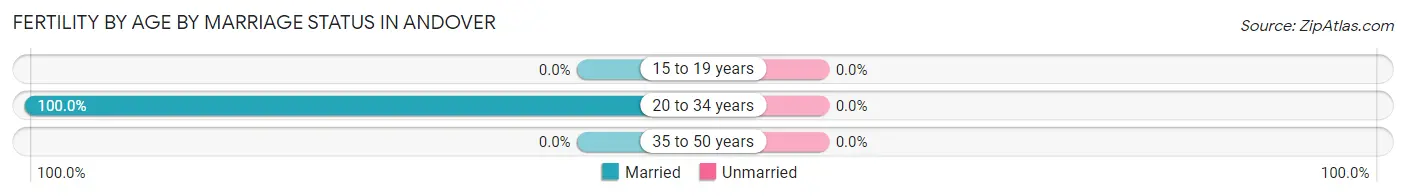
| Age Bracket | Married | Unmarried |
| 15 to 19 years | 0 (0.0%) | 0 (0.0%) |
| 20 to 34 years | 6 (100.0%) | 0 (0.0%) |
| 35 to 50 years | 0 (0.0%) | 0 (0.0%) |
| Total | 6 (100.0%) | 0 (0.0%) |
Fertility by Education in Andover
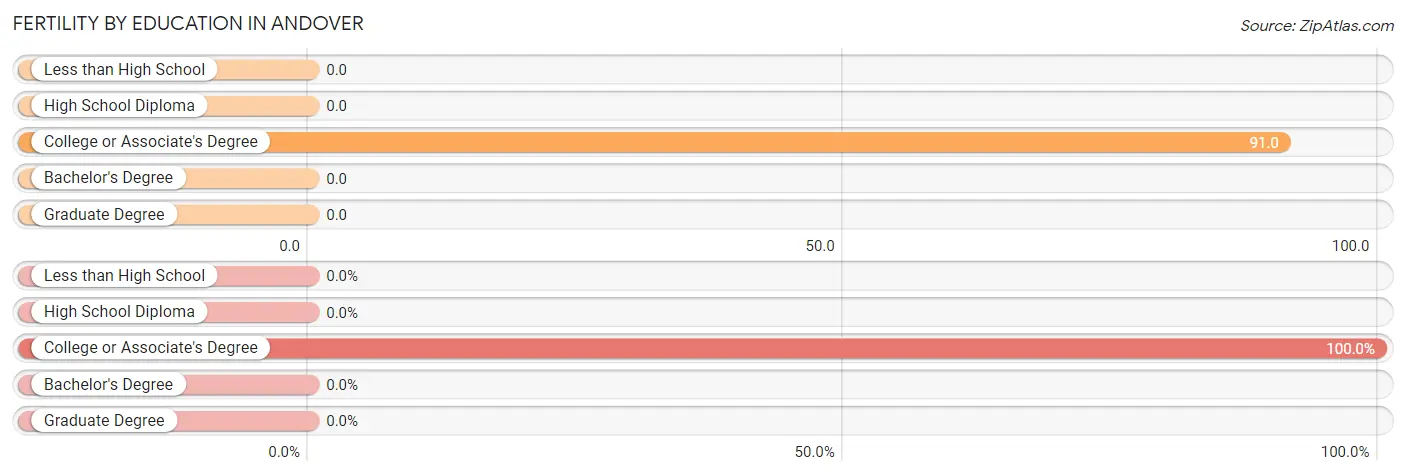
| Educational Attainment | Women with Births | Births / 1,000 Women |
| Less than High School | 0 (0.0%) | 0.0 |
| High School Diploma | 0 (0.0%) | 0.0 |
| College or Associate's Degree | 6 (100.0%) | 91.0 |
| Bachelor's Degree | 0 (0.0%) | 0.0 |
| Graduate Degree | 0 (0.0%) | 0.0 |
| Total | 6 (100.0%) | 39.0 |
Fertility by Education by Marriage Status in Andover
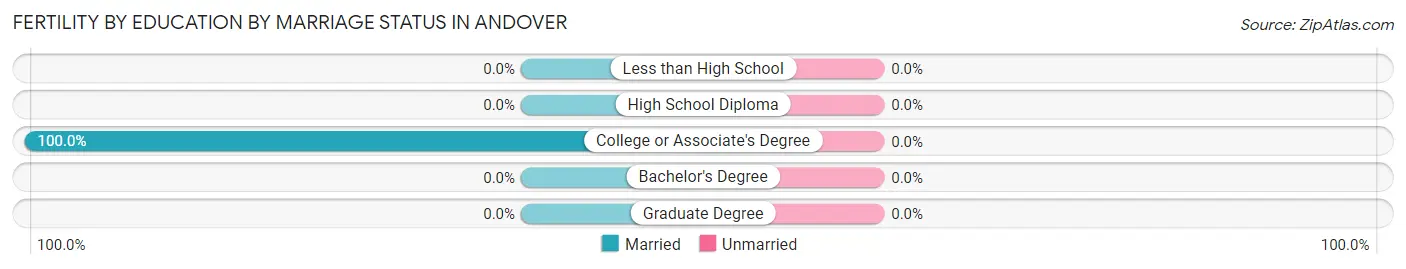
| Educational Attainment | Married | Unmarried |
| Less than High School | 0 (0.0%) | 0 (0.0%) |
| High School Diploma | 0 (0.0%) | 0 (0.0%) |
| College or Associate's Degree | 6 (100.0%) | 0 (0.0%) |
| Bachelor's Degree | 0 (0.0%) | 0 (0.0%) |
| Graduate Degree | 0 (0.0%) | 0 (0.0%) |
| Total | 6 (100.0%) | 0 (0.0%) |
Employment Characteristics in Andover
Employment by Class of Employer in Andover
Among the 470 employed individuals in Andover, private company employees (277 | 58.9%), state government employees (54 | 11.5%), and not-for-profit organizations (43 | 9.1%) make up the most common classes of employment.
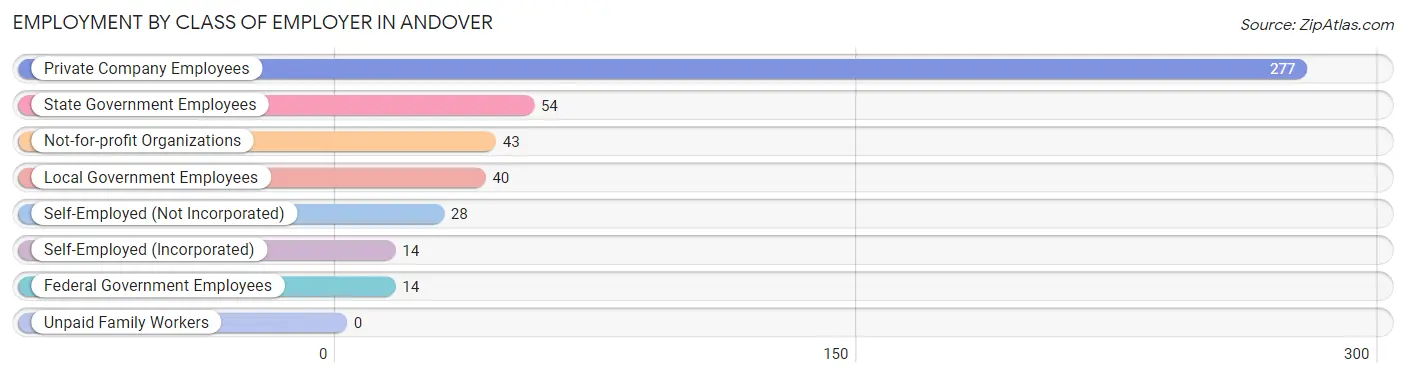
| Employer Class | # Employees | % Employees |
| Private Company Employees | 277 | 58.9% |
| Self-Employed (Incorporated) | 14 | 3.0% |
| Self-Employed (Not Incorporated) | 28 | 6.0% |
| Not-for-profit Organizations | 43 | 9.1% |
| Local Government Employees | 40 | 8.5% |
| State Government Employees | 54 | 11.5% |
| Federal Government Employees | 14 | 3.0% |
| Unpaid Family Workers | 0 | 0.0% |
| Total | 470 | 100.0% |
Employment Status by Age in Andover
According to the labor force statistics for Andover, out of the total population over 16 years of age (834), 62.5% or 521 individuals are in the labor force, with 10.0% or 52 of them unemployed. The age group with the highest labor force participation rate is 20 to 24 years, with 100.0% or 38 individuals in the labor force. Within the labor force, the 35 to 44 years age range has the highest percentage of unemployed individuals, with 27.8% or 22 of them being unemployed.
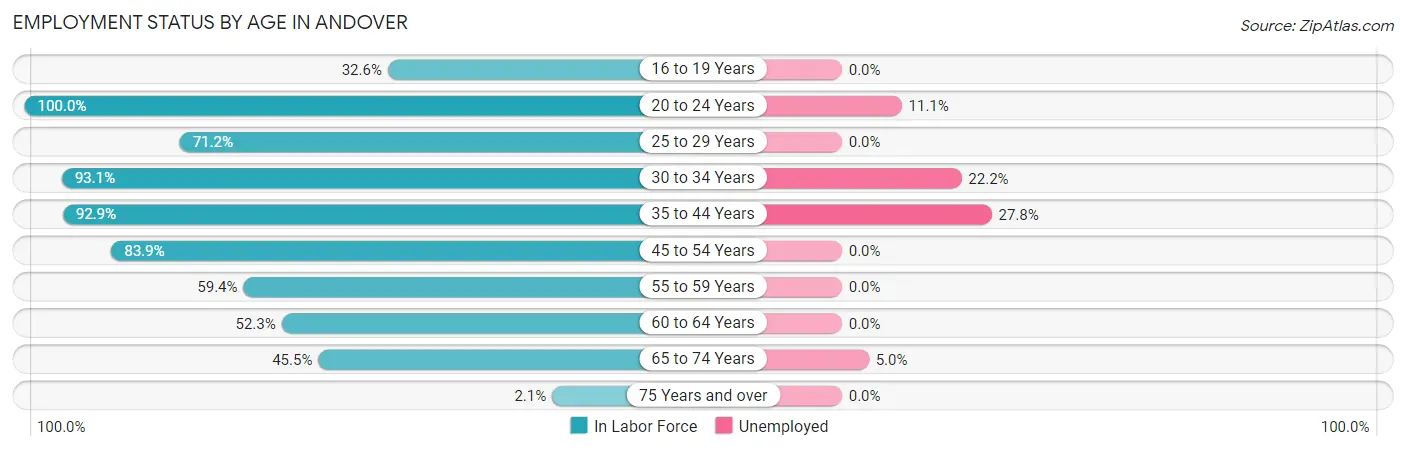
| Age Bracket | In Labor Force | Unemployed |
| 16 to 19 Years | 14 (32.6%) | 0 (0.0%) |
| 20 to 24 Years | 38 (100.0%) | 4 (11.1%) |
| 25 to 29 Years | 37 (71.2%) | 0 (0.0%) |
| 30 to 34 Years | 108 (93.1%) | 24 (22.2%) |
| 35 to 44 Years | 79 (92.9%) | 22 (27.8%) |
| 45 to 54 Years | 73 (83.9%) | 0 (0.0%) |
| 55 to 59 Years | 85 (59.4%) | 0 (0.0%) |
| 60 to 64 Years | 45 (52.3%) | 0 (0.0%) |
| 65 to 74 Years | 40 (45.5%) | 2 (5.0%) |
| 75 Years and over | 2 (2.1%) | 0 (0.0%) |
| Total | 521 (62.5%) | 52 (10.0%) |
Employment Status by Educational Attainment in Andover
According to labor force statistics for Andover, 75.0% of individuals (427) out of the total population between 25 and 64 years of age (569) are in the labor force, with 10.8% or 46 of them being unemployed. The group with the highest labor force participation rate are those with the educational attainment of college / associate degree, with 83.2% or 109 individuals in the labor force. Within the labor force, individuals with less than high school education have the highest percentage of unemployment, with 82.4% or 14 of them being unemployed.
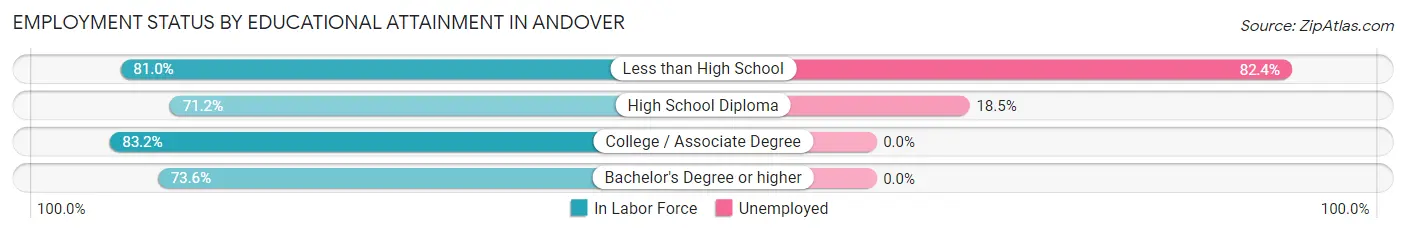
| Educational Attainment | In Labor Force | Unemployed |
| Less than High School | 17 (81.0%) | 17 (82.4%) |
| High School Diploma | 173 (71.2%) | 45 (18.5%) |
| College / Associate Degree | 109 (83.2%) | 0 (0.0%) |
| Bachelor's Degree or higher | 128 (73.6%) | 0 (0.0%) |
| Total | 427 (75.0%) | 61 (10.8%) |
Employment Occupations by Sex in Andover
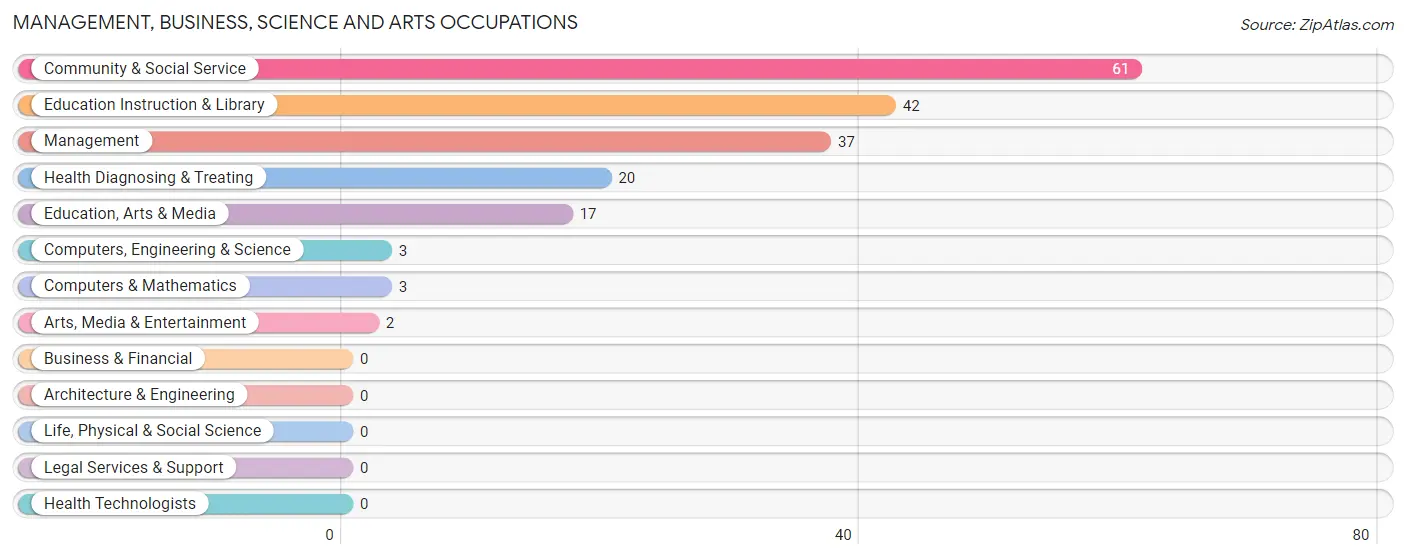
Management, Business, Science and Arts Occupations
The most common Management, Business, Science and Arts occupations in Andover are Community & Social Service (61 | 13.3%), Education Instruction & Library (42 | 9.1%), Management (37 | 8.1%), Health Diagnosing & Treating (20 | 4.4%), and Education, Arts & Media (17 | 3.7%).
Management, Business, Science and Arts Occupations by Sex
Within the Management, Business, Science and Arts occupations in Andover, the most male-oriented occupations are Computers, Engineering & Science (100.0%), Computers & Mathematics (100.0%), and Arts, Media & Entertainment (100.0%), while the most female-oriented occupations are Education, Arts & Media (94.1%), Health Diagnosing & Treating (80.0%), and Community & Social Service (59.0%).
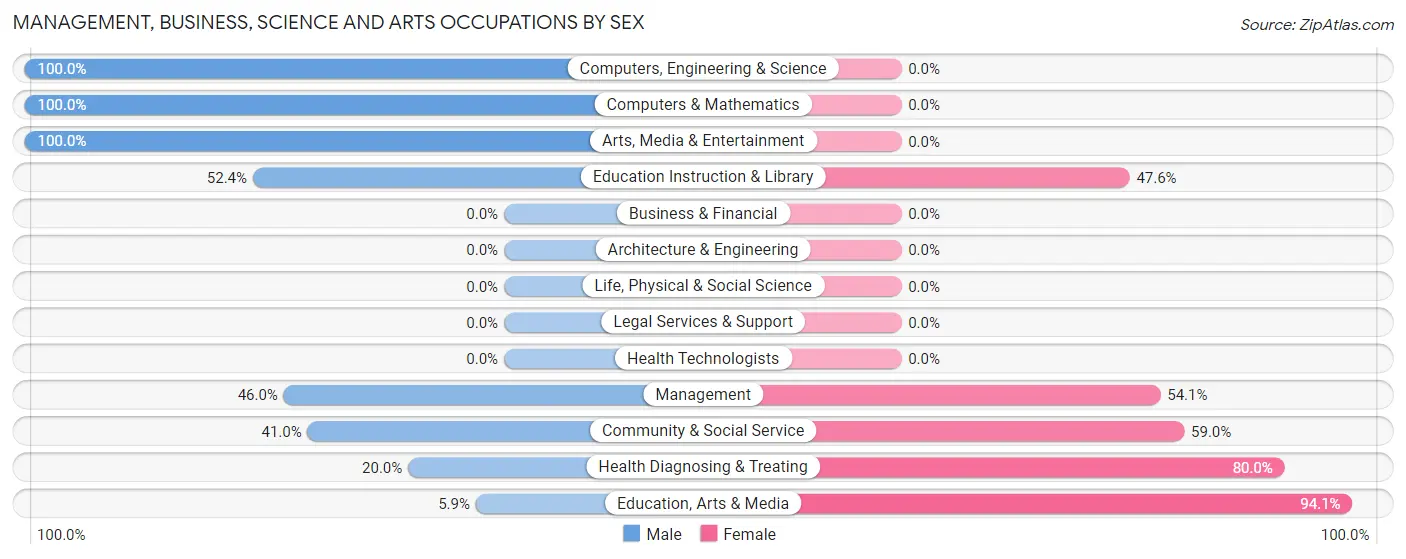
| Occupation | Male | Female |
| Management | 17 (46.0%) | 20 (54.0%) |
| Business & Financial | 0 (0.0%) | 0 (0.0%) |
| Computers, Engineering & Science | 3 (100.0%) | 0 (0.0%) |
| Computers & Mathematics | 3 (100.0%) | 0 (0.0%) |
| Architecture & Engineering | 0 (0.0%) | 0 (0.0%) |
| Life, Physical & Social Science | 0 (0.0%) | 0 (0.0%) |
| Community & Social Service | 25 (41.0%) | 36 (59.0%) |
| Education, Arts & Media | 1 (5.9%) | 16 (94.1%) |
| Legal Services & Support | 0 (0.0%) | 0 (0.0%) |
| Education Instruction & Library | 22 (52.4%) | 20 (47.6%) |
| Arts, Media & Entertainment | 2 (100.0%) | 0 (0.0%) |
| Health Diagnosing & Treating | 4 (20.0%) | 16 (80.0%) |
| Health Technologists | 0 (0.0%) | 0 (0.0%) |
| Total (Category) | 49 (40.5%) | 72 (59.5%) |
| Total (Overall) | 294 (64.0%) | 165 (35.9%) |
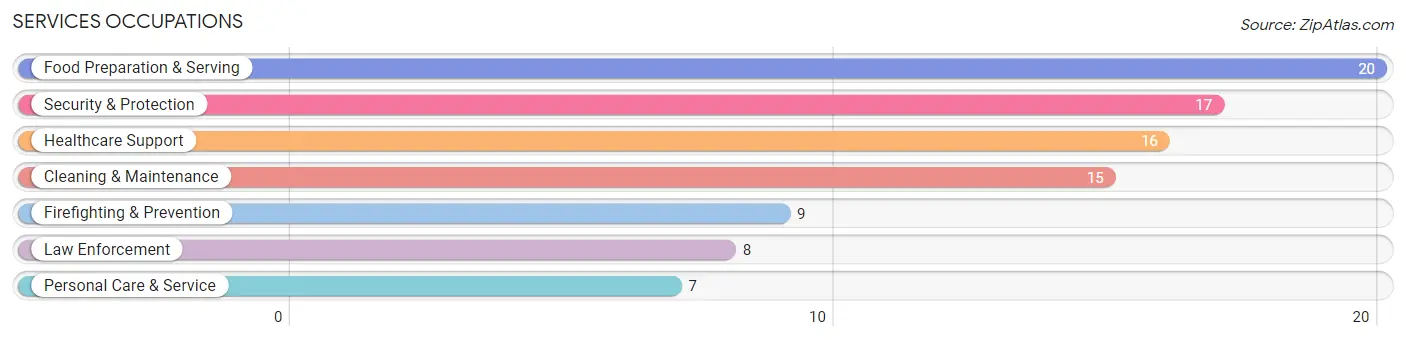
Services Occupations
The most common Services occupations in Andover are Food Preparation & Serving (20 | 4.4%), Security & Protection (17 | 3.7%), Healthcare Support (16 | 3.5%), Cleaning & Maintenance (15 | 3.3%), and Firefighting & Prevention (9 | 2.0%).
Services Occupations by Sex
Within the Services occupations in Andover, the most male-oriented occupations are Law Enforcement (100.0%), Personal Care & Service (57.1%), and Food Preparation & Serving (55.0%), while the most female-oriented occupations are Healthcare Support (100.0%), Firefighting & Prevention (100.0%), and Cleaning & Maintenance (80.0%).
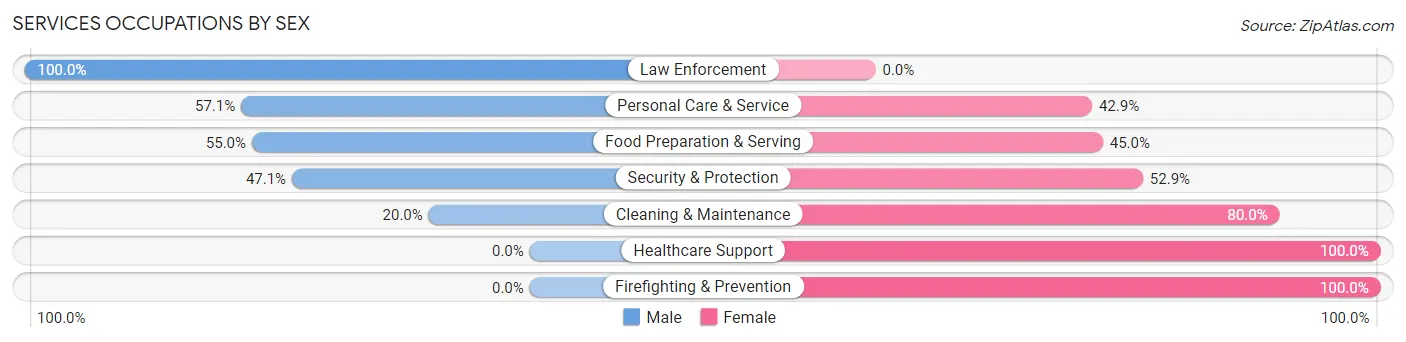
| Occupation | Male | Female |
| Healthcare Support | 0 (0.0%) | 16 (100.0%) |
| Security & Protection | 8 (47.1%) | 9 (52.9%) |
| Firefighting & Prevention | 0 (0.0%) | 9 (100.0%) |
| Law Enforcement | 8 (100.0%) | 0 (0.0%) |
| Food Preparation & Serving | 11 (55.0%) | 9 (45.0%) |
| Cleaning & Maintenance | 3 (20.0%) | 12 (80.0%) |
| Personal Care & Service | 4 (57.1%) | 3 (42.9%) |
| Total (Category) | 26 (34.7%) | 49 (65.3%) |
| Total (Overall) | 294 (64.0%) | 165 (35.9%) |
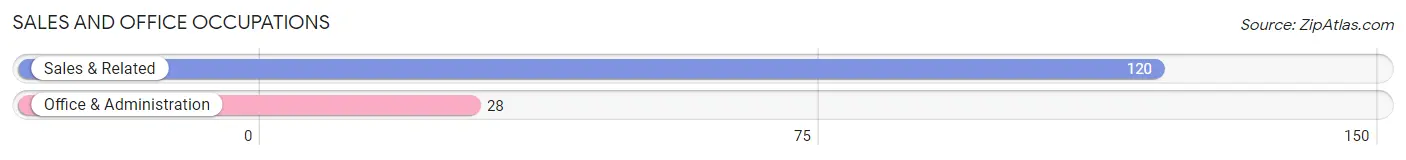
Sales and Office Occupations
The most common Sales and Office occupations in Andover are Sales & Related (120 | 26.1%), and Office & Administration (28 | 6.1%).
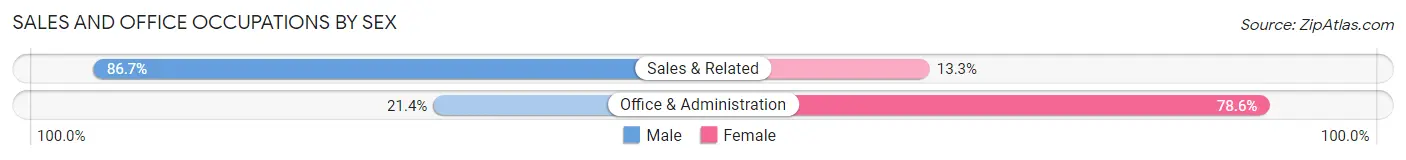
Sales and Office Occupations by Sex
| Occupation | Male | Female |
| Sales & Related | 104 (86.7%) | 16 (13.3%) |
| Office & Administration | 6 (21.4%) | 22 (78.6%) |
| Total (Category) | 110 (74.3%) | 38 (25.7%) |
| Total (Overall) | 294 (64.0%) | 165 (35.9%) |
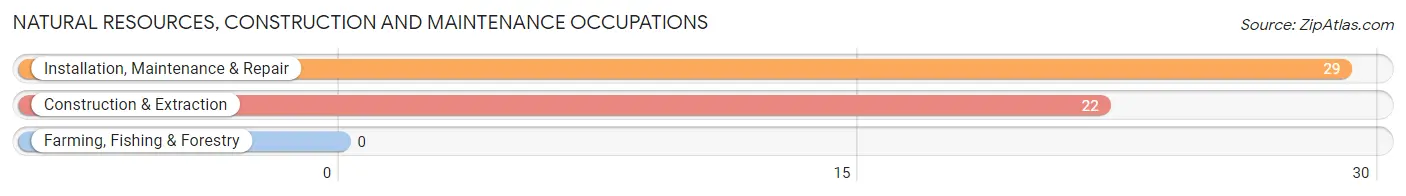
Natural Resources, Construction and Maintenance Occupations
The most common Natural Resources, Construction and Maintenance occupations in Andover are Installation, Maintenance & Repair (29 | 6.3%), and Construction & Extraction (22 | 4.8%).
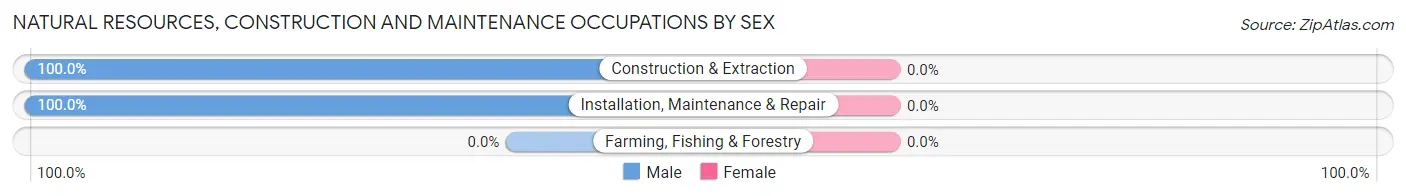
Natural Resources, Construction and Maintenance Occupations by Sex
| Occupation | Male | Female |
| Farming, Fishing & Forestry | 0 (0.0%) | 0 (0.0%) |
| Construction & Extraction | 22 (100.0%) | 0 (0.0%) |
| Installation, Maintenance & Repair | 29 (100.0%) | 0 (0.0%) |
| Total (Category) | 51 (100.0%) | 0 (0.0%) |
| Total (Overall) | 294 (64.0%) | 165 (35.9%) |
Production, Transportation and Moving Occupations
The most common Production, Transportation and Moving occupations in Andover are Production (38 | 8.3%), Material Moving (22 | 4.8%), and Transportation (4 | 0.9%).
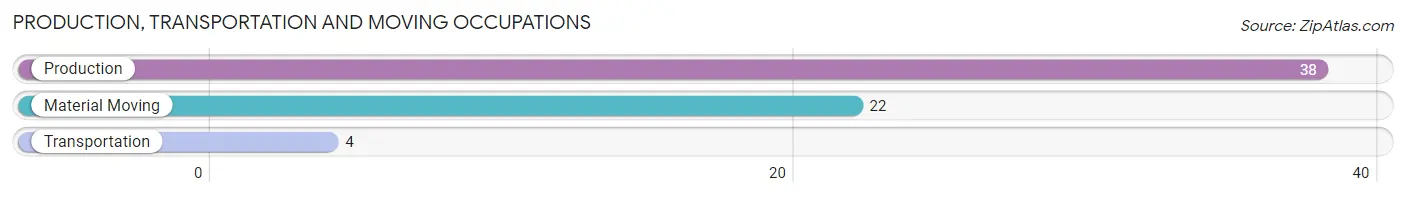
Production, Transportation and Moving Occupations by Sex
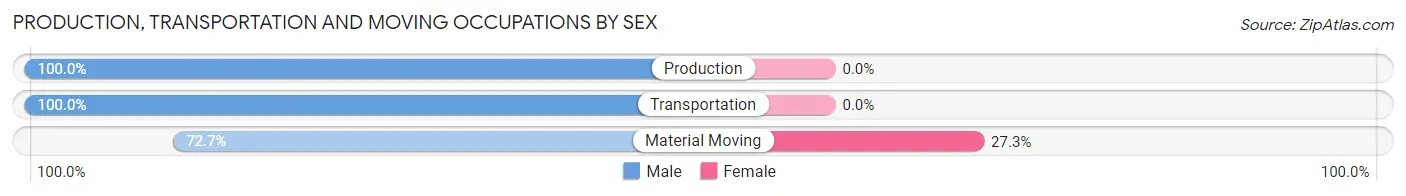
| Occupation | Male | Female |
| Production | 38 (100.0%) | 0 (0.0%) |
| Transportation | 4 (100.0%) | 0 (0.0%) |
| Material Moving | 16 (72.7%) | 6 (27.3%) |
| Total (Category) | 58 (90.6%) | 6 (9.4%) |
| Total (Overall) | 294 (64.0%) | 165 (35.9%) |
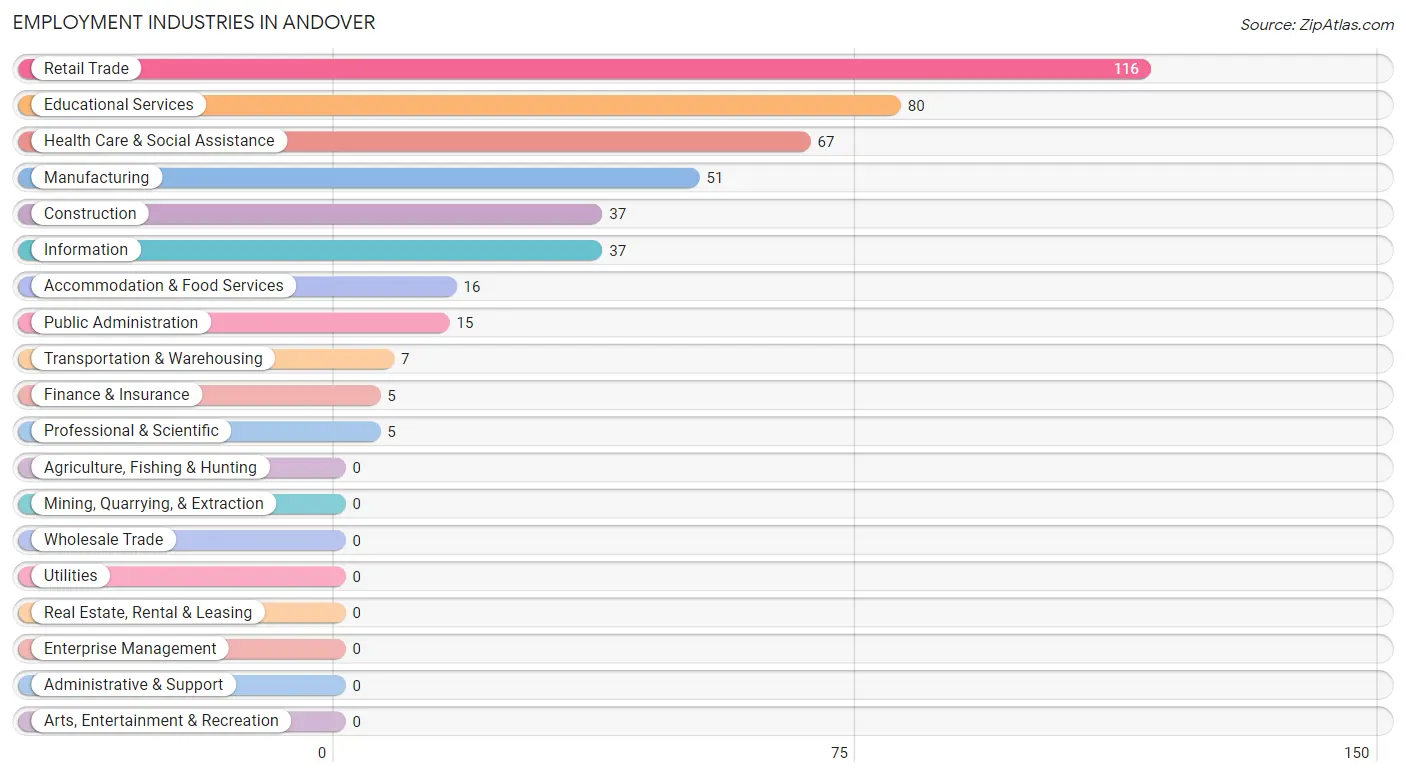
Employment Industries by Sex in Andover
Employment Industries in Andover
The major employment industries in Andover include Retail Trade (116 | 25.3%), Educational Services (80 | 17.4%), Health Care & Social Assistance (67 | 14.6%), Manufacturing (51 | 11.1%), and Construction (37 | 8.1%).
Employment Industries by Sex in Andover
The Andover industries that see more men than women are Professional & Scientific (100.0%), Manufacturing (92.2%), and Construction (86.5%), whereas the industries that tend to have a higher number of women are Finance & Insurance (100.0%), Health Care & Social Assistance (79.1%), and Educational Services (48.7%).
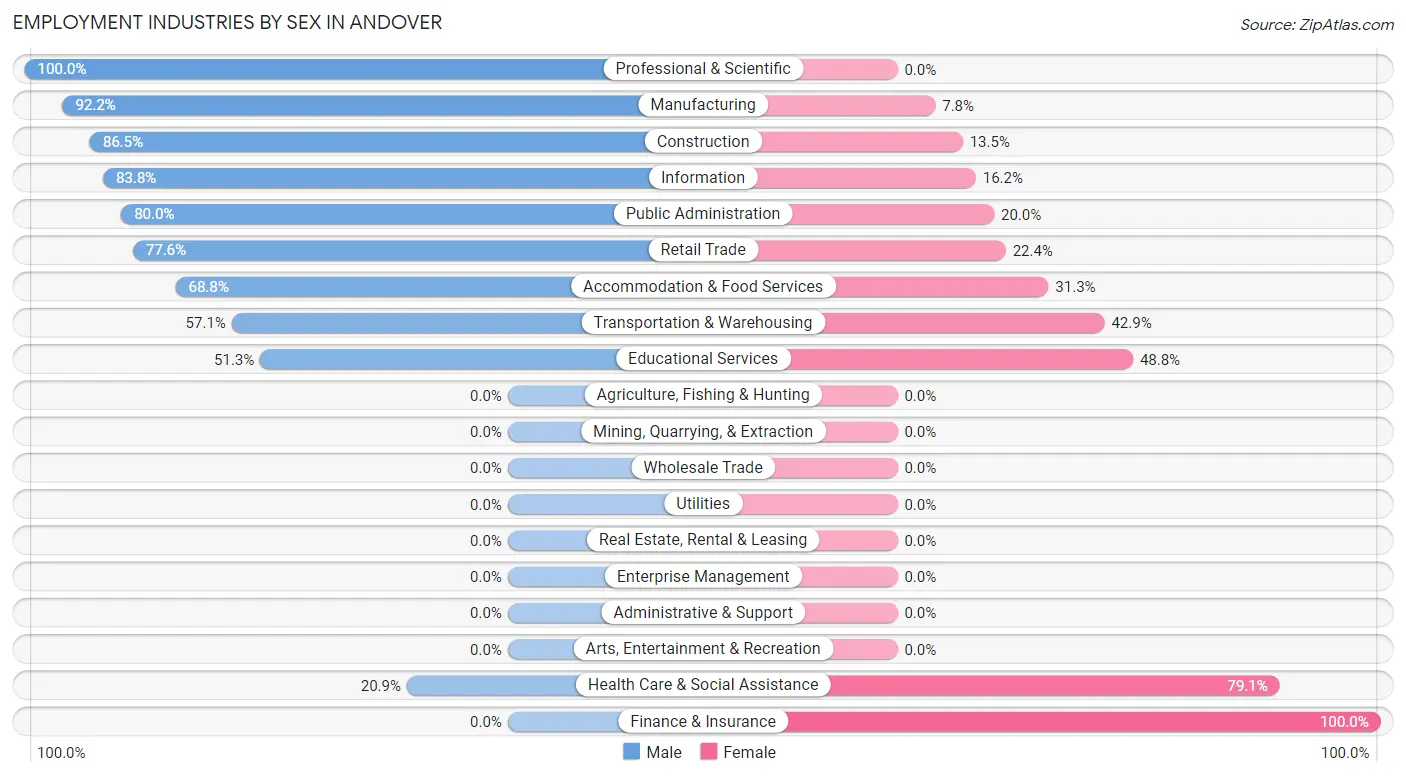
| Industry | Male | Female |
| Agriculture, Fishing & Hunting | 0 (0.0%) | 0 (0.0%) |
| Mining, Quarrying, & Extraction | 0 (0.0%) | 0 (0.0%) |
| Construction | 32 (86.5%) | 5 (13.5%) |
| Manufacturing | 47 (92.2%) | 4 (7.8%) |
| Wholesale Trade | 0 (0.0%) | 0 (0.0%) |
| Retail Trade | 90 (77.6%) | 26 (22.4%) |
| Transportation & Warehousing | 4 (57.1%) | 3 (42.9%) |
| Utilities | 0 (0.0%) | 0 (0.0%) |
| Information | 31 (83.8%) | 6 (16.2%) |
| Finance & Insurance | 0 (0.0%) | 5 (100.0%) |
| Real Estate, Rental & Leasing | 0 (0.0%) | 0 (0.0%) |
| Professional & Scientific | 5 (100.0%) | 0 (0.0%) |
| Enterprise Management | 0 (0.0%) | 0 (0.0%) |
| Administrative & Support | 0 (0.0%) | 0 (0.0%) |
| Educational Services | 41 (51.2%) | 39 (48.7%) |
| Health Care & Social Assistance | 14 (20.9%) | 53 (79.1%) |
| Arts, Entertainment & Recreation | 0 (0.0%) | 0 (0.0%) |
| Accommodation & Food Services | 11 (68.8%) | 5 (31.2%) |
| Public Administration | 12 (80.0%) | 3 (20.0%) |
| Total | 294 (64.0%) | 165 (35.9%) |
Education in Andover
School Enrollment in Andover
The most common levels of schooling among the 200 students in Andover are middle school (54 | 27.0%), high school (47 | 23.5%), and elementary school (46 | 23.0%).
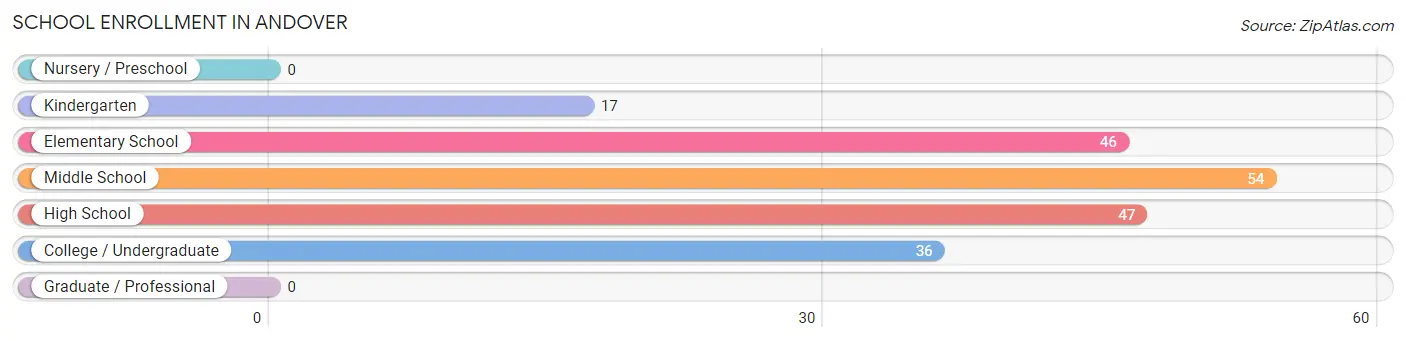
| School Level | # Students | % Students |
| Nursery / Preschool | 0 | 0.0% |
| Kindergarten | 17 | 8.5% |
| Elementary School | 46 | 23.0% |
| Middle School | 54 | 27.0% |
| High School | 47 | 23.5% |
| College / Undergraduate | 36 | 18.0% |
| Graduate / Professional | 0 | 0.0% |
| Total | 200 | 100.0% |
School Enrollment by Age by Funding Source in Andover
Out of a total of 200 students who are enrolled in schools in Andover, 28 (14.0%) attend a private institution, while the remaining 172 (86.0%) are enrolled in public schools. The age group of 35 years and over has the highest likelihood of being enrolled in private schools, with 3 (100.0% in the age bracket) enrolled. Conversely, the age group of 20 to 24 year olds has the lowest likelihood of being enrolled in a private school, with 22 (100.0% in the age bracket) attending a public institution.
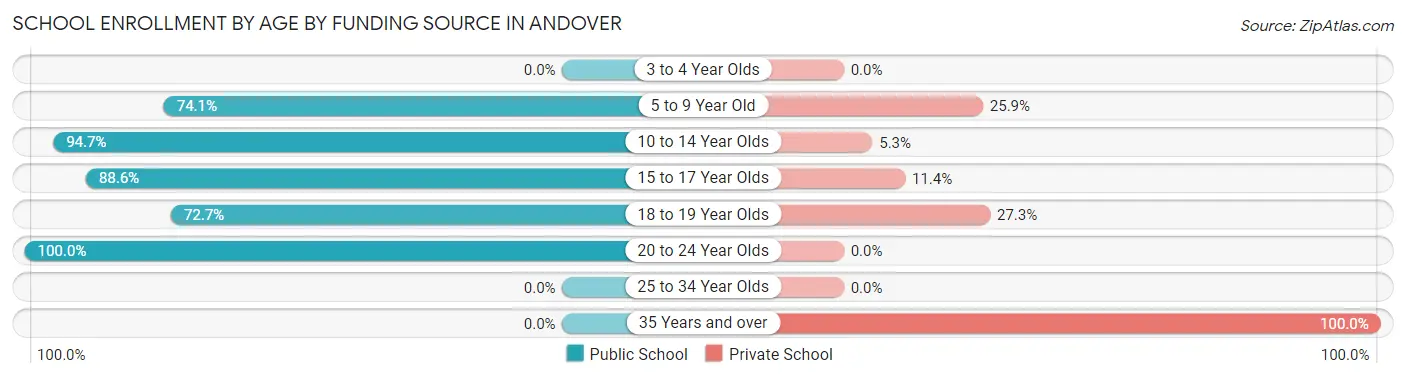
| Age Bracket | Public School | Private School |
| 3 to 4 Year Olds | 0 (0.0%) | 0 (0.0%) |
| 5 to 9 Year Old | 40 (74.1%) | 14 (25.9%) |
| 10 to 14 Year Olds | 71 (94.7%) | 4 (5.3%) |
| 15 to 17 Year Olds | 31 (88.6%) | 4 (11.4%) |
| 18 to 19 Year Olds | 8 (72.7%) | 3 (27.3%) |
| 20 to 24 Year Olds | 22 (100.0%) | 0 (0.0%) |
| 25 to 34 Year Olds | 0 (0.0%) | 0 (0.0%) |
| 35 Years and over | 0 (0.0%) | 3 (100.0%) |
| Total | 172 (86.0%) | 28 (14.0%) |
Educational Attainment by Field of Study in Andover
Education (90 | 37.7%), liberal arts & history (73 | 30.5%), computers & mathematics (16 | 6.7%), business (14 | 5.9%), and psychology (13 | 5.4%) are the most common fields of study among 239 individuals in Andover who have obtained a bachelor's degree or higher.
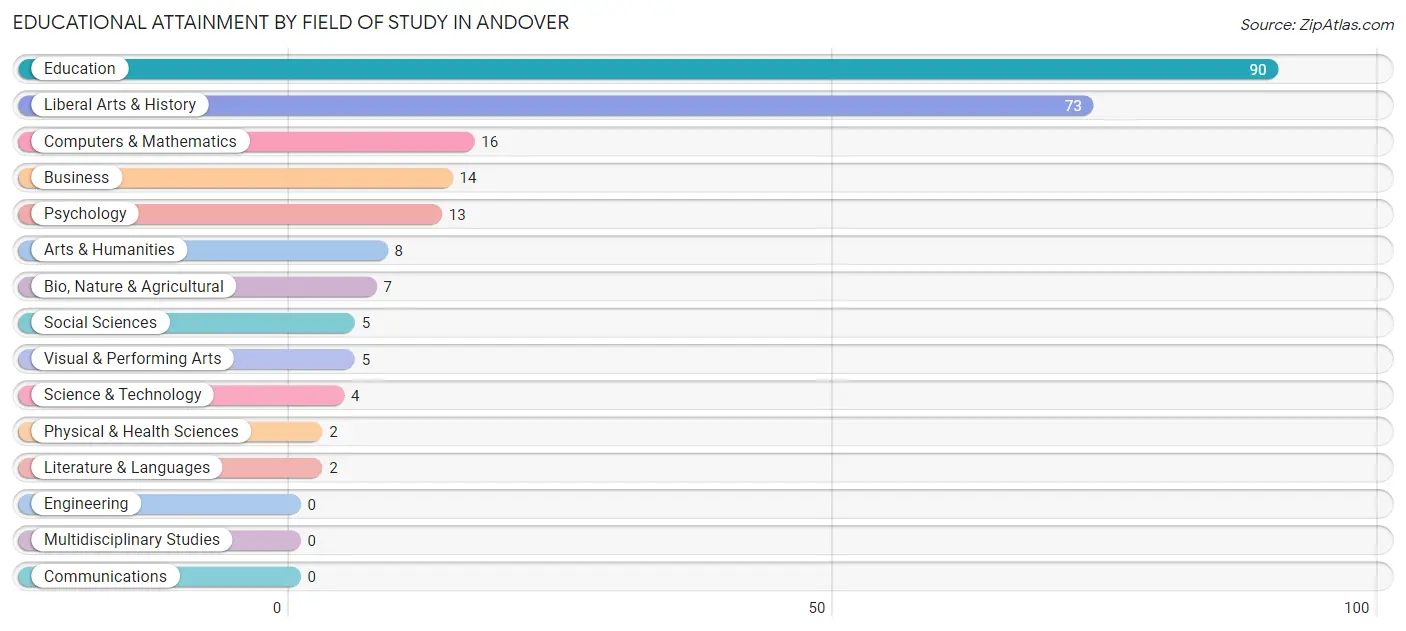
| Field of Study | # Graduates | % Graduates |
| Computers & Mathematics | 16 | 6.7% |
| Bio, Nature & Agricultural | 7 | 2.9% |
| Physical & Health Sciences | 2 | 0.8% |
| Psychology | 13 | 5.4% |
| Social Sciences | 5 | 2.1% |
| Engineering | 0 | 0.0% |
| Multidisciplinary Studies | 0 | 0.0% |
| Science & Technology | 4 | 1.7% |
| Business | 14 | 5.9% |
| Education | 90 | 37.7% |
| Literature & Languages | 2 | 0.8% |
| Liberal Arts & History | 73 | 30.5% |
| Visual & Performing Arts | 5 | 2.1% |
| Communications | 0 | 0.0% |
| Arts & Humanities | 8 | 3.4% |
| Total | 239 | 100.0% |
Transportation & Commute in Andover
Vehicle Availability by Sex in Andover
The most prevalent vehicle ownership categories in Andover are males with 2 vehicles (168, accounting for 55.1%) and females with 2 vehicles (72, making up 101.8%).
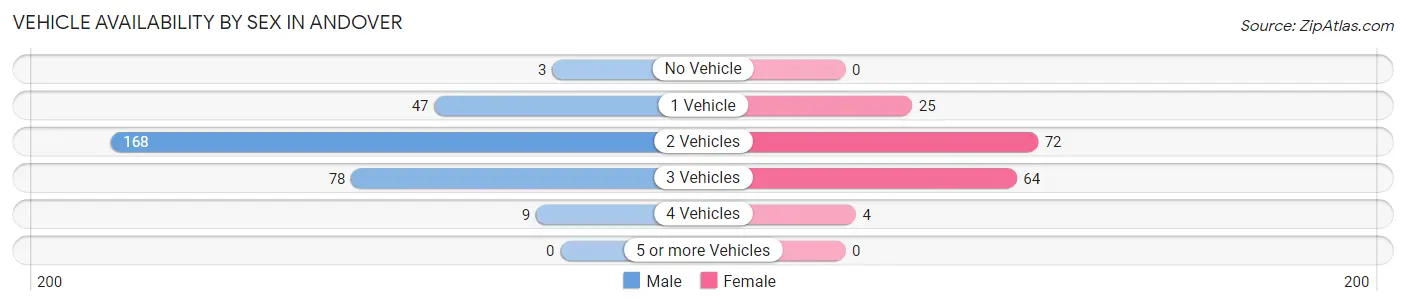
| Vehicles Available | Male | Female |
| No Vehicle | 3 (1.0%) | 0 (0.0%) |
| 1 Vehicle | 47 (15.4%) | 25 (15.1%) |
| 2 Vehicles | 168 (55.1%) | 72 (43.6%) |
| 3 Vehicles | 78 (25.6%) | 64 (38.8%) |
| 4 Vehicles | 9 (2.9%) | 4 (2.4%) |
| 5 or more Vehicles | 0 (0.0%) | 0 (0.0%) |
| Total | 305 (100.0%) | 165 (100.0%) |
Commute Time in Andover
The most frequently occuring commute durations in Andover are 15 to 19 minutes (177 commuters, 38.2%), 30 to 34 minutes (66 commuters, 14.2%), and 5 to 9 minutes (45 commuters, 9.7%).
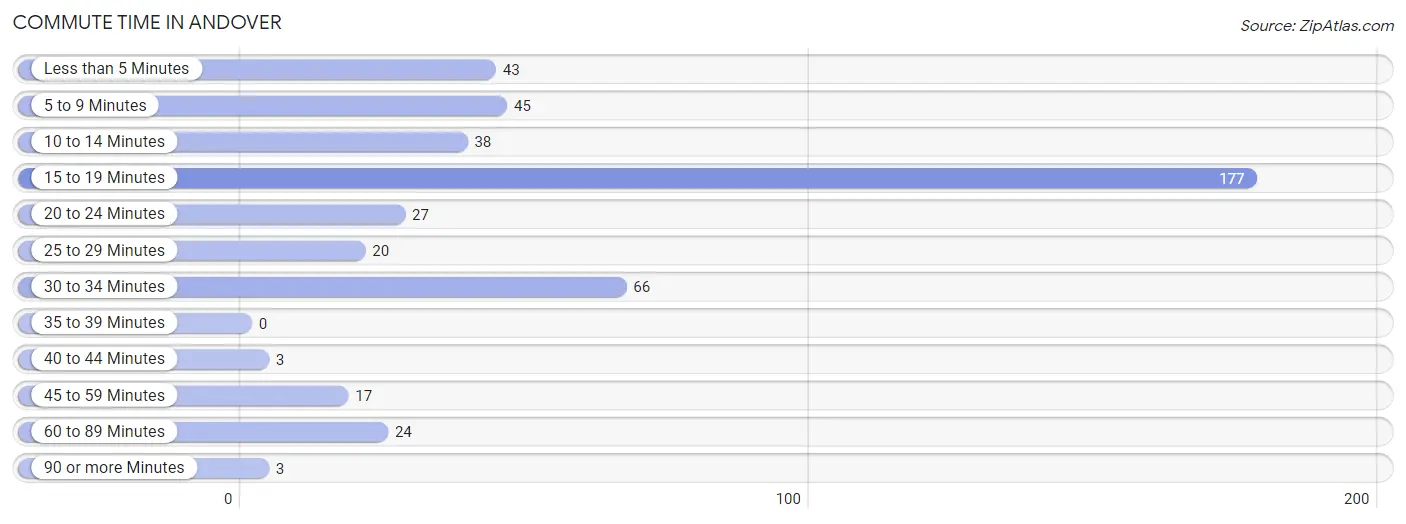
| Commute Time | # Commuters | % Commuters |
| Less than 5 Minutes | 43 | 9.3% |
| 5 to 9 Minutes | 45 | 9.7% |
| 10 to 14 Minutes | 38 | 8.2% |
| 15 to 19 Minutes | 177 | 38.2% |
| 20 to 24 Minutes | 27 | 5.8% |
| 25 to 29 Minutes | 20 | 4.3% |
| 30 to 34 Minutes | 66 | 14.2% |
| 35 to 39 Minutes | 0 | 0.0% |
| 40 to 44 Minutes | 3 | 0.6% |
| 45 to 59 Minutes | 17 | 3.7% |
| 60 to 89 Minutes | 24 | 5.2% |
| 90 or more Minutes | 3 | 0.6% |
Commute Time by Sex in Andover
The most common commute times in Andover are 15 to 19 minutes (118 commuters, 39.6%) for males and 15 to 19 minutes (59 commuters, 35.8%) for females.
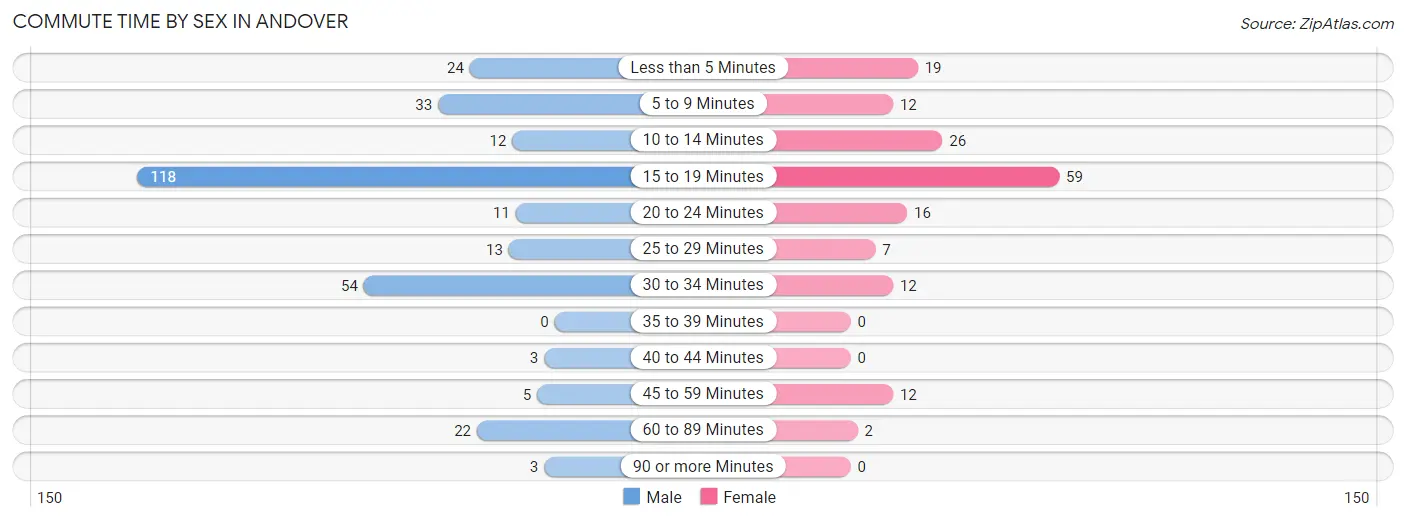
| Commute Time | Male | Female |
| Less than 5 Minutes | 24 (8.1%) | 19 (11.5%) |
| 5 to 9 Minutes | 33 (11.1%) | 12 (7.3%) |
| 10 to 14 Minutes | 12 (4.0%) | 26 (15.8%) |
| 15 to 19 Minutes | 118 (39.6%) | 59 (35.8%) |
| 20 to 24 Minutes | 11 (3.7%) | 16 (9.7%) |
| 25 to 29 Minutes | 13 (4.4%) | 7 (4.2%) |
| 30 to 34 Minutes | 54 (18.1%) | 12 (7.3%) |
| 35 to 39 Minutes | 0 (0.0%) | 0 (0.0%) |
| 40 to 44 Minutes | 3 (1.0%) | 0 (0.0%) |
| 45 to 59 Minutes | 5 (1.7%) | 12 (7.3%) |
| 60 to 89 Minutes | 22 (7.4%) | 2 (1.2%) |
| 90 or more Minutes | 3 (1.0%) | 0 (0.0%) |
Time of Departure to Work by Sex in Andover
The most frequent times of departure to work in Andover are 7:00 AM to 7:29 AM (94, 31.5%) for males and 7:30 AM to 7:59 AM (55, 33.3%) for females.
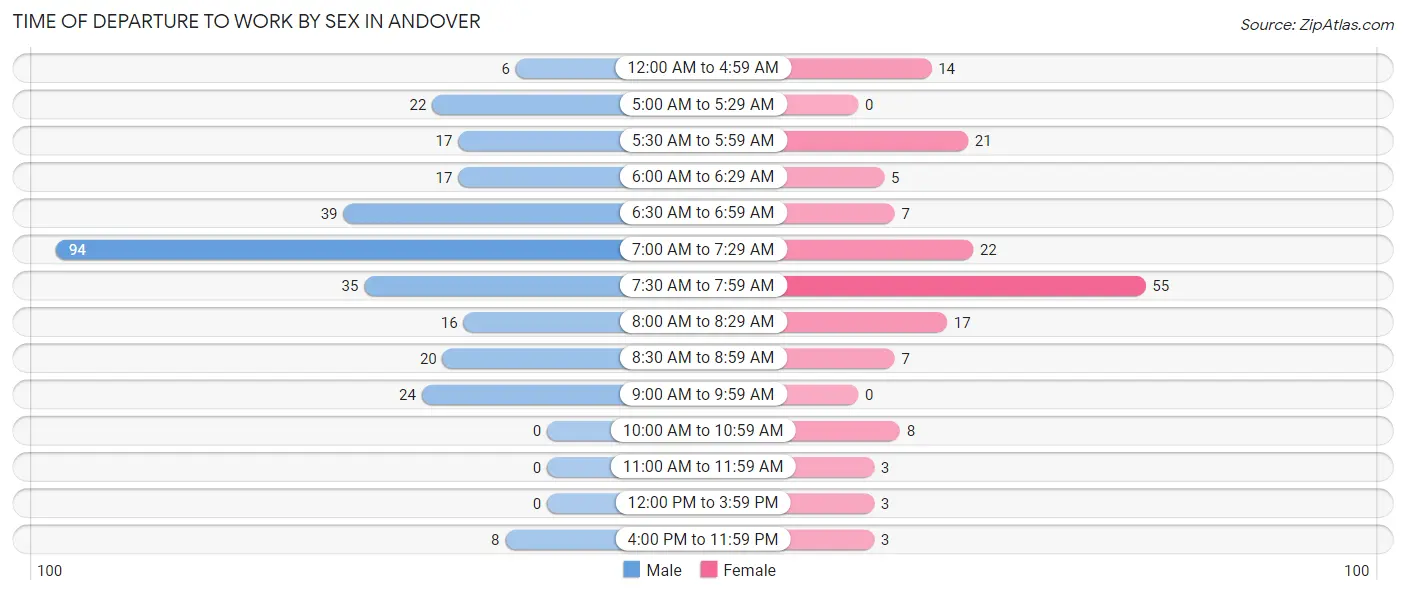
| Time of Departure | Male | Female |
| 12:00 AM to 4:59 AM | 6 (2.0%) | 14 (8.5%) |
| 5:00 AM to 5:29 AM | 22 (7.4%) | 0 (0.0%) |
| 5:30 AM to 5:59 AM | 17 (5.7%) | 21 (12.7%) |
| 6:00 AM to 6:29 AM | 17 (5.7%) | 5 (3.0%) |
| 6:30 AM to 6:59 AM | 39 (13.1%) | 7 (4.2%) |
| 7:00 AM to 7:29 AM | 94 (31.5%) | 22 (13.3%) |
| 7:30 AM to 7:59 AM | 35 (11.7%) | 55 (33.3%) |
| 8:00 AM to 8:29 AM | 16 (5.4%) | 17 (10.3%) |
| 8:30 AM to 8:59 AM | 20 (6.7%) | 7 (4.2%) |
| 9:00 AM to 9:59 AM | 24 (8.1%) | 0 (0.0%) |
| 10:00 AM to 10:59 AM | 0 (0.0%) | 8 (4.9%) |
| 11:00 AM to 11:59 AM | 0 (0.0%) | 3 (1.8%) |
| 12:00 PM to 3:59 PM | 0 (0.0%) | 3 (1.8%) |
| 4:00 PM to 11:59 PM | 8 (2.7%) | 3 (1.8%) |
| Total | 298 (100.0%) | 165 (100.0%) |
Housing Occupancy in Andover
Occupancy by Ownership in Andover
Of the total 359 dwellings in Andover, owner-occupied units account for 271 (75.5%), while renter-occupied units make up 88 (24.5%).
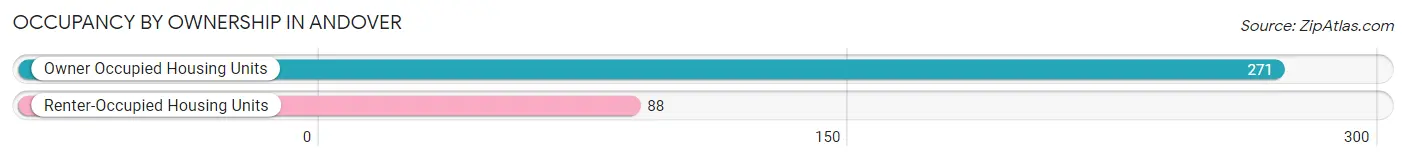
| Occupancy | # Housing Units | % Housing Units |
| Owner Occupied Housing Units | 271 | 75.5% |
| Renter-Occupied Housing Units | 88 | 24.5% |
| Total Occupied Housing Units | 359 | 100.0% |
Occupancy by Household Size in Andover
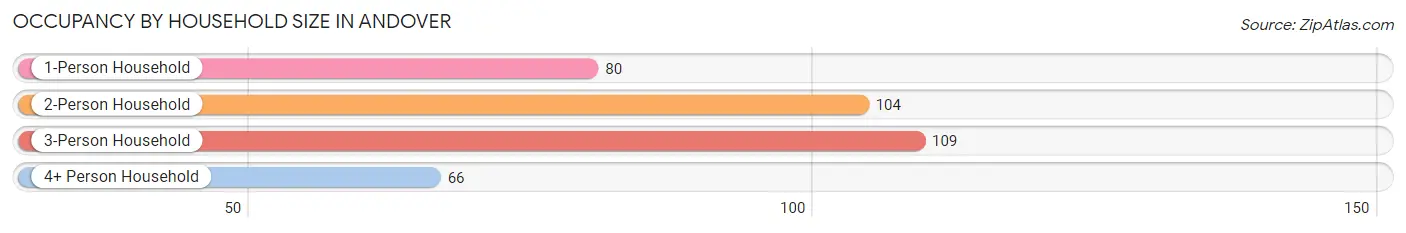
| Household Size | # Housing Units | % Housing Units |
| 1-Person Household | 80 | 22.3% |
| 2-Person Household | 104 | 29.0% |
| 3-Person Household | 109 | 30.4% |
| 4+ Person Household | 66 | 18.4% |
| Total Housing Units | 359 | 100.0% |
Occupancy by Ownership by Household Size in Andover
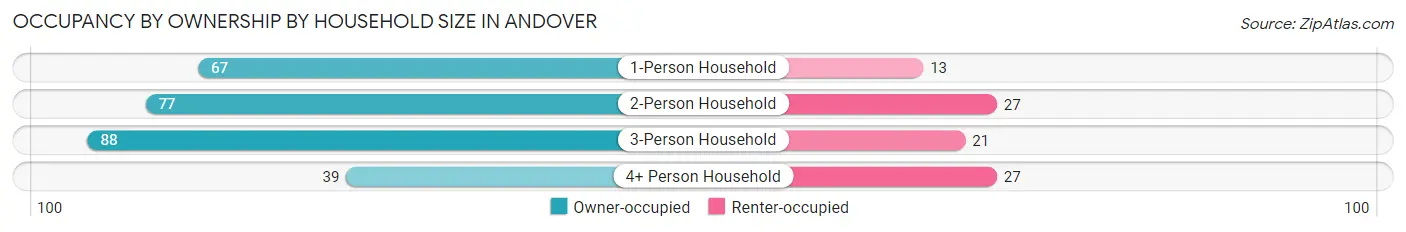
| Household Size | Owner-occupied | Renter-occupied |
| 1-Person Household | 67 (83.8%) | 13 (16.3%) |
| 2-Person Household | 77 (74.0%) | 27 (26.0%) |
| 3-Person Household | 88 (80.7%) | 21 (19.3%) |
| 4+ Person Household | 39 (59.1%) | 27 (40.9%) |
| Total Housing Units | 271 (75.5%) | 88 (24.5%) |
Occupancy by Educational Attainment in Andover
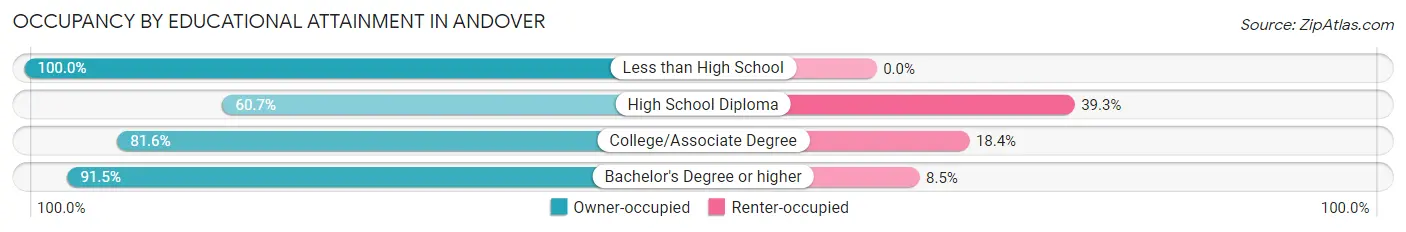
| Household Size | Owner-occupied | Renter-occupied |
| Less than High School | 15 (100.0%) | 0 (0.0%) |
| High School Diploma | 99 (60.7%) | 64 (39.3%) |
| College/Associate Degree | 71 (81.6%) | 16 (18.4%) |
| Bachelor's Degree or higher | 86 (91.5%) | 8 (8.5%) |
Occupancy by Age of Householder in Andover
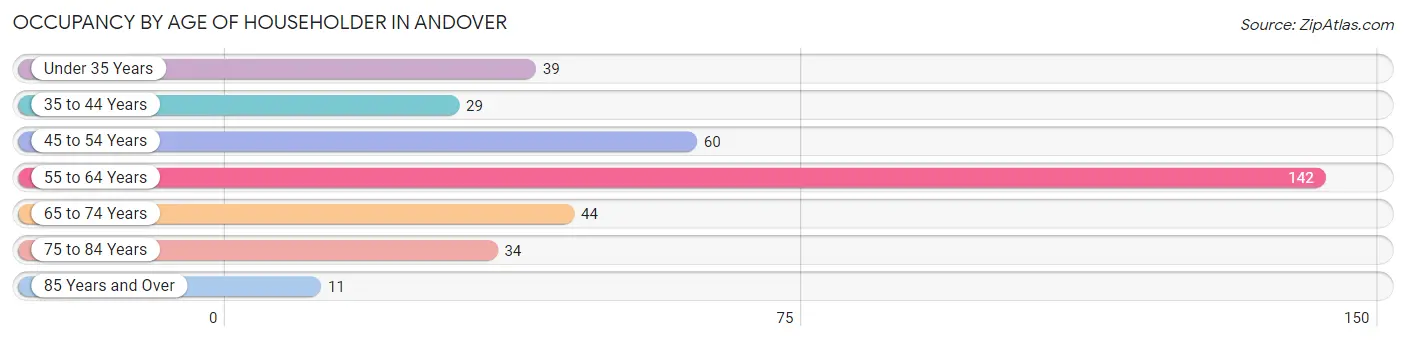
| Age Bracket | # Households | % Households |
| Under 35 Years | 39 | 10.9% |
| 35 to 44 Years | 29 | 8.1% |
| 45 to 54 Years | 60 | 16.7% |
| 55 to 64 Years | 142 | 39.6% |
| 65 to 74 Years | 44 | 12.3% |
| 75 to 84 Years | 34 | 9.5% |
| 85 Years and Over | 11 | 3.1% |
| Total | 359 | 100.0% |
Housing Finances in Andover
Median Income by Occupancy in Andover
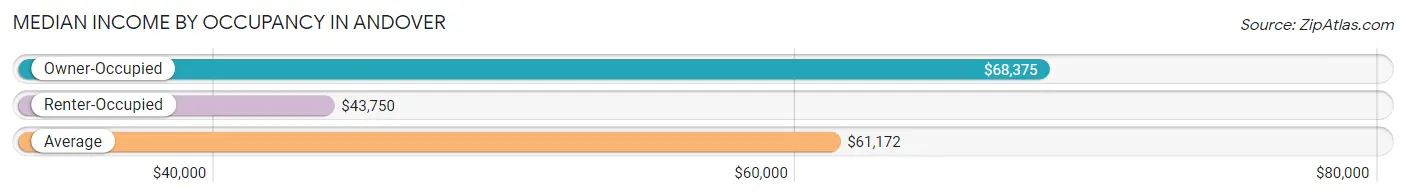
| Occupancy Type | # Households | Median Income |
| Owner-Occupied | 271 (75.5%) | $68,375 |
| Renter-Occupied | 88 (24.5%) | $43,750 |
| Average | 359 (100.0%) | $61,172 |
Occupancy by Householder Income Bracket in Andover
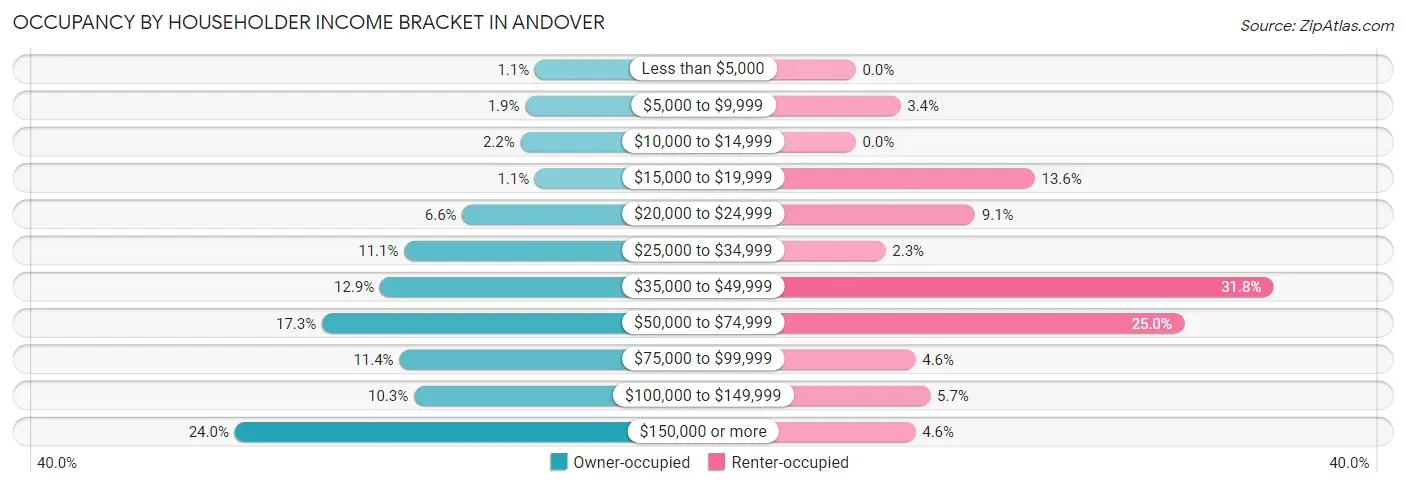
| Income Bracket | Owner-occupied | Renter-occupied |
| Less than $5,000 | 3 (1.1%) | 0 (0.0%) |
| $5,000 to $9,999 | 5 (1.8%) | 3 (3.4%) |
| $10,000 to $14,999 | 6 (2.2%) | 0 (0.0%) |
| $15,000 to $19,999 | 3 (1.1%) | 12 (13.6%) |
| $20,000 to $24,999 | 18 (6.6%) | 8 (9.1%) |
| $25,000 to $34,999 | 30 (11.1%) | 2 (2.3%) |
| $35,000 to $49,999 | 35 (12.9%) | 28 (31.8%) |
| $50,000 to $74,999 | 47 (17.3%) | 22 (25.0%) |
| $75,000 to $99,999 | 31 (11.4%) | 4 (4.5%) |
| $100,000 to $149,999 | 28 (10.3%) | 5 (5.7%) |
| $150,000 or more | 65 (24.0%) | 4 (4.5%) |
| Total | 271 (100.0%) | 88 (100.0%) |
Monthly Housing Cost Tiers in Andover
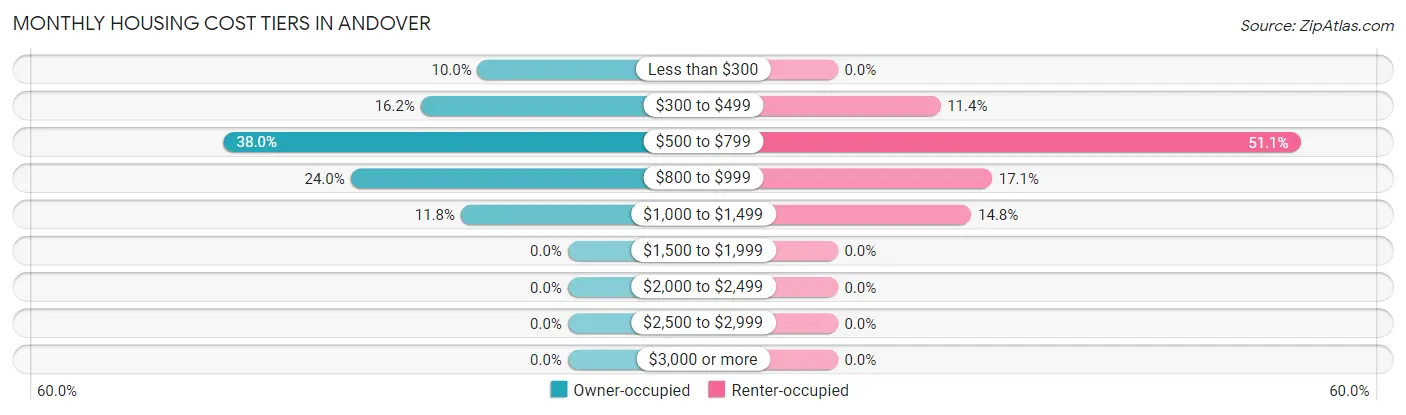
| Monthly Cost | Owner-occupied | Renter-occupied |
| Less than $300 | 27 (10.0%) | 0 (0.0%) |
| $300 to $499 | 44 (16.2%) | 10 (11.4%) |
| $500 to $799 | 103 (38.0%) | 45 (51.1%) |
| $800 to $999 | 65 (24.0%) | 15 (17.1%) |
| $1,000 to $1,499 | 32 (11.8%) | 13 (14.8%) |
| $1,500 to $1,999 | 0 (0.0%) | 0 (0.0%) |
| $2,000 to $2,499 | 0 (0.0%) | 0 (0.0%) |
| $2,500 to $2,999 | 0 (0.0%) | 0 (0.0%) |
| $3,000 or more | 0 (0.0%) | 0 (0.0%) |
| Total | 271 (100.0%) | 88 (100.0%) |
Physical Housing Characteristics in Andover
Housing Structures in Andover
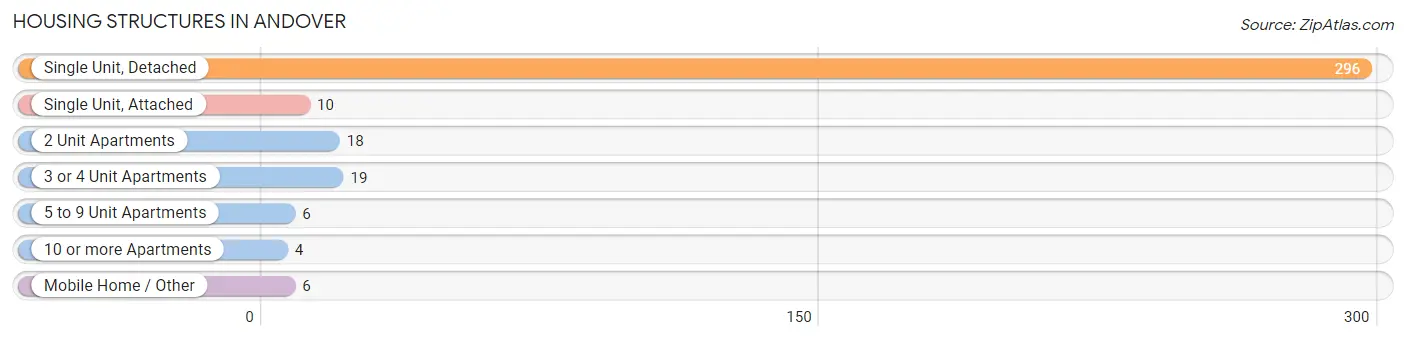
| Structure Type | # Housing Units | % Housing Units |
| Single Unit, Detached | 296 | 82.5% |
| Single Unit, Attached | 10 | 2.8% |
| 2 Unit Apartments | 18 | 5.0% |
| 3 or 4 Unit Apartments | 19 | 5.3% |
| 5 to 9 Unit Apartments | 6 | 1.7% |
| 10 or more Apartments | 4 | 1.1% |
| Mobile Home / Other | 6 | 1.7% |
| Total | 359 | 100.0% |
Housing Structures by Occupancy in Andover
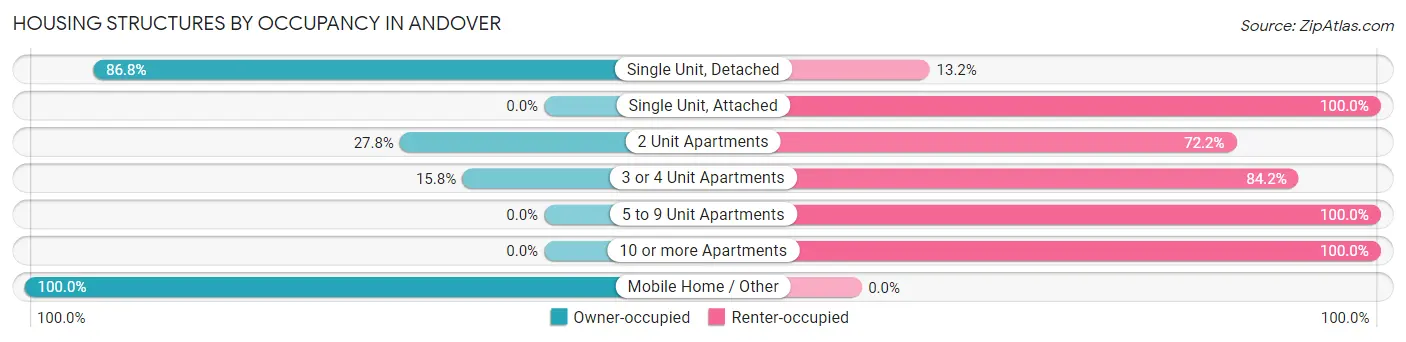
| Structure Type | Owner-occupied | Renter-occupied |
| Single Unit, Detached | 257 (86.8%) | 39 (13.2%) |
| Single Unit, Attached | 0 (0.0%) | 10 (100.0%) |
| 2 Unit Apartments | 5 (27.8%) | 13 (72.2%) |
| 3 or 4 Unit Apartments | 3 (15.8%) | 16 (84.2%) |
| 5 to 9 Unit Apartments | 0 (0.0%) | 6 (100.0%) |
| 10 or more Apartments | 0 (0.0%) | 4 (100.0%) |
| Mobile Home / Other | 6 (100.0%) | 0 (0.0%) |
| Total | 271 (75.5%) | 88 (24.5%) |
Housing Structures by Number of Rooms in Andover
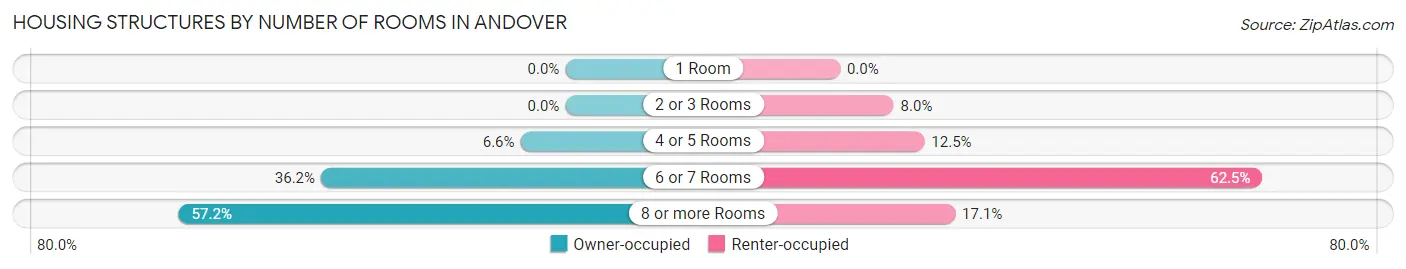
| Number of Rooms | Owner-occupied | Renter-occupied |
| 1 Room | 0 (0.0%) | 0 (0.0%) |
| 2 or 3 Rooms | 0 (0.0%) | 7 (8.0%) |
| 4 or 5 Rooms | 18 (6.6%) | 11 (12.5%) |
| 6 or 7 Rooms | 98 (36.2%) | 55 (62.5%) |
| 8 or more Rooms | 155 (57.2%) | 15 (17.1%) |
| Total | 271 (100.0%) | 88 (100.0%) |
Housing Structure by Heating Type in Andover
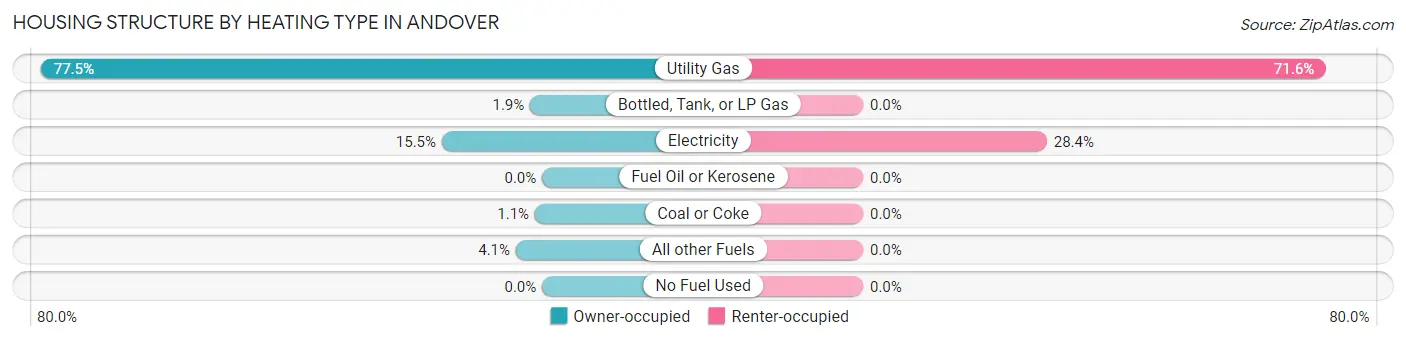
| Heating Type | Owner-occupied | Renter-occupied |
| Utility Gas | 210 (77.5%) | 63 (71.6%) |
| Bottled, Tank, or LP Gas | 5 (1.8%) | 0 (0.0%) |
| Electricity | 42 (15.5%) | 25 (28.4%) |
| Fuel Oil or Kerosene | 0 (0.0%) | 0 (0.0%) |
| Coal or Coke | 3 (1.1%) | 0 (0.0%) |
| All other Fuels | 11 (4.1%) | 0 (0.0%) |
| No Fuel Used | 0 (0.0%) | 0 (0.0%) |
| Total | 271 (100.0%) | 88 (100.0%) |
Household Vehicle Usage in Andover
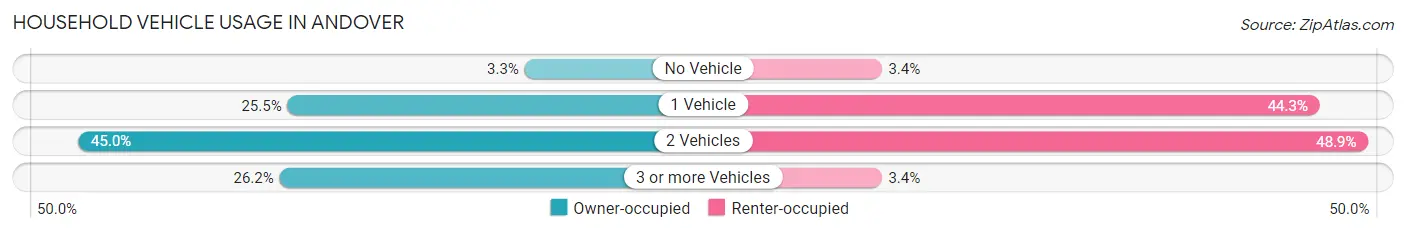
| Vehicles per Household | Owner-occupied | Renter-occupied |
| No Vehicle | 9 (3.3%) | 3 (3.4%) |
| 1 Vehicle | 69 (25.5%) | 39 (44.3%) |
| 2 Vehicles | 122 (45.0%) | 43 (48.9%) |
| 3 or more Vehicles | 71 (26.2%) | 3 (3.4%) |
| Total | 271 (100.0%) | 88 (100.0%) |
Real Estate & Mortgages in Andover
Real Estate and Mortgage Overview in Andover
| Characteristic | Without Mortgage | With Mortgage |
| Housing Units | 136 | 135 |
| Median Property Value | $68,900 | $73,300 |
| Median Household Income | $42,083 | $57 |
| Monthly Housing Costs | $488 | $0 |
| Real Estate Taxes | $2,400 | $2 |
Property Value by Mortgage Status in Andover
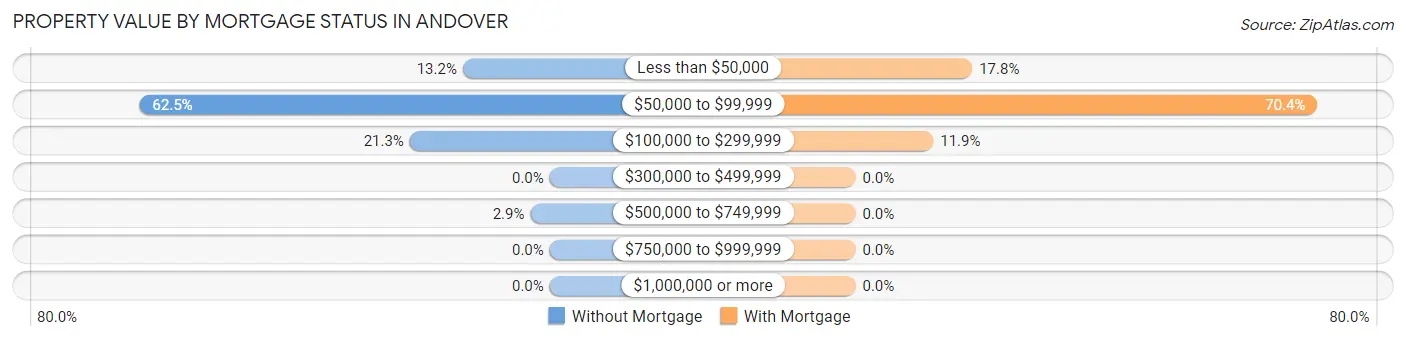
| Property Value | Without Mortgage | With Mortgage |
| Less than $50,000 | 18 (13.2%) | 24 (17.8%) |
| $50,000 to $99,999 | 85 (62.5%) | 95 (70.4%) |
| $100,000 to $299,999 | 29 (21.3%) | 16 (11.8%) |
| $300,000 to $499,999 | 0 (0.0%) | 0 (0.0%) |
| $500,000 to $749,999 | 4 (2.9%) | 0 (0.0%) |
| $750,000 to $999,999 | 0 (0.0%) | 0 (0.0%) |
| $1,000,000 or more | 0 (0.0%) | 0 (0.0%) |
| Total | 136 (100.0%) | 135 (100.0%) |
Household Income by Mortgage Status in Andover
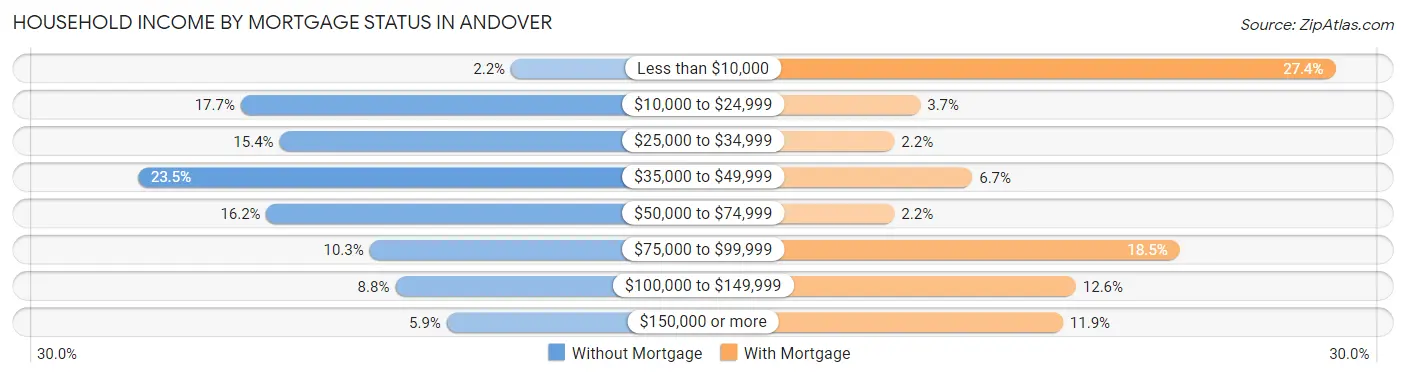
| Household Income | Without Mortgage | With Mortgage |
| Less than $10,000 | 3 (2.2%) | 37 (27.4%) |
| $10,000 to $24,999 | 24 (17.6%) | 5 (3.7%) |
| $25,000 to $34,999 | 21 (15.4%) | 3 (2.2%) |
| $35,000 to $49,999 | 32 (23.5%) | 9 (6.7%) |
| $50,000 to $74,999 | 22 (16.2%) | 3 (2.2%) |
| $75,000 to $99,999 | 14 (10.3%) | 25 (18.5%) |
| $100,000 to $149,999 | 12 (8.8%) | 17 (12.6%) |
| $150,000 or more | 8 (5.9%) | 16 (11.8%) |
| Total | 136 (100.0%) | 135 (100.0%) |
Property Value to Household Income Ratio in Andover
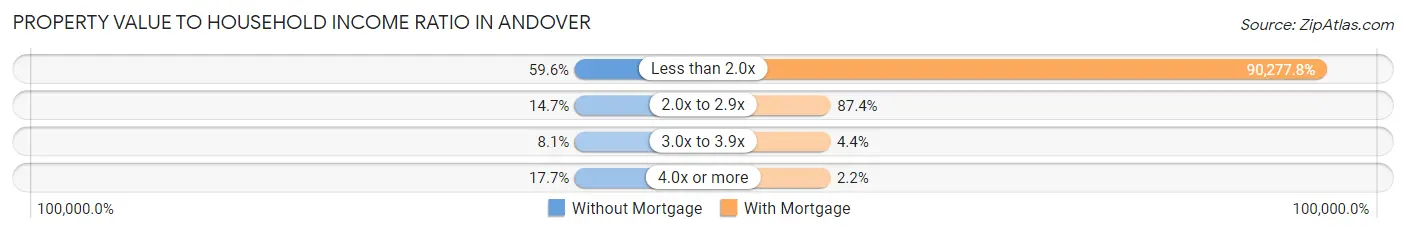
| Value-to-Income Ratio | Without Mortgage | With Mortgage |
| Less than 2.0x | 81 (59.6%) | 121,875 (90,277.8%) |
| 2.0x to 2.9x | 20 (14.7%) | 118 (87.4%) |
| 3.0x to 3.9x | 11 (8.1%) | 6 (4.4%) |
| 4.0x or more | 24 (17.6%) | 3 (2.2%) |
| Total | 136 (100.0%) | 135 (100.0%) |
Real Estate Taxes by Mortgage Status in Andover
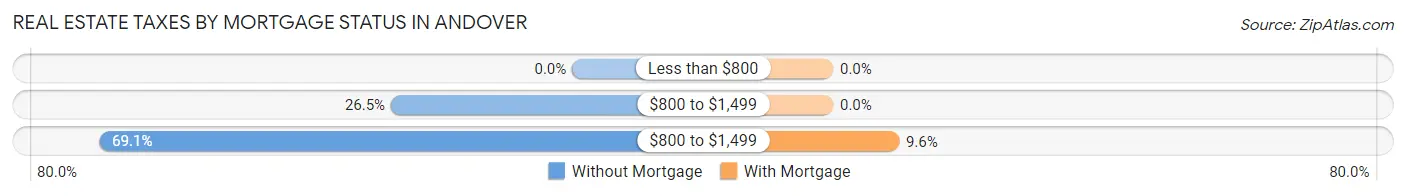
| Property Taxes | Without Mortgage | With Mortgage |
| Less than $800 | 0 (0.0%) | 0 (0.0%) |
| $800 to $1,499 | 36 (26.5%) | 0 (0.0%) |
| $800 to $1,499 | 94 (69.1%) | 13 (9.6%) |
| Total | 136 (100.0%) | 135 (100.0%) |
Health & Disability in Andover
Health Insurance Coverage by Age in Andover
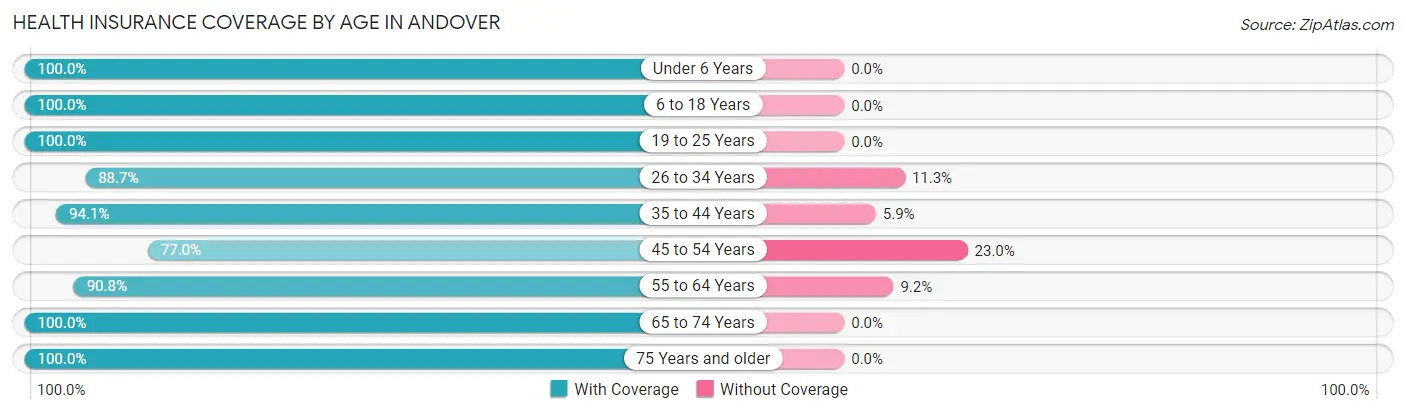
| Age Bracket | With Coverage | Without Coverage |
| Under 6 Years | 49 (100.0%) | 0 (0.0%) |
| 6 to 18 Years | 170 (100.0%) | 0 (0.0%) |
| 19 to 25 Years | 35 (100.0%) | 0 (0.0%) |
| 26 to 34 Years | 149 (88.7%) | 19 (11.3%) |
| 35 to 44 Years | 80 (94.1%) | 5 (5.9%) |
| 45 to 54 Years | 67 (77.0%) | 20 (23.0%) |
| 55 to 64 Years | 208 (90.8%) | 21 (9.2%) |
| 65 to 74 Years | 88 (100.0%) | 0 (0.0%) |
| 75 Years and older | 96 (100.0%) | 0 (0.0%) |
| Total | 942 (93.5%) | 65 (6.5%) |
Health Insurance Coverage by Citizenship Status in Andover
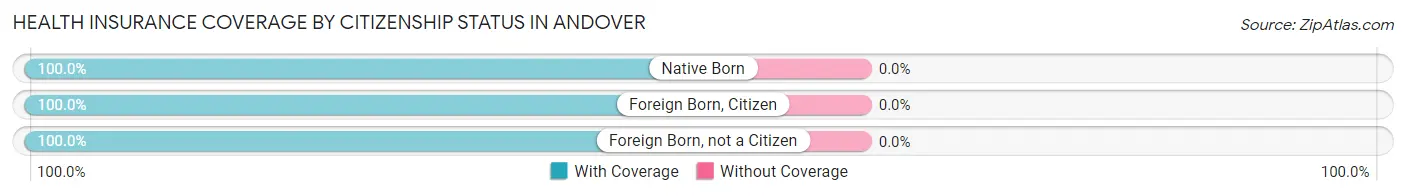
| Citizenship Status | With Coverage | Without Coverage |
| Native Born | 49 (100.0%) | 0 (0.0%) |
| Foreign Born, Citizen | 170 (100.0%) | 0 (0.0%) |
| Foreign Born, not a Citizen | 35 (100.0%) | 0 (0.0%) |
Health Insurance Coverage by Household Income in Andover
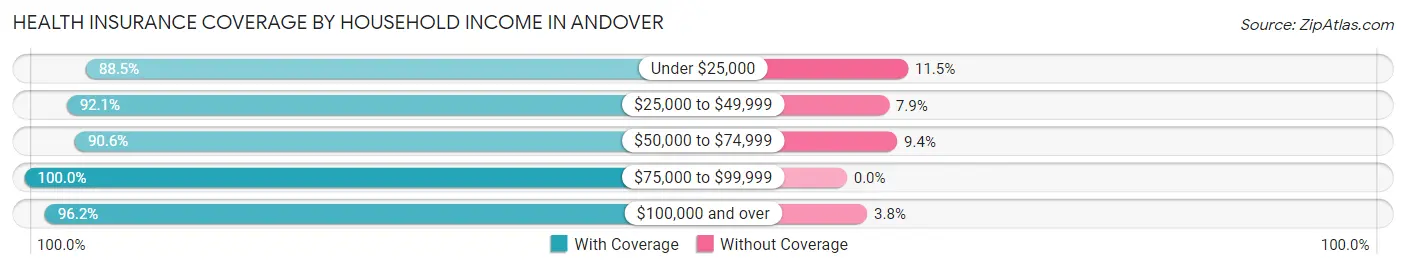
| Household Income | With Coverage | Without Coverage |
| Under $25,000 | 108 (88.5%) | 14 (11.5%) |
| $25,000 to $49,999 | 245 (92.1%) | 21 (7.9%) |
| $50,000 to $74,999 | 163 (90.6%) | 17 (9.4%) |
| $75,000 to $99,999 | 98 (100.0%) | 0 (0.0%) |
| $100,000 and over | 328 (96.2%) | 13 (3.8%) |
Public vs Private Health Insurance Coverage by Age in Andover
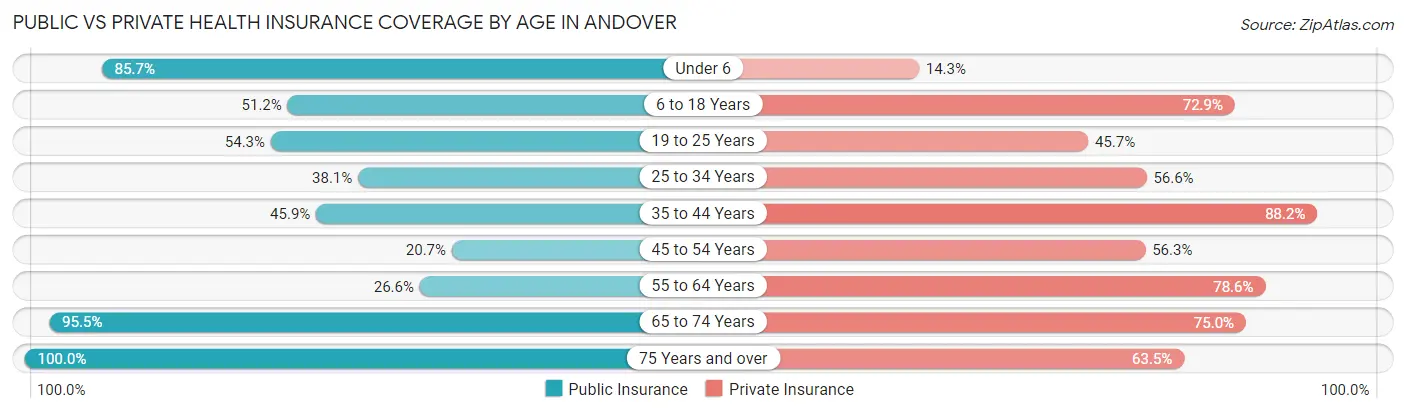
| Age Bracket | Public Insurance | Private Insurance |
| Under 6 | 42 (85.7%) | 7 (14.3%) |
| 6 to 18 Years | 87 (51.2%) | 124 (72.9%) |
| 19 to 25 Years | 19 (54.3%) | 16 (45.7%) |
| 25 to 34 Years | 64 (38.1%) | 95 (56.6%) |
| 35 to 44 Years | 39 (45.9%) | 75 (88.2%) |
| 45 to 54 Years | 18 (20.7%) | 49 (56.3%) |
| 55 to 64 Years | 61 (26.6%) | 180 (78.6%) |
| 65 to 74 Years | 84 (95.5%) | 66 (75.0%) |
| 75 Years and over | 96 (100.0%) | 61 (63.5%) |
| Total | 510 (50.6%) | 673 (66.8%) |
Disability Status by Sex by Age in Andover
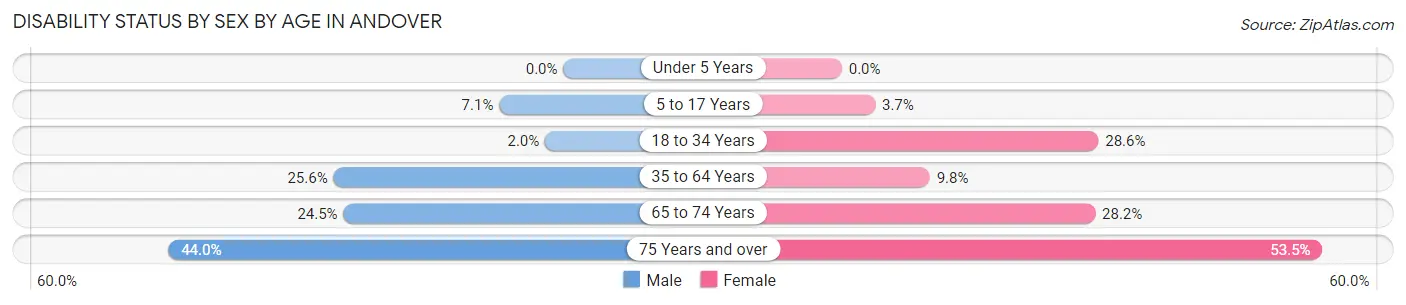
| Age Bracket | Male | Female |
| Under 5 Years | 0 (0.0%) | 0 (0.0%) |
| 5 to 17 Years | 4 (7.1%) | 4 (3.7%) |
| 18 to 34 Years | 3 (2.0%) | 18 (28.6%) |
| 35 to 64 Years | 53 (25.6%) | 19 (9.8%) |
| 65 to 74 Years | 12 (24.5%) | 11 (28.2%) |
| 75 Years and over | 11 (44.0%) | 38 (53.5%) |
Disability Class by Sex by Age in Andover
Disability Class: Hearing Difficulty
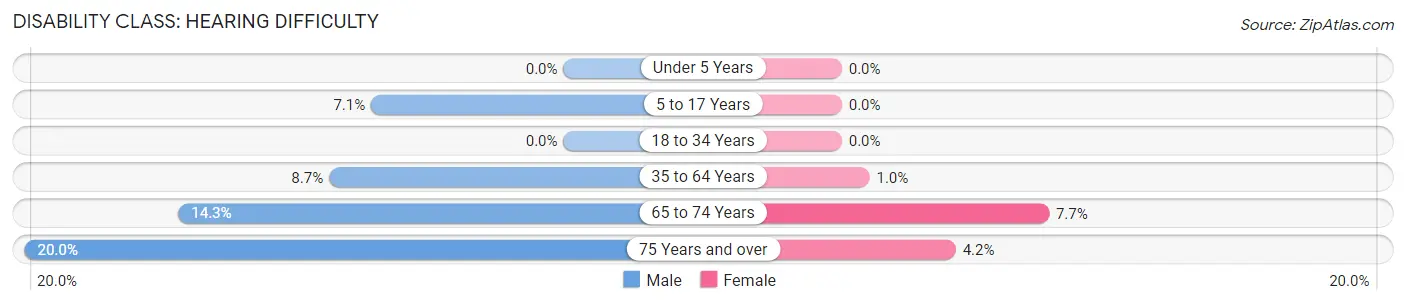
| Age Bracket | Male | Female |
| Under 5 Years | 0 (0.0%) | 0 (0.0%) |
| 5 to 17 Years | 4 (7.1%) | 0 (0.0%) |
| 18 to 34 Years | 0 (0.0%) | 0 (0.0%) |
| 35 to 64 Years | 18 (8.7%) | 2 (1.0%) |
| 65 to 74 Years | 7 (14.3%) | 3 (7.7%) |
| 75 Years and over | 5 (20.0%) | 3 (4.2%) |
Disability Class: Vision Difficulty
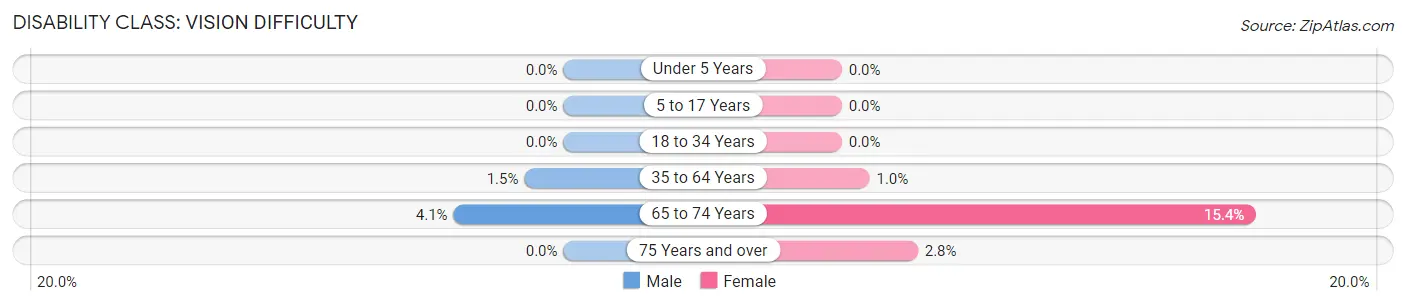
| Age Bracket | Male | Female |
| Under 5 Years | 0 (0.0%) | 0 (0.0%) |
| 5 to 17 Years | 0 (0.0%) | 0 (0.0%) |
| 18 to 34 Years | 0 (0.0%) | 0 (0.0%) |
| 35 to 64 Years | 3 (1.5%) | 2 (1.0%) |
| 65 to 74 Years | 2 (4.1%) | 6 (15.4%) |
| 75 Years and over | 0 (0.0%) | 2 (2.8%) |
Disability Class: Cognitive Difficulty
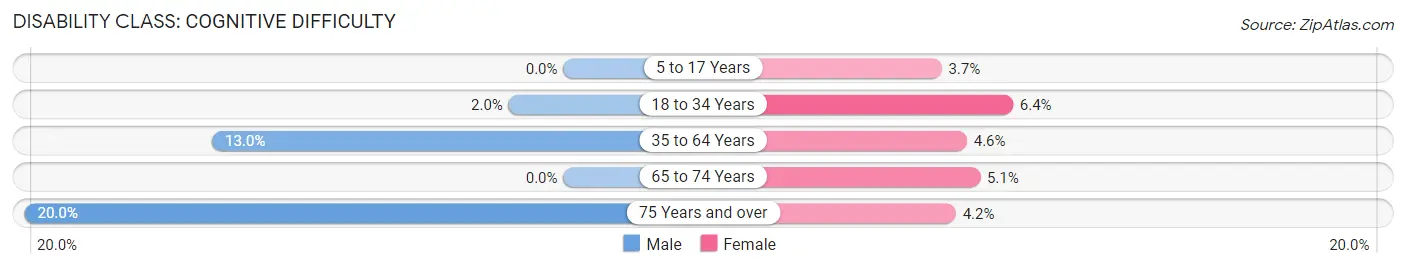
| Age Bracket | Male | Female |
| 5 to 17 Years | 0 (0.0%) | 4 (3.7%) |
| 18 to 34 Years | 3 (2.0%) | 4 (6.4%) |
| 35 to 64 Years | 27 (13.0%) | 9 (4.6%) |
| 65 to 74 Years | 0 (0.0%) | 2 (5.1%) |
| 75 Years and over | 5 (20.0%) | 3 (4.2%) |
Disability Class: Ambulatory Difficulty
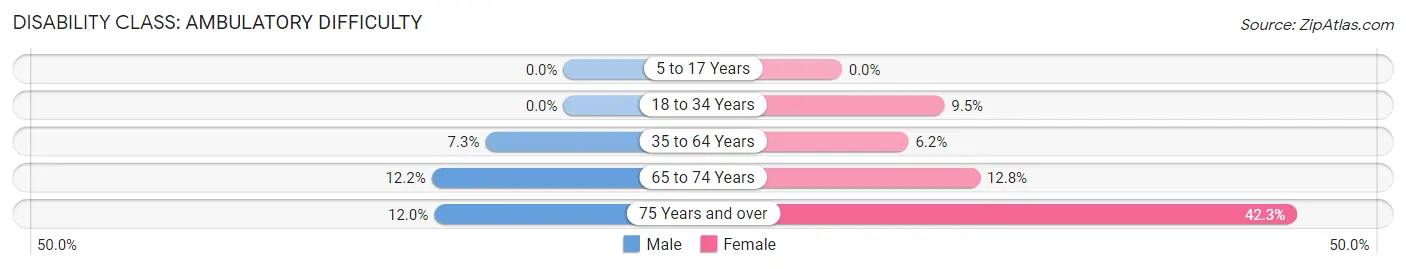
| Age Bracket | Male | Female |
| 5 to 17 Years | 0 (0.0%) | 0 (0.0%) |
| 18 to 34 Years | 0 (0.0%) | 6 (9.5%) |
| 35 to 64 Years | 15 (7.2%) | 12 (6.2%) |
| 65 to 74 Years | 6 (12.2%) | 5 (12.8%) |
| 75 Years and over | 3 (12.0%) | 30 (42.2%) |
Disability Class: Self-Care Difficulty
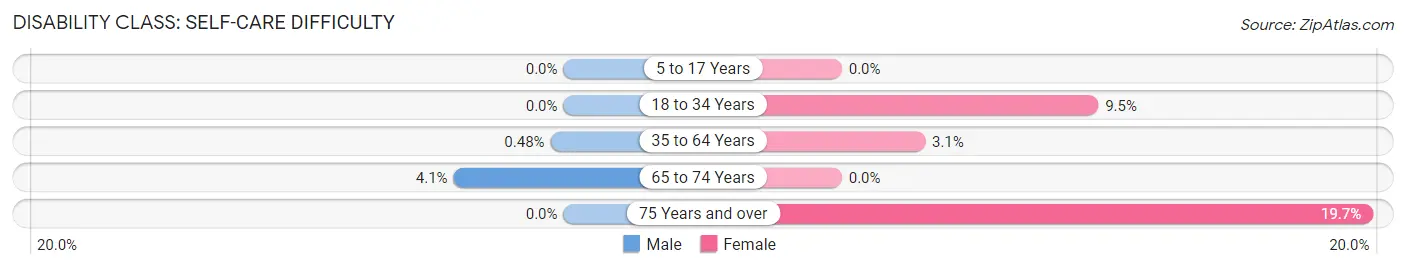
| Age Bracket | Male | Female |
| 5 to 17 Years | 0 (0.0%) | 0 (0.0%) |
| 18 to 34 Years | 0 (0.0%) | 6 (9.5%) |
| 35 to 64 Years | 1 (0.5%) | 6 (3.1%) |
| 65 to 74 Years | 2 (4.1%) | 0 (0.0%) |
| 75 Years and over | 0 (0.0%) | 14 (19.7%) |
Technology Access in Andover
Computing Device Access in Andover
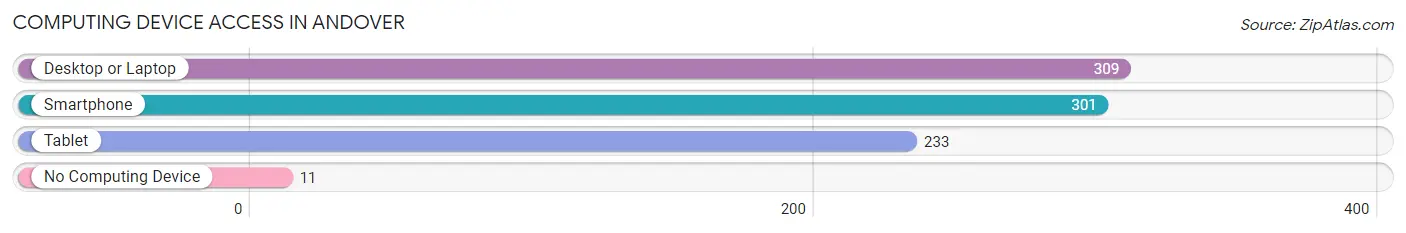
| Device Type | # Households | % Households |
| Desktop or Laptop | 309 | 86.1% |
| Smartphone | 301 | 83.8% |
| Tablet | 233 | 64.9% |
| No Computing Device | 11 | 3.1% |
| Total | 359 | 100.0% |
Internet Access in Andover
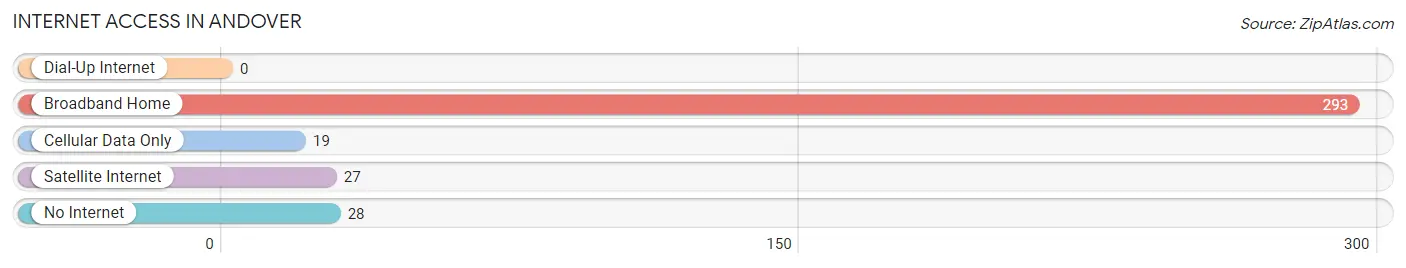
| Internet Type | # Households | % Households |
| Dial-Up Internet | 0 | 0.0% |
| Broadband Home | 293 | 81.6% |
| Cellular Data Only | 19 | 5.3% |
| Satellite Internet | 27 | 7.5% |
| No Internet | 28 | 7.8% |
| Total | 359 | 100.0% |
Andover Summary
Andover is a small town located in Allegany County, New York. It is situated in the southwestern corner of the state, near the Pennsylvania border. The town was first settled in 1808 and was incorporated in 1820. As of the 2010 census, the population of Andover was 1,845.
Geography
Andover is located at 42°14'N 78°14'W (42.23, -78.23). The town is situated in the southwestern corner of Allegany County, near the Pennsylvania border. It is bordered by the towns of Wellsville to the north, Scio to the east, and Bolivar to the south. The town covers an area of approximately 33.5 square miles, with a population density of 55.3 people per square mile.
The terrain of Andover is mostly flat, with some rolling hills in the northern part of the town. The highest point in the town is located at an elevation of 1,890 feet, near the border with Wellsville. The town is drained by several small creeks, including the Genesee River, which forms the western border of the town.
Climate
Andover has a humid continental climate, with cold, snowy winters and warm, humid summers. The average annual temperature is around 45°F, with an average high of around 70°F in the summer and an average low of around 20°F in the winter. The average annual precipitation is around 40 inches, with most of it falling in the form of snow.
Demographics
As of the 2010 census, there were 1,845 people, 745 households, and 498 families residing in the town. The population density was 55.3 people per square mile. The racial makeup of the town was 97.2% White, 0.7% African American, 0.2% Native American, 0.2% Asian, 0.2% from other races, and 1.7% from two or more races. Hispanic or Latino of any race were 1.2% of the population.
There were 745 households, out of which 28.2% had children under the age of 18 living with them, 51.2% were married couples living together, 10.2% had a female householder with no husband present, and 33.7% were non-families. 28.7% of all households were made up of individuals, and 14.2% had someone living alone who was 65 years of age or older. The average household size was 2.45 and the average family size was 2.98.
The median age in the town was 42.3 years. 22.7% of residents were under the age of 18; 6.7% were between the ages of 18 and 24; 24.2% were from 25 to 44; 28.2% were from 45 to 64; and 18.2% were 65 years of age or older. The gender makeup of the town was 48.2% male and 51.8% female.
Economy
The economy of Andover is largely based on agriculture and tourism. The town is home to several small farms, which produce a variety of crops, including corn, soybeans, hay, and wheat. The town is also home to several small businesses, including restaurants, retail stores, and service providers.
Tourism is an important part of the local economy, as the town is home to several attractions, including the Andover Historical Society Museum, the Andover Opera House, and the Andover Country Club. The town also hosts several annual events, including the Andover Summer Festival and the Andover Fall Festival.
Conclusion
Andover is a small town located in Allegany County, New York. It is situated in the southwestern corner of the state, near the Pennsylvania border. The town was first settled in 1808 and was incorporated in 1820. As of the 2010 census, the population of Andover was 1,845. The town is mostly flat, with some rolling hills in the northern part of the town. The economy of Andover is largely based on agriculture and tourism. The town is home to several small farms, which produce a variety of crops, and several small businesses, including restaurants, retail stores, and service providers. Tourism is also an important part of the local economy, as the town is home to several attractions and hosts several annual events.
Common Questions
What is Per Capita Income in Andover?
Per Capita income in Andover is $34,704.
What is the Median Family Income in Andover?
Median Family Income in Andover is $72,750.
What is the Median Household income in Andover?
Median Household Income in Andover is $61,172.
What is Income or Wage Gap in Andover?
Income or Wage Gap in Andover is 32.4%.
Women in Andover earn 67.6 cents for every dollar earned by a man.
What is Inequality or Gini Index in Andover?
Inequality or Gini Index in Andover is 0.45.
What is the Total Population of Andover?
Total Population of Andover is 1,018.
What is the Total Male Population of Andover?
Total Male Population of Andover is 537.
What is the Total Female Population of Andover?
Total Female Population of Andover is 481.
What is the Ratio of Males per 100 Females in Andover?
There are 111.64 Males per 100 Females in Andover.
What is the Ratio of Females per 100 Males in Andover?
There are 89.57 Females per 100 Males in Andover.
What is the Median Population Age in Andover?
Median Population Age in Andover is 41.9 Years.
What is the Average Family Size in Andover
Average Family Size in Andover is 3.3 People.
What is the Average Household Size in Andover
Average Household Size in Andover is 2.8 People.
How Large is the Labor Force in Andover?
There are 521 People in the Labor Forcein in Andover.
What is the Percentage of People in the Labor Force in Andover?
62.5% of People are in the Labor Force in Andover.
What is the Unemployment Rate in Andover?
Unemployment Rate in Andover is 10.0%.