Chestertown, NY Map & Demographics
Chestertown Map
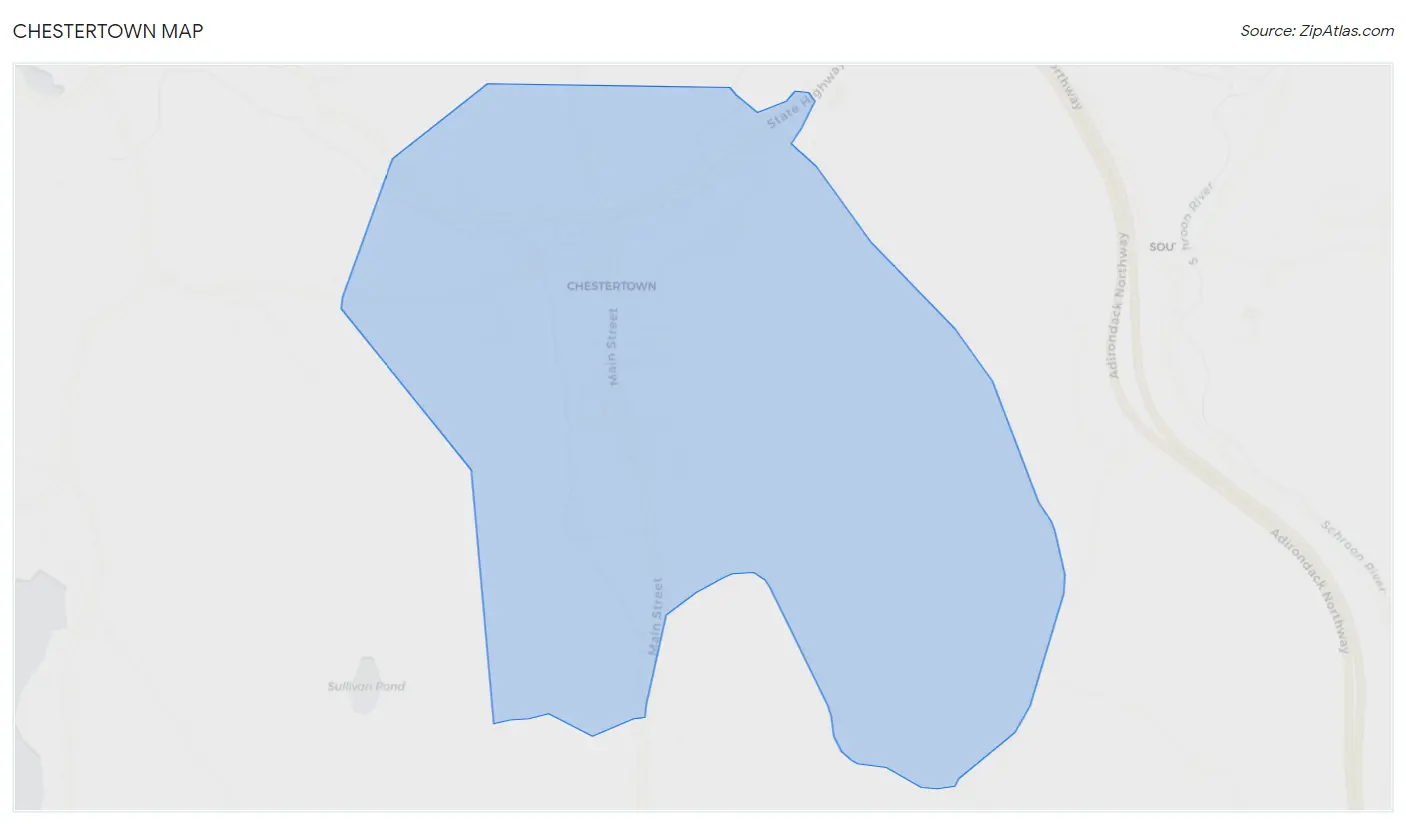
Chestertown Overview
$29,410
PER CAPITA INCOME
$49,261
AVG FAMILY INCOME
$61,423
AVG HOUSEHOLD INCOME
43.0%
WAGE / INCOME GAP [ % ]
57.0¢/ $1
WAGE / INCOME GAP [ $ ]
0.31
INEQUALITY / GINI INDEX
558
TOTAL POPULATION
234
MALE POPULATION
324
FEMALE POPULATION
72.22
MALES / 100 FEMALES
138.46
FEMALES / 100 MALES
39.1
MEDIAN AGE
2.6
AVG FAMILY SIZE
2.3
AVG HOUSEHOLD SIZE
372
LABOR FORCE [ PEOPLE ]
74.5%
PERCENT IN LABOR FORCE
22.6%
UNEMPLOYMENT RATE
Chestertown Zip Codes
Chestertown Area Codes
Income in Chestertown
Income Overview in Chestertown
Per Capita Income in Chestertown is $29,410, while median incomes of families and households are $49,261 and $61,423 respectively.
| Characteristic | Number | Measure |
| Per Capita Income | 558 | $29,410 |
| Median Family Income | 167 | $49,261 |
| Mean Family Income | 167 | $61,099 |
| Median Household Income | 238 | $61,423 |
| Mean Household Income | 238 | $75,444 |
| Income Deficit | 167 | $0 |
| Wage / Income Gap (%) | 558 | 43.00% |
| Wage / Income Gap ($) | 558 | 57.00¢ per $1 |
| Gini / Inequality Index | 558 | 0.31 |
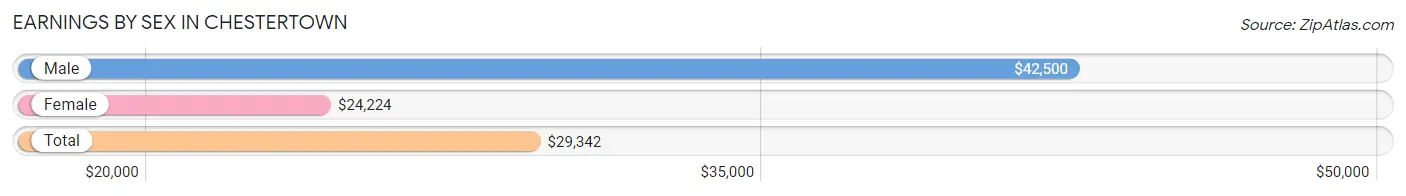
Earnings by Sex in Chestertown
Average Earnings in Chestertown are $29,342, $42,500 for men and $24,224 for women, a difference of 43.0%.
| Sex | Number | Average Earnings |
| Male | 208 (47.9%) | $42,500 |
| Female | 226 (52.1%) | $24,224 |
| Total | 434 (100.0%) | $29,342 |
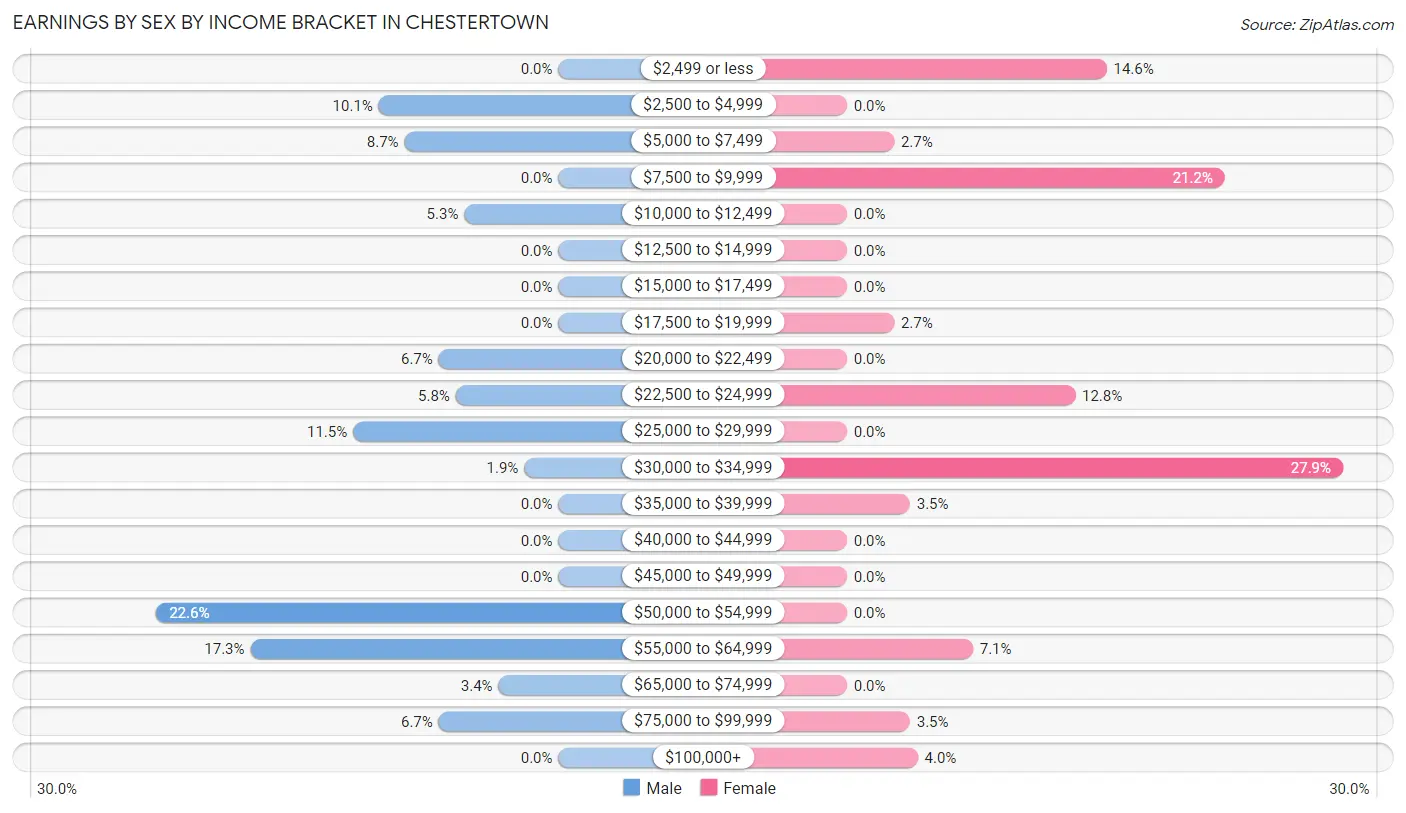
Earnings by Sex by Income Bracket in Chestertown
The most common earnings brackets in Chestertown are $50,000 to $54,999 for men (47 | 22.6%) and $30,000 to $34,999 for women (63 | 27.9%).
| Income | Male | Female |
| $2,499 or less | 0 (0.0%) | 33 (14.6%) |
| $2,500 to $4,999 | 21 (10.1%) | 0 (0.0%) |
| $5,000 to $7,499 | 18 (8.6%) | 6 (2.6%) |
| $7,500 to $9,999 | 0 (0.0%) | 48 (21.2%) |
| $10,000 to $12,499 | 11 (5.3%) | 0 (0.0%) |
| $12,500 to $14,999 | 0 (0.0%) | 0 (0.0%) |
| $15,000 to $17,499 | 0 (0.0%) | 0 (0.0%) |
| $17,500 to $19,999 | 0 (0.0%) | 6 (2.6%) |
| $20,000 to $22,499 | 14 (6.7%) | 0 (0.0%) |
| $22,500 to $24,999 | 12 (5.8%) | 29 (12.8%) |
| $25,000 to $29,999 | 24 (11.5%) | 0 (0.0%) |
| $30,000 to $34,999 | 4 (1.9%) | 63 (27.9%) |
| $35,000 to $39,999 | 0 (0.0%) | 8 (3.5%) |
| $40,000 to $44,999 | 0 (0.0%) | 0 (0.0%) |
| $45,000 to $49,999 | 0 (0.0%) | 0 (0.0%) |
| $50,000 to $54,999 | 47 (22.6%) | 0 (0.0%) |
| $55,000 to $64,999 | 36 (17.3%) | 16 (7.1%) |
| $65,000 to $74,999 | 7 (3.4%) | 0 (0.0%) |
| $75,000 to $99,999 | 14 (6.7%) | 8 (3.5%) |
| $100,000+ | 0 (0.0%) | 9 (4.0%) |
| Total | 208 (100.0%) | 226 (100.0%) |
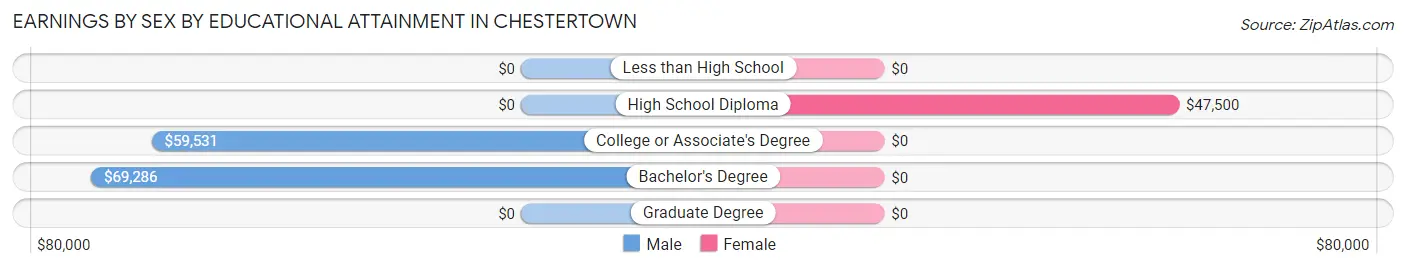
Earnings by Sex by Educational Attainment in Chestertown
Average earnings in Chestertown are $52,568 for men and $33,750 for women, a difference of 35.8%. Men with an educational attainment of bachelor's degree enjoy the highest average annual earnings of $69,286, while those with college or associate's degree education earn the least with $59,531. Women with an educational attainment of high school diploma earn the most with the average annual earnings of $47,500, while those with high school diploma education have the smallest earnings of $47,500.
| Educational Attainment | Male Income | Female Income |
| Less than High School | - | - |
| High School Diploma | - | - |
| College or Associate's Degree | $59,531 | $0 |
| Bachelor's Degree | $69,286 | $0 |
| Graduate Degree | - | - |
| Total | $52,568 | $33,750 |
Family Income in Chestertown
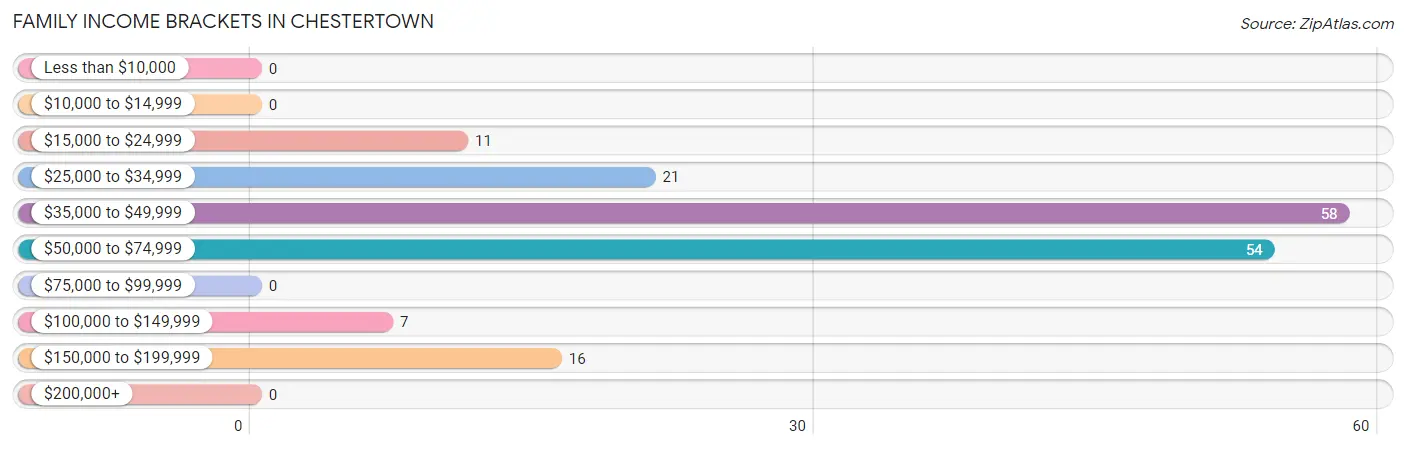
Family Income Brackets in Chestertown
According to the Chestertown family income data, there are 58 families falling into the $35,000 to $49,999 income range, which is the most common income bracket and makes up 34.7% of all families.
| Income Bracket | # Families | % Families |
| Less than $10,000 | 0 | 0.0% |
| $10,000 to $14,999 | 0 | 0.0% |
| $15,000 to $24,999 | 11 | 6.6% |
| $25,000 to $34,999 | 21 | 12.6% |
| $35,000 to $49,999 | 58 | 34.7% |
| $50,000 to $74,999 | 54 | 32.3% |
| $75,000 to $99,999 | 0 | 0.0% |
| $100,000 to $149,999 | 7 | 4.2% |
| $150,000 to $199,999 | 16 | 9.6% |
| $200,000+ | 0 | 0.0% |
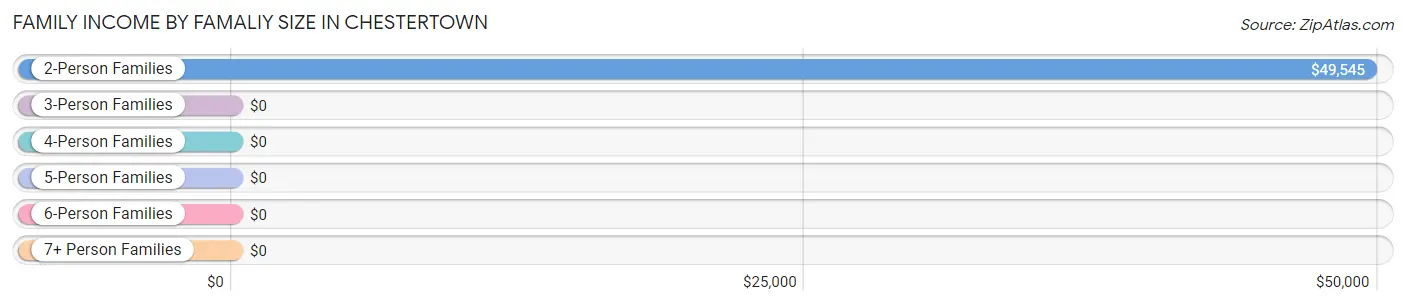
Family Income by Famaliy Size in Chestertown
2-person families (108 | 64.7%) account for the highest median family income in Chestertown with $49,545 per family, while 2-person families (108 | 64.7%) have the highest median income of $24,772 per family member.
| Income Bracket | # Families | Median Income |
| 2-Person Families | 108 (64.7%) | $49,545 |
| 3-Person Families | 32 (19.2%) | $0 |
| 4-Person Families | 27 (16.2%) | $0 |
| 5-Person Families | 0 (0.0%) | $0 |
| 6-Person Families | 0 (0.0%) | $0 |
| 7+ Person Families | 0 (0.0%) | $0 |
| Total | 167 (100.0%) | $49,261 |
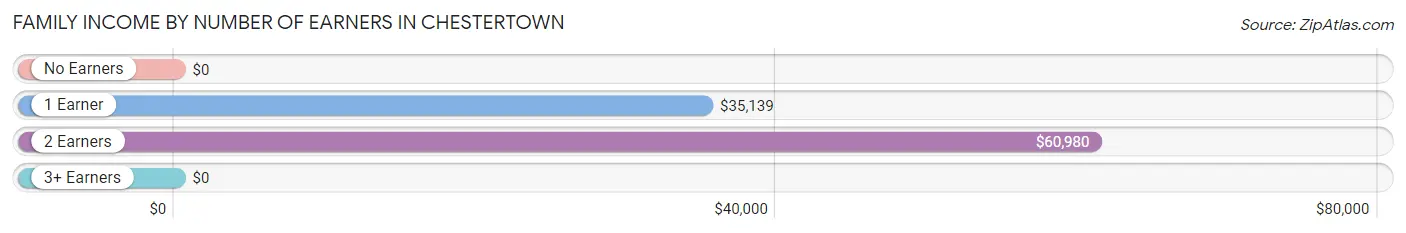
Family Income by Number of Earners in Chestertown
| Number of Earners | # Families | Median Income |
| No Earners | 0 (0.0%) | $0 |
| 1 Earner | 68 (40.7%) | $35,139 |
| 2 Earners | 83 (49.7%) | $60,980 |
| 3+ Earners | 16 (9.6%) | $0 |
| Total | 167 (100.0%) | $49,261 |
Household Income in Chestertown
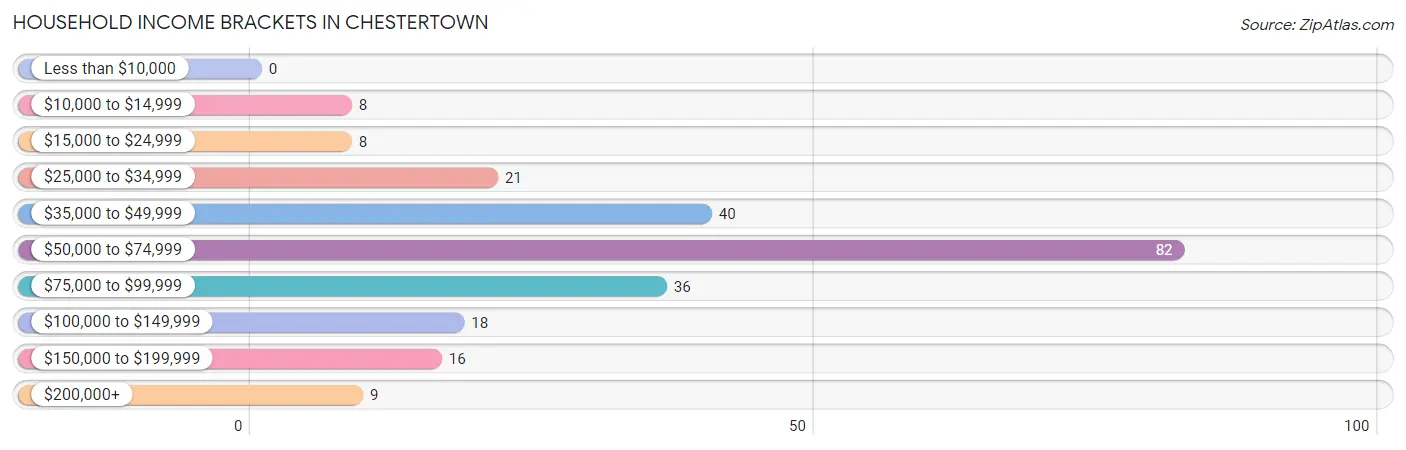
Household Income Brackets in Chestertown
With 82 households falling in the category, the $50,000 to $74,999 income range is the most frequent in Chestertown, accounting for 34.4% of all households.
| Income Bracket | # Households | % Households |
| Less than $10,000 | 0 | 0.0% |
| $10,000 to $14,999 | 8 | 3.4% |
| $15,000 to $24,999 | 8 | 3.4% |
| $25,000 to $34,999 | 21 | 8.8% |
| $35,000 to $49,999 | 40 | 16.8% |
| $50,000 to $74,999 | 82 | 34.5% |
| $75,000 to $99,999 | 36 | 15.1% |
| $100,000 to $149,999 | 18 | 7.6% |
| $150,000 to $199,999 | 16 | 6.7% |
| $200,000+ | 9 | 3.8% |
Household Income by Householder Age in Chestertown
The median household income in Chestertown is $61,423, with the highest median household income of $105,568 found in the 25 to 44 years age bracket for the primary householder. A total of 49 households (20.6%) fall into this category. Meanwhile, the 15 to 24 years age bracket for the primary householder has the lowest median household income of $0, with 36 households (15.1%) in this group.
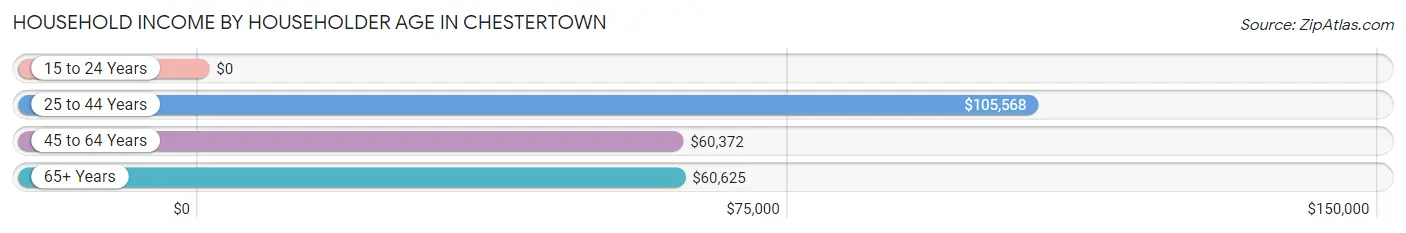
| Income Bracket | # Households | Median Income |
| 15 to 24 Years | 36 (15.1%) | $0 |
| 25 to 44 Years | 49 (20.6%) | $105,568 |
| 45 to 64 Years | 111 (46.6%) | $60,372 |
| 65+ Years | 42 (17.6%) | $60,625 |
| Total | 238 (100.0%) | $61,423 |
Poverty in Chestertown
Income Below Poverty by Sex and Age in Chestertown
With 21.4% poverty level for males and 5.6% for females among the residents of Chestertown, 6 to 11 year old males and 6 to 11 year old females are the most vulnerable to poverty, with 10 males (100.0%) and 18 females (66.7%) in their respective age groups living below the poverty level.
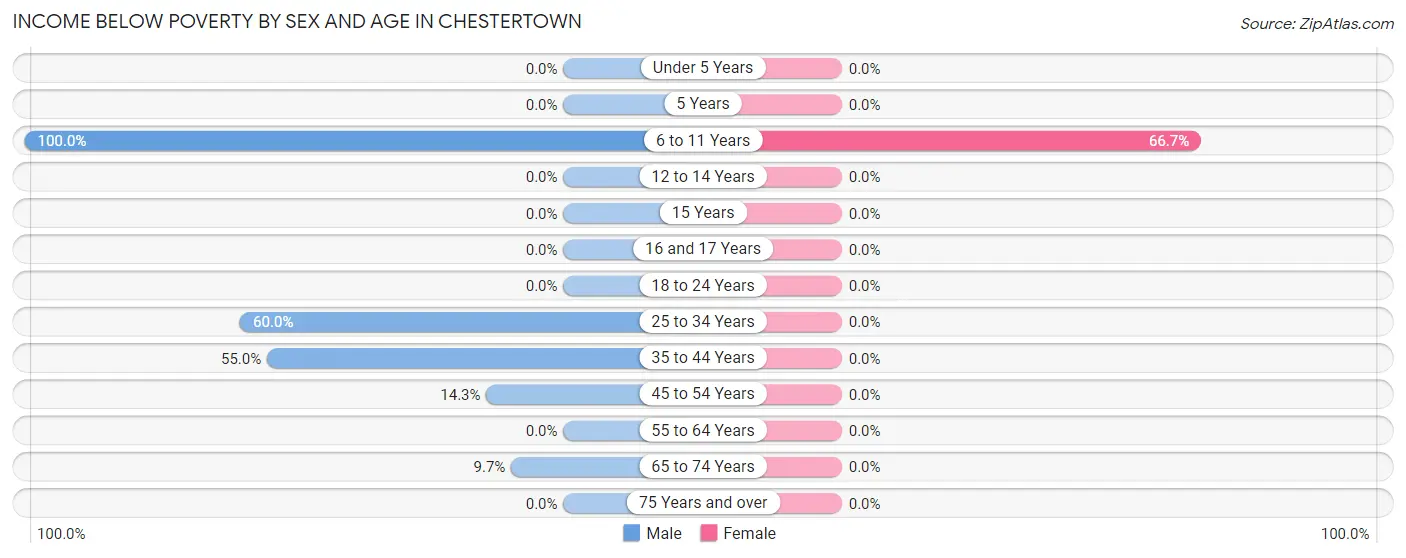
| Age Bracket | Male | Female |
| Under 5 Years | 0 (0.0%) | 0 (0.0%) |
| 5 Years | 0 (0.0%) | 0 (0.0%) |
| 6 to 11 Years | 10 (100.0%) | 18 (66.7%) |
| 12 to 14 Years | 0 (0.0%) | 0 (0.0%) |
| 15 Years | 0 (0.0%) | 0 (0.0%) |
| 16 and 17 Years | 0 (0.0%) | 0 (0.0%) |
| 18 to 24 Years | 0 (0.0%) | 0 (0.0%) |
| 25 to 34 Years | 18 (60.0%) | 0 (0.0%) |
| 35 to 44 Years | 11 (55.0%) | 0 (0.0%) |
| 45 to 54 Years | 8 (14.3%) | 0 (0.0%) |
| 55 to 64 Years | 0 (0.0%) | 0 (0.0%) |
| 65 to 74 Years | 3 (9.7%) | 0 (0.0%) |
| 75 Years and over | 0 (0.0%) | 0 (0.0%) |
| Total | 50 (21.4%) | 18 (5.6%) |
Income Above Poverty by Sex and Age in Chestertown
According to the poverty statistics in Chestertown, males aged 18 to 24 years and females aged under 5 years are the age groups that are most secure financially, with 100.0% of males and 100.0% of females in these age groups living above the poverty line.
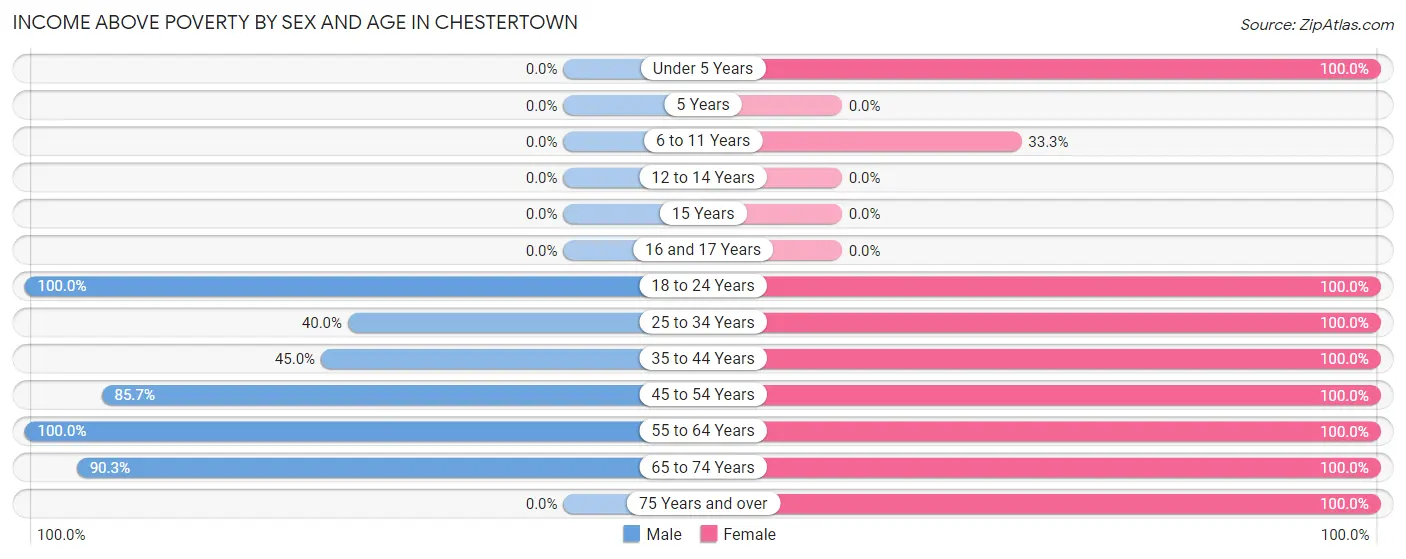
| Age Bracket | Male | Female |
| Under 5 Years | 0 (0.0%) | 22 (100.0%) |
| 5 Years | 0 (0.0%) | 0 (0.0%) |
| 6 to 11 Years | 0 (0.0%) | 9 (33.3%) |
| 12 to 14 Years | 0 (0.0%) | 0 (0.0%) |
| 15 Years | 0 (0.0%) | 0 (0.0%) |
| 16 and 17 Years | 0 (0.0%) | 0 (0.0%) |
| 18 to 24 Years | 22 (100.0%) | 117 (100.0%) |
| 25 to 34 Years | 12 (40.0%) | 37 (100.0%) |
| 35 to 44 Years | 9 (45.0%) | 33 (100.0%) |
| 45 to 54 Years | 48 (85.7%) | 43 (100.0%) |
| 55 to 64 Years | 65 (100.0%) | 25 (100.0%) |
| 65 to 74 Years | 28 (90.3%) | 6 (100.0%) |
| 75 Years and over | 0 (0.0%) | 14 (100.0%) |
| Total | 184 (78.6%) | 306 (94.4%) |
Income Below Poverty Among Married-Couple Families in Chestertown
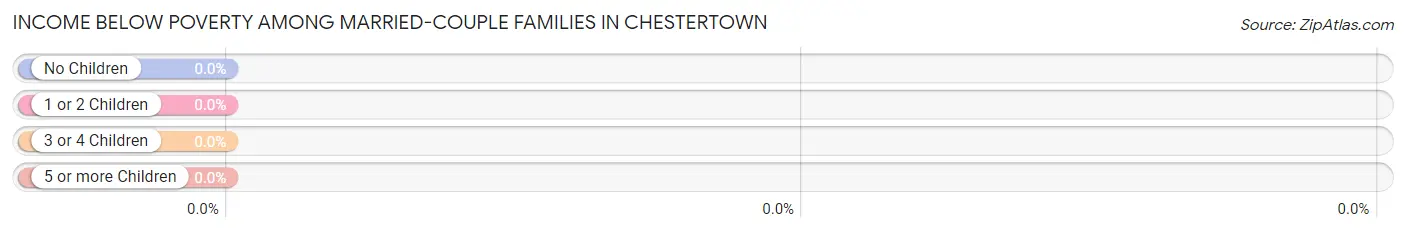
| Children | Above Poverty | Below Poverty |
| No Children | 66 (100.0%) | 0 (0.0%) |
| 1 or 2 Children | 4 (100.0%) | 0 (0.0%) |
| 3 or 4 Children | 0 (0.0%) | 0 (0.0%) |
| 5 or more Children | 0 (0.0%) | 0 (0.0%) |
| Total | 70 (100.0%) | 0 (0.0%) |
Income Below Poverty Among Single-Parent Households in Chestertown
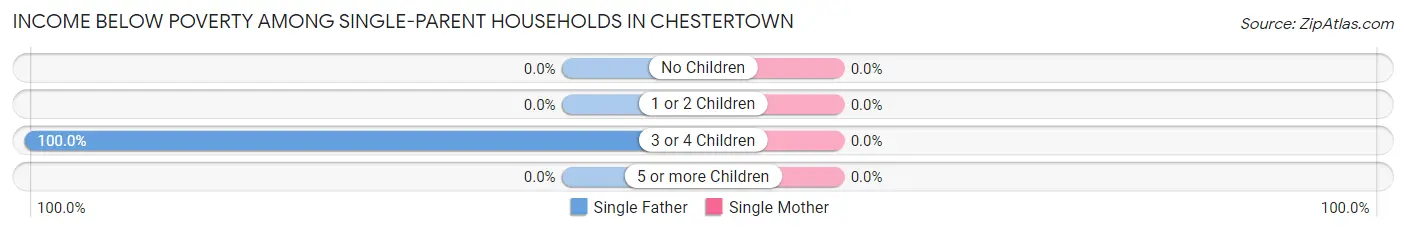
| Children | Single Father | Single Mother |
| No Children | 0 (0.0%) | 0 (0.0%) |
| 1 or 2 Children | 0 (0.0%) | 0 (0.0%) |
| 3 or 4 Children | 11 (100.0%) | 0 (0.0%) |
| 5 or more Children | 0 (0.0%) | 0 (0.0%) |
| Total | 11 (20.0%) | 0 (0.0%) |
Income Below Poverty Among Married-Couple vs Single-Parent Households in Chestertown
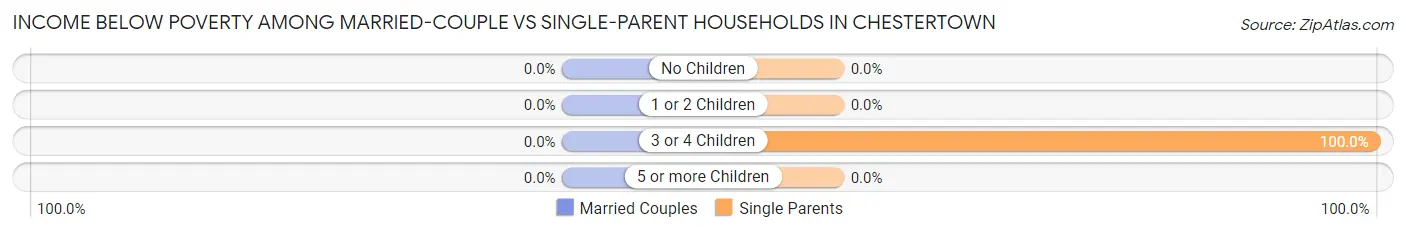
| Children | Married-Couple Families | Single-Parent Households |
| No Children | 0 (0.0%) | 0 (0.0%) |
| 1 or 2 Children | 0 (0.0%) | 0 (0.0%) |
| 3 or 4 Children | 0 (0.0%) | 11 (100.0%) |
| 5 or more Children | 0 (0.0%) | 0 (0.0%) |
| Total | 0 (0.0%) | 11 (11.3%) |
Race in Chestertown
The most populous races in Chestertown are White / Caucasian (521 | 93.4%), Two or more Races (23 | 4.1%), and Some other Race (14 | 2.5%).
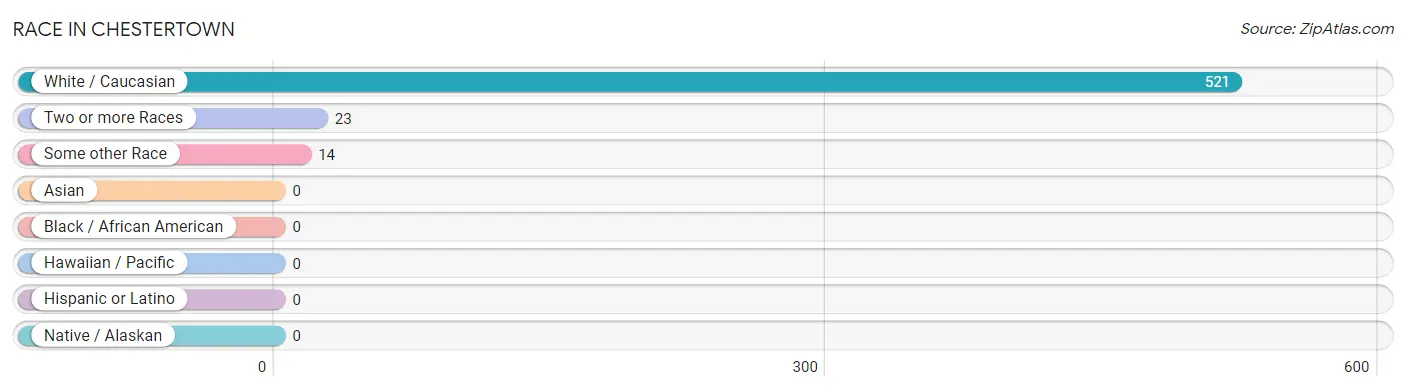
| Race | # Population | % Population |
| Asian | 0 | 0.0% |
| Black / African American | 0 | 0.0% |
| Hawaiian / Pacific | 0 | 0.0% |
| Hispanic or Latino | 0 | 0.0% |
| Native / Alaskan | 0 | 0.0% |
| White / Caucasian | 521 | 93.4% |
| Two or more Races | 23 | 4.1% |
| Some other Race | 14 | 2.5% |
| Total | 558 | 100.0% |
Ancestry in Chestertown
The most populous ancestries reported in Chestertown are Irish (348 | 62.4%), German (119 | 21.3%), European (68 | 12.2%), Norwegian (22 | 3.9%), and English (15 | 2.7%), together accounting for 102.5% of all Chestertown residents.
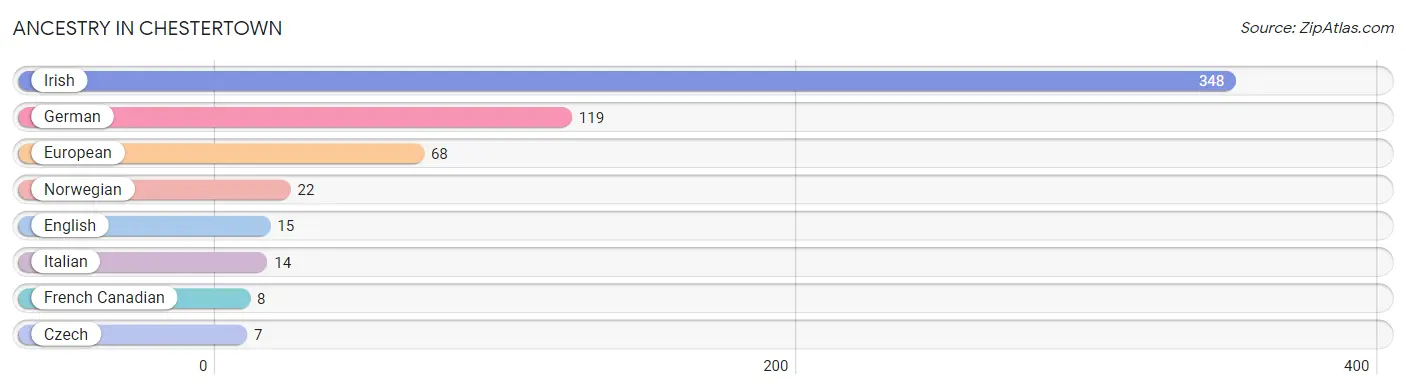
| Ancestry | # Population | % Population |
| Czech | 7 | 1.3% |
| English | 15 | 2.7% |
| European | 68 | 12.2% |
| French Canadian | 8 | 1.4% |
| German | 119 | 21.3% |
| Irish | 348 | 62.4% |
| Italian | 14 | 2.5% |
| Norwegian | 22 | 3.9% | View All 8 Rows |
Immigrants in Chestertown
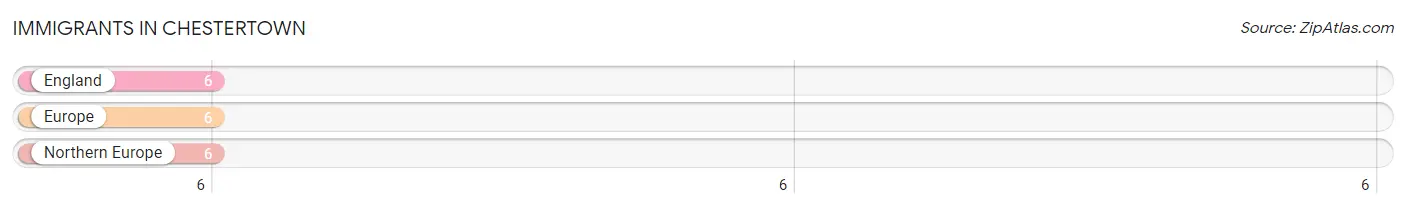
The most numerous immigrant groups reported in Chestertown came from England (6 | 1.1%), Europe (6 | 1.1%), and Northern Europe (6 | 1.1%), together accounting for 3.2% of all Chestertown residents.
| Immigration Origin | # Population | % Population |
| England | 6 | 1.1% |
| Europe | 6 | 1.1% |
| Northern Europe | 6 | 1.1% | View All 3 Rows |
Sex and Age in Chestertown
Sex and Age in Chestertown
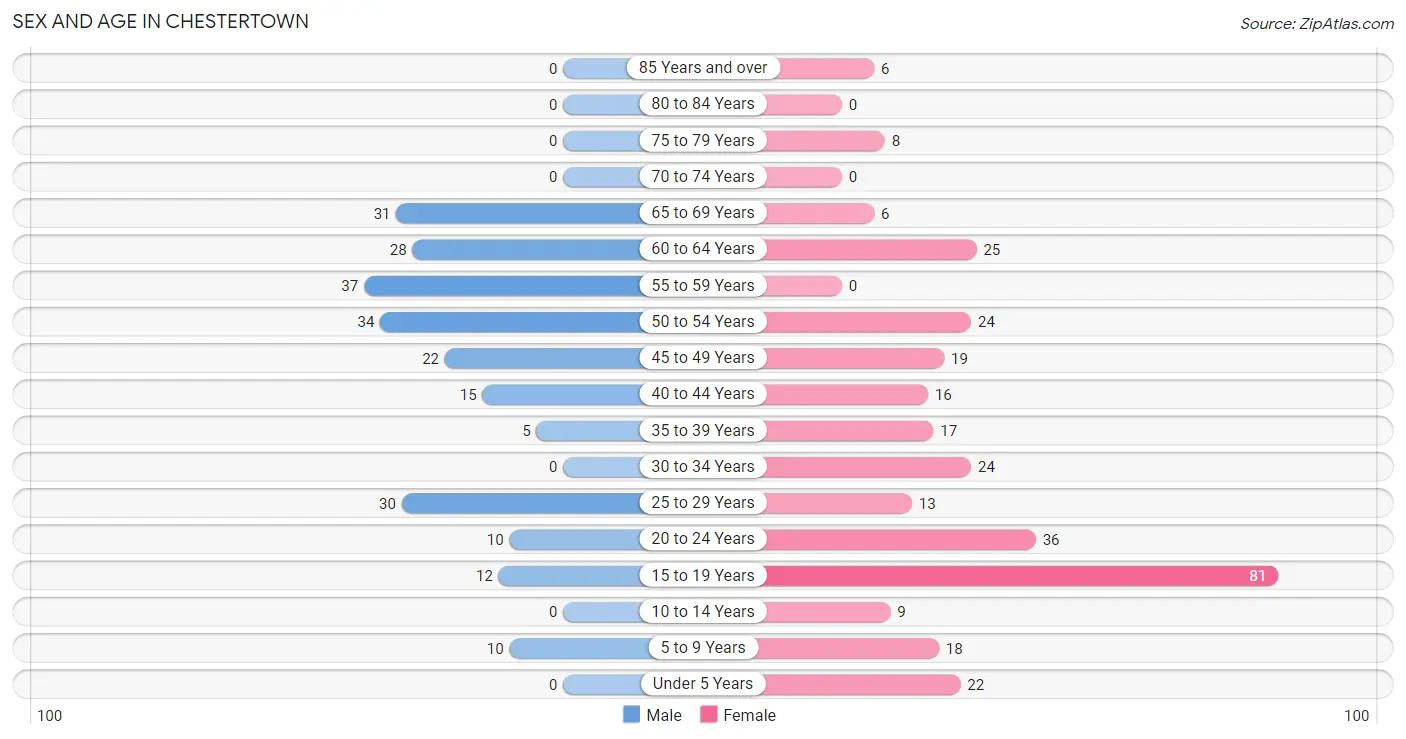
The most populous age groups in Chestertown are 55 to 59 Years (37 | 15.8%) for men and 15 to 19 Years (81 | 25.0%) for women.
| Age Bracket | Male | Female |
| Under 5 Years | 0 (0.0%) | 22 (6.8%) |
| 5 to 9 Years | 10 (4.3%) | 18 (5.6%) |
| 10 to 14 Years | 0 (0.0%) | 9 (2.8%) |
| 15 to 19 Years | 12 (5.1%) | 81 (25.0%) |
| 20 to 24 Years | 10 (4.3%) | 36 (11.1%) |
| 25 to 29 Years | 30 (12.8%) | 13 (4.0%) |
| 30 to 34 Years | 0 (0.0%) | 24 (7.4%) |
| 35 to 39 Years | 5 (2.1%) | 17 (5.2%) |
| 40 to 44 Years | 15 (6.4%) | 16 (4.9%) |
| 45 to 49 Years | 22 (9.4%) | 19 (5.9%) |
| 50 to 54 Years | 34 (14.5%) | 24 (7.4%) |
| 55 to 59 Years | 37 (15.8%) | 0 (0.0%) |
| 60 to 64 Years | 28 (12.0%) | 25 (7.7%) |
| 65 to 69 Years | 31 (13.3%) | 6 (1.8%) |
| 70 to 74 Years | 0 (0.0%) | 0 (0.0%) |
| 75 to 79 Years | 0 (0.0%) | 8 (2.5%) |
| 80 to 84 Years | 0 (0.0%) | 0 (0.0%) |
| 85 Years and over | 0 (0.0%) | 6 (1.8%) |
| Total | 234 (100.0%) | 324 (100.0%) |
Families and Households in Chestertown
Median Family Size in Chestertown
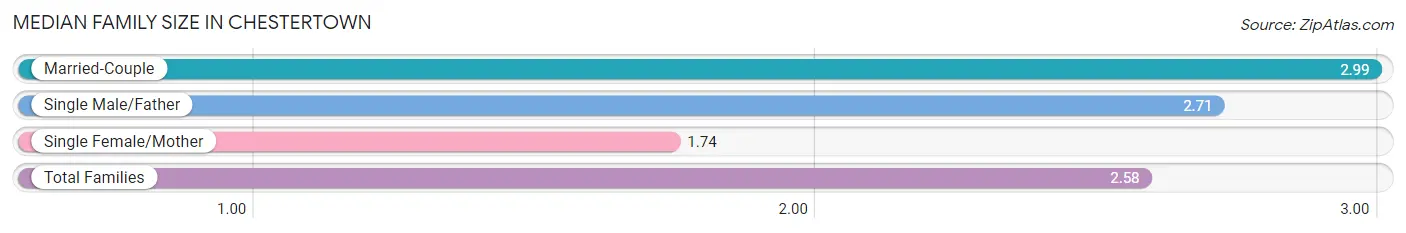
The median family size in Chestertown is 2.58 persons per family, with married-couple families (70 | 41.9%) accounting for the largest median family size of 2.99 persons per family. On the other hand, single female/mother families (42 | 25.2%) represent the smallest median family size with 1.74 persons per family.
| Family Type | # Families | Family Size |
| Married-Couple | 70 (41.9%) | 2.99 |
| Single Male/Father | 55 (32.9%) | 2.71 |
| Single Female/Mother | 42 (25.2%) | 1.74 |
| Total Families | 167 (100.0%) | 2.58 |
Median Household Size in Chestertown
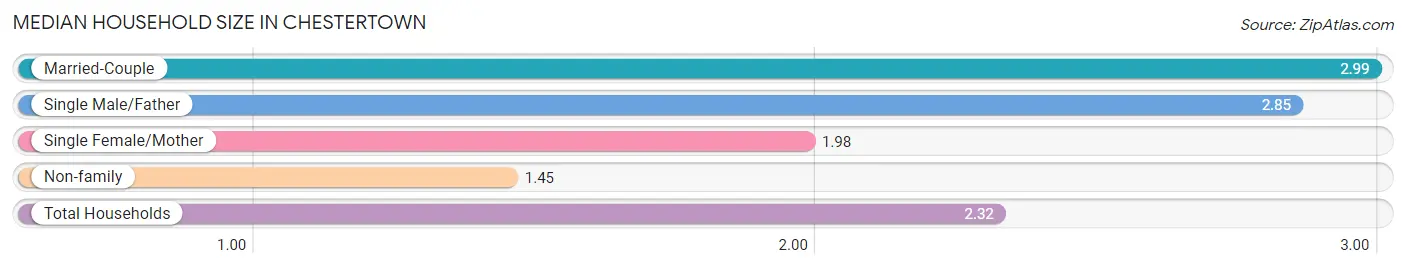
The median household size in Chestertown is 2.32 persons per household, with married-couple households (70 | 29.4%) accounting for the largest median household size of 2.99 persons per household. non-family households (71 | 29.8%) represent the smallest median household size with 1.45 persons per household.
| Household Type | # Households | Household Size |
| Married-Couple | 70 (29.4%) | 2.99 |
| Single Male/Father | 55 (23.1%) | 2.85 |
| Single Female/Mother | 42 (17.6%) | 1.98 |
| Non-family | 71 (29.8%) | 1.45 |
| Total Households | 238 (100.0%) | 2.32 |
Household Size by Marriage Status in Chestertown
Out of a total of 238 households in Chestertown, 167 (70.2%) are family households, while 71 (29.8%) are nonfamily households. The most numerous type of family households are 2-person households, comprising 72, and the most common type of nonfamily households are 1-person households, comprising 36.
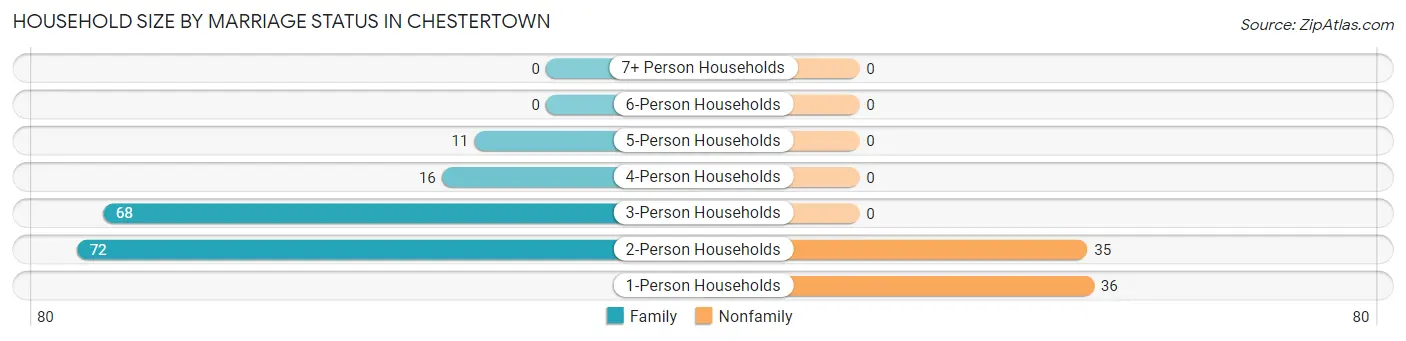
| Household Size | Family Households | Nonfamily Households |
| 1-Person Households | - | 36 (15.1%) |
| 2-Person Households | 72 (30.2%) | 35 (14.7%) |
| 3-Person Households | 68 (28.6%) | 0 (0.0%) |
| 4-Person Households | 16 (6.7%) | 0 (0.0%) |
| 5-Person Households | 11 (4.6%) | 0 (0.0%) |
| 6-Person Households | 0 (0.0%) | 0 (0.0%) |
| 7+ Person Households | 0 (0.0%) | 0 (0.0%) |
| Total | 167 (70.2%) | 71 (29.8%) |
Female Fertility in Chestertown
Fertility by Age in Chestertown
| Age Bracket | Women with Births | Births / 1,000 Women |
| 15 to 19 years | 0 (0.0%) | 0.0 |
| 20 to 34 years | 0 (0.0%) | 0.0 |
| 35 to 50 years | 0 (0.0%) | 0.0 |
| Total | 0 (0.0%) | 0.0 |
Fertility by Age by Marriage Status in Chestertown
| Age Bracket | Married | Unmarried |
| 15 to 19 years | 0 (0.0%) | 0 (0.0%) |
| 20 to 34 years | 0 (0.0%) | 0 (0.0%) |
| 35 to 50 years | 0 (0.0%) | 0 (0.0%) |
| Total | 0 (0.0%) | 0 (0.0%) |
Fertility by Education in Chestertown
| Educational Attainment | Women with Births | Births / 1,000 Women |
| Less than High School | 0 (0.0%) | 0.0 |
| High School Diploma | 0 (0.0%) | 0.0 |
| College or Associate's Degree | 0 (0.0%) | 0.0 |
| Bachelor's Degree | 0 (0.0%) | 0.0 |
| Graduate Degree | 0 (0.0%) | 0.0 |
| Total | 0 (0.0%) | 0.0 |
Fertility by Education by Marriage Status in Chestertown
| Educational Attainment | Married | Unmarried |
| Less than High School | 0 (0.0%) | 0 (0.0%) |
| High School Diploma | 0 (0.0%) | 0 (0.0%) |
| College or Associate's Degree | 0 (0.0%) | 0 (0.0%) |
| Bachelor's Degree | 0 (0.0%) | 0 (0.0%) |
| Graduate Degree | 0 (0.0%) | 0 (0.0%) |
| Total | 0 (0.0%) | 0 (0.0%) |
Employment Characteristics in Chestertown
Employment by Class of Employer in Chestertown
Among the 281 employed individuals in Chestertown, private company employees (178 | 63.3%), self-employed (not incorporated) (51 | 18.1%), and state government employees (28 | 10.0%) make up the most common classes of employment.
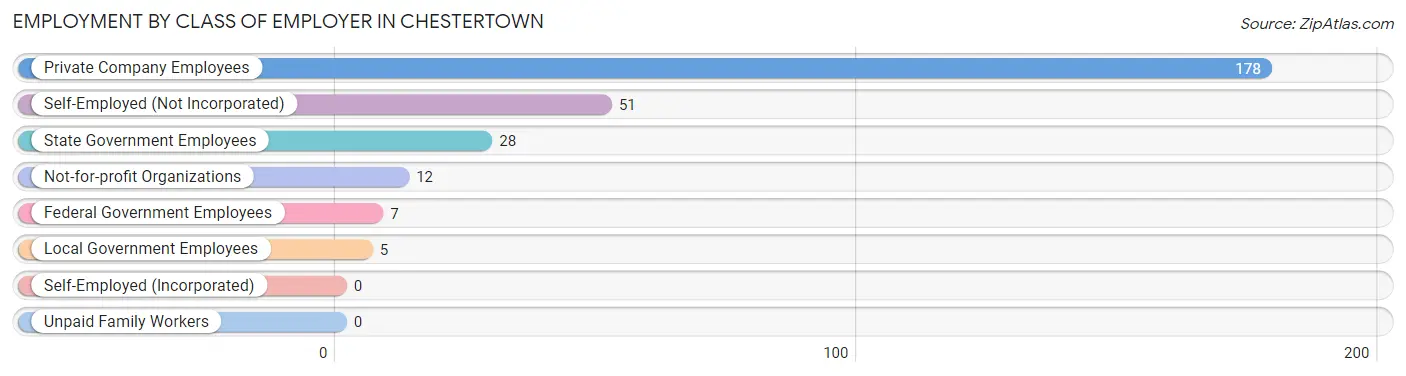
| Employer Class | # Employees | % Employees |
| Private Company Employees | 178 | 63.3% |
| Self-Employed (Incorporated) | 0 | 0.0% |
| Self-Employed (Not Incorporated) | 51 | 18.1% |
| Not-for-profit Organizations | 12 | 4.3% |
| Local Government Employees | 5 | 1.8% |
| State Government Employees | 28 | 10.0% |
| Federal Government Employees | 7 | 2.5% |
| Unpaid Family Workers | 0 | 0.0% |
| Total | 281 | 100.0% |
Employment Status by Age in Chestertown
According to the labor force statistics for Chestertown, out of the total population over 16 years of age (499), 74.5% or 372 individuals are in the labor force, with 22.6% or 84 of them unemployed. The age group with the highest labor force participation rate is 20 to 24 years, with 100.0% or 46 individuals in the labor force. Within the labor force, the 16 to 19 years age range has the highest percentage of unemployed individuals, with 80.0% or 48 of them being unemployed.
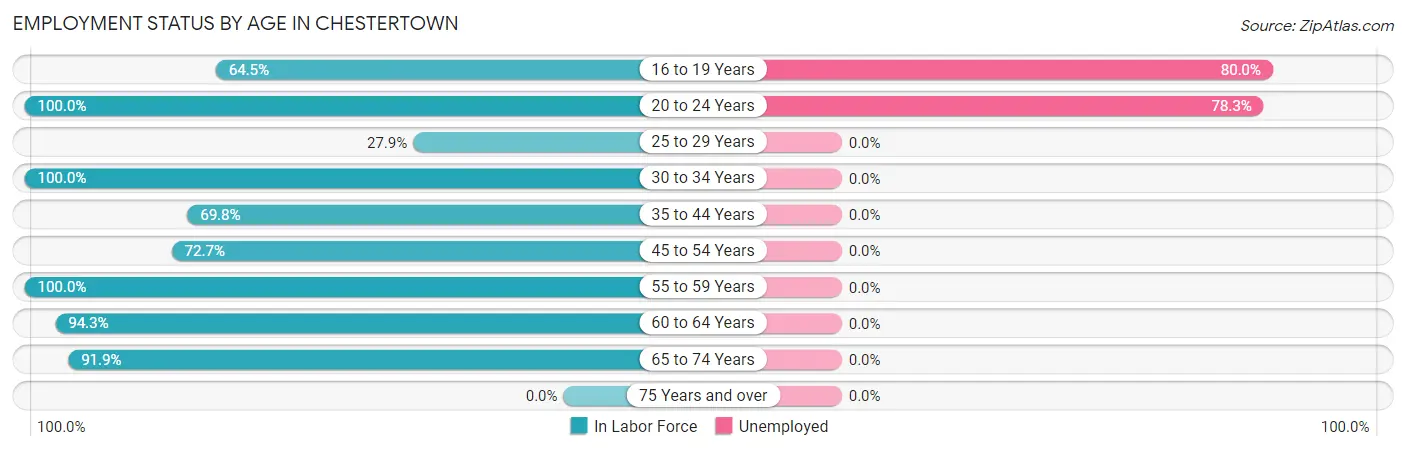
| Age Bracket | In Labor Force | Unemployed |
| 16 to 19 Years | 60 (64.5%) | 48 (80.0%) |
| 20 to 24 Years | 46 (100.0%) | 36 (78.3%) |
| 25 to 29 Years | 12 (27.9%) | 0 (0.0%) |
| 30 to 34 Years | 24 (100.0%) | 0 (0.0%) |
| 35 to 44 Years | 37 (69.8%) | 0 (0.0%) |
| 45 to 54 Years | 72 (72.7%) | 0 (0.0%) |
| 55 to 59 Years | 37 (100.0%) | 0 (0.0%) |
| 60 to 64 Years | 50 (94.3%) | 0 (0.0%) |
| 65 to 74 Years | 34 (91.9%) | 0 (0.0%) |
| 75 Years and over | 0 (0.0%) | 0 (0.0%) |
| Total | 372 (74.5%) | 84 (22.6%) |
Employment Status by Educational Attainment in Chestertown
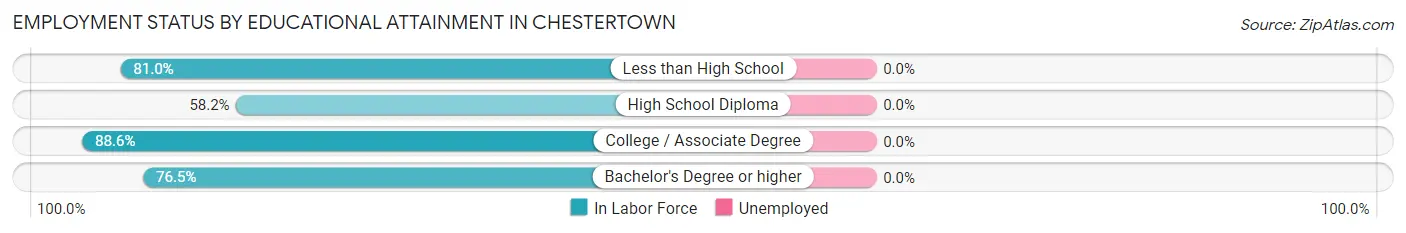
| Educational Attainment | In Labor Force | Unemployed |
| Less than High School | 85 (81.0%) | 0 (0.0%) |
| High School Diploma | 46 (58.2%) | 0 (0.0%) |
| College / Associate Degree | 39 (88.6%) | 0 (0.0%) |
| Bachelor's Degree or higher | 62 (76.5%) | 0 (0.0%) |
| Total | 232 (75.1%) | 0 (0.0%) |
Employment Occupations by Sex in Chestertown
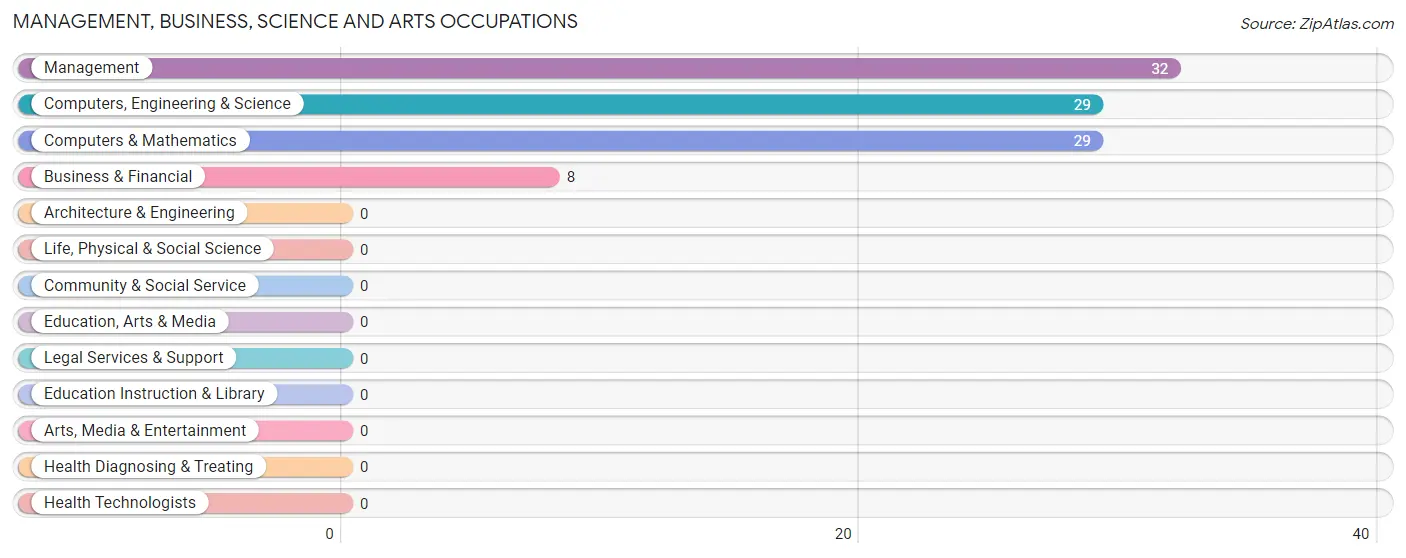
Management, Business, Science and Arts Occupations
The most common Management, Business, Science and Arts occupations in Chestertown are Management (32 | 11.1%), Computers, Engineering & Science (29 | 10.1%), Computers & Mathematics (29 | 10.1%), and Business & Financial (8 | 2.8%).
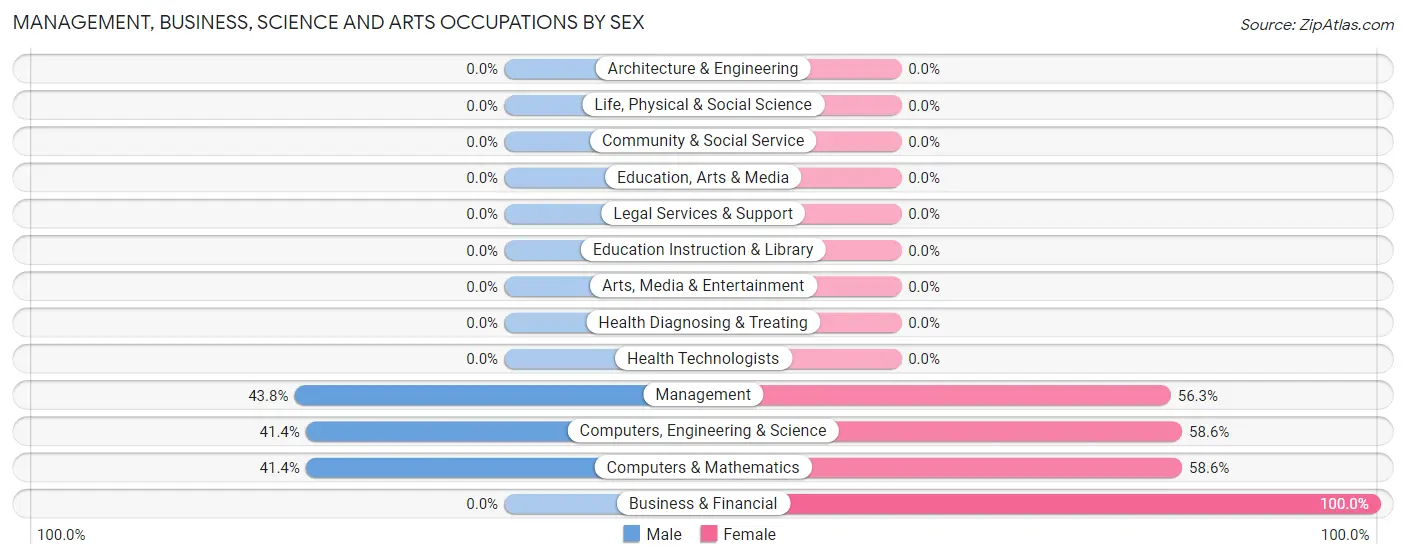
Management, Business, Science and Arts Occupations by Sex
Within the Management, Business, Science and Arts occupations in Chestertown, the most male-oriented occupations are Management (43.8%), Computers, Engineering & Science (41.4%), and Computers & Mathematics (41.4%), while the most female-oriented occupations are Business & Financial (100.0%), Computers, Engineering & Science (58.6%), and Computers & Mathematics (58.6%).
| Occupation | Male | Female |
| Management | 14 (43.8%) | 18 (56.2%) |
| Business & Financial | 0 (0.0%) | 8 (100.0%) |
| Computers, Engineering & Science | 12 (41.4%) | 17 (58.6%) |
| Computers & Mathematics | 12 (41.4%) | 17 (58.6%) |
| Architecture & Engineering | 0 (0.0%) | 0 (0.0%) |
| Life, Physical & Social Science | 0 (0.0%) | 0 (0.0%) |
| Community & Social Service | 0 (0.0%) | 0 (0.0%) |
| Education, Arts & Media | 0 (0.0%) | 0 (0.0%) |
| Legal Services & Support | 0 (0.0%) | 0 (0.0%) |
| Education Instruction & Library | 0 (0.0%) | 0 (0.0%) |
| Arts, Media & Entertainment | 0 (0.0%) | 0 (0.0%) |
| Health Diagnosing & Treating | 0 (0.0%) | 0 (0.0%) |
| Health Technologists | 0 (0.0%) | 0 (0.0%) |
| Total (Category) | 26 (37.7%) | 43 (62.3%) |
| Total (Overall) | 179 (62.2%) | 109 (37.9%) |
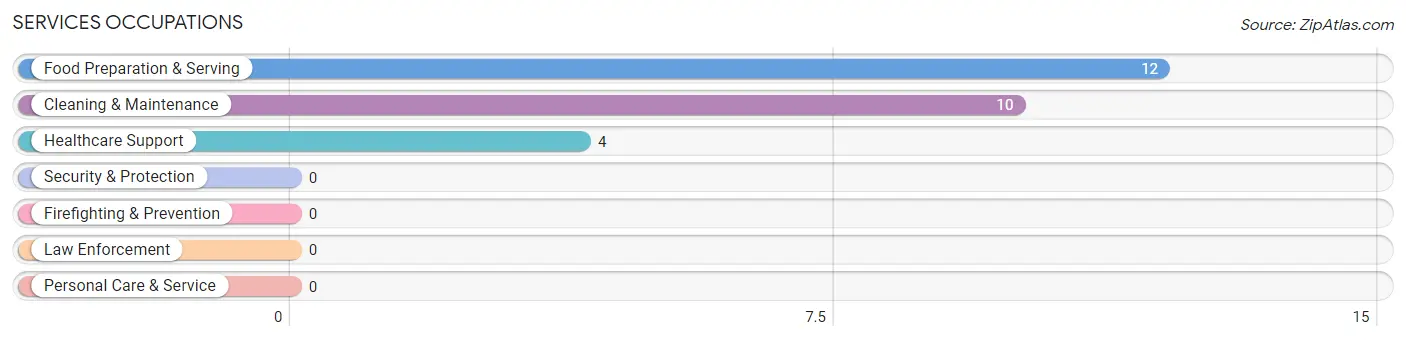
Services Occupations
The most common Services occupations in Chestertown are Food Preparation & Serving (12 | 4.2%), Cleaning & Maintenance (10 | 3.5%), and Healthcare Support (4 | 1.4%).
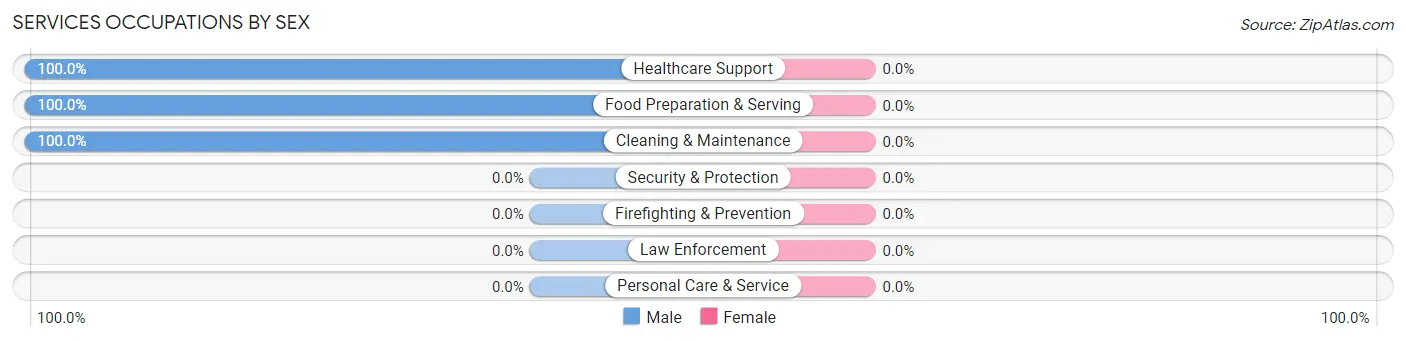
Services Occupations by Sex
| Occupation | Male | Female |
| Healthcare Support | 4 (100.0%) | 0 (0.0%) |
| Security & Protection | 0 (0.0%) | 0 (0.0%) |
| Firefighting & Prevention | 0 (0.0%) | 0 (0.0%) |
| Law Enforcement | 0 (0.0%) | 0 (0.0%) |
| Food Preparation & Serving | 12 (100.0%) | 0 (0.0%) |
| Cleaning & Maintenance | 10 (100.0%) | 0 (0.0%) |
| Personal Care & Service | 0 (0.0%) | 0 (0.0%) |
| Total (Category) | 26 (100.0%) | 0 (0.0%) |
| Total (Overall) | 179 (62.2%) | 109 (37.9%) |
Sales and Office Occupations
The most common Sales and Office occupations in Chestertown are Sales & Related (56 | 19.4%), and Office & Administration (44 | 15.3%).
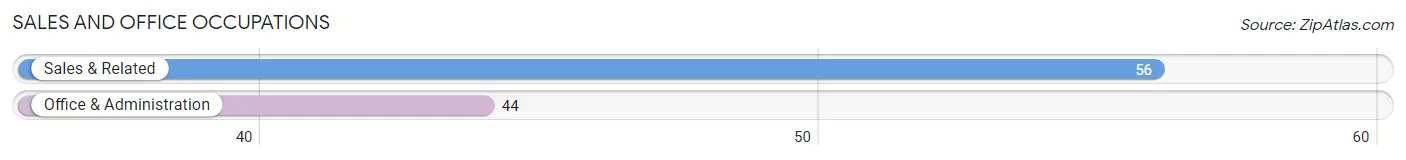
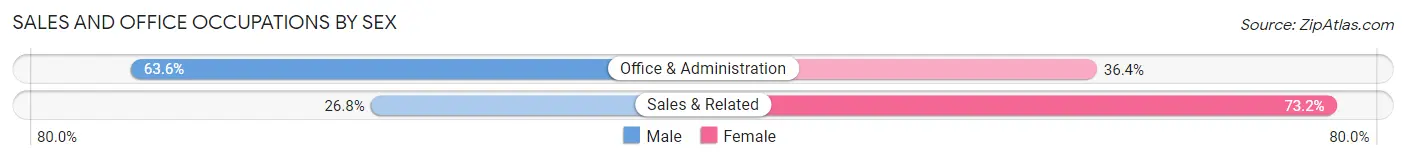
Sales and Office Occupations by Sex
| Occupation | Male | Female |
| Sales & Related | 15 (26.8%) | 41 (73.2%) |
| Office & Administration | 28 (63.6%) | 16 (36.4%) |
| Total (Category) | 43 (43.0%) | 57 (57.0%) |
| Total (Overall) | 179 (62.2%) | 109 (37.9%) |
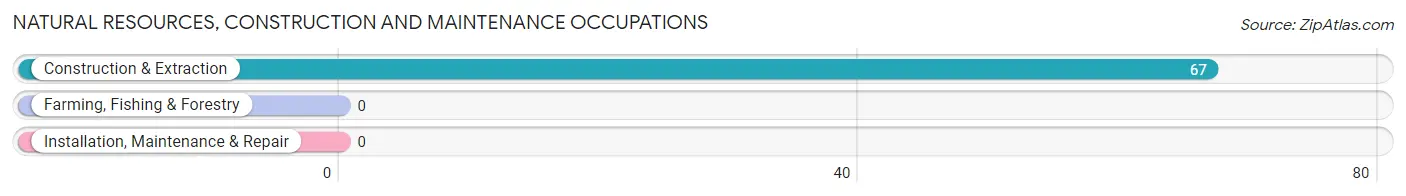
Natural Resources, Construction and Maintenance Occupations
The most common Natural Resources, Construction and Maintenance occupations in Chestertown are , and Construction & Extraction (67 | 23.3%).
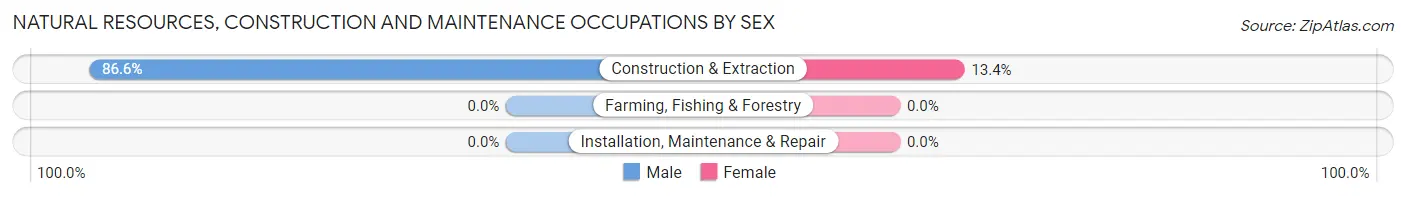
Natural Resources, Construction and Maintenance Occupations by Sex
| Occupation | Male | Female |
| Farming, Fishing & Forestry | 0 (0.0%) | 0 (0.0%) |
| Construction & Extraction | 58 (86.6%) | 9 (13.4%) |
| Installation, Maintenance & Repair | 0 (0.0%) | 0 (0.0%) |
| Total (Category) | 58 (86.6%) | 9 (13.4%) |
| Total (Overall) | 179 (62.2%) | 109 (37.9%) |
Production, Transportation and Moving Occupations
The most common Production, Transportation and Moving occupations in Chestertown are , and Transportation (26 | 9.0%).
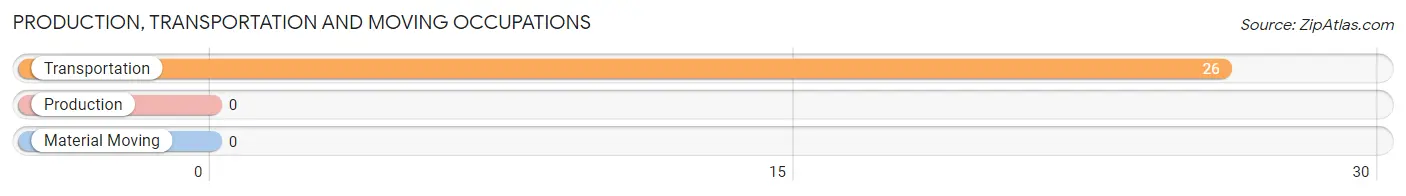
Production, Transportation and Moving Occupations by Sex
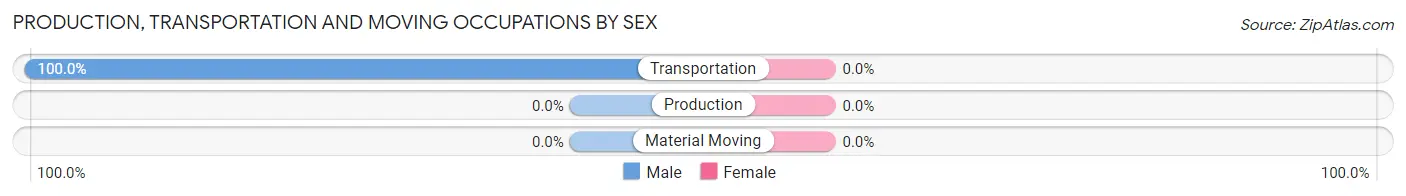
| Occupation | Male | Female |
| Production | 0 (0.0%) | 0 (0.0%) |
| Transportation | 26 (100.0%) | 0 (0.0%) |
| Material Moving | 0 (0.0%) | 0 (0.0%) |
| Total (Category) | 26 (100.0%) | 0 (0.0%) |
| Total (Overall) | 179 (62.2%) | 109 (37.9%) |
Employment Industries by Sex in Chestertown
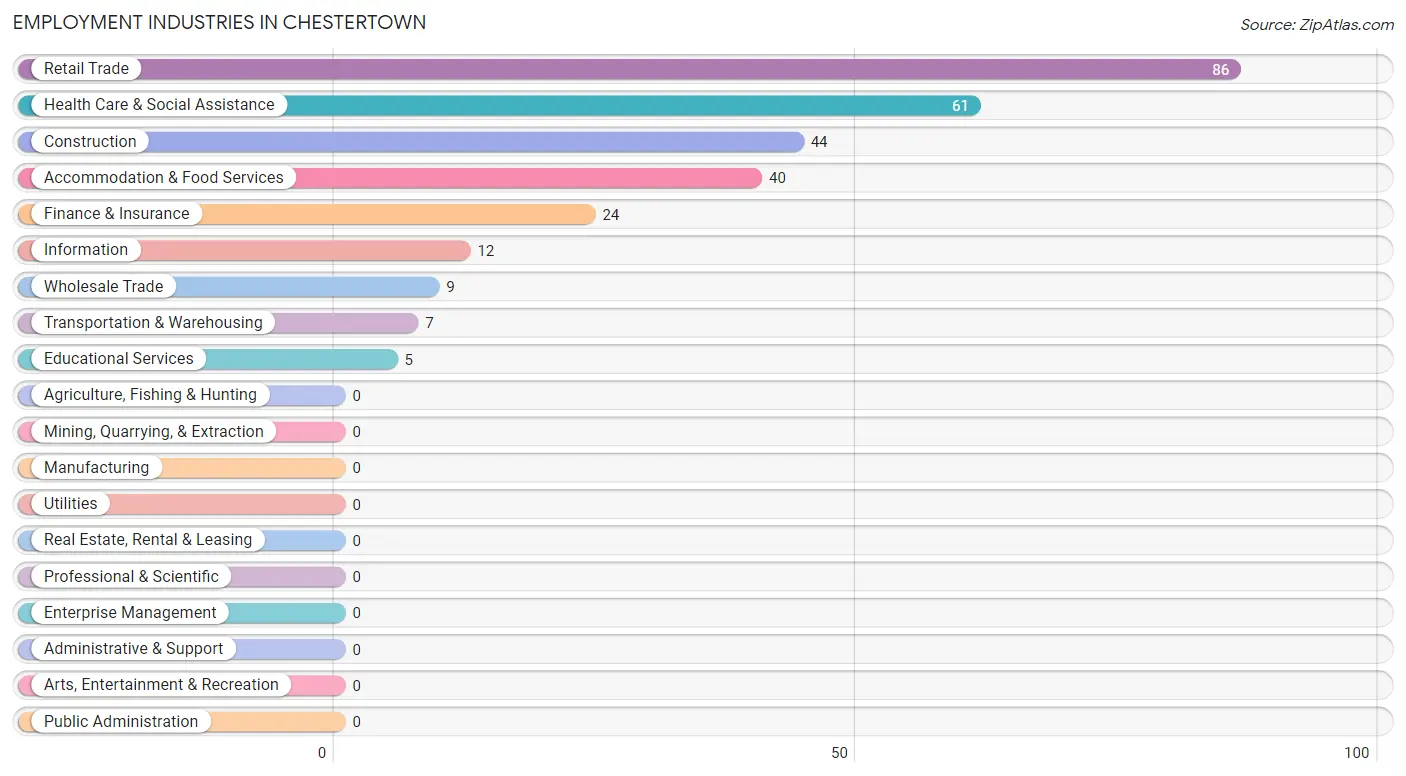
Employment Industries in Chestertown
The major employment industries in Chestertown include Retail Trade (86 | 29.9%), Health Care & Social Assistance (61 | 21.2%), Construction (44 | 15.3%), Accommodation & Food Services (40 | 13.9%), and Finance & Insurance (24 | 8.3%).
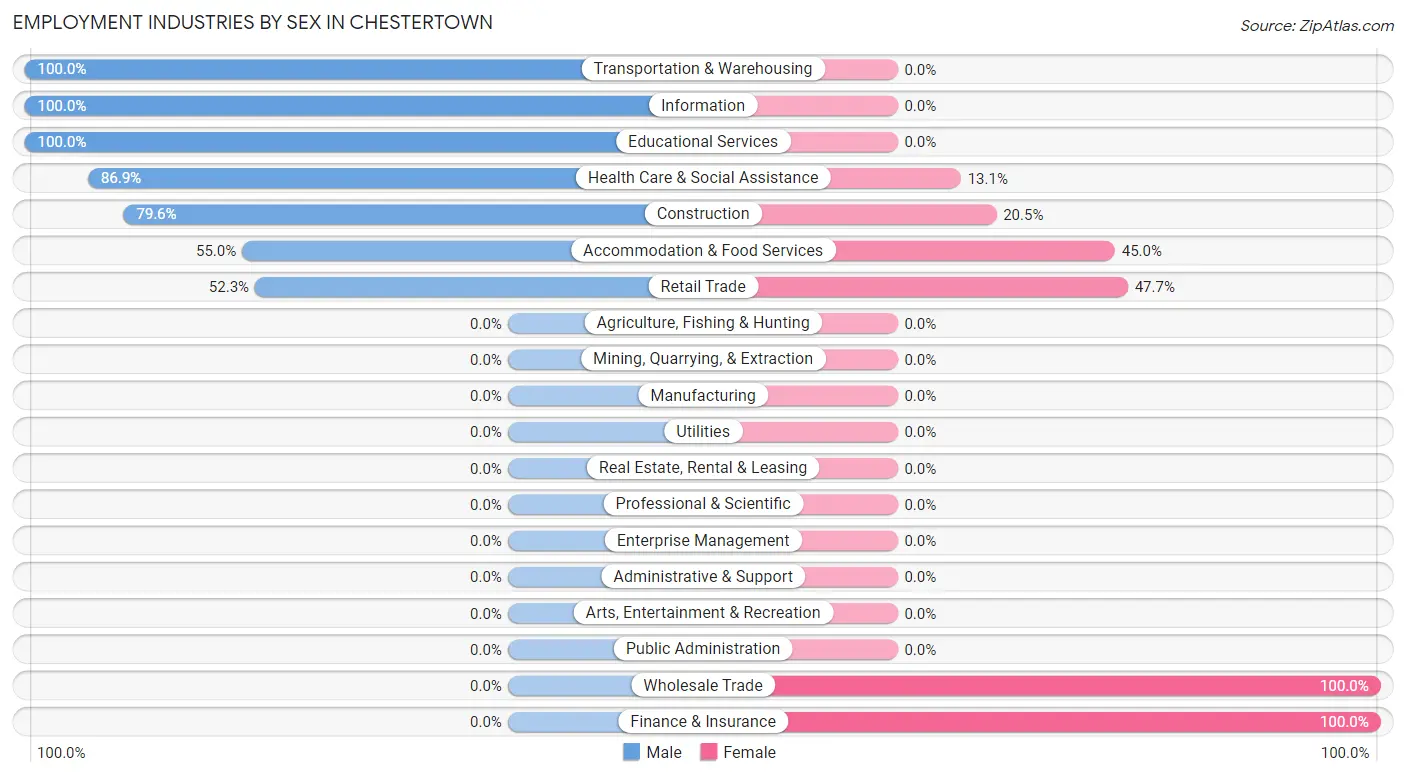
Employment Industries by Sex in Chestertown
The Chestertown industries that see more men than women are Transportation & Warehousing (100.0%), Information (100.0%), and Educational Services (100.0%), whereas the industries that tend to have a higher number of women are Wholesale Trade (100.0%), Finance & Insurance (100.0%), and Retail Trade (47.7%).
| Industry | Male | Female |
| Agriculture, Fishing & Hunting | 0 (0.0%) | 0 (0.0%) |
| Mining, Quarrying, & Extraction | 0 (0.0%) | 0 (0.0%) |
| Construction | 35 (79.5%) | 9 (20.4%) |
| Manufacturing | 0 (0.0%) | 0 (0.0%) |
| Wholesale Trade | 0 (0.0%) | 9 (100.0%) |
| Retail Trade | 45 (52.3%) | 41 (47.7%) |
| Transportation & Warehousing | 7 (100.0%) | 0 (0.0%) |
| Utilities | 0 (0.0%) | 0 (0.0%) |
| Information | 12 (100.0%) | 0 (0.0%) |
| Finance & Insurance | 0 (0.0%) | 24 (100.0%) |
| Real Estate, Rental & Leasing | 0 (0.0%) | 0 (0.0%) |
| Professional & Scientific | 0 (0.0%) | 0 (0.0%) |
| Enterprise Management | 0 (0.0%) | 0 (0.0%) |
| Administrative & Support | 0 (0.0%) | 0 (0.0%) |
| Educational Services | 5 (100.0%) | 0 (0.0%) |
| Health Care & Social Assistance | 53 (86.9%) | 8 (13.1%) |
| Arts, Entertainment & Recreation | 0 (0.0%) | 0 (0.0%) |
| Accommodation & Food Services | 22 (55.0%) | 18 (45.0%) |
| Public Administration | 0 (0.0%) | 0 (0.0%) |
| Total | 179 (62.2%) | 109 (37.9%) |
Education in Chestertown
School Enrollment in Chestertown
The most common levels of schooling among the 70 students in Chestertown are high school (33 | 47.1%), elementary school (28 | 40.0%), and middle school (9 | 12.9%).
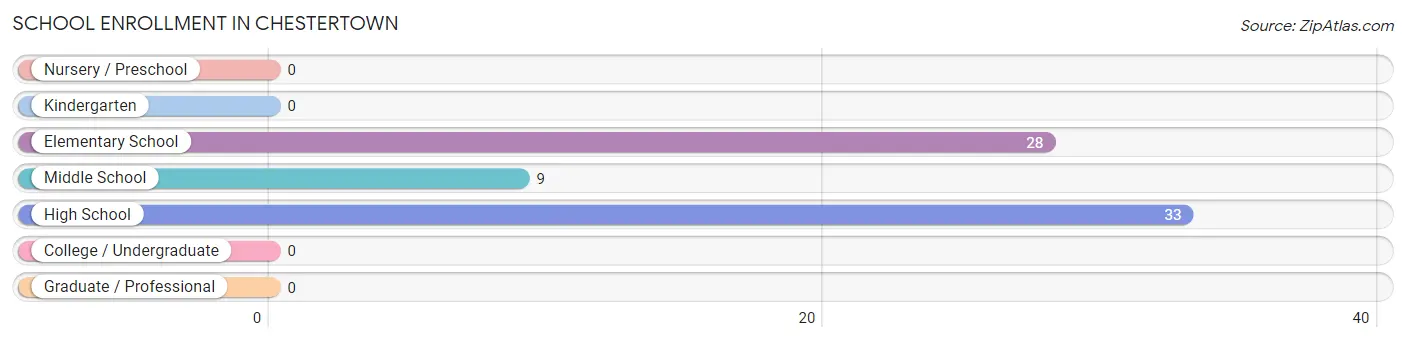
| School Level | # Students | % Students |
| Nursery / Preschool | 0 | 0.0% |
| Kindergarten | 0 | 0.0% |
| Elementary School | 28 | 40.0% |
| Middle School | 9 | 12.9% |
| High School | 33 | 47.1% |
| College / Undergraduate | 0 | 0.0% |
| Graduate / Professional | 0 | 0.0% |
| Total | 70 | 100.0% |
School Enrollment by Age by Funding Source in Chestertown
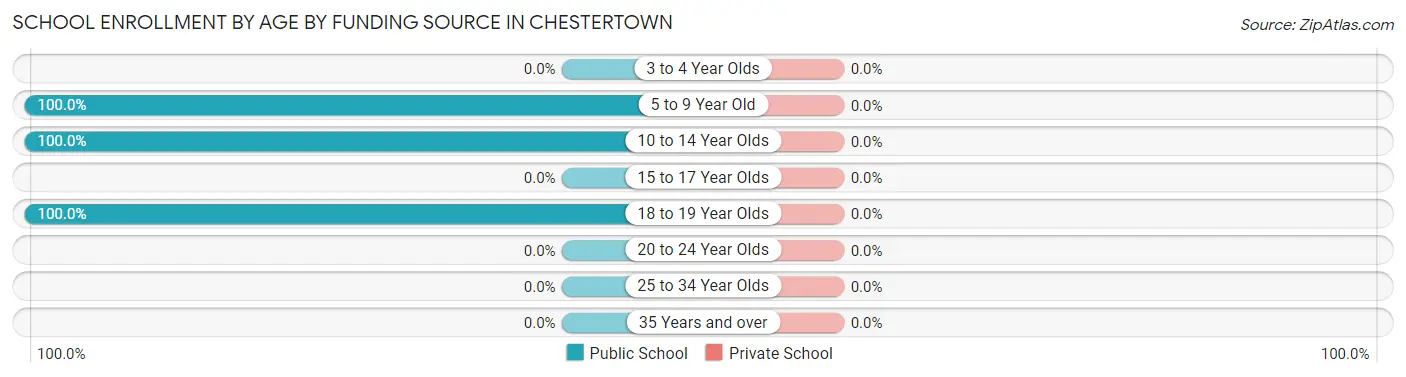
| Age Bracket | Public School | Private School |
| 3 to 4 Year Olds | 0 (0.0%) | 0 (0.0%) |
| 5 to 9 Year Old | 28 (100.0%) | 0 (0.0%) |
| 10 to 14 Year Olds | 9 (100.0%) | 0 (0.0%) |
| 15 to 17 Year Olds | 0 (0.0%) | 0 (0.0%) |
| 18 to 19 Year Olds | 33 (100.0%) | 0 (0.0%) |
| 20 to 24 Year Olds | 0 (0.0%) | 0 (0.0%) |
| 25 to 34 Year Olds | 0 (0.0%) | 0 (0.0%) |
| 35 Years and over | 0 (0.0%) | 0 (0.0%) |
| Total | 70 (100.0%) | 0 (0.0%) |
Educational Attainment by Field of Study in Chestertown
Social sciences (18 | 22.2%), visual & performing arts (18 | 22.2%), business (14 | 17.3%), liberal arts & history (14 | 17.3%), and computers & mathematics (9 | 11.1%) are the most common fields of study among 81 individuals in Chestertown who have obtained a bachelor's degree or higher.
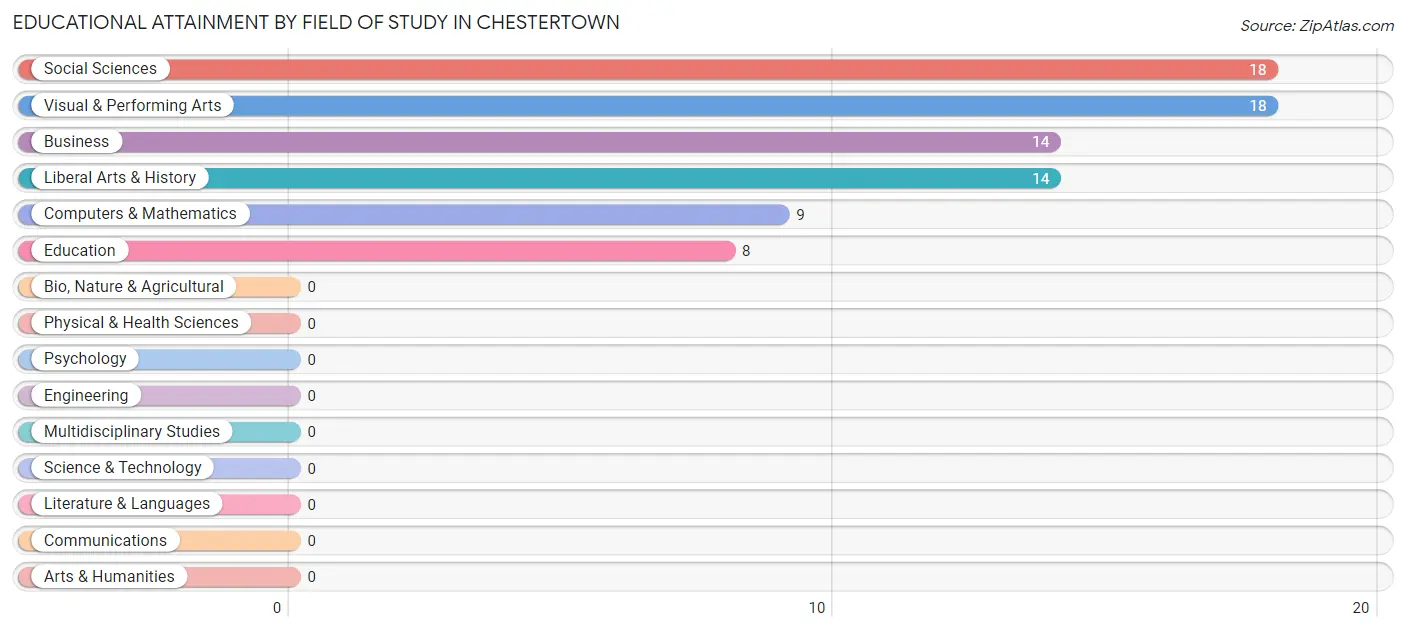
| Field of Study | # Graduates | % Graduates |
| Computers & Mathematics | 9 | 11.1% |
| Bio, Nature & Agricultural | 0 | 0.0% |
| Physical & Health Sciences | 0 | 0.0% |
| Psychology | 0 | 0.0% |
| Social Sciences | 18 | 22.2% |
| Engineering | 0 | 0.0% |
| Multidisciplinary Studies | 0 | 0.0% |
| Science & Technology | 0 | 0.0% |
| Business | 14 | 17.3% |
| Education | 8 | 9.9% |
| Literature & Languages | 0 | 0.0% |
| Liberal Arts & History | 14 | 17.3% |
| Visual & Performing Arts | 18 | 22.2% |
| Communications | 0 | 0.0% |
| Arts & Humanities | 0 | 0.0% |
| Total | 81 | 100.0% |
Transportation & Commute in Chestertown
Vehicle Availability by Sex in Chestertown
The most prevalent vehicle ownership categories in Chestertown are males with 2 vehicles (103, accounting for 59.9%) and females with 2 vehicles (81, making up 94.5%).
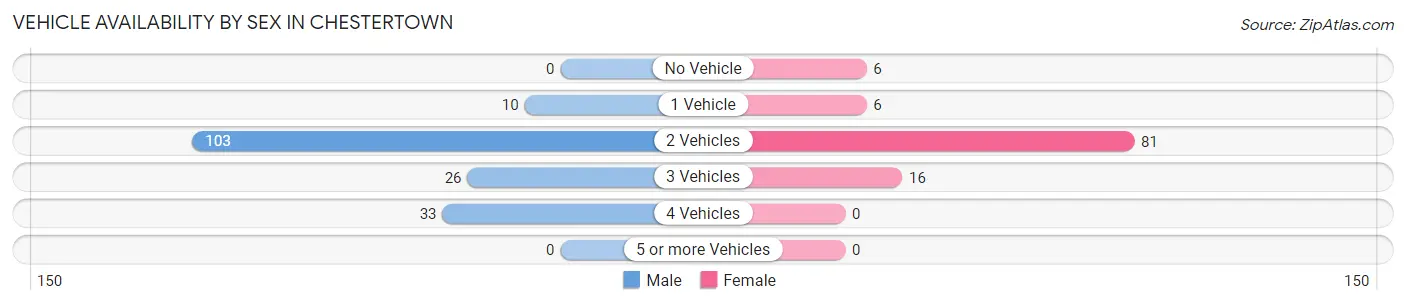
| Vehicles Available | Male | Female |
| No Vehicle | 0 (0.0%) | 6 (5.5%) |
| 1 Vehicle | 10 (5.8%) | 6 (5.5%) |
| 2 Vehicles | 103 (59.9%) | 81 (74.3%) |
| 3 Vehicles | 26 (15.1%) | 16 (14.7%) |
| 4 Vehicles | 33 (19.2%) | 0 (0.0%) |
| 5 or more Vehicles | 0 (0.0%) | 0 (0.0%) |
| Total | 172 (100.0%) | 109 (100.0%) |
Commute Time in Chestertown
The most frequently occuring commute durations in Chestertown are less than 5 minutes (72 commuters, 30.2%), 15 to 19 minutes (48 commuters, 20.2%), and 60 to 89 minutes (42 commuters, 17.6%).
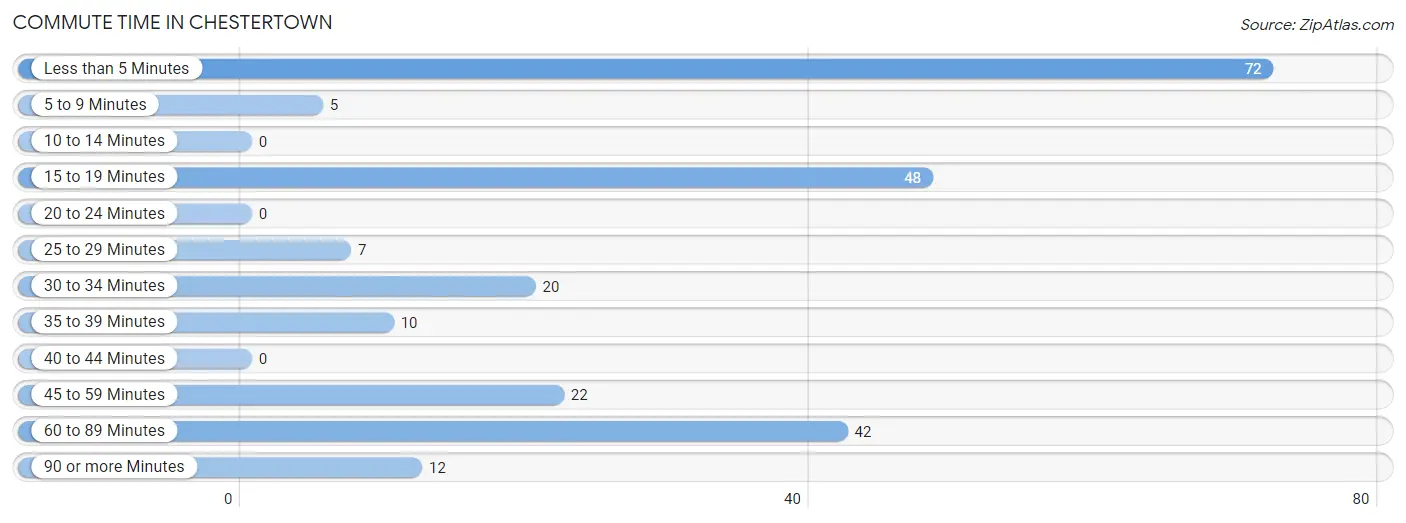
| Commute Time | # Commuters | % Commuters |
| Less than 5 Minutes | 72 | 30.2% |
| 5 to 9 Minutes | 5 | 2.1% |
| 10 to 14 Minutes | 0 | 0.0% |
| 15 to 19 Minutes | 48 | 20.2% |
| 20 to 24 Minutes | 0 | 0.0% |
| 25 to 29 Minutes | 7 | 2.9% |
| 30 to 34 Minutes | 20 | 8.4% |
| 35 to 39 Minutes | 10 | 4.2% |
| 40 to 44 Minutes | 0 | 0.0% |
| 45 to 59 Minutes | 22 | 9.2% |
| 60 to 89 Minutes | 42 | 17.6% |
| 90 or more Minutes | 12 | 5.0% |
Commute Time by Sex in Chestertown
The most common commute times in Chestertown are 15 to 19 minutes (40 commuters, 23.3%) for males and less than 5 minutes (35 commuters, 53.0%) for females.
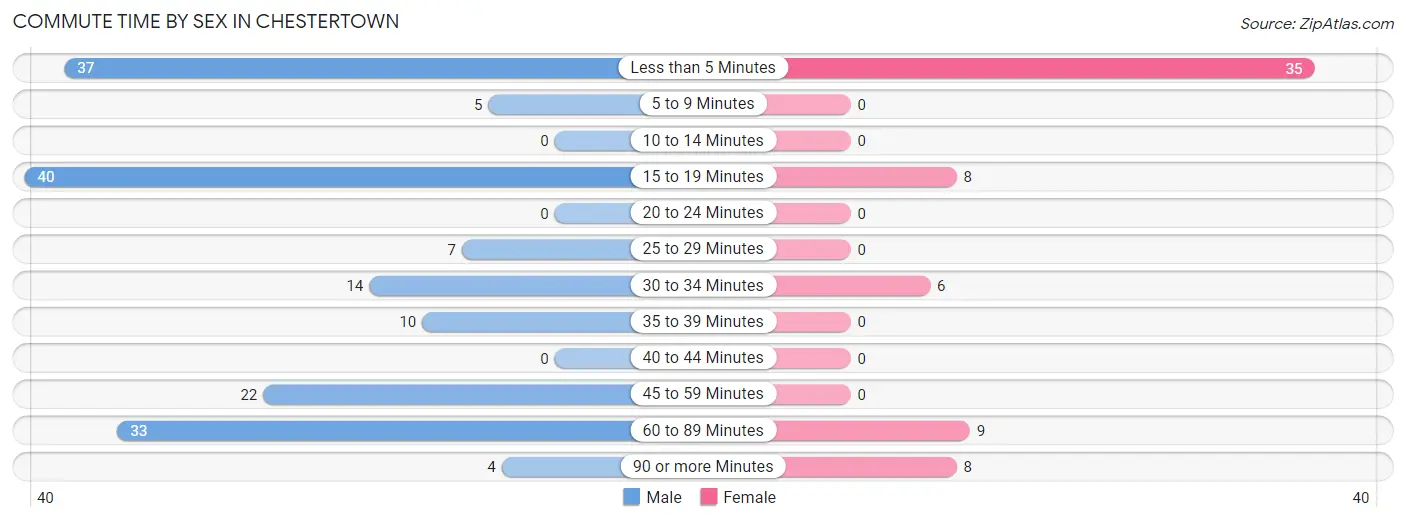
| Commute Time | Male | Female |
| Less than 5 Minutes | 37 (21.5%) | 35 (53.0%) |
| 5 to 9 Minutes | 5 (2.9%) | 0 (0.0%) |
| 10 to 14 Minutes | 0 (0.0%) | 0 (0.0%) |
| 15 to 19 Minutes | 40 (23.3%) | 8 (12.1%) |
| 20 to 24 Minutes | 0 (0.0%) | 0 (0.0%) |
| 25 to 29 Minutes | 7 (4.1%) | 0 (0.0%) |
| 30 to 34 Minutes | 14 (8.1%) | 6 (9.1%) |
| 35 to 39 Minutes | 10 (5.8%) | 0 (0.0%) |
| 40 to 44 Minutes | 0 (0.0%) | 0 (0.0%) |
| 45 to 59 Minutes | 22 (12.8%) | 0 (0.0%) |
| 60 to 89 Minutes | 33 (19.2%) | 9 (13.6%) |
| 90 or more Minutes | 4 (2.3%) | 8 (12.1%) |
Time of Departure to Work by Sex in Chestertown
The most frequent times of departure to work in Chestertown are 8:00 AM to 8:29 AM (37, 21.5%) for males and 12:00 PM to 3:59 PM (22, 33.3%) for females.
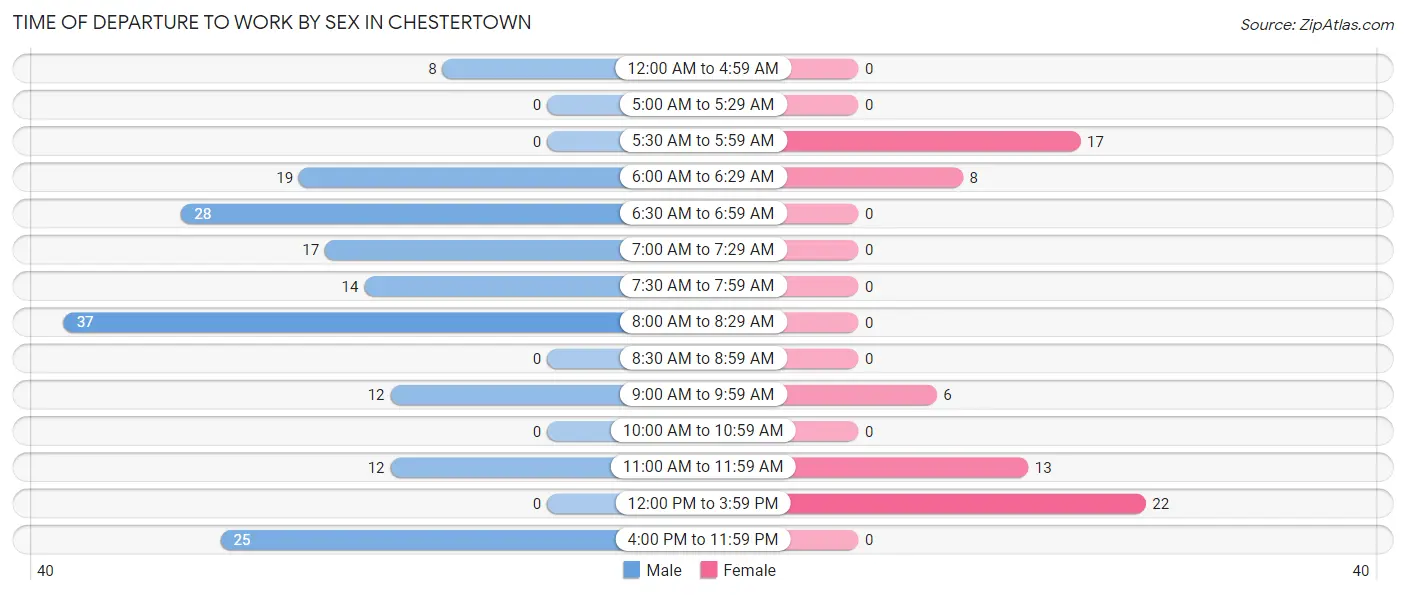
| Time of Departure | Male | Female |
| 12:00 AM to 4:59 AM | 8 (4.6%) | 0 (0.0%) |
| 5:00 AM to 5:29 AM | 0 (0.0%) | 0 (0.0%) |
| 5:30 AM to 5:59 AM | 0 (0.0%) | 17 (25.8%) |
| 6:00 AM to 6:29 AM | 19 (11.1%) | 8 (12.1%) |
| 6:30 AM to 6:59 AM | 28 (16.3%) | 0 (0.0%) |
| 7:00 AM to 7:29 AM | 17 (9.9%) | 0 (0.0%) |
| 7:30 AM to 7:59 AM | 14 (8.1%) | 0 (0.0%) |
| 8:00 AM to 8:29 AM | 37 (21.5%) | 0 (0.0%) |
| 8:30 AM to 8:59 AM | 0 (0.0%) | 0 (0.0%) |
| 9:00 AM to 9:59 AM | 12 (7.0%) | 6 (9.1%) |
| 10:00 AM to 10:59 AM | 0 (0.0%) | 0 (0.0%) |
| 11:00 AM to 11:59 AM | 12 (7.0%) | 13 (19.7%) |
| 12:00 PM to 3:59 PM | 0 (0.0%) | 22 (33.3%) |
| 4:00 PM to 11:59 PM | 25 (14.5%) | 0 (0.0%) |
| Total | 172 (100.0%) | 66 (100.0%) |
Housing Occupancy in Chestertown
Occupancy by Ownership in Chestertown
Of the total 238 dwellings in Chestertown, owner-occupied units account for 127 (53.4%), while renter-occupied units make up 111 (46.6%).
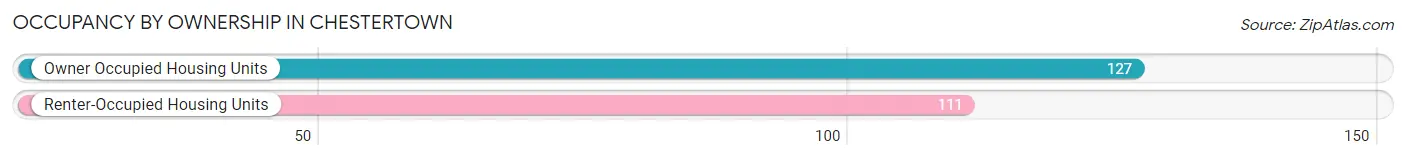
| Occupancy | # Housing Units | % Housing Units |
| Owner Occupied Housing Units | 127 | 53.4% |
| Renter-Occupied Housing Units | 111 | 46.6% |
| Total Occupied Housing Units | 238 | 100.0% |
Occupancy by Household Size in Chestertown
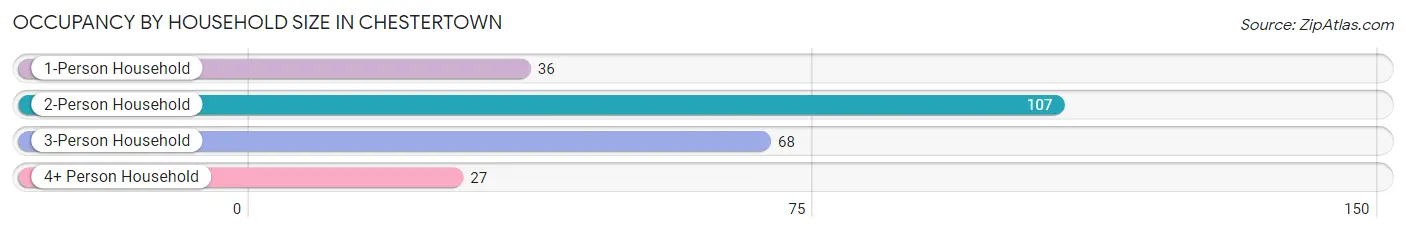
| Household Size | # Housing Units | % Housing Units |
| 1-Person Household | 36 | 15.1% |
| 2-Person Household | 107 | 45.0% |
| 3-Person Household | 68 | 28.6% |
| 4+ Person Household | 27 | 11.3% |
| Total Housing Units | 238 | 100.0% |
Occupancy by Ownership by Household Size in Chestertown
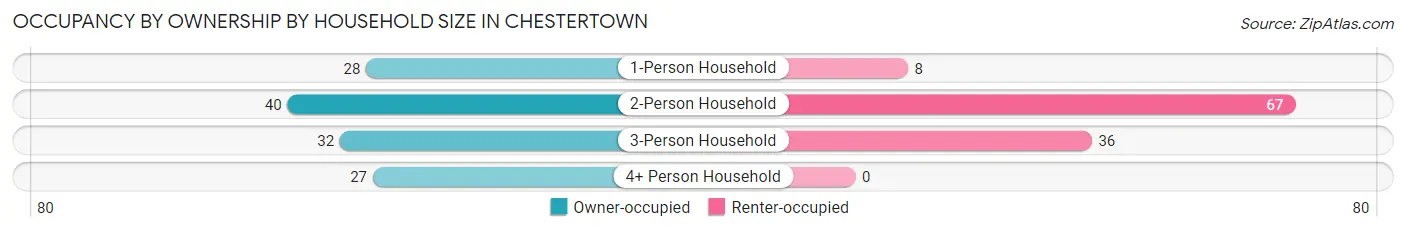
| Household Size | Owner-occupied | Renter-occupied |
| 1-Person Household | 28 (77.8%) | 8 (22.2%) |
| 2-Person Household | 40 (37.4%) | 67 (62.6%) |
| 3-Person Household | 32 (47.1%) | 36 (52.9%) |
| 4+ Person Household | 27 (100.0%) | 0 (0.0%) |
| Total Housing Units | 127 (53.4%) | 111 (46.6%) |
Occupancy by Educational Attainment in Chestertown
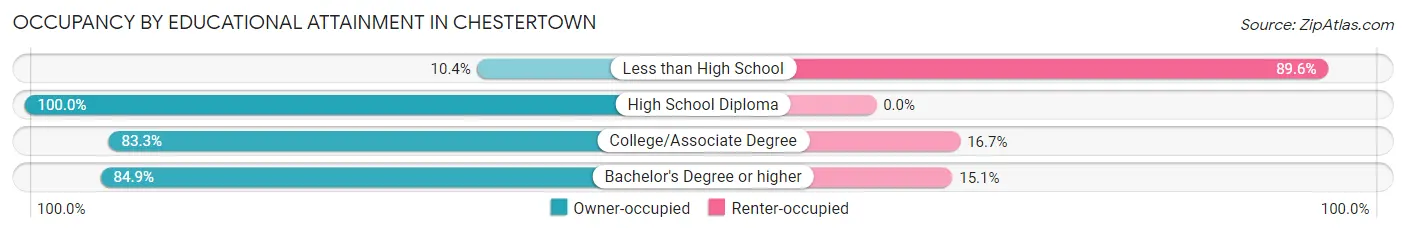
| Household Size | Owner-occupied | Renter-occupied |
| Less than High School | 11 (10.4%) | 95 (89.6%) |
| High School Diploma | 31 (100.0%) | 0 (0.0%) |
| College/Associate Degree | 40 (83.3%) | 8 (16.7%) |
| Bachelor's Degree or higher | 45 (84.9%) | 8 (15.1%) |
Occupancy by Age of Householder in Chestertown
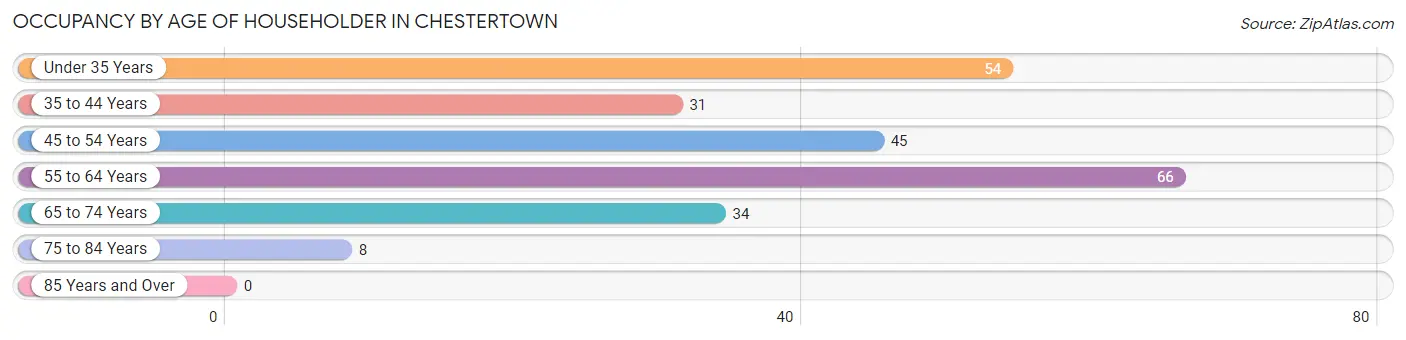
| Age Bracket | # Households | % Households |
| Under 35 Years | 54 | 22.7% |
| 35 to 44 Years | 31 | 13.0% |
| 45 to 54 Years | 45 | 18.9% |
| 55 to 64 Years | 66 | 27.7% |
| 65 to 74 Years | 34 | 14.3% |
| 75 to 84 Years | 8 | 3.4% |
| 85 Years and Over | 0 | 0.0% |
| Total | 238 | 100.0% |
Housing Finances in Chestertown
Median Income by Occupancy in Chestertown
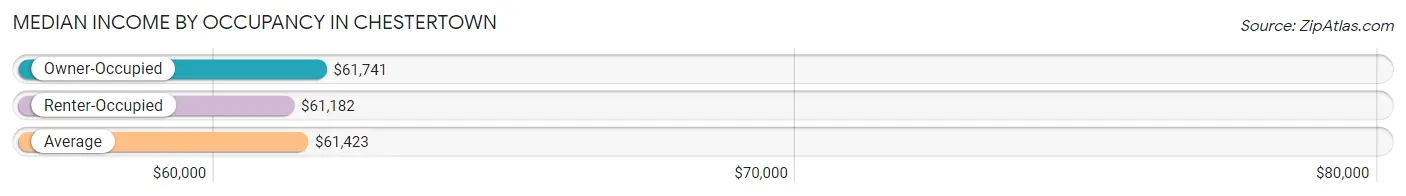
| Occupancy Type | # Households | Median Income |
| Owner-Occupied | 127 (53.4%) | $61,741 |
| Renter-Occupied | 111 (46.6%) | $61,182 |
| Average | 238 (100.0%) | $61,423 |
Occupancy by Householder Income Bracket in Chestertown
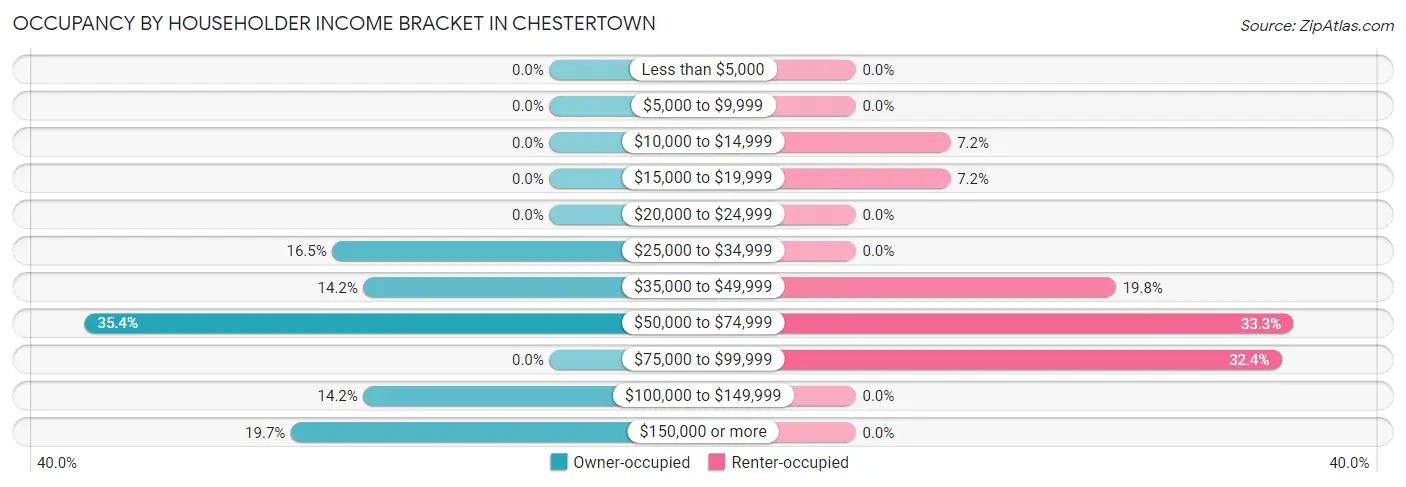
| Income Bracket | Owner-occupied | Renter-occupied |
| Less than $5,000 | 0 (0.0%) | 0 (0.0%) |
| $5,000 to $9,999 | 0 (0.0%) | 0 (0.0%) |
| $10,000 to $14,999 | 0 (0.0%) | 8 (7.2%) |
| $15,000 to $19,999 | 0 (0.0%) | 8 (7.2%) |
| $20,000 to $24,999 | 0 (0.0%) | 0 (0.0%) |
| $25,000 to $34,999 | 21 (16.5%) | 0 (0.0%) |
| $35,000 to $49,999 | 18 (14.2%) | 22 (19.8%) |
| $50,000 to $74,999 | 45 (35.4%) | 37 (33.3%) |
| $75,000 to $99,999 | 0 (0.0%) | 36 (32.4%) |
| $100,000 to $149,999 | 18 (14.2%) | 0 (0.0%) |
| $150,000 or more | 25 (19.7%) | 0 (0.0%) |
| Total | 127 (100.0%) | 111 (100.0%) |
Monthly Housing Cost Tiers in Chestertown
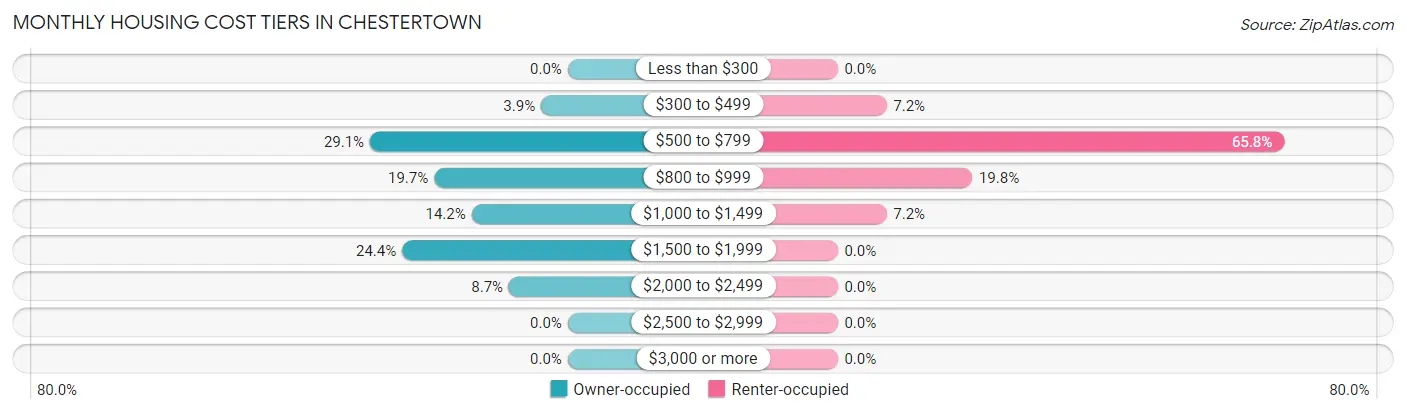
| Monthly Cost | Owner-occupied | Renter-occupied |
| Less than $300 | 0 (0.0%) | 0 (0.0%) |
| $300 to $499 | 5 (3.9%) | 8 (7.2%) |
| $500 to $799 | 37 (29.1%) | 73 (65.8%) |
| $800 to $999 | 25 (19.7%) | 22 (19.8%) |
| $1,000 to $1,499 | 18 (14.2%) | 8 (7.2%) |
| $1,500 to $1,999 | 31 (24.4%) | 0 (0.0%) |
| $2,000 to $2,499 | 11 (8.7%) | 0 (0.0%) |
| $2,500 to $2,999 | 0 (0.0%) | 0 (0.0%) |
| $3,000 or more | 0 (0.0%) | 0 (0.0%) |
| Total | 127 (100.0%) | 111 (100.0%) |
Physical Housing Characteristics in Chestertown
Housing Structures in Chestertown
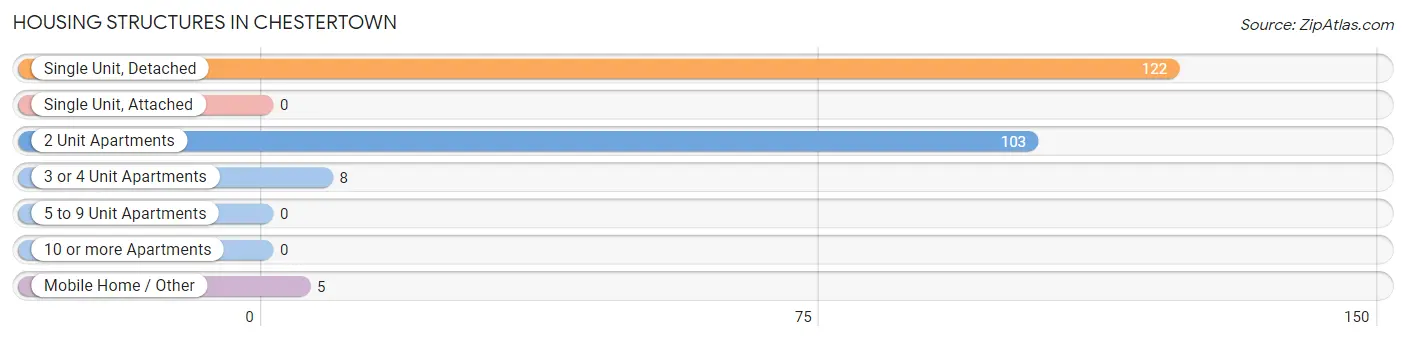
| Structure Type | # Housing Units | % Housing Units |
| Single Unit, Detached | 122 | 51.3% |
| Single Unit, Attached | 0 | 0.0% |
| 2 Unit Apartments | 103 | 43.3% |
| 3 or 4 Unit Apartments | 8 | 3.4% |
| 5 to 9 Unit Apartments | 0 | 0.0% |
| 10 or more Apartments | 0 | 0.0% |
| Mobile Home / Other | 5 | 2.1% |
| Total | 238 | 100.0% |
Housing Structures by Occupancy in Chestertown
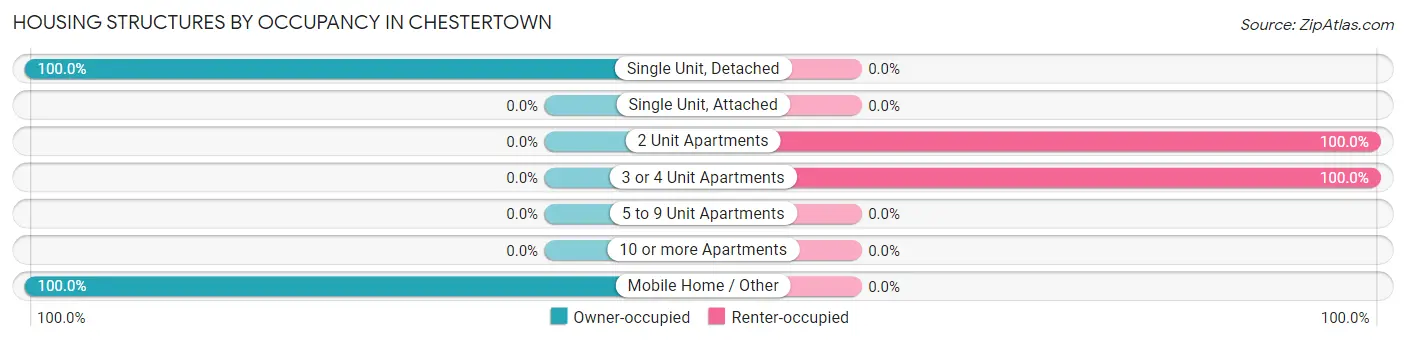
| Structure Type | Owner-occupied | Renter-occupied |
| Single Unit, Detached | 122 (100.0%) | 0 (0.0%) |
| Single Unit, Attached | 0 (0.0%) | 0 (0.0%) |
| 2 Unit Apartments | 0 (0.0%) | 103 (100.0%) |
| 3 or 4 Unit Apartments | 0 (0.0%) | 8 (100.0%) |
| 5 to 9 Unit Apartments | 0 (0.0%) | 0 (0.0%) |
| 10 or more Apartments | 0 (0.0%) | 0 (0.0%) |
| Mobile Home / Other | 5 (100.0%) | 0 (0.0%) |
| Total | 127 (53.4%) | 111 (46.6%) |
Housing Structures by Number of Rooms in Chestertown
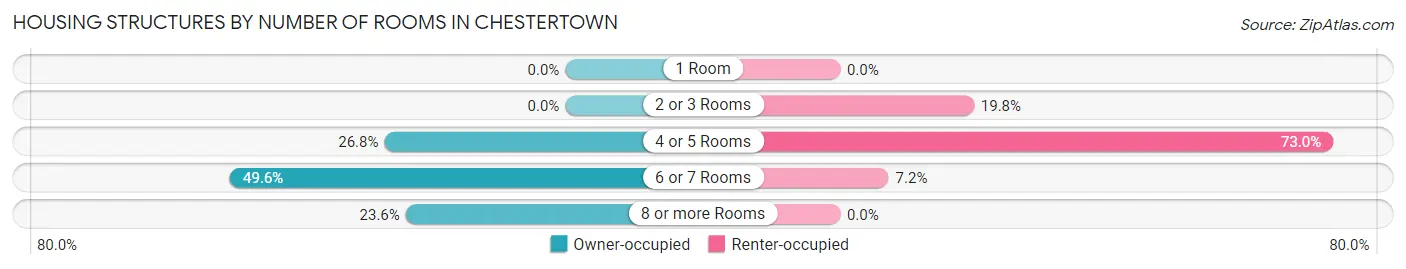
| Number of Rooms | Owner-occupied | Renter-occupied |
| 1 Room | 0 (0.0%) | 0 (0.0%) |
| 2 or 3 Rooms | 0 (0.0%) | 22 (19.8%) |
| 4 or 5 Rooms | 34 (26.8%) | 81 (73.0%) |
| 6 or 7 Rooms | 63 (49.6%) | 8 (7.2%) |
| 8 or more Rooms | 30 (23.6%) | 0 (0.0%) |
| Total | 127 (100.0%) | 111 (100.0%) |
Housing Structure by Heating Type in Chestertown
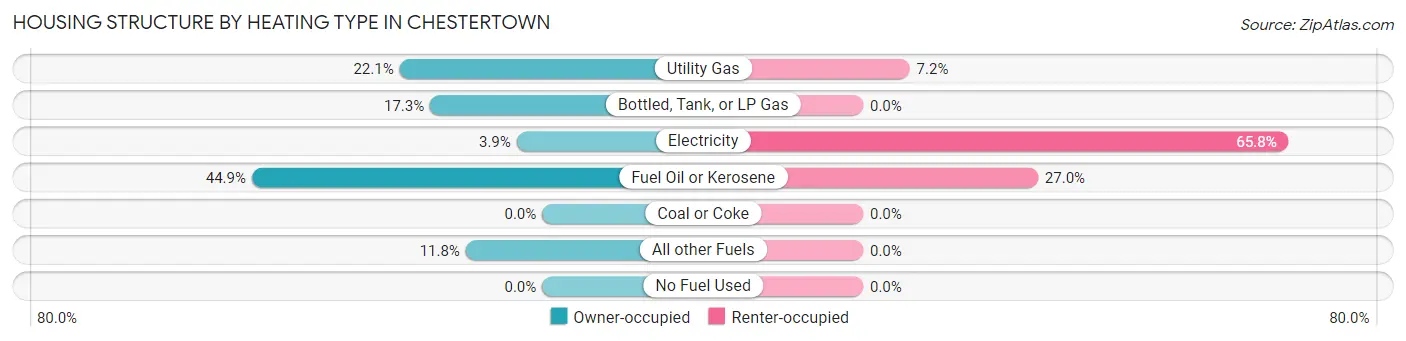
| Heating Type | Owner-occupied | Renter-occupied |
| Utility Gas | 28 (22.1%) | 8 (7.2%) |
| Bottled, Tank, or LP Gas | 22 (17.3%) | 0 (0.0%) |
| Electricity | 5 (3.9%) | 73 (65.8%) |
| Fuel Oil or Kerosene | 57 (44.9%) | 30 (27.0%) |
| Coal or Coke | 0 (0.0%) | 0 (0.0%) |
| All other Fuels | 15 (11.8%) | 0 (0.0%) |
| No Fuel Used | 0 (0.0%) | 0 (0.0%) |
| Total | 127 (100.0%) | 111 (100.0%) |
Household Vehicle Usage in Chestertown
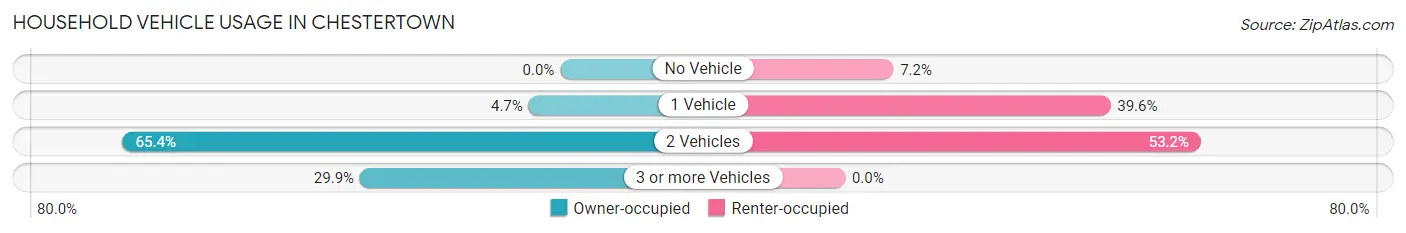
| Vehicles per Household | Owner-occupied | Renter-occupied |
| No Vehicle | 0 (0.0%) | 8 (7.2%) |
| 1 Vehicle | 6 (4.7%) | 44 (39.6%) |
| 2 Vehicles | 83 (65.3%) | 59 (53.1%) |
| 3 or more Vehicles | 38 (29.9%) | 0 (0.0%) |
| Total | 127 (100.0%) | 111 (100.0%) |
Real Estate & Mortgages in Chestertown
Real Estate and Mortgage Overview in Chestertown
| Characteristic | Without Mortgage | With Mortgage |
| Housing Units | 14 | 113 |
| Median Property Value | - | - |
| Median Household Income | - | - |
| Monthly Housing Costs | - | - |
| Real Estate Taxes | - | - |
Property Value by Mortgage Status in Chestertown
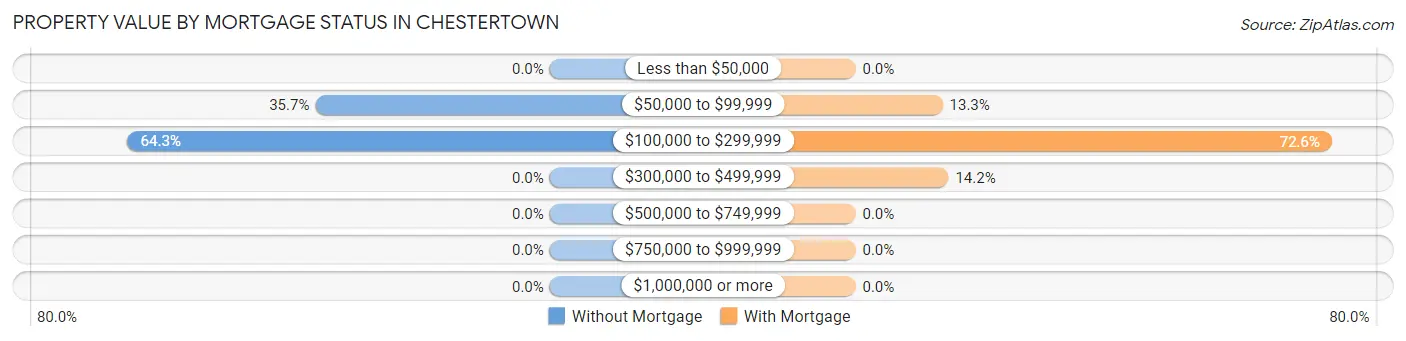
| Property Value | Without Mortgage | With Mortgage |
| Less than $50,000 | 0 (0.0%) | 0 (0.0%) |
| $50,000 to $99,999 | 5 (35.7%) | 15 (13.3%) |
| $100,000 to $299,999 | 9 (64.3%) | 82 (72.6%) |
| $300,000 to $499,999 | 0 (0.0%) | 16 (14.2%) |
| $500,000 to $749,999 | 0 (0.0%) | 0 (0.0%) |
| $750,000 to $999,999 | 0 (0.0%) | 0 (0.0%) |
| $1,000,000 or more | 0 (0.0%) | 0 (0.0%) |
| Total | 14 (100.0%) | 113 (100.0%) |
Household Income by Mortgage Status in Chestertown
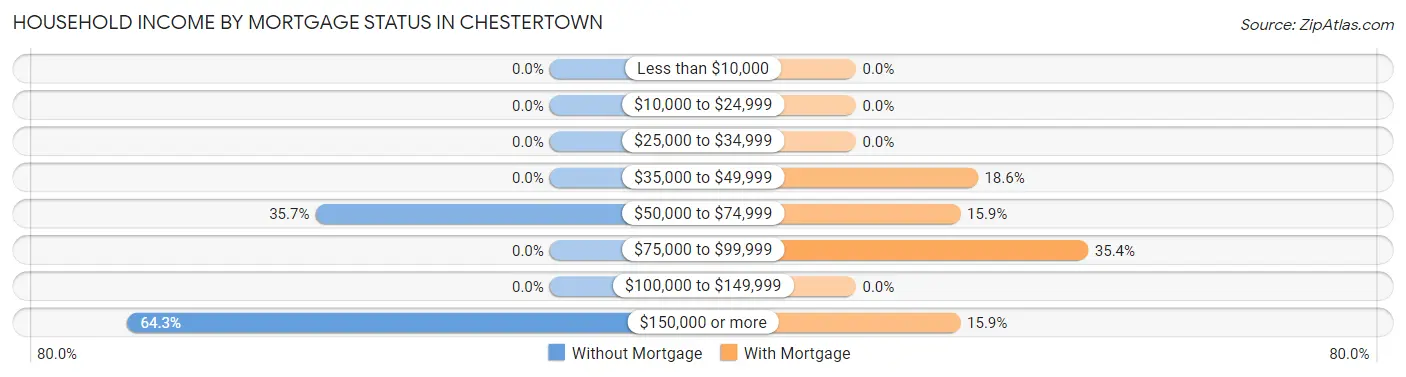
| Household Income | Without Mortgage | With Mortgage |
| Less than $10,000 | 0 (0.0%) | 0 (0.0%) |
| $10,000 to $24,999 | 0 (0.0%) | 0 (0.0%) |
| $25,000 to $34,999 | 0 (0.0%) | 0 (0.0%) |
| $35,000 to $49,999 | 0 (0.0%) | 21 (18.6%) |
| $50,000 to $74,999 | 5 (35.7%) | 18 (15.9%) |
| $75,000 to $99,999 | 0 (0.0%) | 40 (35.4%) |
| $100,000 to $149,999 | 0 (0.0%) | 0 (0.0%) |
| $150,000 or more | 9 (64.3%) | 18 (15.9%) |
| Total | 14 (100.0%) | 113 (100.0%) |
Property Value to Household Income Ratio in Chestertown
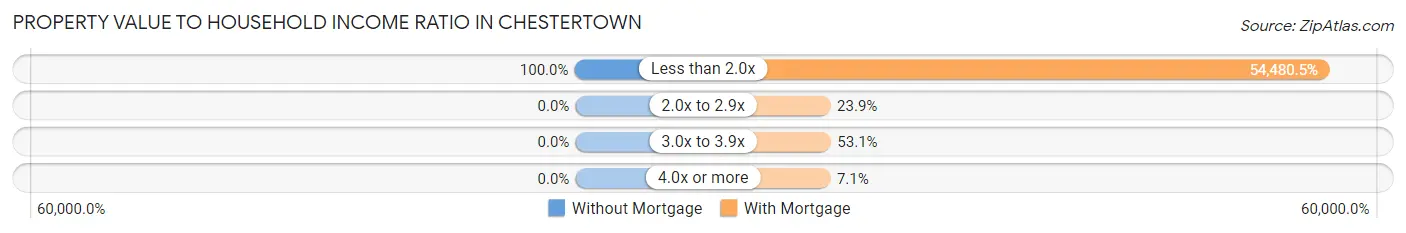
| Value-to-Income Ratio | Without Mortgage | With Mortgage |
| Less than 2.0x | 14 (100.0%) | 61,563 (54,480.5%) |
| 2.0x to 2.9x | 0 (0.0%) | 27 (23.9%) |
| 3.0x to 3.9x | 0 (0.0%) | 60 (53.1%) |
| 4.0x or more | 0 (0.0%) | 8 (7.1%) |
| Total | 14 (100.0%) | 113 (100.0%) |
Real Estate Taxes by Mortgage Status in Chestertown
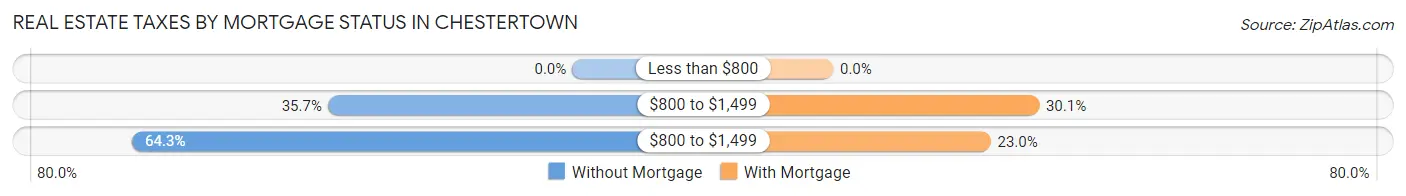
| Property Taxes | Without Mortgage | With Mortgage |
| Less than $800 | 0 (0.0%) | 0 (0.0%) |
| $800 to $1,499 | 5 (35.7%) | 34 (30.1%) |
| $800 to $1,499 | 9 (64.3%) | 26 (23.0%) |
| Total | 14 (100.0%) | 113 (100.0%) |
Health & Disability in Chestertown
Health Insurance Coverage by Age in Chestertown
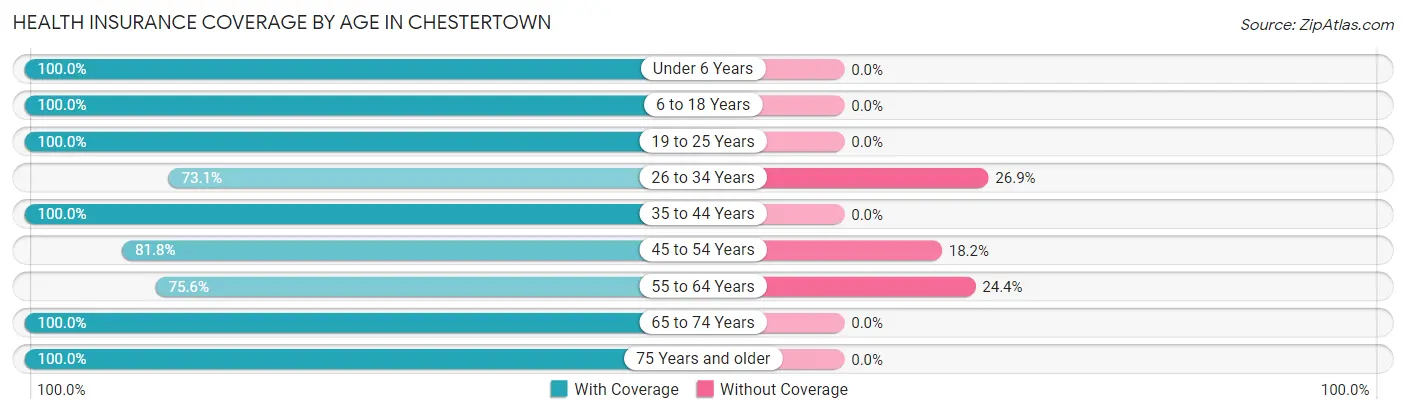
| Age Bracket | With Coverage | Without Coverage |
| Under 6 Years | 22 (100.0%) | 0 (0.0%) |
| 6 to 18 Years | 70 (100.0%) | 0 (0.0%) |
| 19 to 25 Years | 106 (100.0%) | 0 (0.0%) |
| 26 to 34 Years | 49 (73.1%) | 18 (26.9%) |
| 35 to 44 Years | 53 (100.0%) | 0 (0.0%) |
| 45 to 54 Years | 81 (81.8%) | 18 (18.2%) |
| 55 to 64 Years | 68 (75.6%) | 22 (24.4%) |
| 65 to 74 Years | 37 (100.0%) | 0 (0.0%) |
| 75 Years and older | 14 (100.0%) | 0 (0.0%) |
| Total | 500 (89.6%) | 58 (10.4%) |
Health Insurance Coverage by Citizenship Status in Chestertown
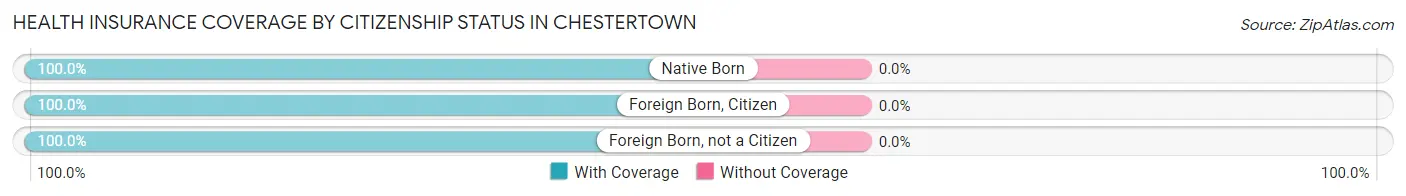
| Citizenship Status | With Coverage | Without Coverage |
| Native Born | 22 (100.0%) | 0 (0.0%) |
| Foreign Born, Citizen | 70 (100.0%) | 0 (0.0%) |
| Foreign Born, not a Citizen | 106 (100.0%) | 0 (0.0%) |
Health Insurance Coverage by Household Income in Chestertown
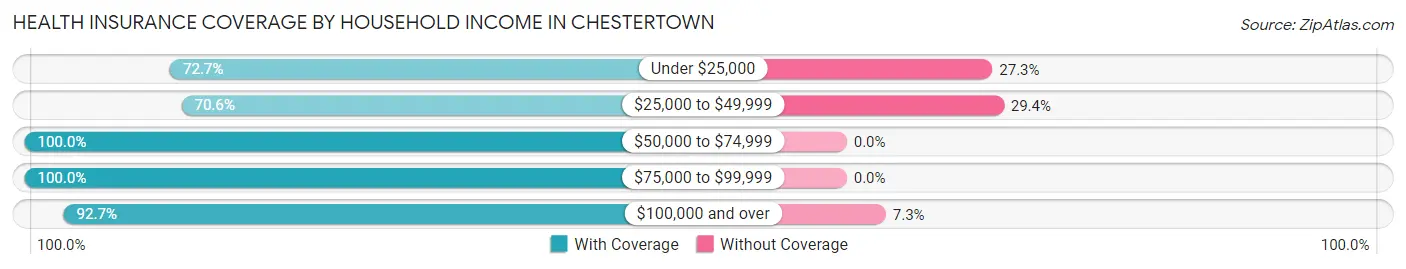
| Household Income | With Coverage | Without Coverage |
| Under $25,000 | 16 (72.7%) | 6 (27.3%) |
| $25,000 to $49,999 | 96 (70.6%) | 40 (29.4%) |
| $50,000 to $74,999 | 162 (100.0%) | 0 (0.0%) |
| $75,000 to $99,999 | 68 (100.0%) | 0 (0.0%) |
| $100,000 and over | 152 (92.7%) | 12 (7.3%) |
Public vs Private Health Insurance Coverage by Age in Chestertown
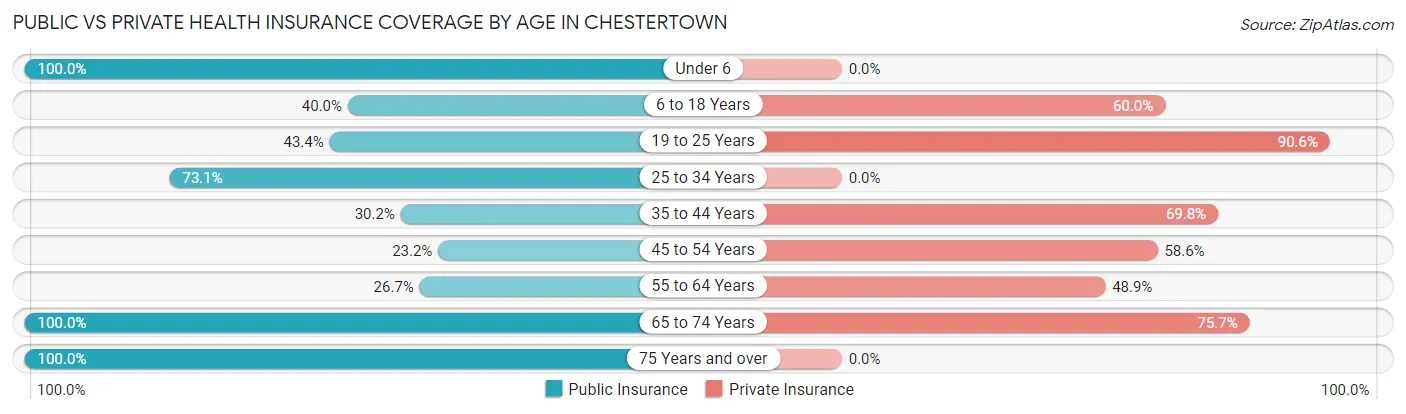
| Age Bracket | Public Insurance | Private Insurance |
| Under 6 | 22 (100.0%) | 0 (0.0%) |
| 6 to 18 Years | 28 (40.0%) | 42 (60.0%) |
| 19 to 25 Years | 46 (43.4%) | 96 (90.6%) |
| 25 to 34 Years | 49 (73.1%) | 0 (0.0%) |
| 35 to 44 Years | 16 (30.2%) | 37 (69.8%) |
| 45 to 54 Years | 23 (23.2%) | 58 (58.6%) |
| 55 to 64 Years | 24 (26.7%) | 44 (48.9%) |
| 65 to 74 Years | 37 (100.0%) | 28 (75.7%) |
| 75 Years and over | 14 (100.0%) | 0 (0.0%) |
| Total | 259 (46.4%) | 305 (54.7%) |
Disability Status by Sex by Age in Chestertown
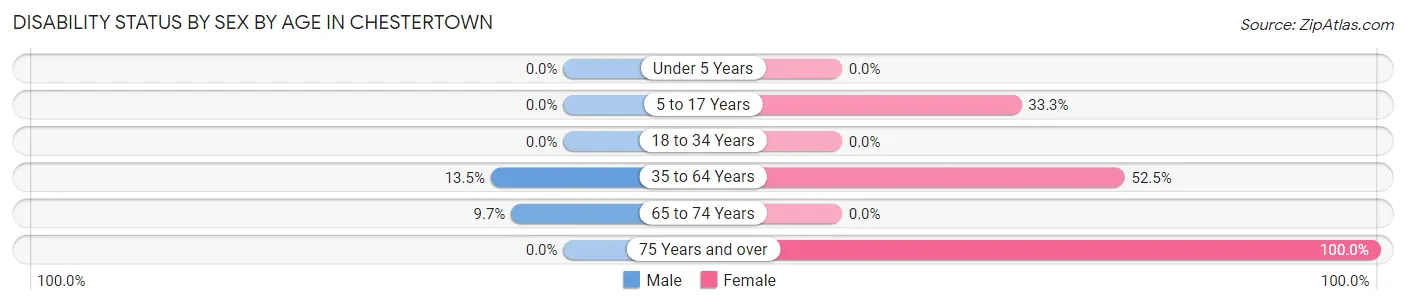
| Age Bracket | Male | Female |
| Under 5 Years | 0 (0.0%) | 0 (0.0%) |
| 5 to 17 Years | 0 (0.0%) | 9 (33.3%) |
| 18 to 34 Years | 0 (0.0%) | 0 (0.0%) |
| 35 to 64 Years | 19 (13.5%) | 53 (52.5%) |
| 65 to 74 Years | 3 (9.7%) | 0 (0.0%) |
| 75 Years and over | 0 (0.0%) | 14 (100.0%) |
Disability Class by Sex by Age in Chestertown
Disability Class: Hearing Difficulty
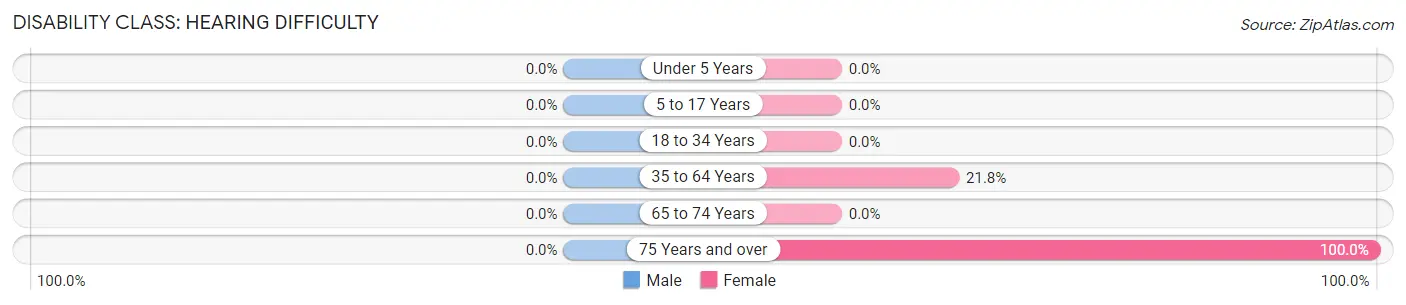
| Age Bracket | Male | Female |
| Under 5 Years | 0 (0.0%) | 0 (0.0%) |
| 5 to 17 Years | 0 (0.0%) | 0 (0.0%) |
| 18 to 34 Years | 0 (0.0%) | 0 (0.0%) |
| 35 to 64 Years | 0 (0.0%) | 22 (21.8%) |
| 65 to 74 Years | 0 (0.0%) | 0 (0.0%) |
| 75 Years and over | 0 (0.0%) | 14 (100.0%) |
Disability Class: Vision Difficulty
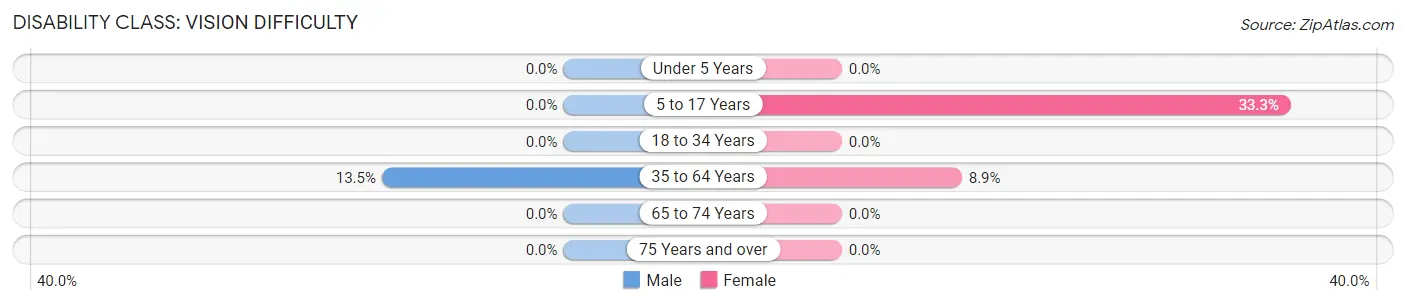
| Age Bracket | Male | Female |
| Under 5 Years | 0 (0.0%) | 0 (0.0%) |
| 5 to 17 Years | 0 (0.0%) | 9 (33.3%) |
| 18 to 34 Years | 0 (0.0%) | 0 (0.0%) |
| 35 to 64 Years | 19 (13.5%) | 9 (8.9%) |
| 65 to 74 Years | 0 (0.0%) | 0 (0.0%) |
| 75 Years and over | 0 (0.0%) | 0 (0.0%) |
Disability Class: Cognitive Difficulty
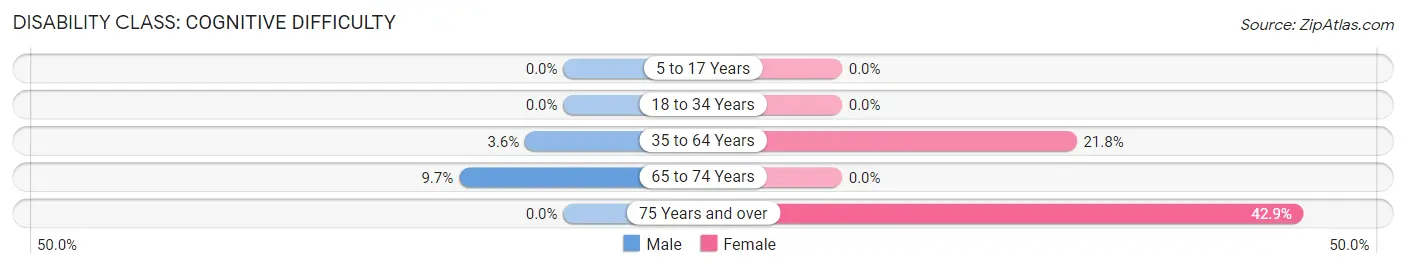
| Age Bracket | Male | Female |
| 5 to 17 Years | 0 (0.0%) | 0 (0.0%) |
| 18 to 34 Years | 0 (0.0%) | 0 (0.0%) |
| 35 to 64 Years | 5 (3.5%) | 22 (21.8%) |
| 65 to 74 Years | 3 (9.7%) | 0 (0.0%) |
| 75 Years and over | 0 (0.0%) | 6 (42.9%) |
Disability Class: Ambulatory Difficulty
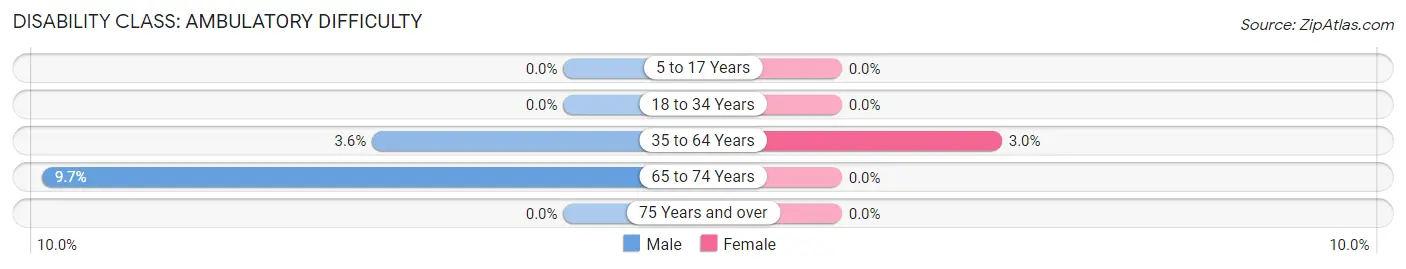
| Age Bracket | Male | Female |
| 5 to 17 Years | 0 (0.0%) | 0 (0.0%) |
| 18 to 34 Years | 0 (0.0%) | 0 (0.0%) |
| 35 to 64 Years | 5 (3.5%) | 3 (3.0%) |
| 65 to 74 Years | 3 (9.7%) | 0 (0.0%) |
| 75 Years and over | 0 (0.0%) | 0 (0.0%) |
Disability Class: Self-Care Difficulty
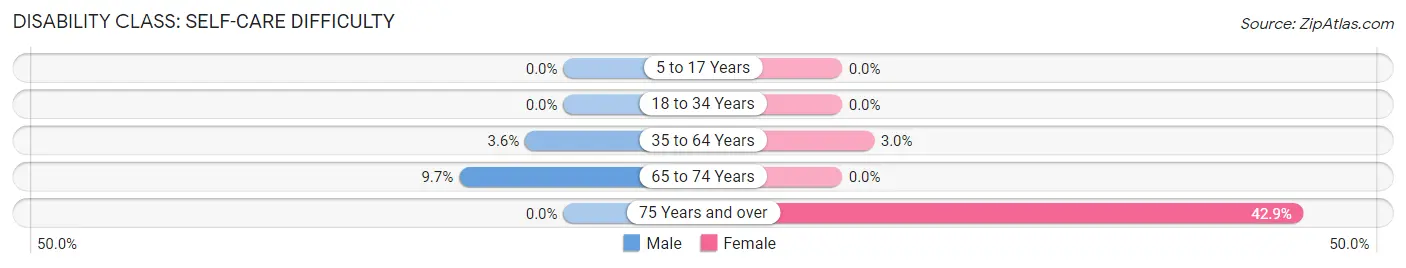
| Age Bracket | Male | Female |
| 5 to 17 Years | 0 (0.0%) | 0 (0.0%) |
| 18 to 34 Years | 0 (0.0%) | 0 (0.0%) |
| 35 to 64 Years | 5 (3.5%) | 3 (3.0%) |
| 65 to 74 Years | 3 (9.7%) | 0 (0.0%) |
| 75 Years and over | 0 (0.0%) | 6 (42.9%) |
Technology Access in Chestertown
Computing Device Access in Chestertown
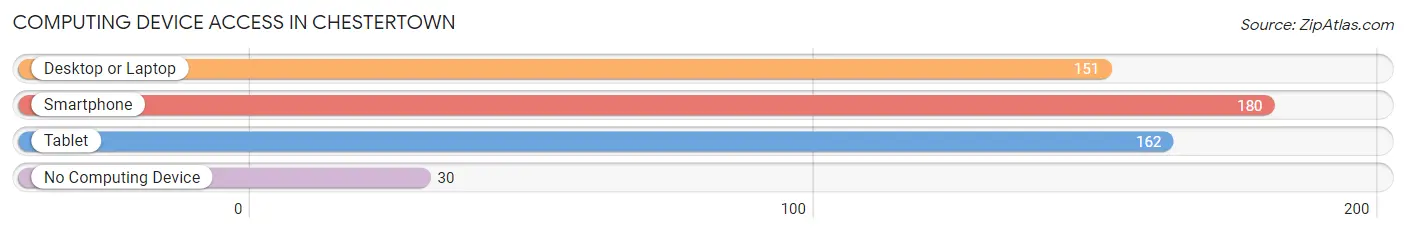
| Device Type | # Households | % Households |
| Desktop or Laptop | 151 | 63.4% |
| Smartphone | 180 | 75.6% |
| Tablet | 162 | 68.1% |
| No Computing Device | 30 | 12.6% |
| Total | 238 | 100.0% |
Internet Access in Chestertown
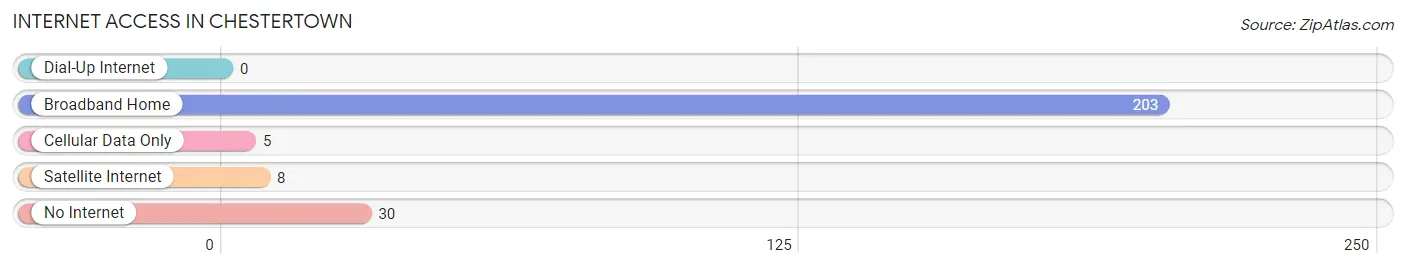
| Internet Type | # Households | % Households |
| Dial-Up Internet | 0 | 0.0% |
| Broadband Home | 203 | 85.3% |
| Cellular Data Only | 5 | 2.1% |
| Satellite Internet | 8 | 3.4% |
| No Internet | 30 | 12.6% |
| Total | 238 | 100.0% |
Chestertown Summary
Chestertown is a town located in the Adirondack Mountains of Warren County, New York, United States. The population was 1,717 at the 2010 census. The town is named after the Chestertown, Maryland, which was the hometown of an early settler.
History
The area that is now Chestertown was first settled in 1786 by a group of settlers from Connecticut. The town was originally part of the town of Thurman, but was separated in 1817 and incorporated as the town of Chestertown.
The town was an important center of the lumber industry in the 19th century. The town was also home to several iron ore mines, which were in operation until the early 20th century.
Geography
Chestertown is located in the Adirondack Mountains of Warren County, New York. The town is bordered by the towns of Thurman to the north, Johnsburg to the east, and Chester to the south. The town is located approximately 30 miles south of the city of Glens Falls.
The town has a total area of 44.2 square miles, of which 44.1 square miles is land and 0.1 square miles is water. The highest point in the town is an unnamed peak in the Adirondack Mountains, which has an elevation of 2,890 feet above sea level.
Economy
The economy of Chestertown is largely based on tourism. The town is home to several ski resorts, including Hickory Ski Center and Gore Mountain. The town is also home to several campgrounds, including Chestertown Campground and Chestertown Beach.
The town is also home to several businesses, including a lumber mill, a sawmill, and a furniture factory.
Demographics
As of the 2010 census, there were 1,717 people, 717 households, and 463 families residing in the town. The population density was 38.9 people per square mile. The racial makeup of the town was 97.2% White, 0.5% African American, 0.2% Native American, 0.2% Asian, 0.1% Pacific Islander, 0.6% from other races, and 1.2% from two or more races. Hispanic or Latino of any race were 1.7% of the population.
The median income for a household in the town was $41,250, and the median income for a family was $50,000. The per capita income for the town was $20,945. About 10.2% of families and 14.2% of the population were below the poverty line, including 18.2% of those under age 18 and 8.2% of those age 65 or over.
Common Questions
What is Per Capita Income in Chestertown?
Per Capita income in Chestertown is $29,410.
What is the Median Family Income in Chestertown?
Median Family Income in Chestertown is $49,261.
What is the Median Household income in Chestertown?
Median Household Income in Chestertown is $61,423.
What is Income or Wage Gap in Chestertown?
Income or Wage Gap in Chestertown is 43.0%.
Women in Chestertown earn 57.0 cents for every dollar earned by a man.
What is Inequality or Gini Index in Chestertown?
Inequality or Gini Index in Chestertown is 0.31.
What is the Total Population of Chestertown?
Total Population of Chestertown is 558.
What is the Total Male Population of Chestertown?
Total Male Population of Chestertown is 234.
What is the Total Female Population of Chestertown?
Total Female Population of Chestertown is 324.
What is the Ratio of Males per 100 Females in Chestertown?
There are 72.22 Males per 100 Females in Chestertown.
What is the Ratio of Females per 100 Males in Chestertown?
There are 138.46 Females per 100 Males in Chestertown.
What is the Median Population Age in Chestertown?
Median Population Age in Chestertown is 39.1 Years.
What is the Average Family Size in Chestertown
Average Family Size in Chestertown is 2.6 People.
What is the Average Household Size in Chestertown
Average Household Size in Chestertown is 2.3 People.
How Large is the Labor Force in Chestertown?
There are 372 People in the Labor Forcein in Chestertown.
What is the Percentage of People in the Labor Force in Chestertown?
74.5% of People are in the Labor Force in Chestertown.
What is the Unemployment Rate in Chestertown?
Unemployment Rate in Chestertown is 22.6%.