Weston Mills, NY Map & Demographics
Weston Mills Map
Weston Mills Overview
$51,907
PER CAPITA INCOME
$77,208
AVG FAMILY INCOME
$73,300
AVG HOUSEHOLD INCOME
27.6%
WAGE / INCOME GAP [ % ]
72.4¢/ $1
WAGE / INCOME GAP [ $ ]
0.51
INEQUALITY / GINI INDEX
1,259
TOTAL POPULATION
635
MALE POPULATION
624
FEMALE POPULATION
101.76
MALES / 100 FEMALES
98.27
FEMALES / 100 MALES
55.4
MEDIAN AGE
2.5
AVG FAMILY SIZE
2.1
AVG HOUSEHOLD SIZE
607
LABOR FORCE [ PEOPLE ]
54.3%
PERCENT IN LABOR FORCE
11.6%
UNEMPLOYMENT RATE
Income in Weston Mills
Income Overview in Weston Mills
Per Capita Income in Weston Mills is $51,907, while median incomes of families and households are $77,208 and $73,300 respectively.
| Characteristic | Number | Measure |
| Per Capita Income | 1,259 | $51,907 |
| Median Family Income | 429 | $77,208 |
| Mean Family Income | 429 | $126,867 |
| Median Household Income | 580 | $73,300 |
| Mean Household Income | 580 | $107,839 |
| Income Deficit | 429 | $0 |
| Wage / Income Gap (%) | 1,259 | 27.62% |
| Wage / Income Gap ($) | 1,259 | 72.38¢ per $1 |
| Gini / Inequality Index | 1,259 | 0.51 |
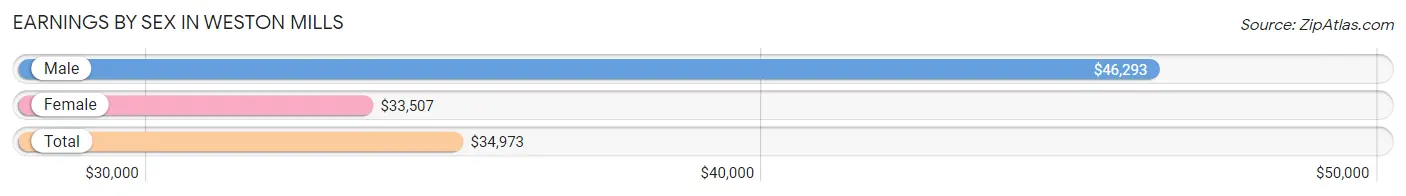
Earnings by Sex in Weston Mills
Average Earnings in Weston Mills are $34,973, $46,293 for men and $33,507 for women, a difference of 27.6%.
| Sex | Number | Average Earnings |
| Male | 398 (56.9%) | $46,293 |
| Female | 301 (43.1%) | $33,507 |
| Total | 699 (100.0%) | $34,973 |
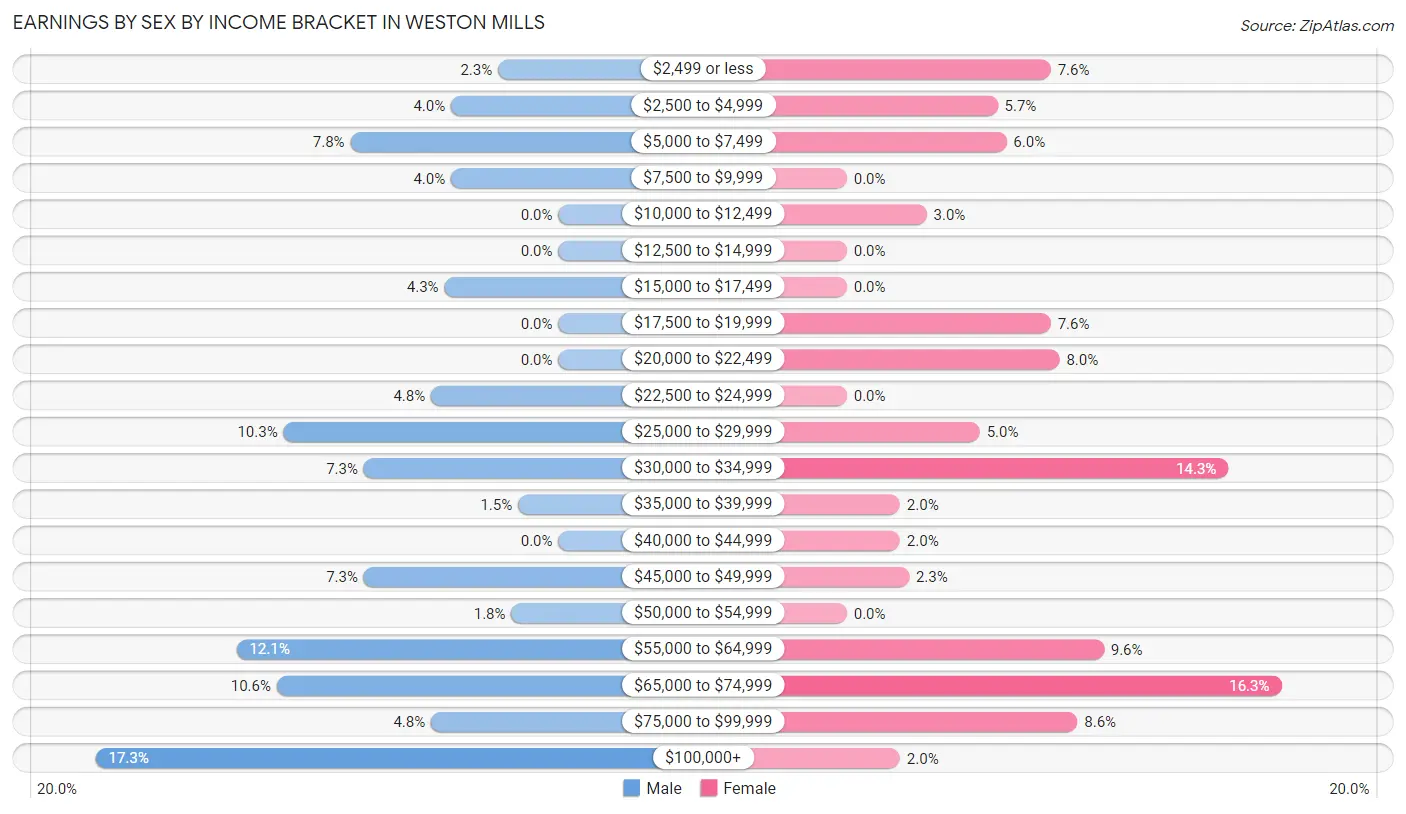
Earnings by Sex by Income Bracket in Weston Mills
The most common earnings brackets in Weston Mills are $100,000+ for men (69 | 17.3%) and $65,000 to $74,999 for women (49 | 16.3%).
| Income | Male | Female |
| $2,499 or less | 9 (2.3%) | 23 (7.6%) |
| $2,500 to $4,999 | 16 (4.0%) | 17 (5.7%) |
| $5,000 to $7,499 | 31 (7.8%) | 18 (6.0%) |
| $7,500 to $9,999 | 16 (4.0%) | 0 (0.0%) |
| $10,000 to $12,499 | 0 (0.0%) | 9 (3.0%) |
| $12,500 to $14,999 | 0 (0.0%) | 0 (0.0%) |
| $15,000 to $17,499 | 17 (4.3%) | 0 (0.0%) |
| $17,500 to $19,999 | 0 (0.0%) | 23 (7.6%) |
| $20,000 to $22,499 | 0 (0.0%) | 24 (8.0%) |
| $22,500 to $24,999 | 19 (4.8%) | 0 (0.0%) |
| $25,000 to $29,999 | 41 (10.3%) | 15 (5.0%) |
| $30,000 to $34,999 | 29 (7.3%) | 43 (14.3%) |
| $35,000 to $39,999 | 6 (1.5%) | 6 (2.0%) |
| $40,000 to $44,999 | 0 (0.0%) | 6 (2.0%) |
| $45,000 to $49,999 | 29 (7.3%) | 7 (2.3%) |
| $50,000 to $54,999 | 7 (1.8%) | 0 (0.0%) |
| $55,000 to $64,999 | 48 (12.1%) | 29 (9.6%) |
| $65,000 to $74,999 | 42 (10.5%) | 49 (16.3%) |
| $75,000 to $99,999 | 19 (4.8%) | 26 (8.6%) |
| $100,000+ | 69 (17.3%) | 6 (2.0%) |
| Total | 398 (100.0%) | 301 (100.0%) |
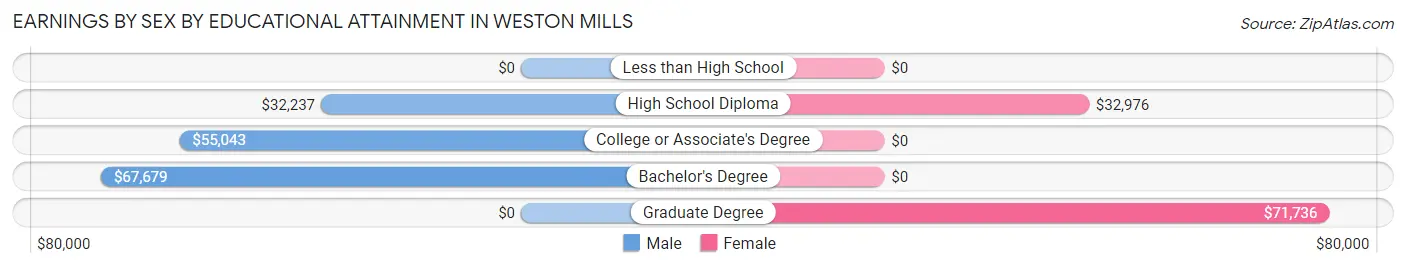
Earnings by Sex by Educational Attainment in Weston Mills
Average earnings in Weston Mills are $55,183 for men and $35,625 for women, a difference of 35.4%. Men with an educational attainment of bachelor's degree enjoy the highest average annual earnings of $67,679, while those with high school diploma education earn the least with $32,237. Women with an educational attainment of graduate degree earn the most with the average annual earnings of $71,736, while those with high school diploma education have the smallest earnings of $32,976.
| Educational Attainment | Male Income | Female Income |
| Less than High School | - | - |
| High School Diploma | $32,237 | $32,976 |
| College or Associate's Degree | $55,043 | $0 |
| Bachelor's Degree | $67,679 | $0 |
| Graduate Degree | - | - |
| Total | $55,183 | $35,625 |
Family Income in Weston Mills
Family Income Brackets in Weston Mills
According to the Weston Mills family income data, there are 71 families falling into the $50,000 to $74,999 income range, which is the most common income bracket and makes up 16.6% of all families.
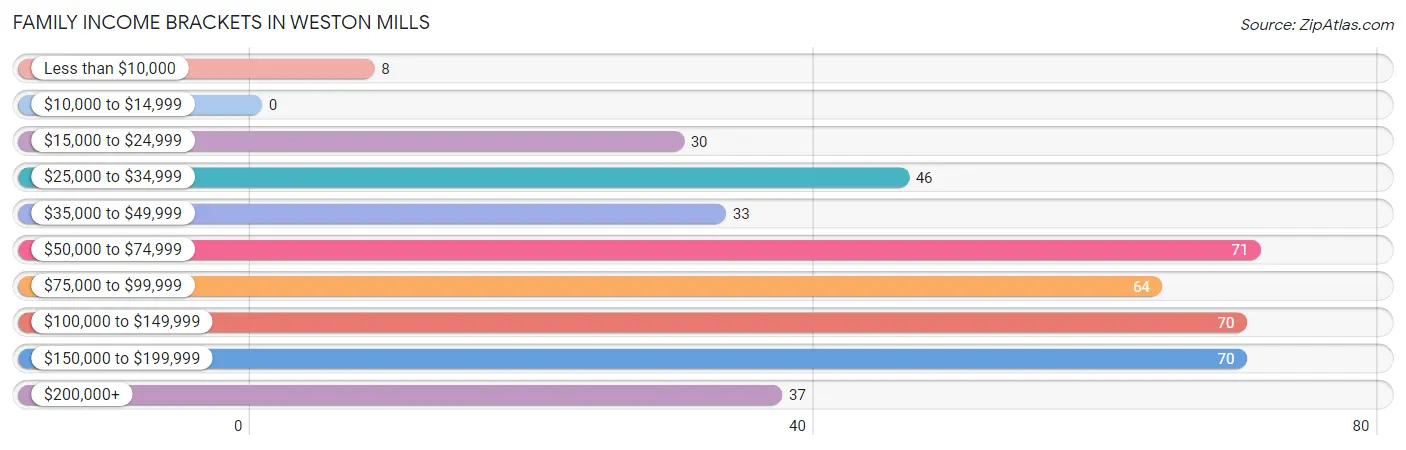
| Income Bracket | # Families | % Families |
| Less than $10,000 | 8 | 1.9% |
| $10,000 to $14,999 | 0 | 0.0% |
| $15,000 to $24,999 | 30 | 7.0% |
| $25,000 to $34,999 | 46 | 10.7% |
| $35,000 to $49,999 | 33 | 7.7% |
| $50,000 to $74,999 | 71 | 16.6% |
| $75,000 to $99,999 | 64 | 14.9% |
| $100,000 to $149,999 | 70 | 16.3% |
| $150,000 to $199,999 | 70 | 16.3% |
| $200,000+ | 37 | 8.6% |
Family Income by Famaliy Size in Weston Mills
3-person families (42 | 9.8%) account for the highest median family income in Weston Mills with $151,250 per family, while 3-person families (42 | 9.8%) have the highest median income of $50,417 per family member.
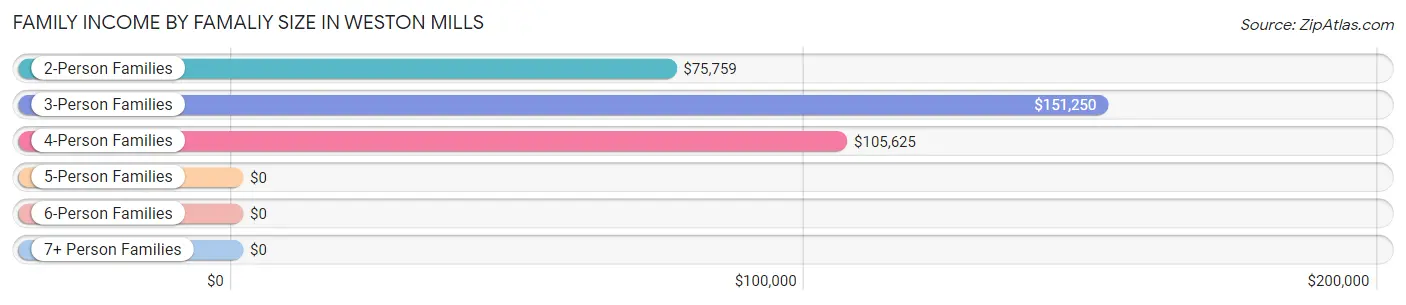
| Income Bracket | # Families | Median Income |
| 2-Person Families | 315 (73.4%) | $75,759 |
| 3-Person Families | 42 (9.8%) | $151,250 |
| 4-Person Families | 57 (13.3%) | $105,625 |
| 5-Person Families | 5 (1.2%) | $0 |
| 6-Person Families | 0 (0.0%) | $0 |
| 7+ Person Families | 10 (2.3%) | $0 |
| Total | 429 (100.0%) | $77,208 |
Family Income by Number of Earners in Weston Mills
The median family income in Weston Mills is $77,208, with families comprising 2 earners (135) having the highest median family income of $168,162, while families with no earners (101) have the lowest median family income of $47,321, accounting for 31.5% and 23.5% of families, respectively.
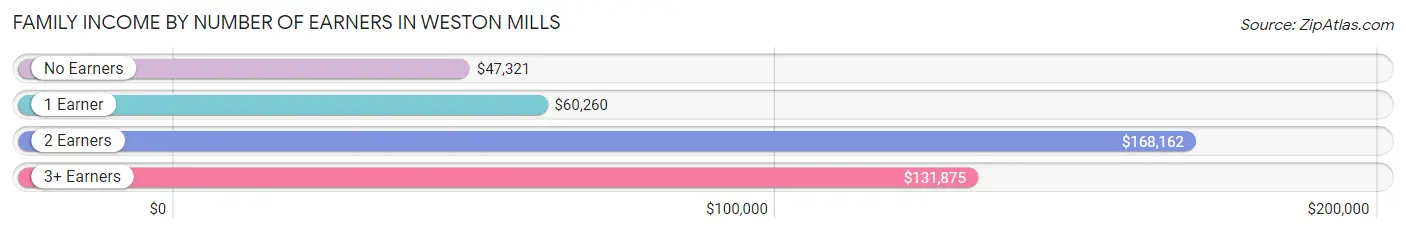
| Number of Earners | # Families | Median Income |
| No Earners | 101 (23.5%) | $47,321 |
| 1 Earner | 137 (31.9%) | $60,260 |
| 2 Earners | 135 (31.5%) | $168,162 |
| 3+ Earners | 56 (13.1%) | $131,875 |
| Total | 429 (100.0%) | $77,208 |
Household Income in Weston Mills
Household Income Brackets in Weston Mills
With 111 households falling in the category, the $50,000 to $74,999 income range is the most frequent in Weston Mills, accounting for 19.1% of all households.
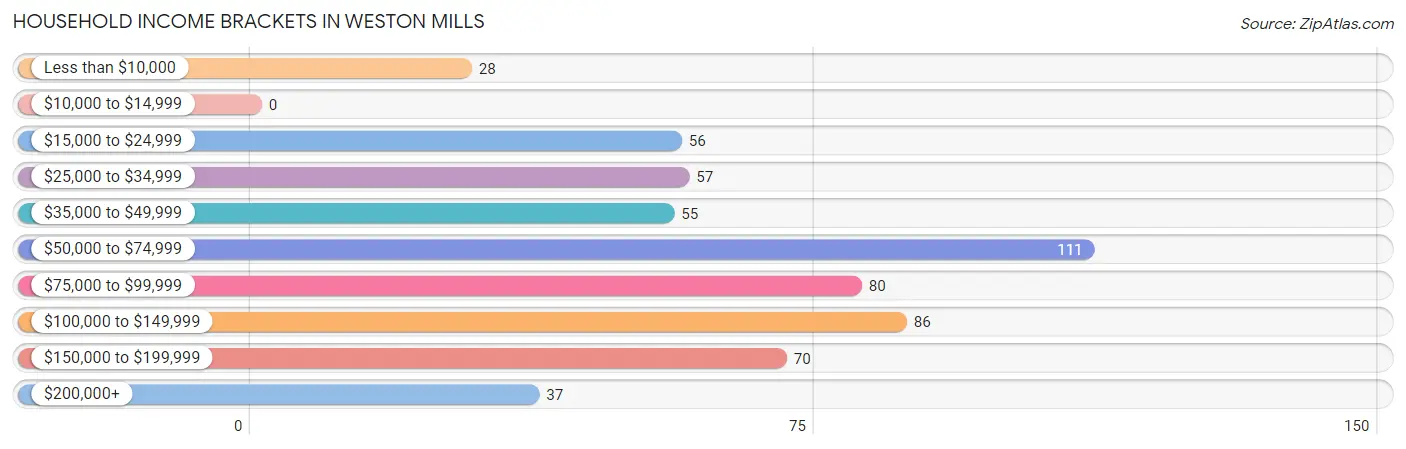
| Income Bracket | # Households | % Households |
| Less than $10,000 | 28 | 4.8% |
| $10,000 to $14,999 | 0 | 0.0% |
| $15,000 to $24,999 | 56 | 9.7% |
| $25,000 to $34,999 | 57 | 9.8% |
| $35,000 to $49,999 | 55 | 9.5% |
| $50,000 to $74,999 | 111 | 19.1% |
| $75,000 to $99,999 | 80 | 13.8% |
| $100,000 to $149,999 | 86 | 14.8% |
| $150,000 to $199,999 | 70 | 12.1% |
| $200,000+ | 37 | 6.4% |
Household Income by Householder Age in Weston Mills
The median household income in Weston Mills is $73,300, with the highest median household income of $88,958 found in the 45 to 64 years age bracket for the primary householder. A total of 207 households (35.7%) fall into this category. Meanwhile, the 15 to 24 years age bracket for the primary householder has the lowest median household income of $0, with 23 households (4.0%) in this group.
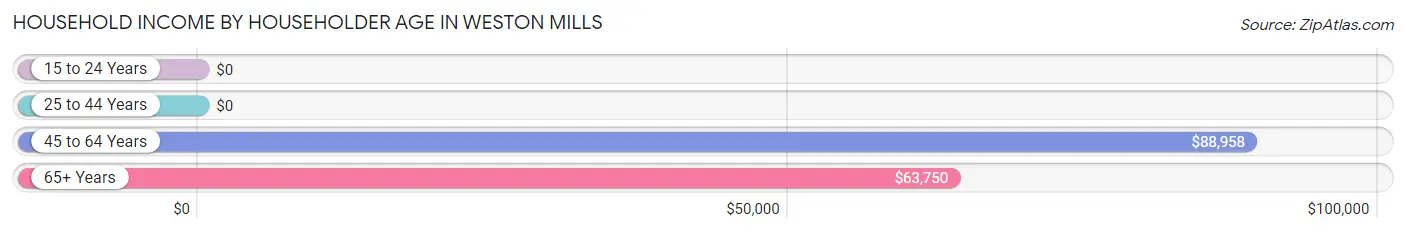
| Income Bracket | # Households | Median Income |
| 15 to 24 Years | 23 (4.0%) | $0 |
| 25 to 44 Years | 69 (11.9%) | $0 |
| 45 to 64 Years | 207 (35.7%) | $88,958 |
| 65+ Years | 281 (48.4%) | $63,750 |
| Total | 580 (100.0%) | $73,300 |
Poverty in Weston Mills
Income Below Poverty by Sex and Age in Weston Mills
With 6.4% poverty level for males and 9.1% for females among the residents of Weston Mills, under 5 year old males and 18 to 24 year old females are the most vulnerable to poverty, with 24 males (85.7%) and 23 females (50.0%) in their respective age groups living below the poverty level.
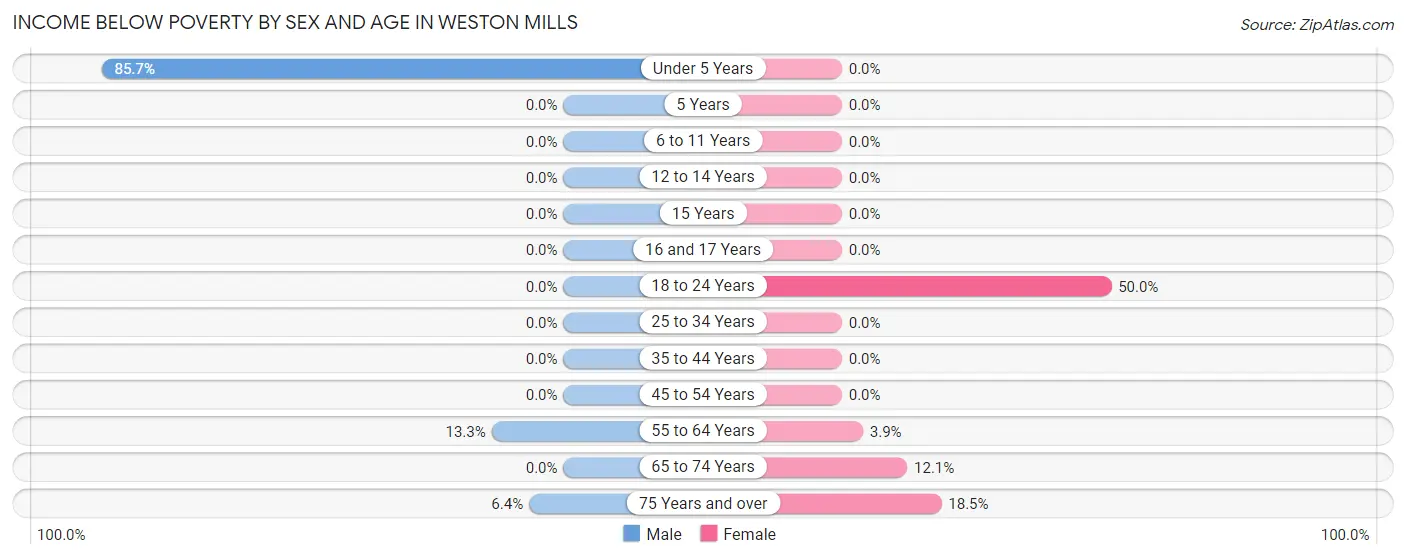
| Age Bracket | Male | Female |
| Under 5 Years | 24 (85.7%) | 0 (0.0%) |
| 5 Years | 0 (0.0%) | 0 (0.0%) |
| 6 to 11 Years | 0 (0.0%) | 0 (0.0%) |
| 12 to 14 Years | 0 (0.0%) | 0 (0.0%) |
| 15 Years | 0 (0.0%) | 0 (0.0%) |
| 16 and 17 Years | 0 (0.0%) | 0 (0.0%) |
| 18 to 24 Years | 0 (0.0%) | 23 (50.0%) |
| 25 to 34 Years | 0 (0.0%) | 0 (0.0%) |
| 35 to 44 Years | 0 (0.0%) | 0 (0.0%) |
| 45 to 54 Years | 0 (0.0%) | 0 (0.0%) |
| 55 to 64 Years | 10 (13.3%) | 5 (3.9%) |
| 65 to 74 Years | 0 (0.0%) | 12 (12.1%) |
| 75 Years and over | 6 (6.4%) | 17 (18.5%) |
| Total | 40 (6.4%) | 57 (9.1%) |
Income Above Poverty by Sex and Age in Weston Mills
According to the poverty statistics in Weston Mills, males aged 6 to 11 years and females aged under 5 years are the age groups that are most secure financially, with 100.0% of males and 100.0% of females in these age groups living above the poverty line.
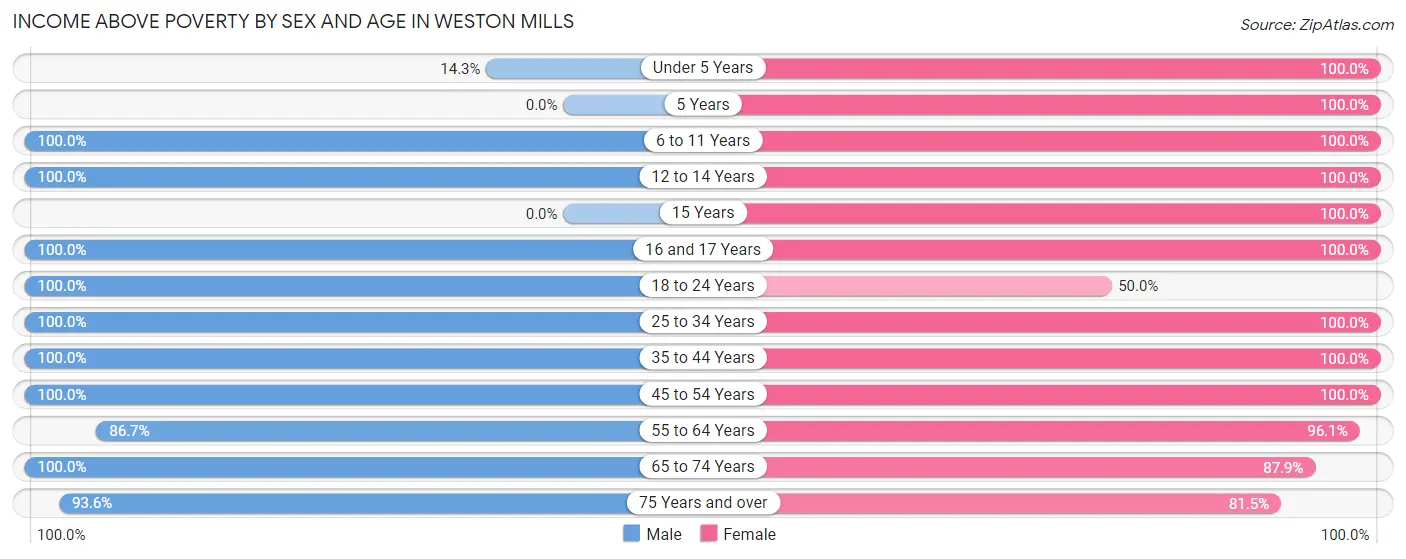
| Age Bracket | Male | Female |
| Under 5 Years | 4 (14.3%) | 4 (100.0%) |
| 5 Years | 0 (0.0%) | 19 (100.0%) |
| 6 to 11 Years | 11 (100.0%) | 34 (100.0%) |
| 12 to 14 Years | 3 (100.0%) | 34 (100.0%) |
| 15 Years | 0 (0.0%) | 6 (100.0%) |
| 16 and 17 Years | 22 (100.0%) | 12 (100.0%) |
| 18 to 24 Years | 31 (100.0%) | 23 (50.0%) |
| 25 to 34 Years | 56 (100.0%) | 32 (100.0%) |
| 35 to 44 Years | 27 (100.0%) | 34 (100.0%) |
| 45 to 54 Years | 130 (100.0%) | 84 (100.0%) |
| 55 to 64 Years | 65 (86.7%) | 123 (96.1%) |
| 65 to 74 Years | 153 (100.0%) | 87 (87.9%) |
| 75 Years and over | 88 (93.6%) | 75 (81.5%) |
| Total | 590 (93.6%) | 567 (90.9%) |
Income Below Poverty Among Married-Couple Families in Weston Mills

| Children | Above Poverty | Below Poverty |
| No Children | 270 (100.0%) | 0 (0.0%) |
| 1 or 2 Children | 73 (100.0%) | 0 (0.0%) |
| 3 or 4 Children | 5 (100.0%) | 0 (0.0%) |
| 5 or more Children | 0 (0.0%) | 0 (0.0%) |
| Total | 348 (100.0%) | 0 (0.0%) |
Income Below Poverty Among Single-Parent Households in Weston Mills
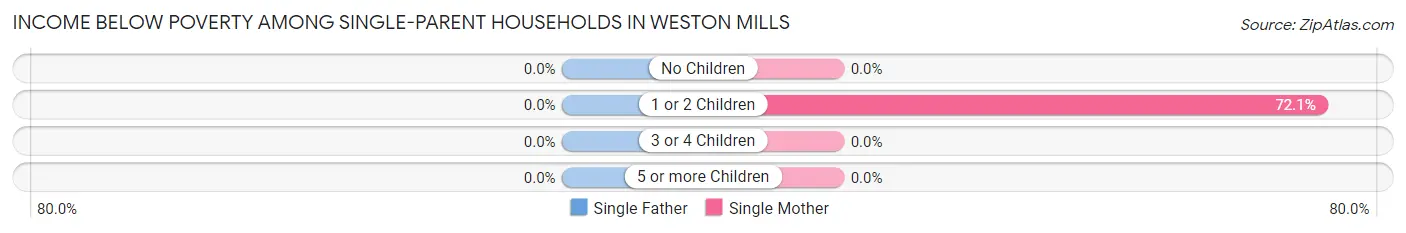
| Children | Single Father | Single Mother |
| No Children | 0 (0.0%) | 0 (0.0%) |
| 1 or 2 Children | 0 (0.0%) | 31 (72.1%) |
| 3 or 4 Children | 0 (0.0%) | 0 (0.0%) |
| 5 or more Children | 0 (0.0%) | 0 (0.0%) |
| Total | 0 (0.0%) | 31 (47.7%) |
Income Below Poverty Among Married-Couple vs Single-Parent Households in Weston Mills
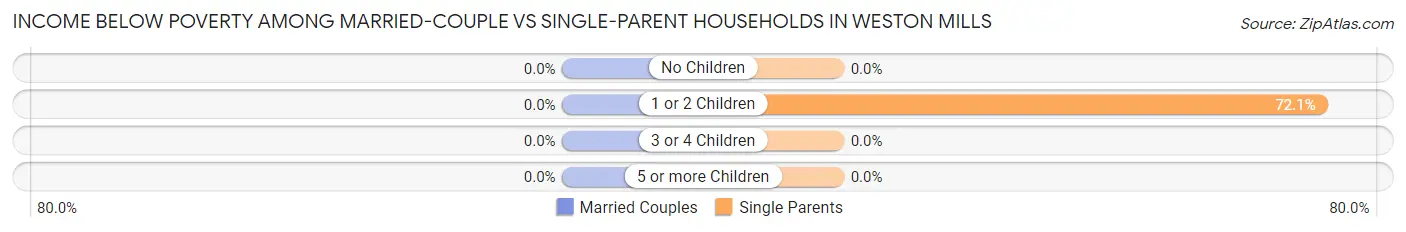
| Children | Married-Couple Families | Single-Parent Households |
| No Children | 0 (0.0%) | 0 (0.0%) |
| 1 or 2 Children | 0 (0.0%) | 31 (72.1%) |
| 3 or 4 Children | 0 (0.0%) | 0 (0.0%) |
| 5 or more Children | 0 (0.0%) | 0 (0.0%) |
| Total | 0 (0.0%) | 31 (38.3%) |
Race in Weston Mills
The most populous races in Weston Mills are White / Caucasian (1,166 | 92.6%), Black / African American (62 | 4.9%), and Hispanic or Latino (24 | 1.9%).
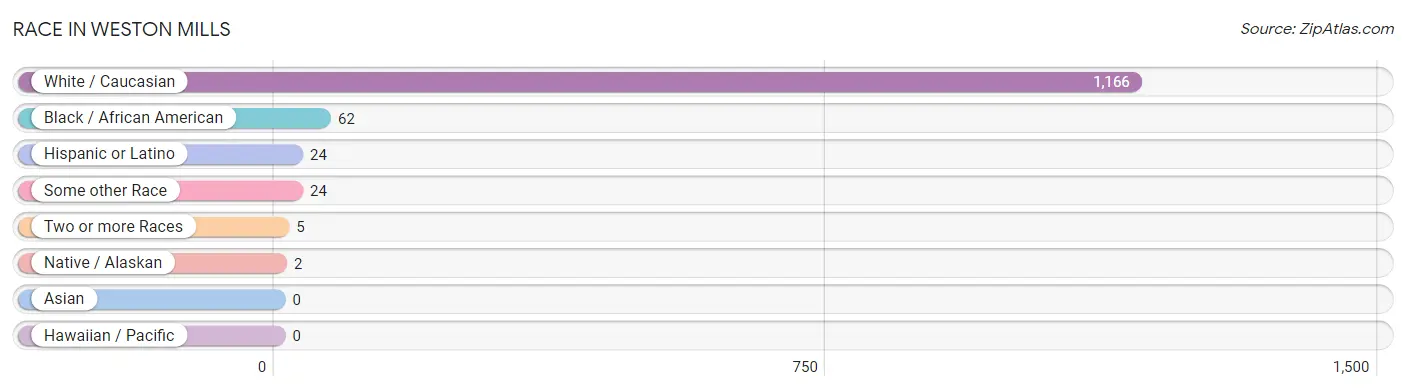
| Race | # Population | % Population |
| Asian | 0 | 0.0% |
| Black / African American | 62 | 4.9% |
| Hawaiian / Pacific | 0 | 0.0% |
| Hispanic or Latino | 24 | 1.9% |
| Native / Alaskan | 2 | 0.2% |
| White / Caucasian | 1,166 | 92.6% |
| Two or more Races | 5 | 0.4% |
| Some other Race | 24 | 1.9% |
| Total | 1,259 | 100.0% |
Ancestry in Weston Mills
The most populous ancestries reported in Weston Mills are German (277 | 22.0%), English (206 | 16.4%), Irish (168 | 13.3%), Polish (144 | 11.4%), and Italian (77 | 6.1%), together accounting for 69.3% of all Weston Mills residents.
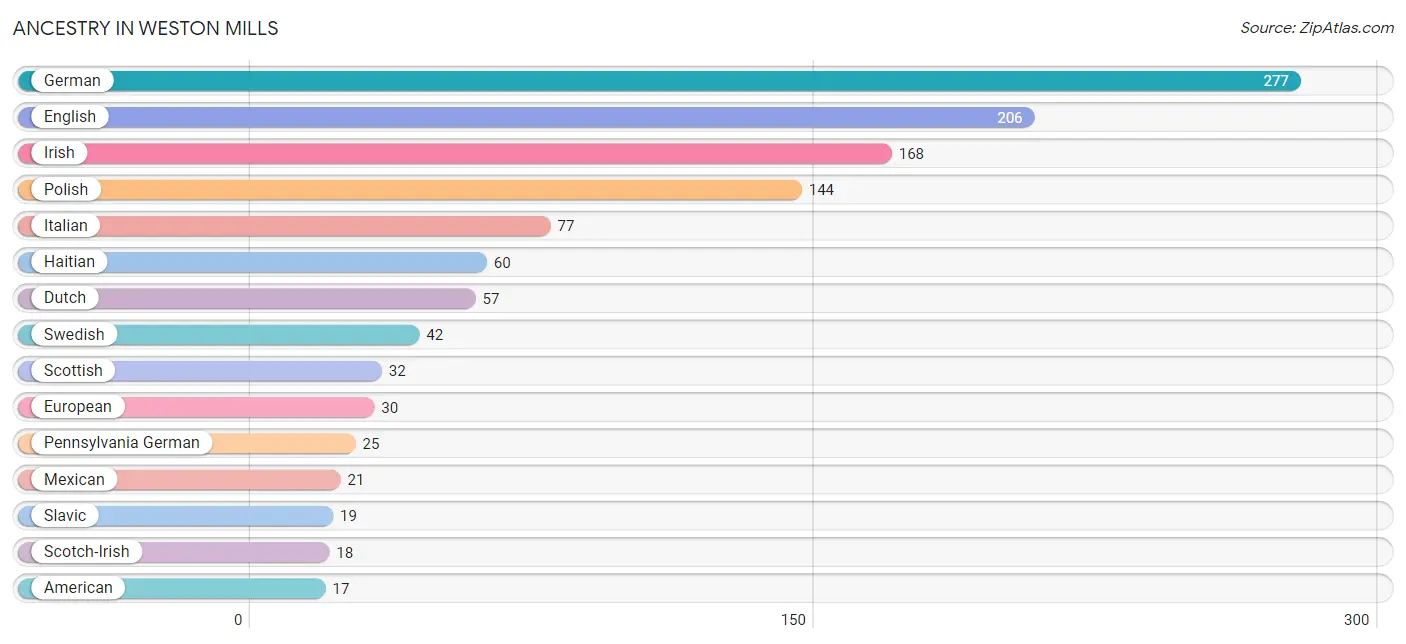
| Ancestry | # Population | % Population |
| American | 17 | 1.3% |
| Dutch | 57 | 4.5% |
| English | 206 | 16.4% |
| European | 30 | 2.4% |
| French Canadian | 6 | 0.5% |
| German | 277 | 22.0% |
| Haitian | 60 | 4.8% |
| Irish | 168 | 13.3% |
| Italian | 77 | 6.1% |
| Mexican | 21 | 1.7% |
| Pennsylvania German | 25 | 2.0% |
| Polish | 144 | 11.4% |
| Puerto Rican | 3 | 0.2% |
| Scotch-Irish | 18 | 1.4% |
| Scottish | 32 | 2.5% |
| Slavic | 19 | 1.5% |
| Subsaharan African | 5 | 0.4% |
| Swedish | 42 | 3.3% |
| Ukrainian | 7 | 0.6% | View All 19 Rows |
Immigrants in Weston Mills
The most numerous immigrant groups reported in Weston Mills came from Caribbean (19 | 1.5%), Haiti (19 | 1.5%), Latin America (19 | 1.5%), Europe (4 | 0.3%), and Germany (4 | 0.3%), together accounting for 5.2% of all Weston Mills residents.
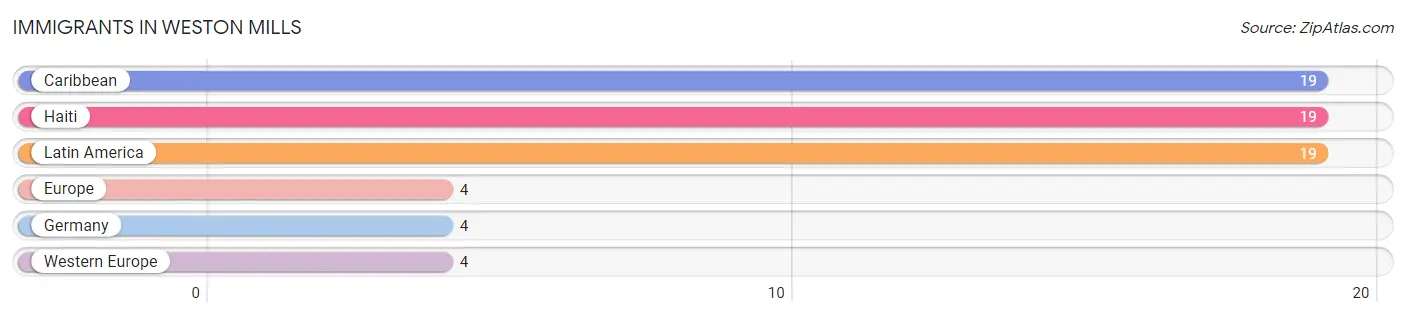
| Immigration Origin | # Population | % Population |
| Caribbean | 19 | 1.5% |
| Europe | 4 | 0.3% |
| Germany | 4 | 0.3% |
| Haiti | 19 | 1.5% |
| Latin America | 19 | 1.5% |
| Western Europe | 4 | 0.3% | View All 6 Rows |
Sex and Age in Weston Mills
Sex and Age in Weston Mills
The most populous age groups in Weston Mills are 65 to 69 Years (99 | 15.6%) for men and 60 to 64 Years (80 | 12.8%) for women.
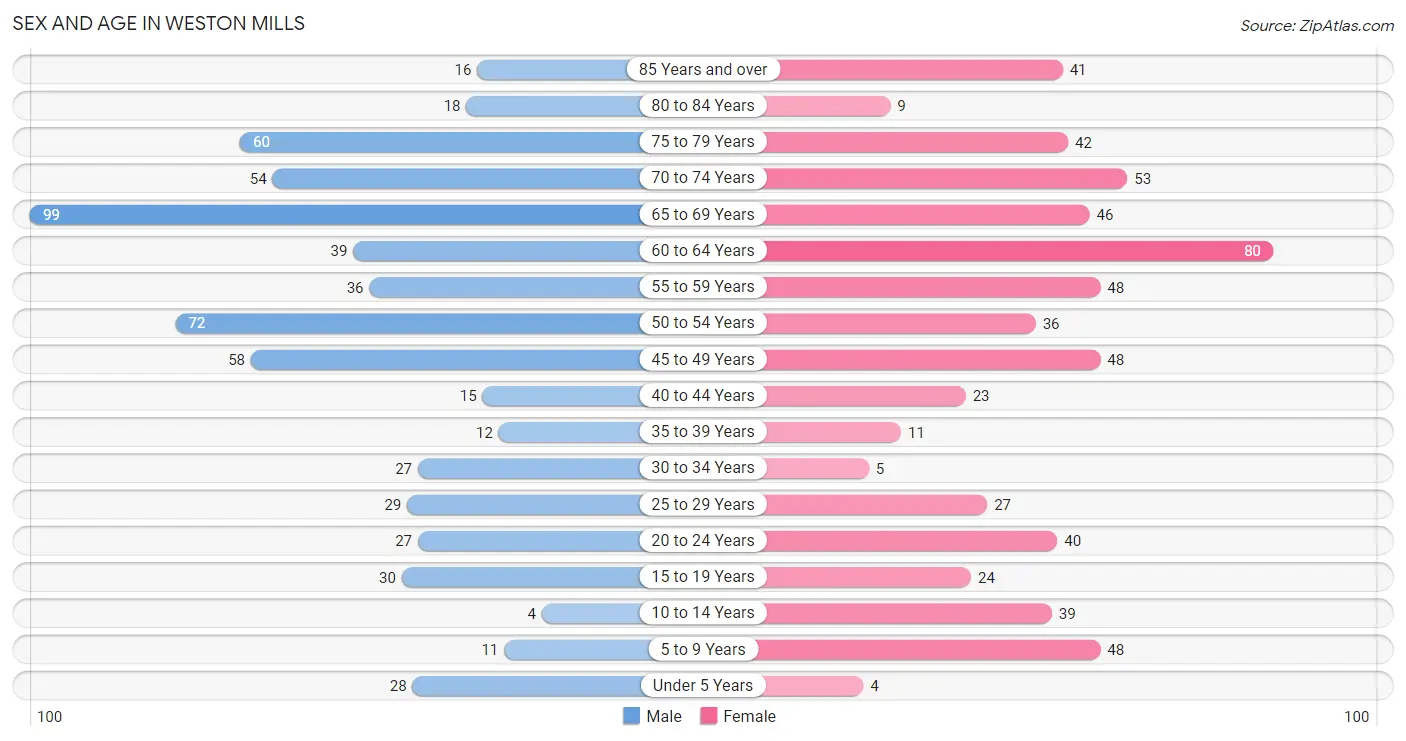
| Age Bracket | Male | Female |
| Under 5 Years | 28 (4.4%) | 4 (0.6%) |
| 5 to 9 Years | 11 (1.7%) | 48 (7.7%) |
| 10 to 14 Years | 4 (0.6%) | 39 (6.2%) |
| 15 to 19 Years | 30 (4.7%) | 24 (3.8%) |
| 20 to 24 Years | 27 (4.3%) | 40 (6.4%) |
| 25 to 29 Years | 29 (4.6%) | 27 (4.3%) |
| 30 to 34 Years | 27 (4.3%) | 5 (0.8%) |
| 35 to 39 Years | 12 (1.9%) | 11 (1.8%) |
| 40 to 44 Years | 15 (2.4%) | 23 (3.7%) |
| 45 to 49 Years | 58 (9.1%) | 48 (7.7%) |
| 50 to 54 Years | 72 (11.3%) | 36 (5.8%) |
| 55 to 59 Years | 36 (5.7%) | 48 (7.7%) |
| 60 to 64 Years | 39 (6.1%) | 80 (12.8%) |
| 65 to 69 Years | 99 (15.6%) | 46 (7.4%) |
| 70 to 74 Years | 54 (8.5%) | 53 (8.5%) |
| 75 to 79 Years | 60 (9.5%) | 42 (6.7%) |
| 80 to 84 Years | 18 (2.8%) | 9 (1.4%) |
| 85 Years and over | 16 (2.5%) | 41 (6.6%) |
| Total | 635 (100.0%) | 624 (100.0%) |
Families and Households in Weston Mills
Median Family Size in Weston Mills
The median family size in Weston Mills is 2.50 persons per family, with married-couple families (348 | 81.1%) accounting for the largest median family size of 2.53 persons per family. On the other hand, single male/father families (16 | 3.7%) represent the smallest median family size with 2.13 persons per family.
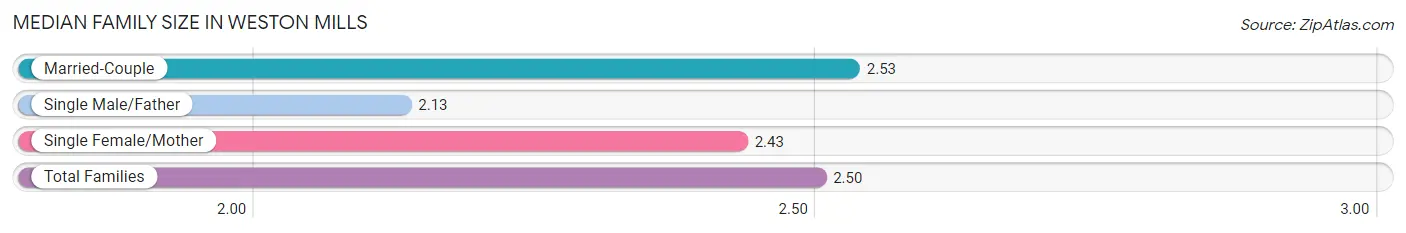
| Family Type | # Families | Family Size |
| Married-Couple | 348 (81.1%) | 2.53 |
| Single Male/Father | 16 (3.7%) | 2.13 |
| Single Female/Mother | 65 (15.1%) | 2.43 |
| Total Families | 429 (100.0%) | 2.50 |
Median Household Size in Weston Mills
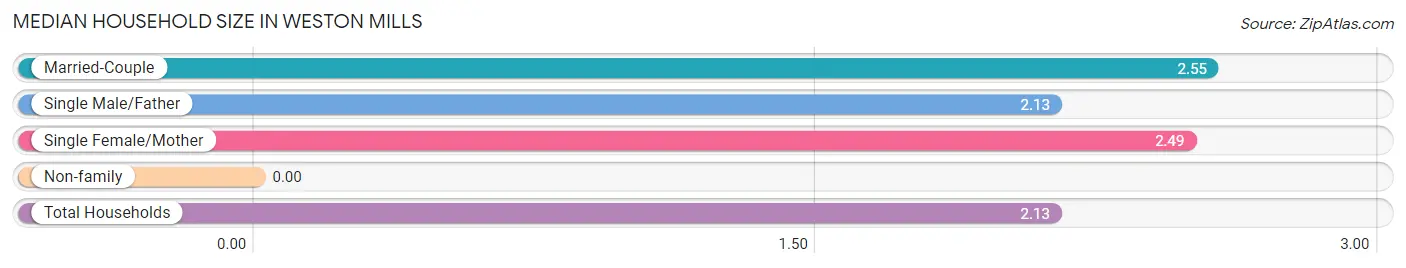
| Household Type | # Households | Household Size |
| Married-Couple | 348 (60.0%) | 2.55 |
| Single Male/Father | 16 (2.8%) | 2.13 |
| Single Female/Mother | 65 (11.2%) | 2.49 |
| Non-family | 151 (26.0%) | - |
| Total Households | 580 (100.0%) | 2.13 |
Household Size by Marriage Status in Weston Mills
Out of a total of 580 households in Weston Mills, 429 (74.0%) are family households, while 151 (26.0%) are nonfamily households. The most numerous type of family households are 2-person households, comprising 305, and the most common type of nonfamily households are 1-person households, comprising 151.
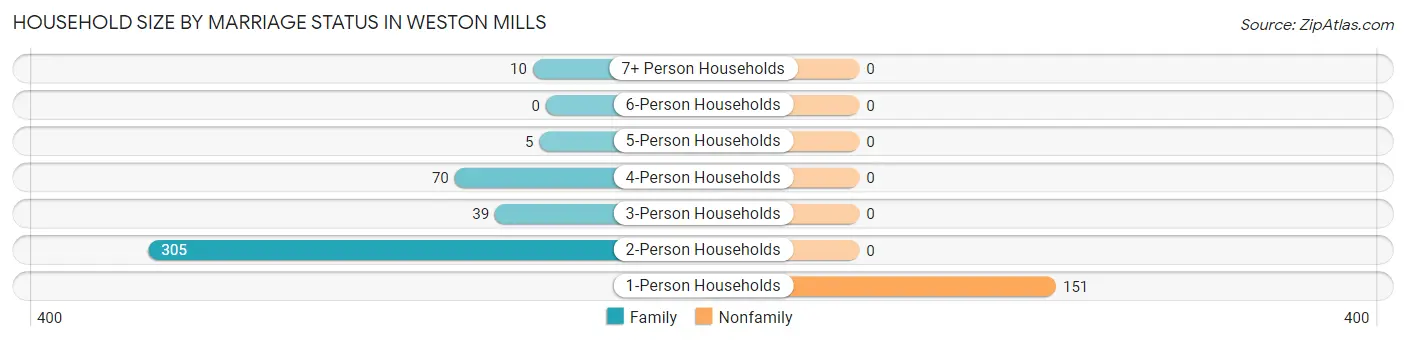
| Household Size | Family Households | Nonfamily Households |
| 1-Person Households | - | 151 (26.0%) |
| 2-Person Households | 305 (52.6%) | 0 (0.0%) |
| 3-Person Households | 39 (6.7%) | 0 (0.0%) |
| 4-Person Households | 70 (12.1%) | 0 (0.0%) |
| 5-Person Households | 5 (0.9%) | 0 (0.0%) |
| 6-Person Households | 0 (0.0%) | 0 (0.0%) |
| 7+ Person Households | 10 (1.7%) | 0 (0.0%) |
| Total | 429 (74.0%) | 151 (26.0%) |
Female Fertility in Weston Mills
Fertility by Age in Weston Mills
| Age Bracket | Women with Births | Births / 1,000 Women |
| 15 to 19 years | 0 (0.0%) | 0.0 |
| 20 to 34 years | 0 (0.0%) | 0.0 |
| 35 to 50 years | 0 (0.0%) | 0.0 |
| Total | 0 (0.0%) | 0.0 |
Fertility by Age by Marriage Status in Weston Mills
| Age Bracket | Married | Unmarried |
| 15 to 19 years | 0 (0.0%) | 0 (0.0%) |
| 20 to 34 years | 0 (0.0%) | 0 (0.0%) |
| 35 to 50 years | 0 (0.0%) | 0 (0.0%) |
| Total | 0 (0.0%) | 0 (0.0%) |
Fertility by Education in Weston Mills
| Educational Attainment | Women with Births | Births / 1,000 Women |
| Less than High School | 0 (0.0%) | 0.0 |
| High School Diploma | 0 (0.0%) | 0.0 |
| College or Associate's Degree | 0 (0.0%) | 0.0 |
| Bachelor's Degree | 0 (0.0%) | 0.0 |
| Graduate Degree | 0 (0.0%) | 0.0 |
| Total | 0 (0.0%) | 0.0 |
Fertility by Education by Marriage Status in Weston Mills
| Educational Attainment | Married | Unmarried |
| Less than High School | 0 (0.0%) | 0 (0.0%) |
| High School Diploma | 0 (0.0%) | 0 (0.0%) |
| College or Associate's Degree | 0 (0.0%) | 0 (0.0%) |
| Bachelor's Degree | 0 (0.0%) | 0 (0.0%) |
| Graduate Degree | 0 (0.0%) | 0 (0.0%) |
| Total | 0 (0.0%) | 0 (0.0%) |
Employment Characteristics in Weston Mills
Employment by Class of Employer in Weston Mills
Among the 539 employed individuals in Weston Mills, private company employees (360 | 66.8%), local government employees (82 | 15.2%), and federal government employees (30 | 5.6%) make up the most common classes of employment.
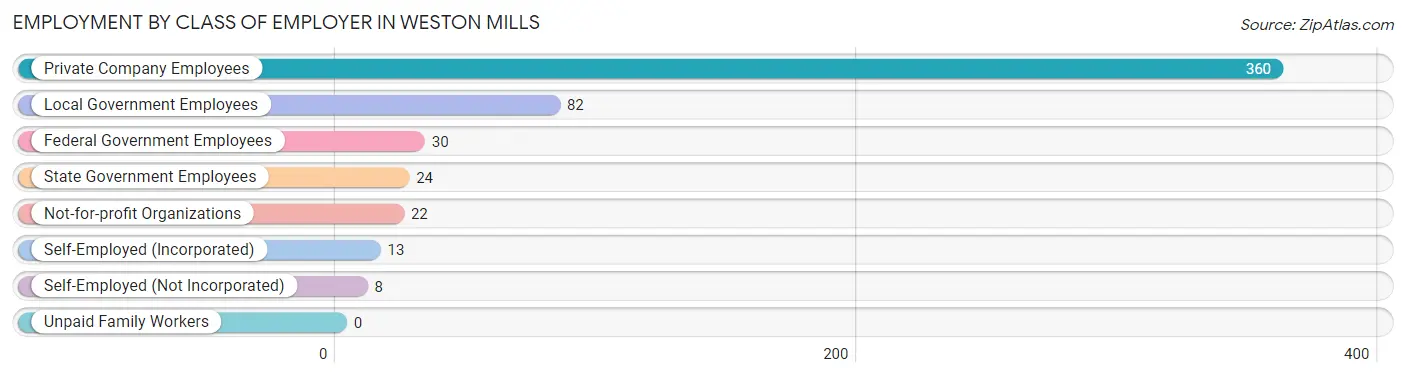
| Employer Class | # Employees | % Employees |
| Private Company Employees | 360 | 66.8% |
| Self-Employed (Incorporated) | 13 | 2.4% |
| Self-Employed (Not Incorporated) | 8 | 1.5% |
| Not-for-profit Organizations | 22 | 4.1% |
| Local Government Employees | 82 | 15.2% |
| State Government Employees | 24 | 4.4% |
| Federal Government Employees | 30 | 5.6% |
| Unpaid Family Workers | 0 | 0.0% |
| Total | 539 | 100.0% |
Employment Status by Age in Weston Mills
According to the labor force statistics for Weston Mills, out of the total population over 16 years of age (1,118), 54.3% or 607 individuals are in the labor force, with 11.6% or 70 of them unemployed. The age group with the highest labor force participation rate is 45 to 54 years, with 98.1% or 210 individuals in the labor force. Within the labor force, the 60 to 64 years age range has the highest percentage of unemployed individuals, with 40.0% or 18 of them being unemployed.
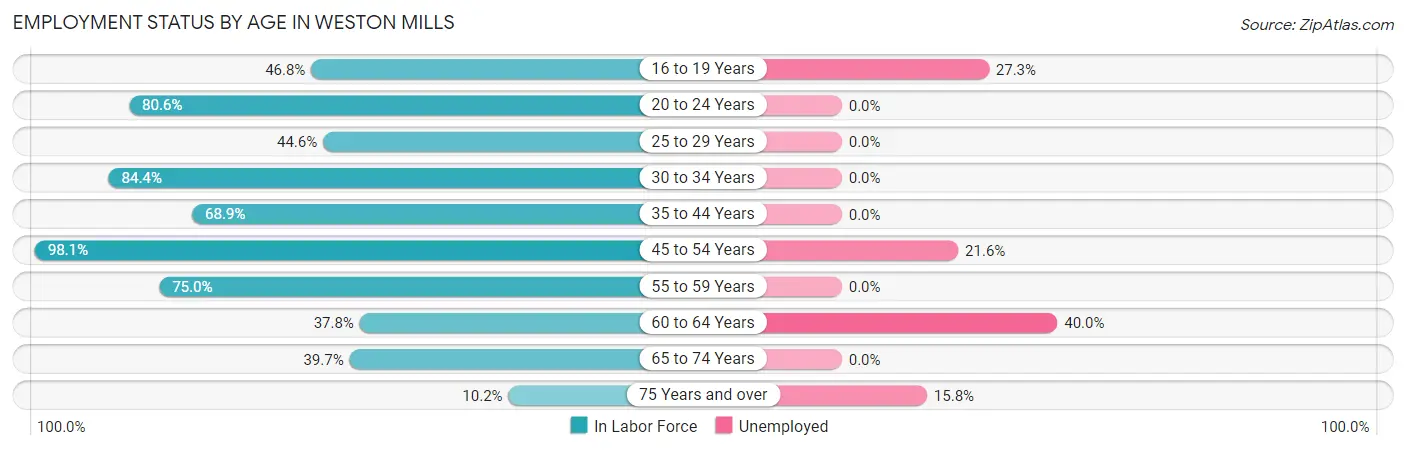
| Age Bracket | In Labor Force | Unemployed |
| 16 to 19 Years | 22 (46.8%) | 6 (27.3%) |
| 20 to 24 Years | 54 (80.6%) | 0 (0.0%) |
| 25 to 29 Years | 25 (44.6%) | 0 (0.0%) |
| 30 to 34 Years | 27 (84.4%) | 0 (0.0%) |
| 35 to 44 Years | 42 (68.9%) | 0 (0.0%) |
| 45 to 54 Years | 210 (98.1%) | 45 (21.6%) |
| 55 to 59 Years | 63 (75.0%) | 0 (0.0%) |
| 60 to 64 Years | 45 (37.8%) | 18 (40.0%) |
| 65 to 74 Years | 100 (39.7%) | 0 (0.0%) |
| 75 Years and over | 19 (10.2%) | 3 (15.8%) |
| Total | 607 (54.3%) | 70 (11.6%) |
Employment Status by Educational Attainment in Weston Mills
According to labor force statistics for Weston Mills, 72.8% of individuals (412) out of the total population between 25 and 64 years of age (566) are in the labor force, with 15.1% or 62 of them being unemployed. The group with the highest labor force participation rate are those with the educational attainment of bachelor's degree or higher, with 80.0% or 136 individuals in the labor force. Within the labor force, individuals with college / associate degree education have the highest percentage of unemployment, with 24.0% or 41 of them being unemployed.
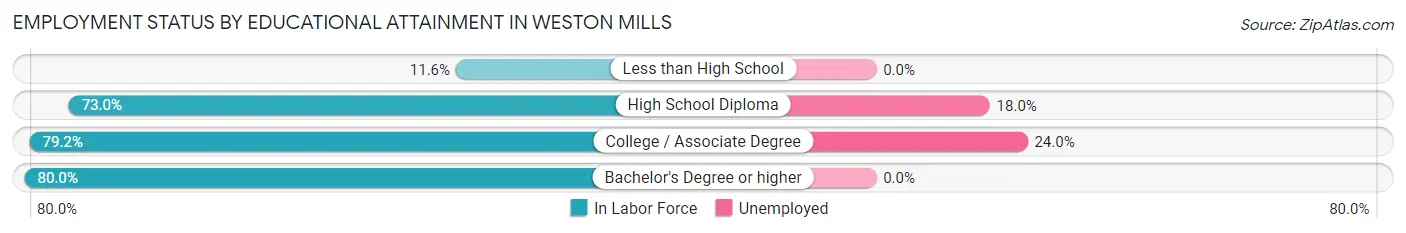
| Educational Attainment | In Labor Force | Unemployed |
| Less than High School | 5 (11.6%) | 0 (0.0%) |
| High School Diploma | 100 (73.0%) | 25 (18.0%) |
| College / Associate Degree | 171 (79.2%) | 52 (24.0%) |
| Bachelor's Degree or higher | 136 (80.0%) | 0 (0.0%) |
| Total | 412 (72.8%) | 85 (15.1%) |
Employment Occupations by Sex in Weston Mills
Management, Business, Science and Arts Occupations
The most common Management, Business, Science and Arts occupations in Weston Mills are Health Diagnosing & Treating (43 | 8.3%), Community & Social Service (35 | 6.7%), Education Instruction & Library (35 | 6.7%), Management (32 | 6.2%), and Business & Financial (27 | 5.2%).
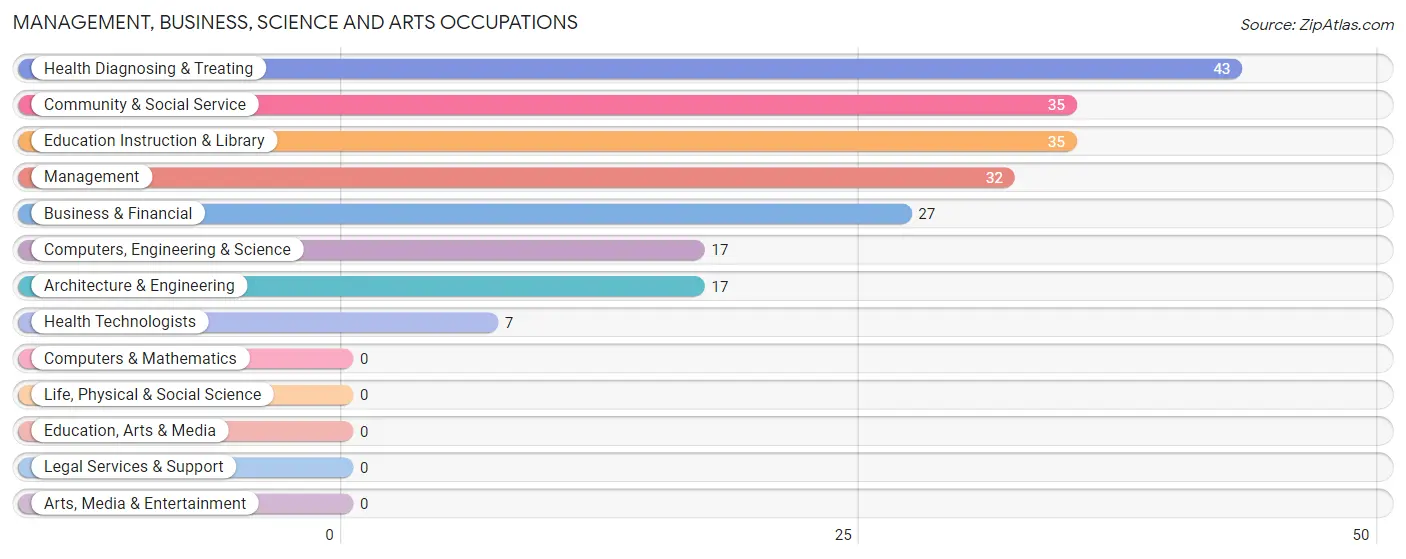
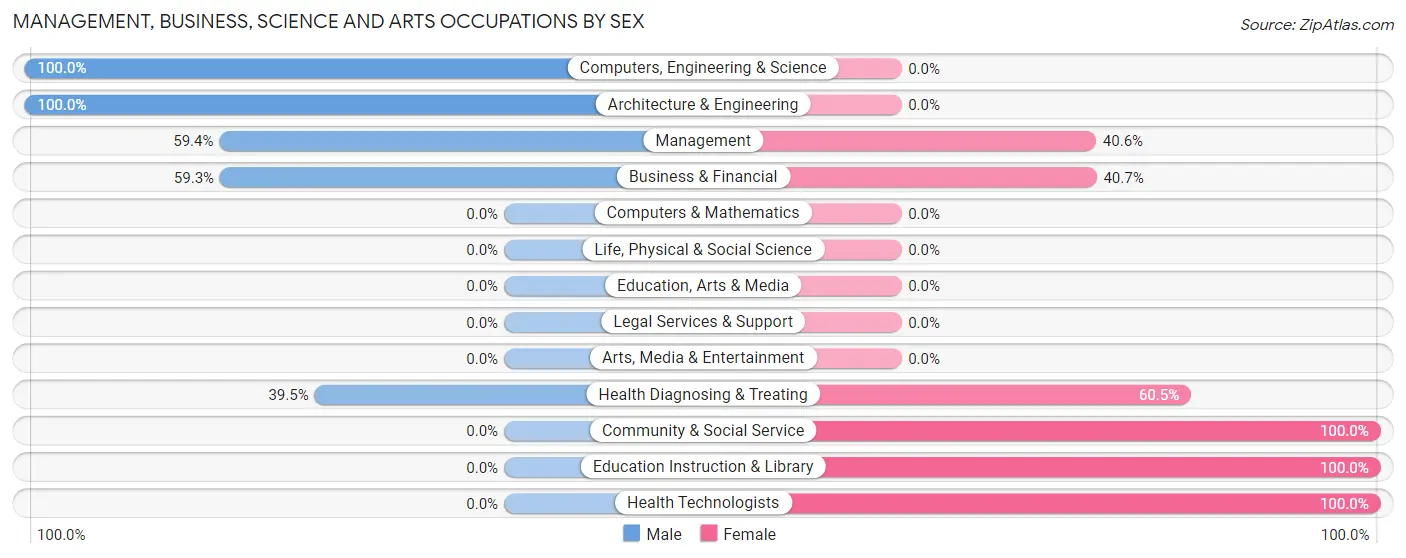
Management, Business, Science and Arts Occupations by Sex
Within the Management, Business, Science and Arts occupations in Weston Mills, the most male-oriented occupations are Computers, Engineering & Science (100.0%), Architecture & Engineering (100.0%), and Management (59.4%), while the most female-oriented occupations are Community & Social Service (100.0%), Education Instruction & Library (100.0%), and Health Technologists (100.0%).
| Occupation | Male | Female |
| Management | 19 (59.4%) | 13 (40.6%) |
| Business & Financial | 16 (59.3%) | 11 (40.7%) |
| Computers, Engineering & Science | 17 (100.0%) | 0 (0.0%) |
| Computers & Mathematics | 0 (0.0%) | 0 (0.0%) |
| Architecture & Engineering | 17 (100.0%) | 0 (0.0%) |
| Life, Physical & Social Science | 0 (0.0%) | 0 (0.0%) |
| Community & Social Service | 0 (0.0%) | 35 (100.0%) |
| Education, Arts & Media | 0 (0.0%) | 0 (0.0%) |
| Legal Services & Support | 0 (0.0%) | 0 (0.0%) |
| Education Instruction & Library | 0 (0.0%) | 35 (100.0%) |
| Arts, Media & Entertainment | 0 (0.0%) | 0 (0.0%) |
| Health Diagnosing & Treating | 17 (39.5%) | 26 (60.5%) |
| Health Technologists | 0 (0.0%) | 7 (100.0%) |
| Total (Category) | 69 (44.8%) | 85 (55.2%) |
| Total (Overall) | 283 (54.5%) | 236 (45.5%) |
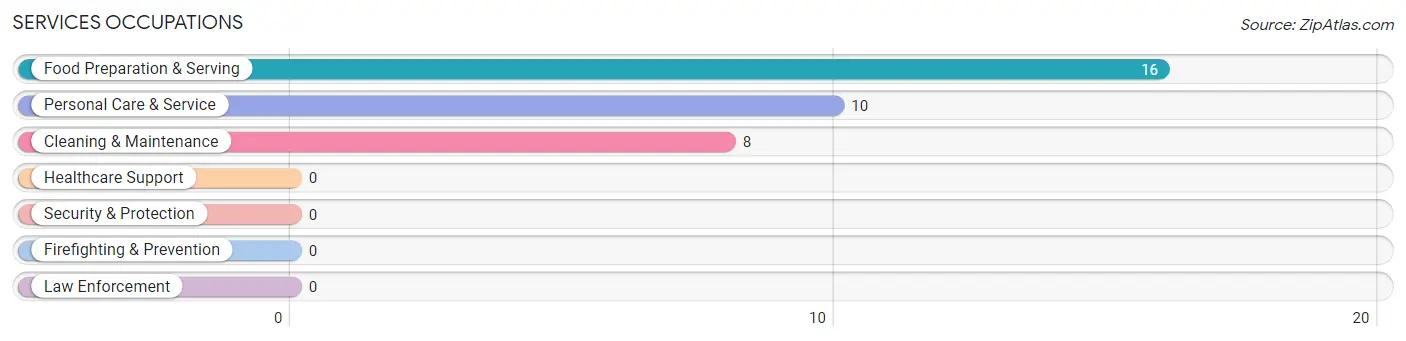
Services Occupations
The most common Services occupations in Weston Mills are Food Preparation & Serving (16 | 3.1%), Personal Care & Service (10 | 1.9%), and Cleaning & Maintenance (8 | 1.5%).
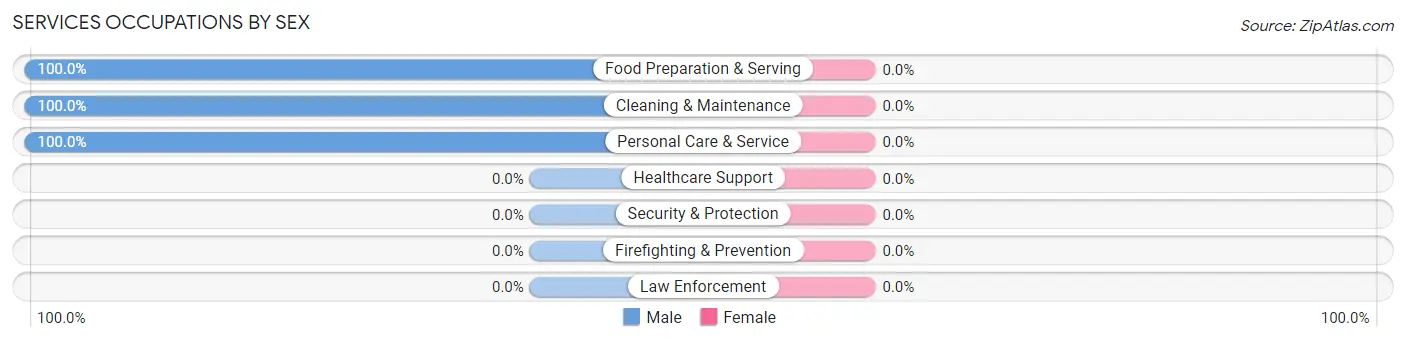
Services Occupations by Sex
| Occupation | Male | Female |
| Healthcare Support | 0 (0.0%) | 0 (0.0%) |
| Security & Protection | 0 (0.0%) | 0 (0.0%) |
| Firefighting & Prevention | 0 (0.0%) | 0 (0.0%) |
| Law Enforcement | 0 (0.0%) | 0 (0.0%) |
| Food Preparation & Serving | 16 (100.0%) | 0 (0.0%) |
| Cleaning & Maintenance | 8 (100.0%) | 0 (0.0%) |
| Personal Care & Service | 10 (100.0%) | 0 (0.0%) |
| Total (Category) | 34 (100.0%) | 0 (0.0%) |
| Total (Overall) | 283 (54.5%) | 236 (45.5%) |
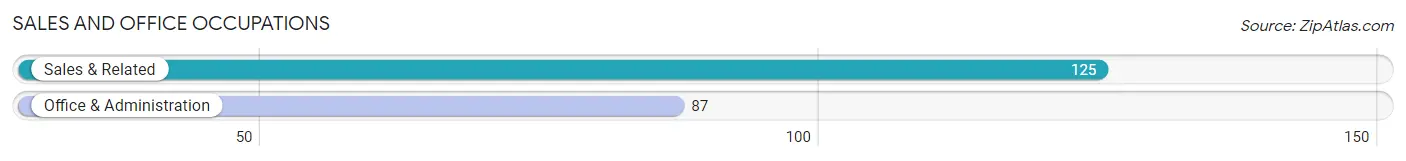
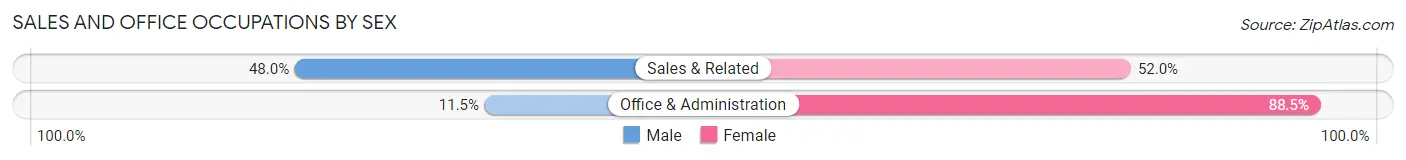
Sales and Office Occupations
The most common Sales and Office occupations in Weston Mills are Sales & Related (125 | 24.1%), and Office & Administration (87 | 16.8%).
Sales and Office Occupations by Sex
| Occupation | Male | Female |
| Sales & Related | 60 (48.0%) | 65 (52.0%) |
| Office & Administration | 10 (11.5%) | 77 (88.5%) |
| Total (Category) | 70 (33.0%) | 142 (67.0%) |
| Total (Overall) | 283 (54.5%) | 236 (45.5%) |
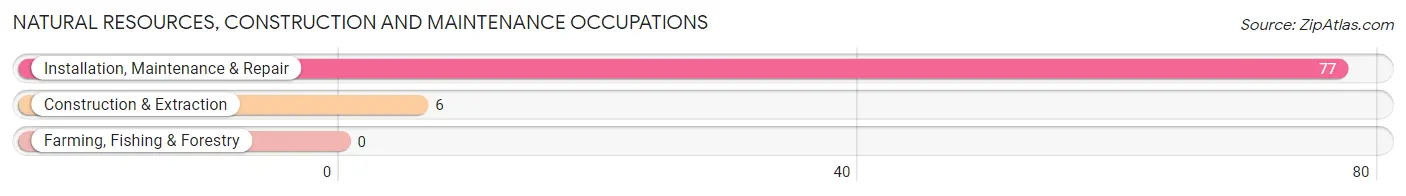
Natural Resources, Construction and Maintenance Occupations
The most common Natural Resources, Construction and Maintenance occupations in Weston Mills are Installation, Maintenance & Repair (77 | 14.8%), and Construction & Extraction (6 | 1.2%).
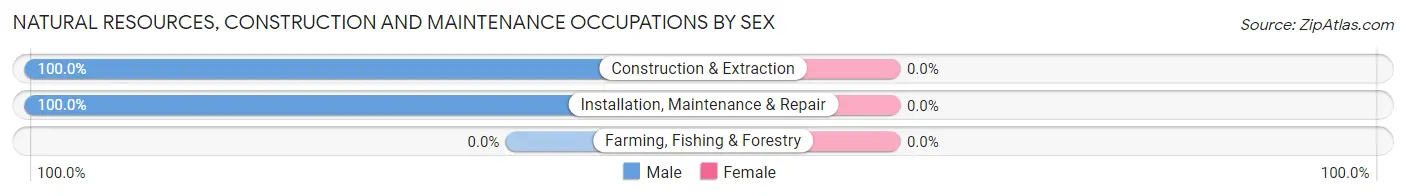
Natural Resources, Construction and Maintenance Occupations by Sex
| Occupation | Male | Female |
| Farming, Fishing & Forestry | 0 (0.0%) | 0 (0.0%) |
| Construction & Extraction | 6 (100.0%) | 0 (0.0%) |
| Installation, Maintenance & Repair | 77 (100.0%) | 0 (0.0%) |
| Total (Category) | 83 (100.0%) | 0 (0.0%) |
| Total (Overall) | 283 (54.5%) | 236 (45.5%) |
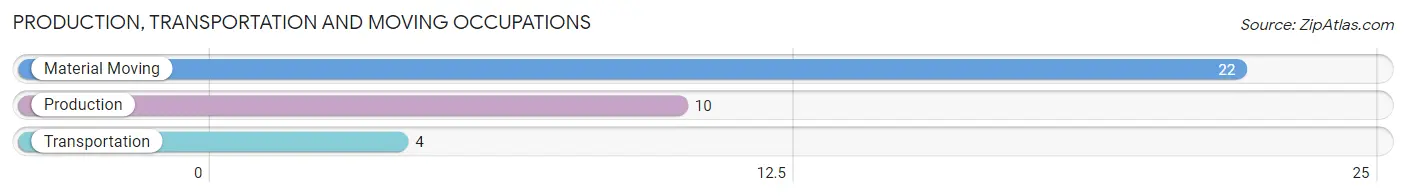
Production, Transportation and Moving Occupations
The most common Production, Transportation and Moving occupations in Weston Mills are Material Moving (22 | 4.2%), Production (10 | 1.9%), and Transportation (4 | 0.8%).
Production, Transportation and Moving Occupations by Sex
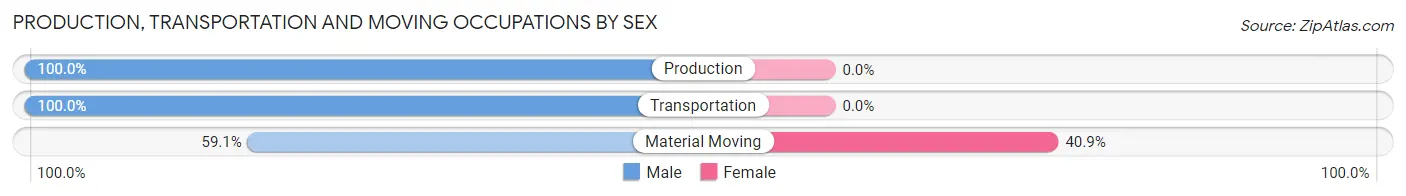
| Occupation | Male | Female |
| Production | 10 (100.0%) | 0 (0.0%) |
| Transportation | 4 (100.0%) | 0 (0.0%) |
| Material Moving | 13 (59.1%) | 9 (40.9%) |
| Total (Category) | 27 (75.0%) | 9 (25.0%) |
| Total (Overall) | 283 (54.5%) | 236 (45.5%) |
Employment Industries by Sex in Weston Mills
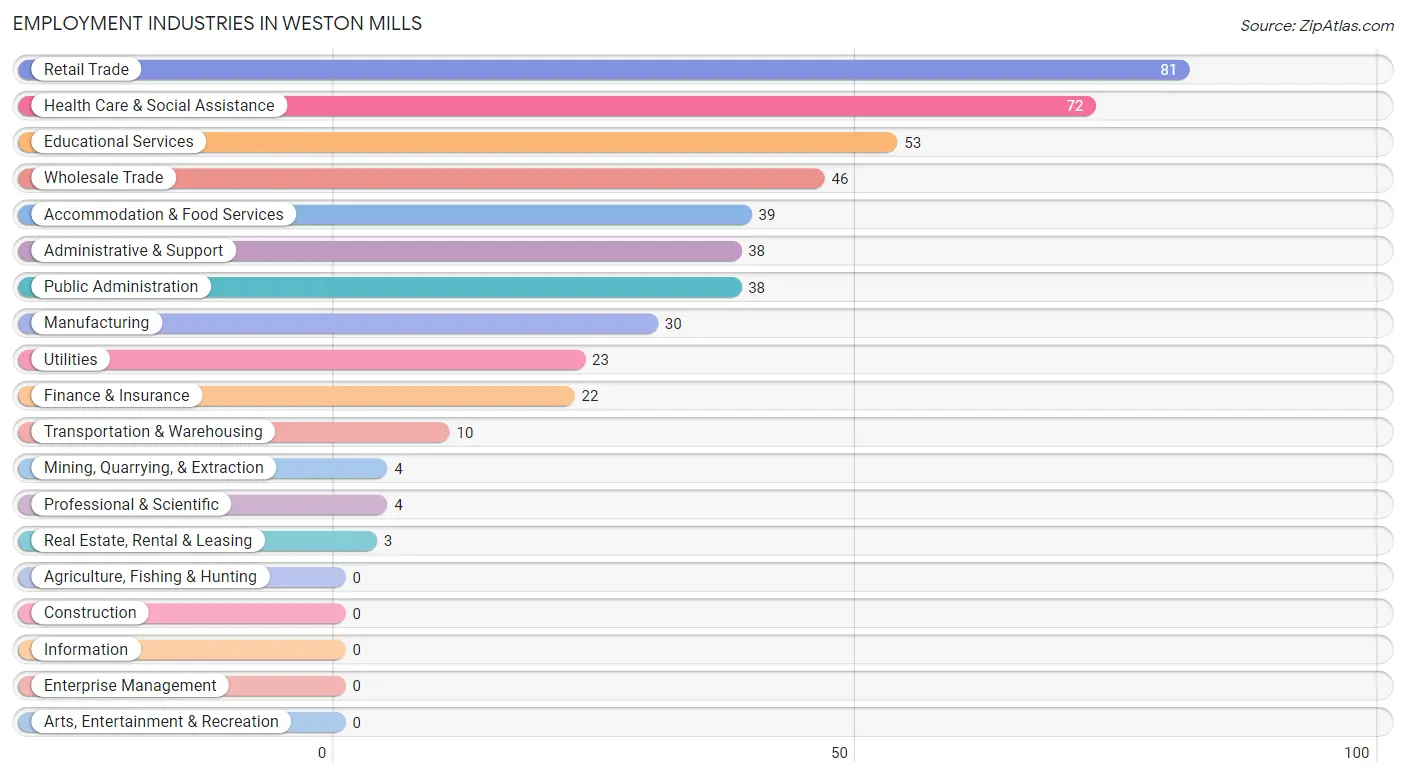
Employment Industries in Weston Mills
The major employment industries in Weston Mills include Retail Trade (81 | 15.6%), Health Care & Social Assistance (72 | 13.9%), Educational Services (53 | 10.2%), Wholesale Trade (46 | 8.9%), and Accommodation & Food Services (39 | 7.5%).
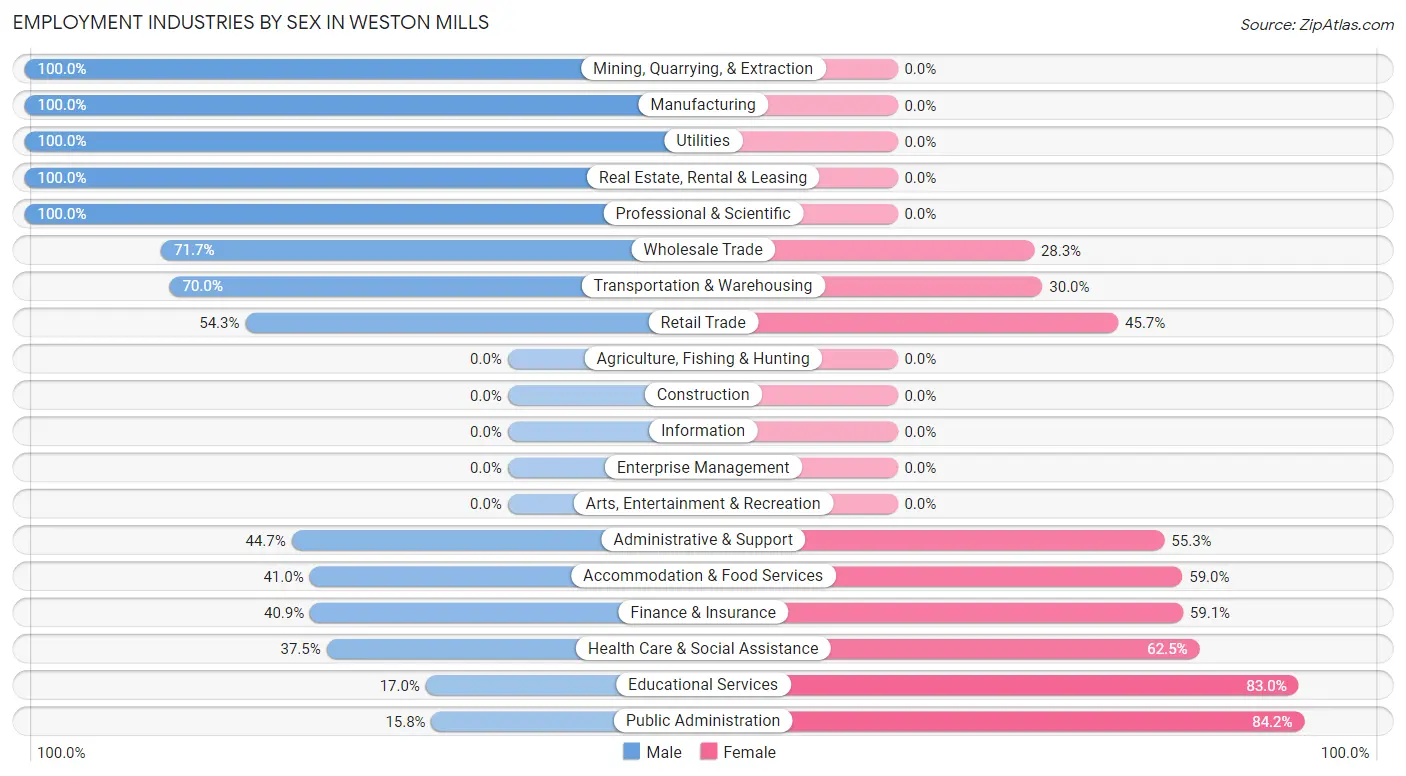
Employment Industries by Sex in Weston Mills
The Weston Mills industries that see more men than women are Mining, Quarrying, & Extraction (100.0%), Manufacturing (100.0%), and Utilities (100.0%), whereas the industries that tend to have a higher number of women are Public Administration (84.2%), Educational Services (83.0%), and Health Care & Social Assistance (62.5%).
| Industry | Male | Female |
| Agriculture, Fishing & Hunting | 0 (0.0%) | 0 (0.0%) |
| Mining, Quarrying, & Extraction | 4 (100.0%) | 0 (0.0%) |
| Construction | 0 (0.0%) | 0 (0.0%) |
| Manufacturing | 30 (100.0%) | 0 (0.0%) |
| Wholesale Trade | 33 (71.7%) | 13 (28.3%) |
| Retail Trade | 44 (54.3%) | 37 (45.7%) |
| Transportation & Warehousing | 7 (70.0%) | 3 (30.0%) |
| Utilities | 23 (100.0%) | 0 (0.0%) |
| Information | 0 (0.0%) | 0 (0.0%) |
| Finance & Insurance | 9 (40.9%) | 13 (59.1%) |
| Real Estate, Rental & Leasing | 3 (100.0%) | 0 (0.0%) |
| Professional & Scientific | 4 (100.0%) | 0 (0.0%) |
| Enterprise Management | 0 (0.0%) | 0 (0.0%) |
| Administrative & Support | 17 (44.7%) | 21 (55.3%) |
| Educational Services | 9 (17.0%) | 44 (83.0%) |
| Health Care & Social Assistance | 27 (37.5%) | 45 (62.5%) |
| Arts, Entertainment & Recreation | 0 (0.0%) | 0 (0.0%) |
| Accommodation & Food Services | 16 (41.0%) | 23 (59.0%) |
| Public Administration | 6 (15.8%) | 32 (84.2%) |
| Total | 283 (54.5%) | 236 (45.5%) |
Education in Weston Mills
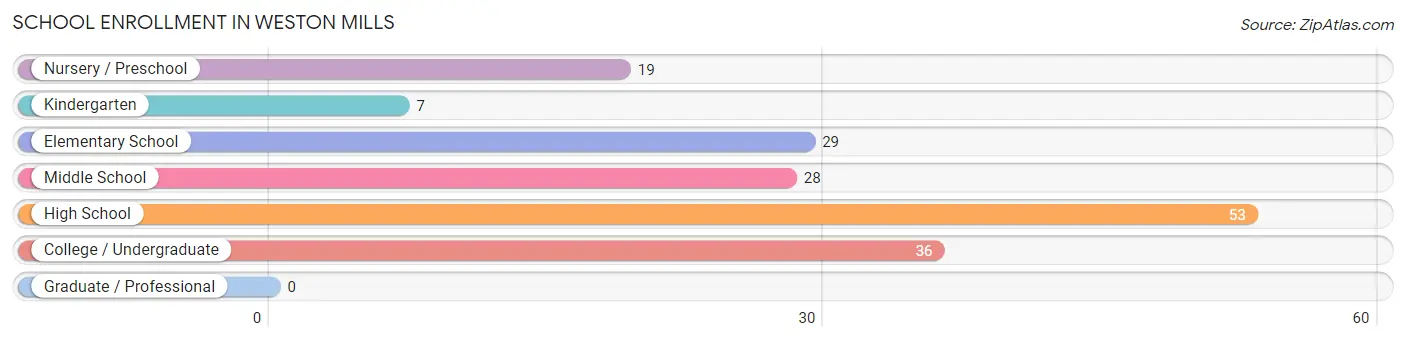
School Enrollment in Weston Mills
The most common levels of schooling among the 172 students in Weston Mills are high school (53 | 30.8%), college / undergraduate (36 | 20.9%), and elementary school (29 | 16.9%).
| School Level | # Students | % Students |
| Nursery / Preschool | 19 | 11.1% |
| Kindergarten | 7 | 4.1% |
| Elementary School | 29 | 16.9% |
| Middle School | 28 | 16.3% |
| High School | 53 | 30.8% |
| College / Undergraduate | 36 | 20.9% |
| Graduate / Professional | 0 | 0.0% |
| Total | 172 | 100.0% |
School Enrollment by Age by Funding Source in Weston Mills
Out of a total of 172 students who are enrolled in schools in Weston Mills, 1 (0.6%) attend a private institution, while the remaining 171 (99.4%) are enrolled in public schools. The age group of 10 to 14 year olds has the highest likelihood of being enrolled in private schools, with 1 (2.6% in the age bracket) enrolled. Conversely, the age group of 5 to 9 year old has the lowest likelihood of being enrolled in a private school, with 55 (100.0% in the age bracket) attending a public institution.
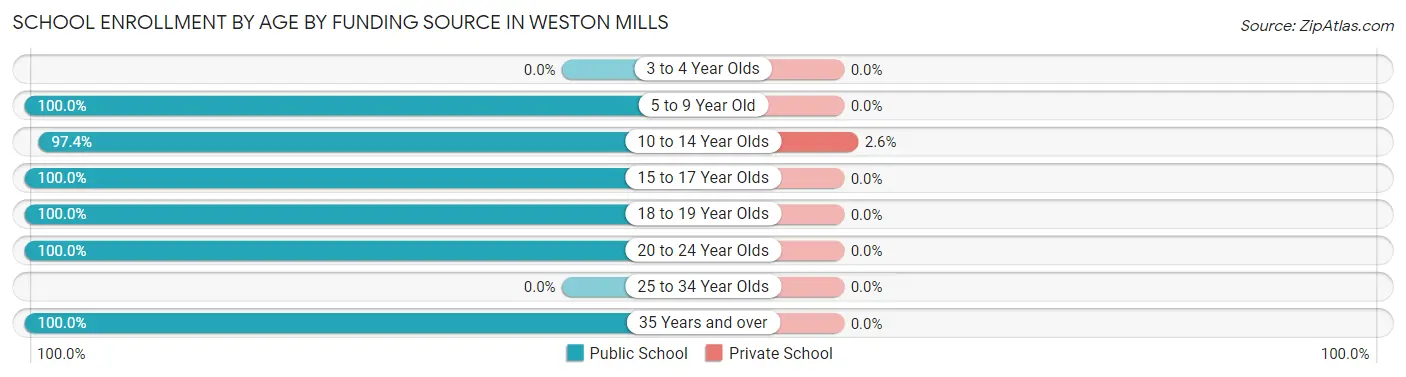
| Age Bracket | Public School | Private School |
| 3 to 4 Year Olds | 0 (0.0%) | 0 (0.0%) |
| 5 to 9 Year Old | 55 (100.0%) | 0 (0.0%) |
| 10 to 14 Year Olds | 37 (97.4%) | 1 (2.6%) |
| 15 to 17 Year Olds | 43 (100.0%) | 0 (0.0%) |
| 18 to 19 Year Olds | 6 (100.0%) | 0 (0.0%) |
| 20 to 24 Year Olds | 22 (100.0%) | 0 (0.0%) |
| 25 to 34 Year Olds | 0 (0.0%) | 0 (0.0%) |
| 35 Years and over | 8 (100.0%) | 0 (0.0%) |
| Total | 171 (99.4%) | 1 (0.6%) |
Educational Attainment by Field of Study in Weston Mills
Business (51 | 22.3%), education (44 | 19.2%), arts & humanities (32 | 14.0%), liberal arts & history (24 | 10.5%), and science & technology (20 | 8.7%) are the most common fields of study among 229 individuals in Weston Mills who have obtained a bachelor's degree or higher.
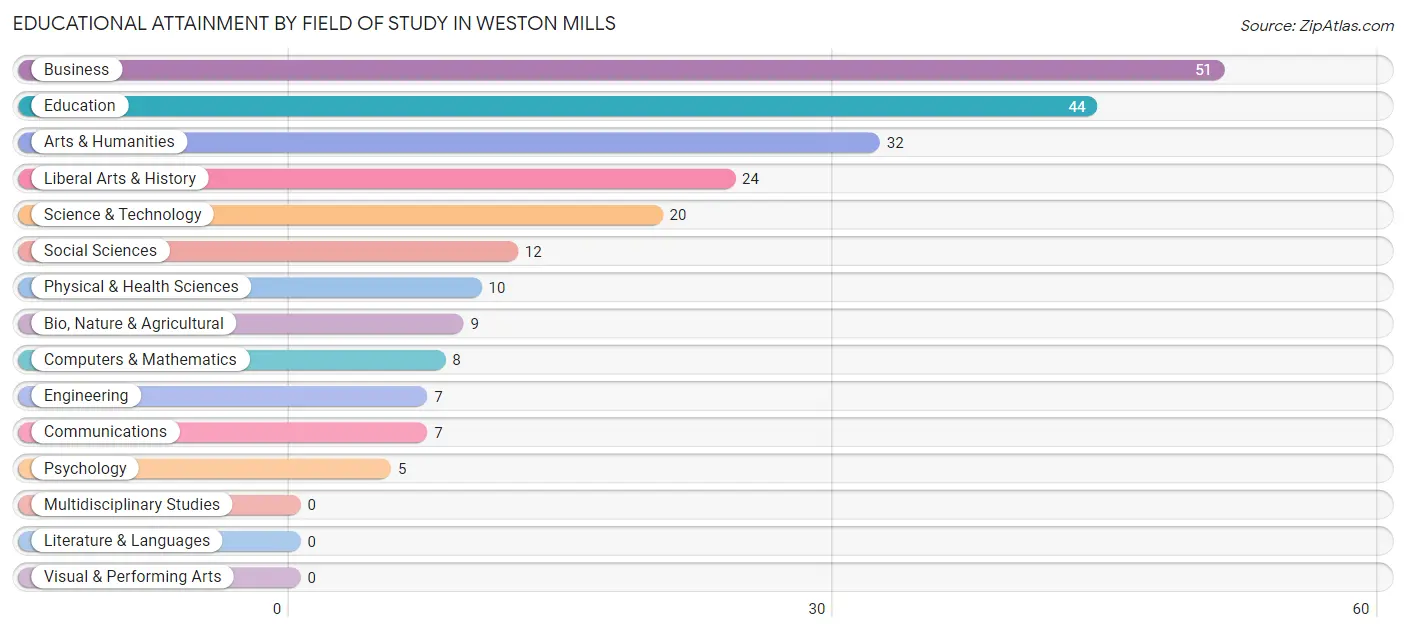
| Field of Study | # Graduates | % Graduates |
| Computers & Mathematics | 8 | 3.5% |
| Bio, Nature & Agricultural | 9 | 3.9% |
| Physical & Health Sciences | 10 | 4.4% |
| Psychology | 5 | 2.2% |
| Social Sciences | 12 | 5.2% |
| Engineering | 7 | 3.1% |
| Multidisciplinary Studies | 0 | 0.0% |
| Science & Technology | 20 | 8.7% |
| Business | 51 | 22.3% |
| Education | 44 | 19.2% |
| Literature & Languages | 0 | 0.0% |
| Liberal Arts & History | 24 | 10.5% |
| Visual & Performing Arts | 0 | 0.0% |
| Communications | 7 | 3.1% |
| Arts & Humanities | 32 | 14.0% |
| Total | 229 | 100.0% |
Transportation & Commute in Weston Mills
Vehicle Availability by Sex in Weston Mills
The most prevalent vehicle ownership categories in Weston Mills are males with 3 vehicles (131, accounting for 43.2%) and females with 3 vehicles (50, making up 55.5%).
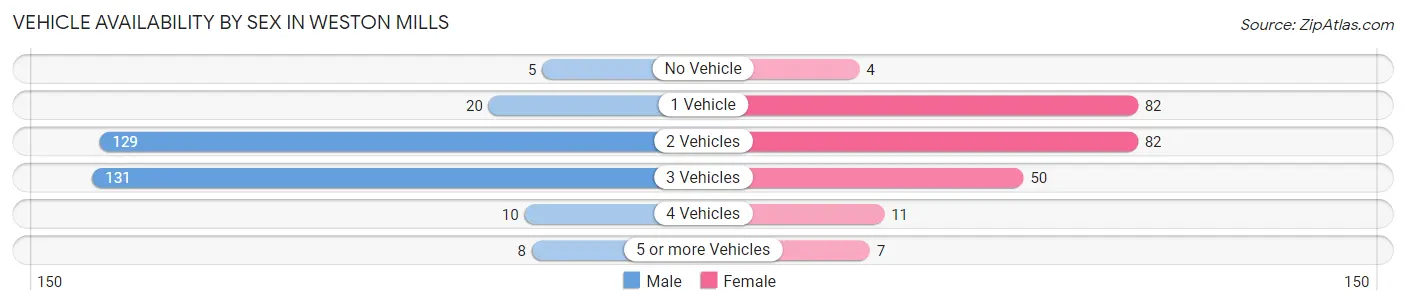
| Vehicles Available | Male | Female |
| No Vehicle | 5 (1.7%) | 4 (1.7%) |
| 1 Vehicle | 20 (6.6%) | 82 (34.7%) |
| 2 Vehicles | 129 (42.6%) | 82 (34.7%) |
| 3 Vehicles | 131 (43.2%) | 50 (21.2%) |
| 4 Vehicles | 10 (3.3%) | 11 (4.7%) |
| 5 or more Vehicles | 8 (2.6%) | 7 (3.0%) |
| Total | 303 (100.0%) | 236 (100.0%) |
Commute Time in Weston Mills
The most frequently occuring commute durations in Weston Mills are 15 to 19 minutes (94 commuters, 18.5%), 10 to 14 minutes (93 commuters, 18.3%), and 5 to 9 minutes (89 commuters, 17.5%).
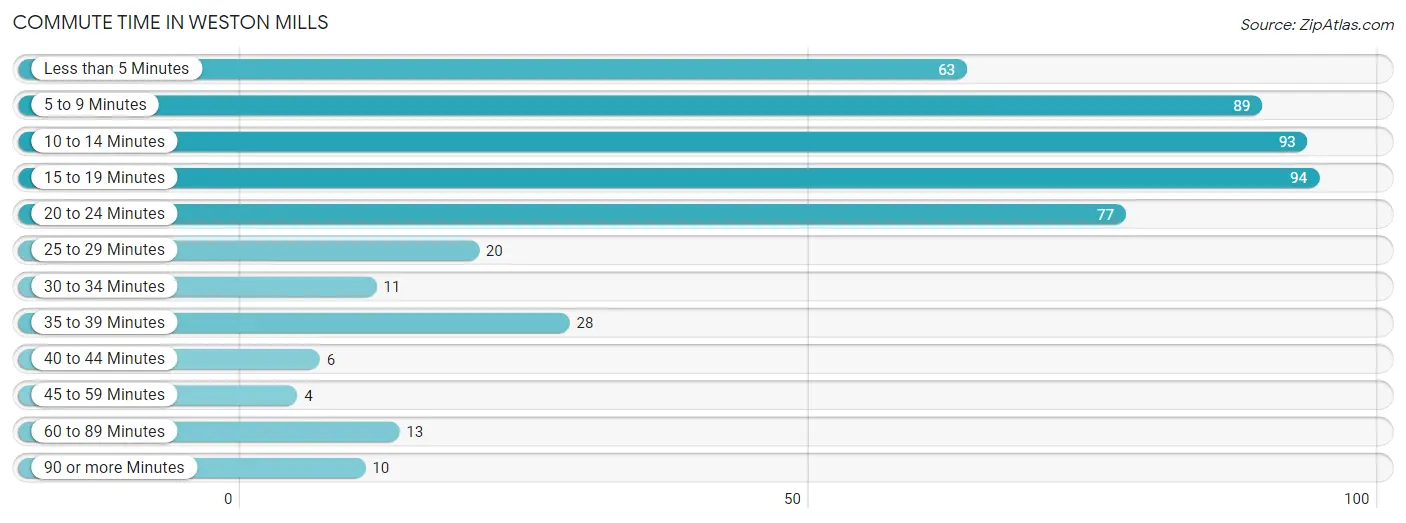
| Commute Time | # Commuters | % Commuters |
| Less than 5 Minutes | 63 | 12.4% |
| 5 to 9 Minutes | 89 | 17.5% |
| 10 to 14 Minutes | 93 | 18.3% |
| 15 to 19 Minutes | 94 | 18.5% |
| 20 to 24 Minutes | 77 | 15.2% |
| 25 to 29 Minutes | 20 | 3.9% |
| 30 to 34 Minutes | 11 | 2.2% |
| 35 to 39 Minutes | 28 | 5.5% |
| 40 to 44 Minutes | 6 | 1.2% |
| 45 to 59 Minutes | 4 | 0.8% |
| 60 to 89 Minutes | 13 | 2.6% |
| 90 or more Minutes | 10 | 2.0% |
Commute Time by Sex in Weston Mills
The most common commute times in Weston Mills are 10 to 14 minutes (69 commuters, 24.0%) for males and 15 to 19 minutes (62 commuters, 28.2%) for females.
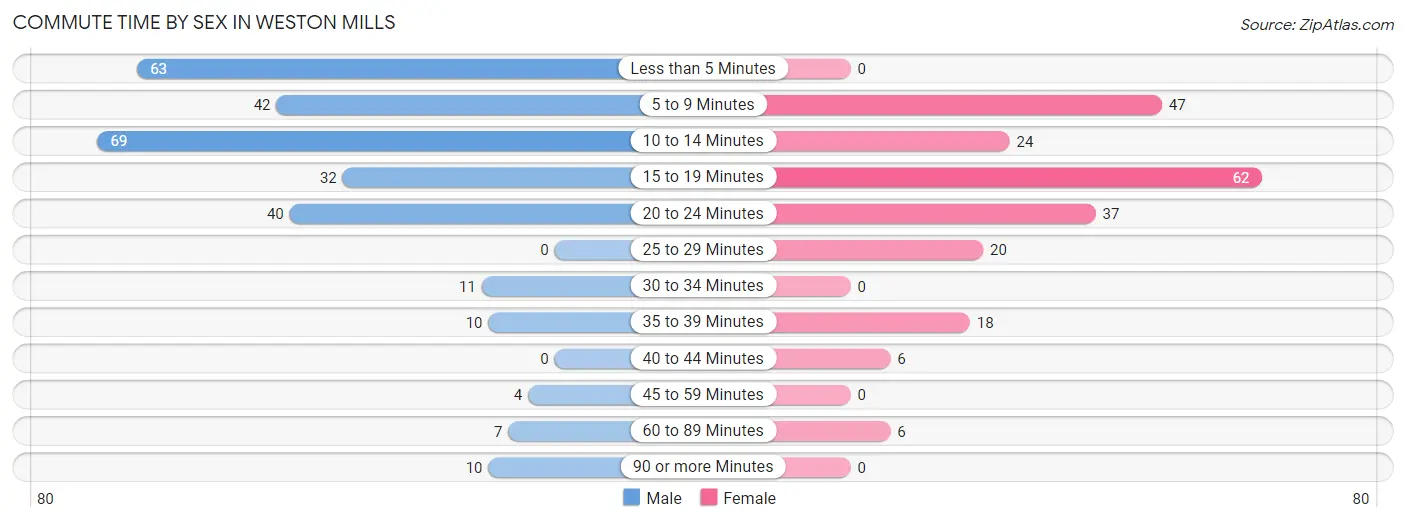
| Commute Time | Male | Female |
| Less than 5 Minutes | 63 (21.9%) | 0 (0.0%) |
| 5 to 9 Minutes | 42 (14.6%) | 47 (21.4%) |
| 10 to 14 Minutes | 69 (24.0%) | 24 (10.9%) |
| 15 to 19 Minutes | 32 (11.1%) | 62 (28.2%) |
| 20 to 24 Minutes | 40 (13.9%) | 37 (16.8%) |
| 25 to 29 Minutes | 0 (0.0%) | 20 (9.1%) |
| 30 to 34 Minutes | 11 (3.8%) | 0 (0.0%) |
| 35 to 39 Minutes | 10 (3.5%) | 18 (8.2%) |
| 40 to 44 Minutes | 0 (0.0%) | 6 (2.7%) |
| 45 to 59 Minutes | 4 (1.4%) | 0 (0.0%) |
| 60 to 89 Minutes | 7 (2.4%) | 6 (2.7%) |
| 90 or more Minutes | 10 (3.5%) | 0 (0.0%) |
Time of Departure to Work by Sex in Weston Mills
The most frequent times of departure to work in Weston Mills are 7:30 AM to 7:59 AM (54, 18.8%) for males and 7:00 AM to 7:29 AM (55, 25.0%) for females.
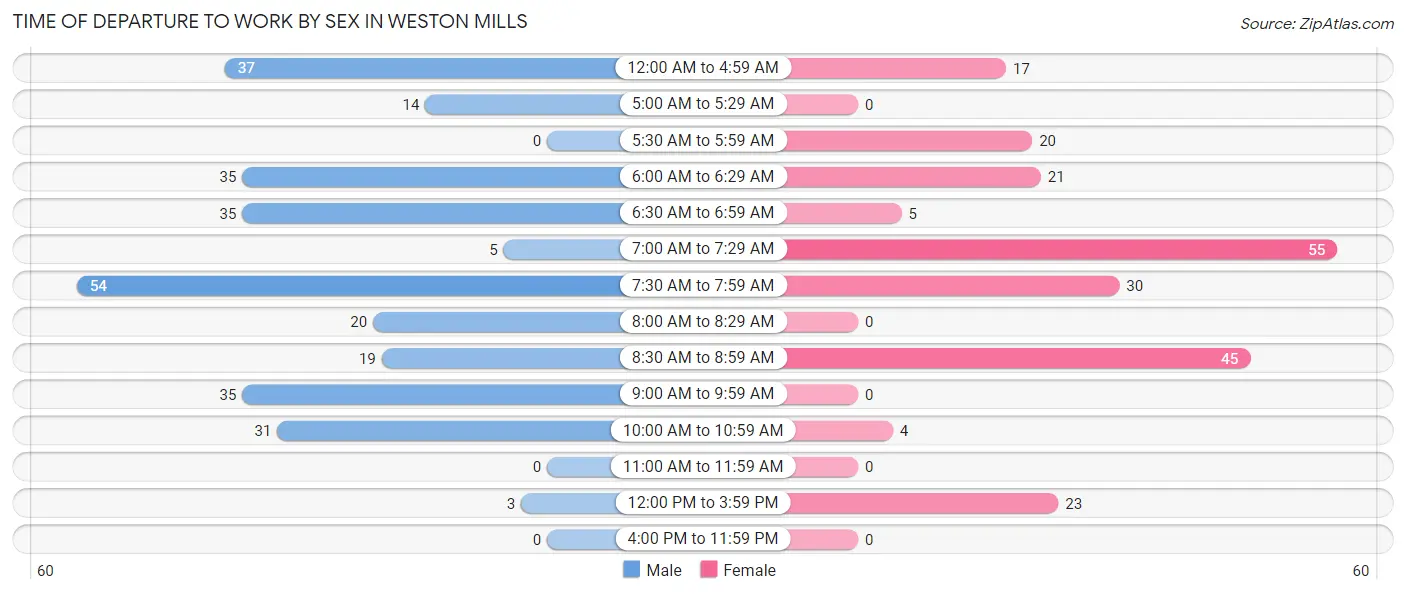
| Time of Departure | Male | Female |
| 12:00 AM to 4:59 AM | 37 (12.9%) | 17 (7.7%) |
| 5:00 AM to 5:29 AM | 14 (4.9%) | 0 (0.0%) |
| 5:30 AM to 5:59 AM | 0 (0.0%) | 20 (9.1%) |
| 6:00 AM to 6:29 AM | 35 (12.1%) | 21 (9.6%) |
| 6:30 AM to 6:59 AM | 35 (12.1%) | 5 (2.3%) |
| 7:00 AM to 7:29 AM | 5 (1.7%) | 55 (25.0%) |
| 7:30 AM to 7:59 AM | 54 (18.8%) | 30 (13.6%) |
| 8:00 AM to 8:29 AM | 20 (6.9%) | 0 (0.0%) |
| 8:30 AM to 8:59 AM | 19 (6.6%) | 45 (20.4%) |
| 9:00 AM to 9:59 AM | 35 (12.1%) | 0 (0.0%) |
| 10:00 AM to 10:59 AM | 31 (10.8%) | 4 (1.8%) |
| 11:00 AM to 11:59 AM | 0 (0.0%) | 0 (0.0%) |
| 12:00 PM to 3:59 PM | 3 (1.0%) | 23 (10.4%) |
| 4:00 PM to 11:59 PM | 0 (0.0%) | 0 (0.0%) |
| Total | 288 (100.0%) | 220 (100.0%) |
Housing Occupancy in Weston Mills
Occupancy by Ownership in Weston Mills
Of the total 580 dwellings in Weston Mills, owner-occupied units account for 453 (78.1%), while renter-occupied units make up 127 (21.9%).
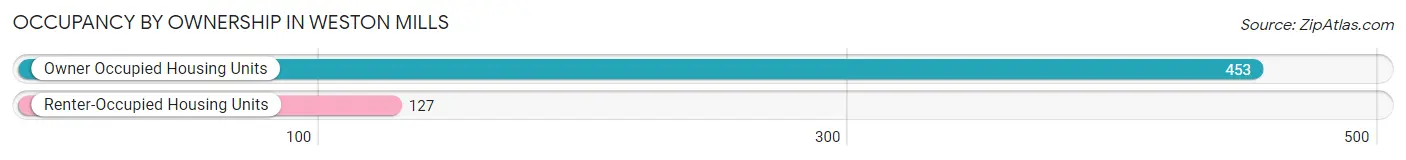
| Occupancy | # Housing Units | % Housing Units |
| Owner Occupied Housing Units | 453 | 78.1% |
| Renter-Occupied Housing Units | 127 | 21.9% |
| Total Occupied Housing Units | 580 | 100.0% |
Occupancy by Household Size in Weston Mills
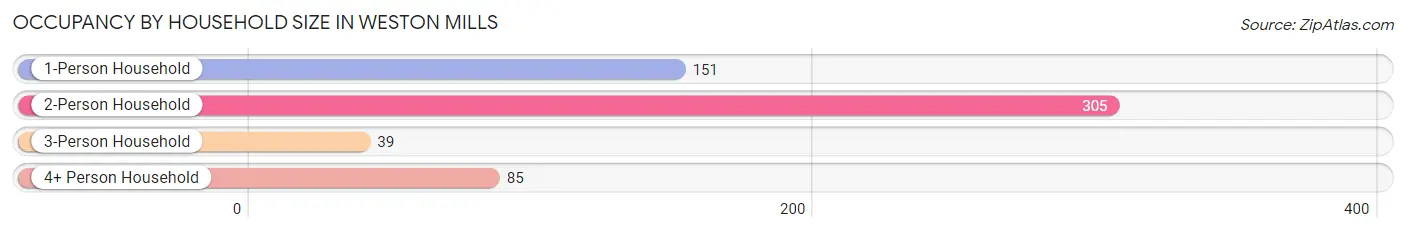
| Household Size | # Housing Units | % Housing Units |
| 1-Person Household | 151 | 26.0% |
| 2-Person Household | 305 | 52.6% |
| 3-Person Household | 39 | 6.7% |
| 4+ Person Household | 85 | 14.7% |
| Total Housing Units | 580 | 100.0% |
Occupancy by Ownership by Household Size in Weston Mills
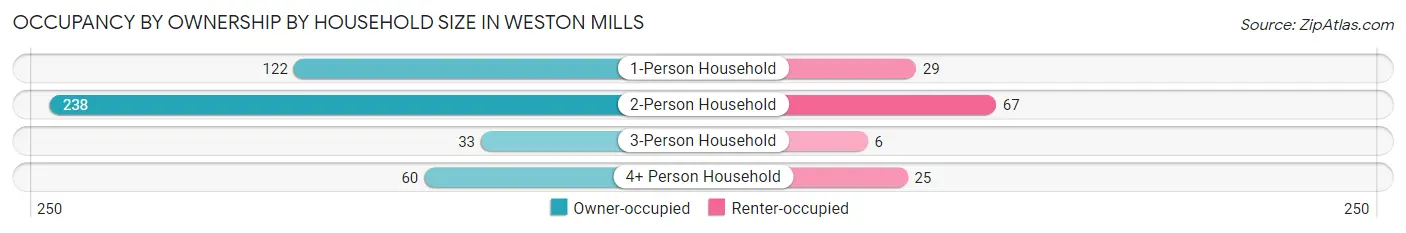
| Household Size | Owner-occupied | Renter-occupied |
| 1-Person Household | 122 (80.8%) | 29 (19.2%) |
| 2-Person Household | 238 (78.0%) | 67 (22.0%) |
| 3-Person Household | 33 (84.6%) | 6 (15.4%) |
| 4+ Person Household | 60 (70.6%) | 25 (29.4%) |
| Total Housing Units | 453 (78.1%) | 127 (21.9%) |
Occupancy by Educational Attainment in Weston Mills
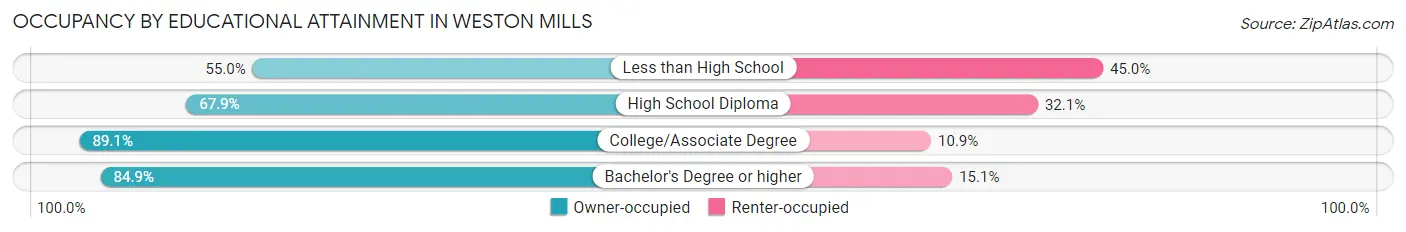
| Household Size | Owner-occupied | Renter-occupied |
| Less than High School | 22 (55.0%) | 18 (45.0%) |
| High School Diploma | 144 (67.9%) | 68 (32.1%) |
| College/Associate Degree | 180 (89.1%) | 22 (10.9%) |
| Bachelor's Degree or higher | 107 (84.9%) | 19 (15.1%) |
Occupancy by Age of Householder in Weston Mills
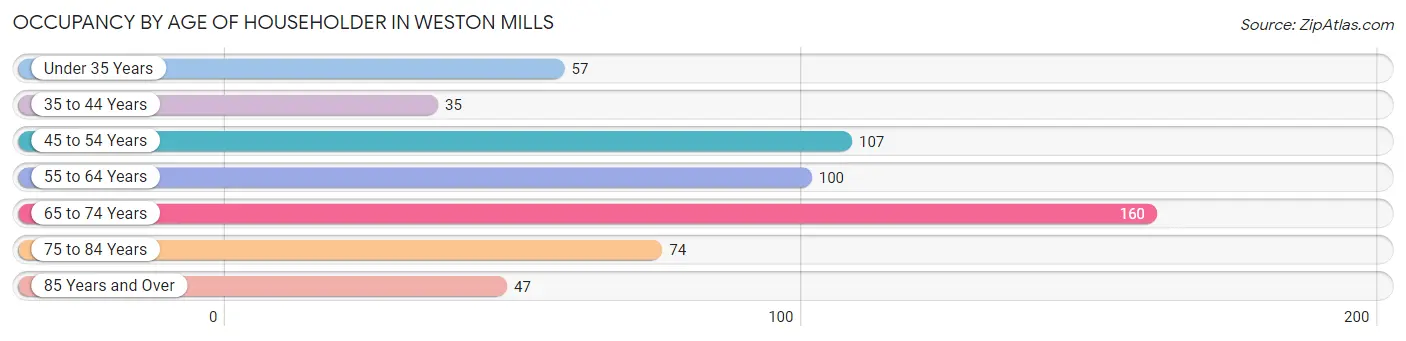
| Age Bracket | # Households | % Households |
| Under 35 Years | 57 | 9.8% |
| 35 to 44 Years | 35 | 6.0% |
| 45 to 54 Years | 107 | 18.4% |
| 55 to 64 Years | 100 | 17.2% |
| 65 to 74 Years | 160 | 27.6% |
| 75 to 84 Years | 74 | 12.8% |
| 85 Years and Over | 47 | 8.1% |
| Total | 580 | 100.0% |
Housing Finances in Weston Mills
Median Income by Occupancy in Weston Mills
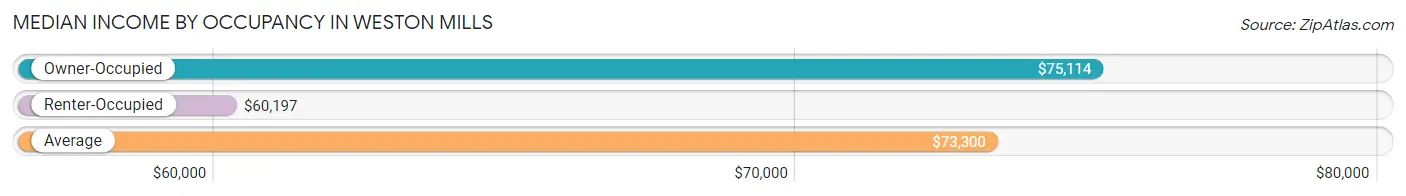
| Occupancy Type | # Households | Median Income |
| Owner-Occupied | 453 (78.1%) | $75,114 |
| Renter-Occupied | 127 (21.9%) | $60,197 |
| Average | 580 (100.0%) | $73,300 |
Occupancy by Householder Income Bracket in Weston Mills
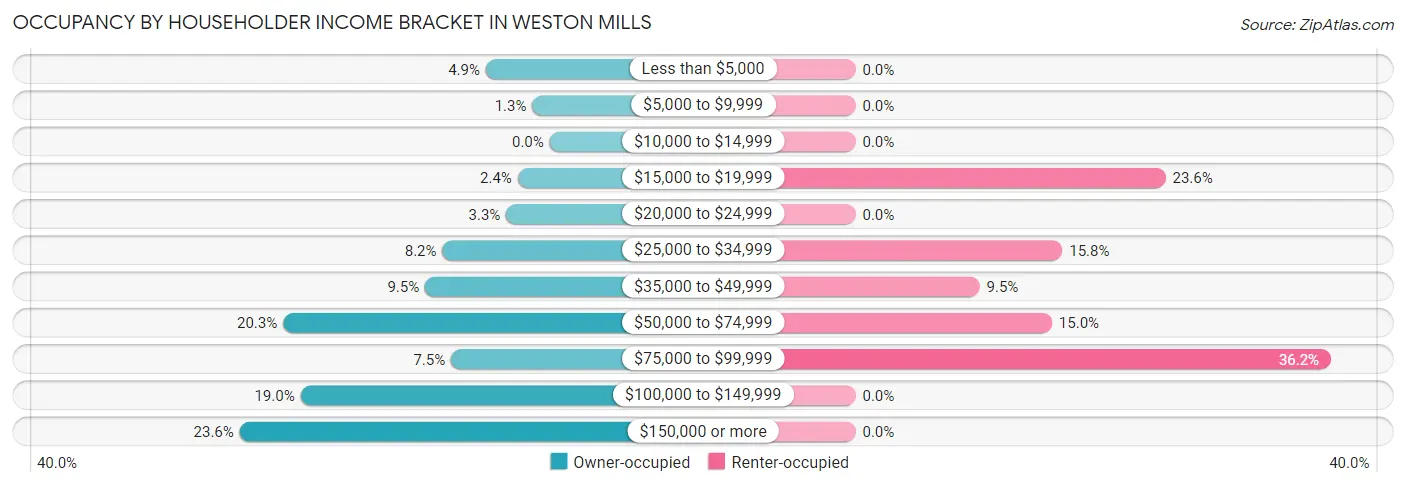
| Income Bracket | Owner-occupied | Renter-occupied |
| Less than $5,000 | 22 (4.9%) | 0 (0.0%) |
| $5,000 to $9,999 | 6 (1.3%) | 0 (0.0%) |
| $10,000 to $14,999 | 0 (0.0%) | 0 (0.0%) |
| $15,000 to $19,999 | 11 (2.4%) | 30 (23.6%) |
| $20,000 to $24,999 | 15 (3.3%) | 0 (0.0%) |
| $25,000 to $34,999 | 37 (8.2%) | 20 (15.8%) |
| $35,000 to $49,999 | 43 (9.5%) | 12 (9.5%) |
| $50,000 to $74,999 | 92 (20.3%) | 19 (15.0%) |
| $75,000 to $99,999 | 34 (7.5%) | 46 (36.2%) |
| $100,000 to $149,999 | 86 (19.0%) | 0 (0.0%) |
| $150,000 or more | 107 (23.6%) | 0 (0.0%) |
| Total | 453 (100.0%) | 127 (100.0%) |
Monthly Housing Cost Tiers in Weston Mills
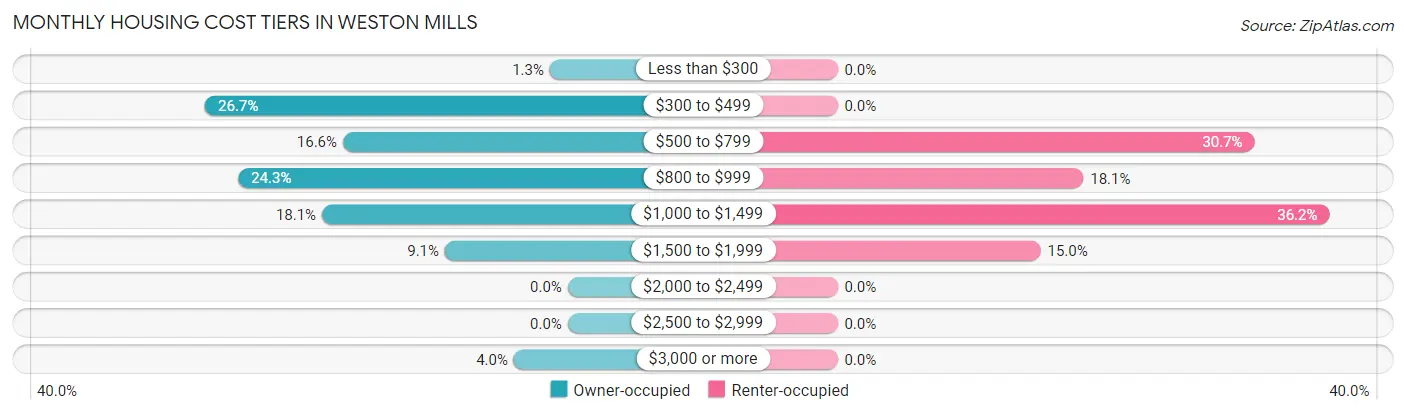
| Monthly Cost | Owner-occupied | Renter-occupied |
| Less than $300 | 6 (1.3%) | 0 (0.0%) |
| $300 to $499 | 121 (26.7%) | 0 (0.0%) |
| $500 to $799 | 75 (16.6%) | 39 (30.7%) |
| $800 to $999 | 110 (24.3%) | 23 (18.1%) |
| $1,000 to $1,499 | 82 (18.1%) | 46 (36.2%) |
| $1,500 to $1,999 | 41 (9.0%) | 19 (15.0%) |
| $2,000 to $2,499 | 0 (0.0%) | 0 (0.0%) |
| $2,500 to $2,999 | 0 (0.0%) | 0 (0.0%) |
| $3,000 or more | 18 (4.0%) | 0 (0.0%) |
| Total | 453 (100.0%) | 127 (100.0%) |
Physical Housing Characteristics in Weston Mills
Housing Structures in Weston Mills
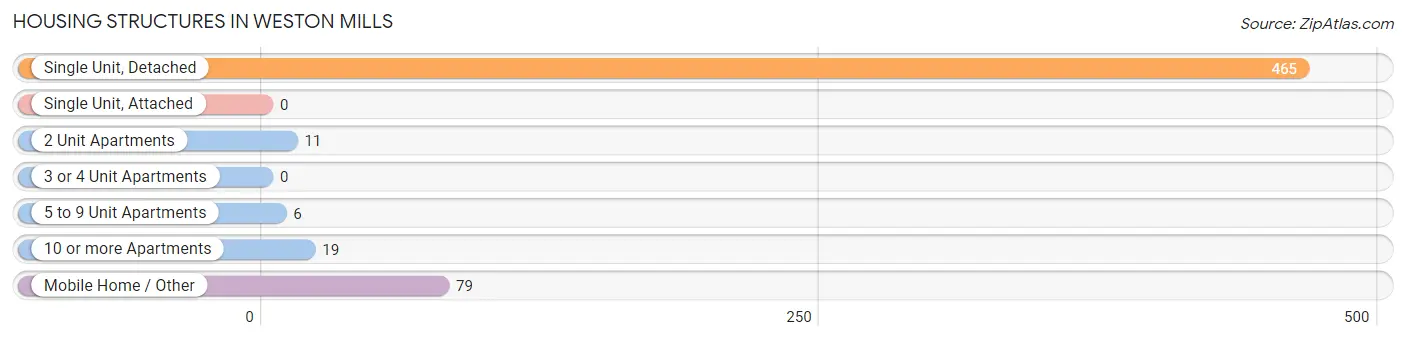
| Structure Type | # Housing Units | % Housing Units |
| Single Unit, Detached | 465 | 80.2% |
| Single Unit, Attached | 0 | 0.0% |
| 2 Unit Apartments | 11 | 1.9% |
| 3 or 4 Unit Apartments | 0 | 0.0% |
| 5 to 9 Unit Apartments | 6 | 1.0% |
| 10 or more Apartments | 19 | 3.3% |
| Mobile Home / Other | 79 | 13.6% |
| Total | 580 | 100.0% |
Housing Structures by Occupancy in Weston Mills
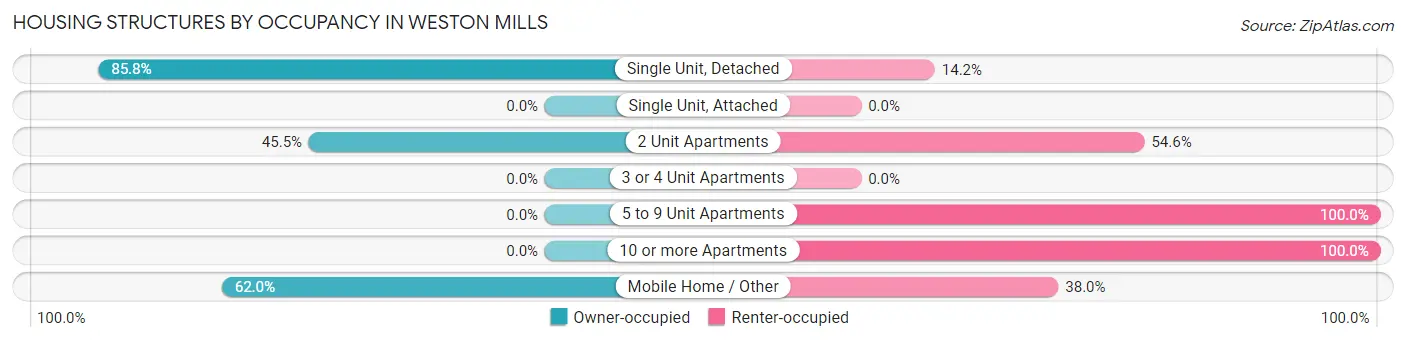
| Structure Type | Owner-occupied | Renter-occupied |
| Single Unit, Detached | 399 (85.8%) | 66 (14.2%) |
| Single Unit, Attached | 0 (0.0%) | 0 (0.0%) |
| 2 Unit Apartments | 5 (45.5%) | 6 (54.5%) |
| 3 or 4 Unit Apartments | 0 (0.0%) | 0 (0.0%) |
| 5 to 9 Unit Apartments | 0 (0.0%) | 6 (100.0%) |
| 10 or more Apartments | 0 (0.0%) | 19 (100.0%) |
| Mobile Home / Other | 49 (62.0%) | 30 (38.0%) |
| Total | 453 (78.1%) | 127 (21.9%) |
Housing Structures by Number of Rooms in Weston Mills
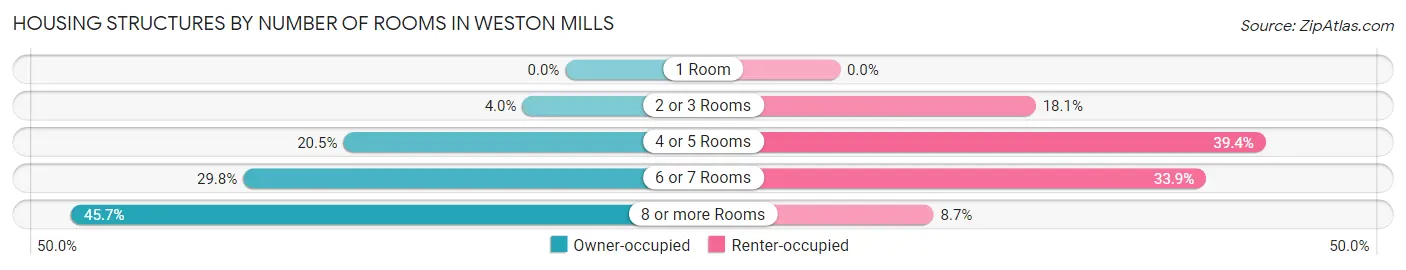
| Number of Rooms | Owner-occupied | Renter-occupied |
| 1 Room | 0 (0.0%) | 0 (0.0%) |
| 2 or 3 Rooms | 18 (4.0%) | 23 (18.1%) |
| 4 or 5 Rooms | 93 (20.5%) | 50 (39.4%) |
| 6 or 7 Rooms | 135 (29.8%) | 43 (33.9%) |
| 8 or more Rooms | 207 (45.7%) | 11 (8.7%) |
| Total | 453 (100.0%) | 127 (100.0%) |
Housing Structure by Heating Type in Weston Mills
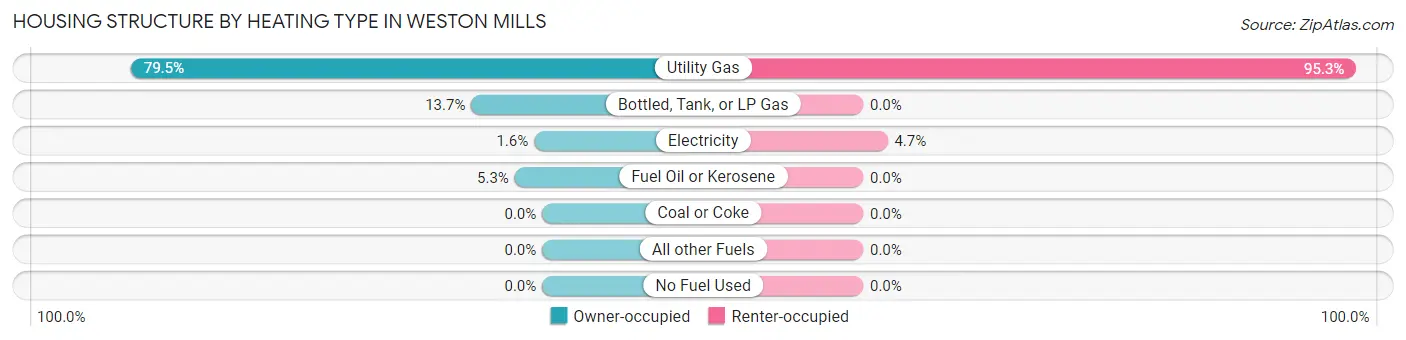
| Heating Type | Owner-occupied | Renter-occupied |
| Utility Gas | 360 (79.5%) | 121 (95.3%) |
| Bottled, Tank, or LP Gas | 62 (13.7%) | 0 (0.0%) |
| Electricity | 7 (1.5%) | 6 (4.7%) |
| Fuel Oil or Kerosene | 24 (5.3%) | 0 (0.0%) |
| Coal or Coke | 0 (0.0%) | 0 (0.0%) |
| All other Fuels | 0 (0.0%) | 0 (0.0%) |
| No Fuel Used | 0 (0.0%) | 0 (0.0%) |
| Total | 453 (100.0%) | 127 (100.0%) |
Household Vehicle Usage in Weston Mills
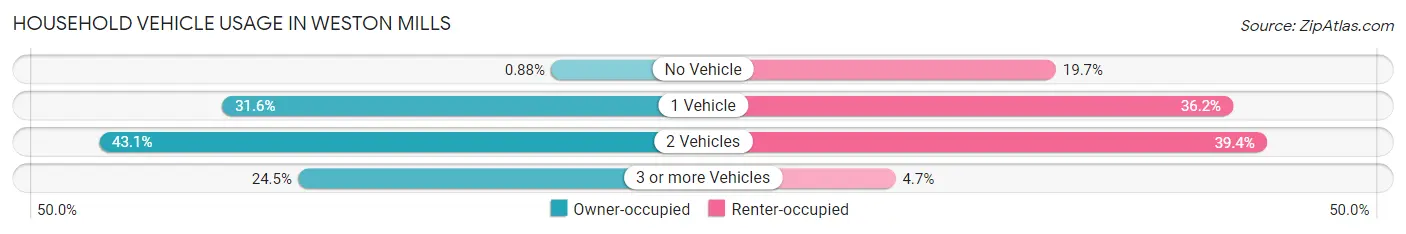
| Vehicles per Household | Owner-occupied | Renter-occupied |
| No Vehicle | 4 (0.9%) | 25 (19.7%) |
| 1 Vehicle | 143 (31.6%) | 46 (36.2%) |
| 2 Vehicles | 195 (43.0%) | 50 (39.4%) |
| 3 or more Vehicles | 111 (24.5%) | 6 (4.7%) |
| Total | 453 (100.0%) | 127 (100.0%) |
Real Estate & Mortgages in Weston Mills
Real Estate and Mortgage Overview in Weston Mills
| Characteristic | Without Mortgage | With Mortgage |
| Housing Units | 284 | 169 |
| Median Property Value | $98,500 | $163,400 |
| Median Household Income | $64,167 | $48 |
| Monthly Housing Costs | $612 | $4 |
| Real Estate Taxes | $3,314 | $4 |
Property Value by Mortgage Status in Weston Mills
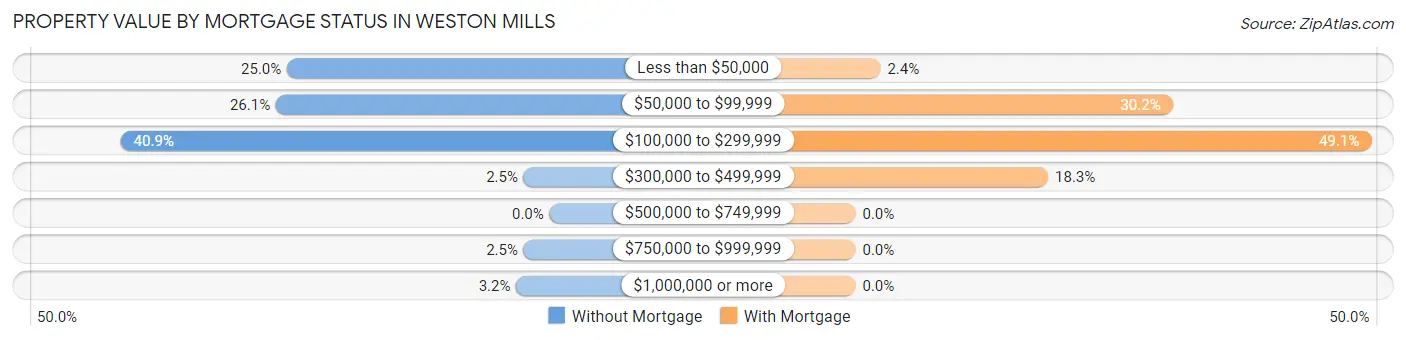
| Property Value | Without Mortgage | With Mortgage |
| Less than $50,000 | 71 (25.0%) | 4 (2.4%) |
| $50,000 to $99,999 | 74 (26.1%) | 51 (30.2%) |
| $100,000 to $299,999 | 116 (40.8%) | 83 (49.1%) |
| $300,000 to $499,999 | 7 (2.5%) | 31 (18.3%) |
| $500,000 to $749,999 | 0 (0.0%) | 0 (0.0%) |
| $750,000 to $999,999 | 7 (2.5%) | 0 (0.0%) |
| $1,000,000 or more | 9 (3.2%) | 0 (0.0%) |
| Total | 284 (100.0%) | 169 (100.0%) |
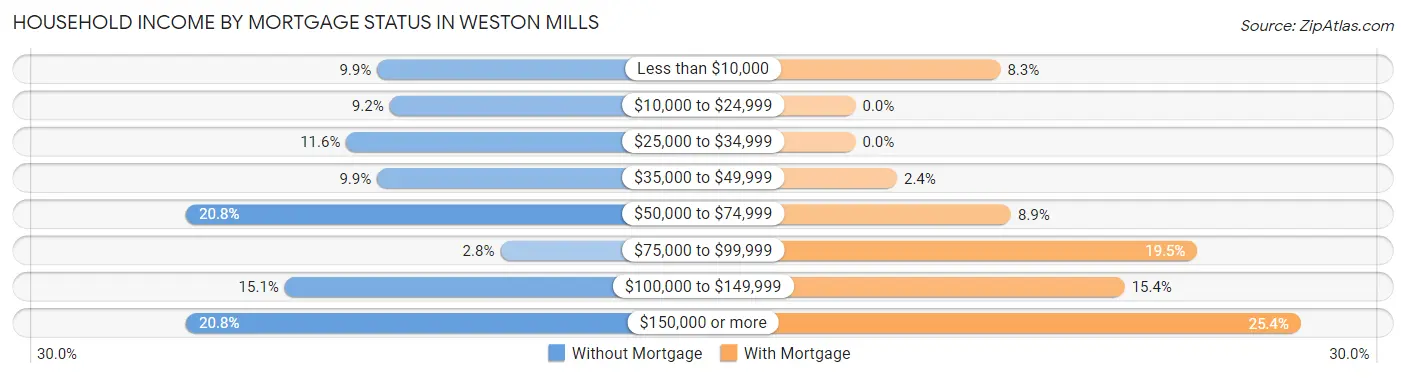
Household Income by Mortgage Status in Weston Mills
| Household Income | Without Mortgage | With Mortgage |
| Less than $10,000 | 28 (9.9%) | 14 (8.3%) |
| $10,000 to $24,999 | 26 (9.1%) | 0 (0.0%) |
| $25,000 to $34,999 | 33 (11.6%) | 0 (0.0%) |
| $35,000 to $49,999 | 28 (9.9%) | 4 (2.4%) |
| $50,000 to $74,999 | 59 (20.8%) | 15 (8.9%) |
| $75,000 to $99,999 | 8 (2.8%) | 33 (19.5%) |
| $100,000 to $149,999 | 43 (15.1%) | 26 (15.4%) |
| $150,000 or more | 59 (20.8%) | 43 (25.4%) |
| Total | 284 (100.0%) | 169 (100.0%) |
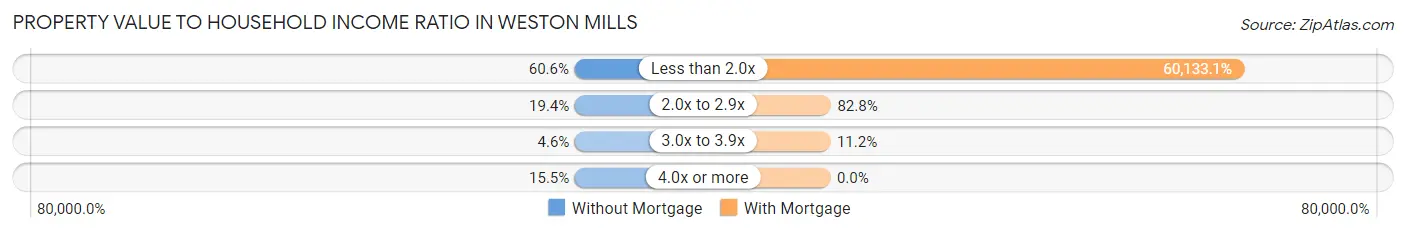
Property Value to Household Income Ratio in Weston Mills
| Value-to-Income Ratio | Without Mortgage | With Mortgage |
| Less than 2.0x | 172 (60.6%) | 101,625 (60,133.1%) |
| 2.0x to 2.9x | 55 (19.4%) | 140 (82.8%) |
| 3.0x to 3.9x | 13 (4.6%) | 19 (11.2%) |
| 4.0x or more | 44 (15.5%) | 0 (0.0%) |
| Total | 284 (100.0%) | 169 (100.0%) |
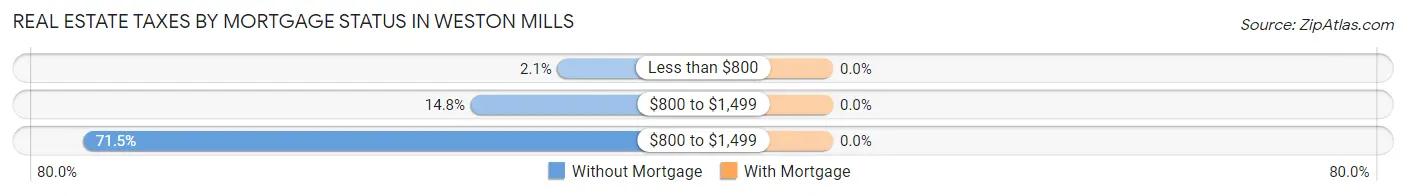
Real Estate Taxes by Mortgage Status in Weston Mills
| Property Taxes | Without Mortgage | With Mortgage |
| Less than $800 | 6 (2.1%) | 0 (0.0%) |
| $800 to $1,499 | 42 (14.8%) | 0 (0.0%) |
| $800 to $1,499 | 203 (71.5%) | 0 (0.0%) |
| Total | 284 (100.0%) | 169 (100.0%) |
Health & Disability in Weston Mills
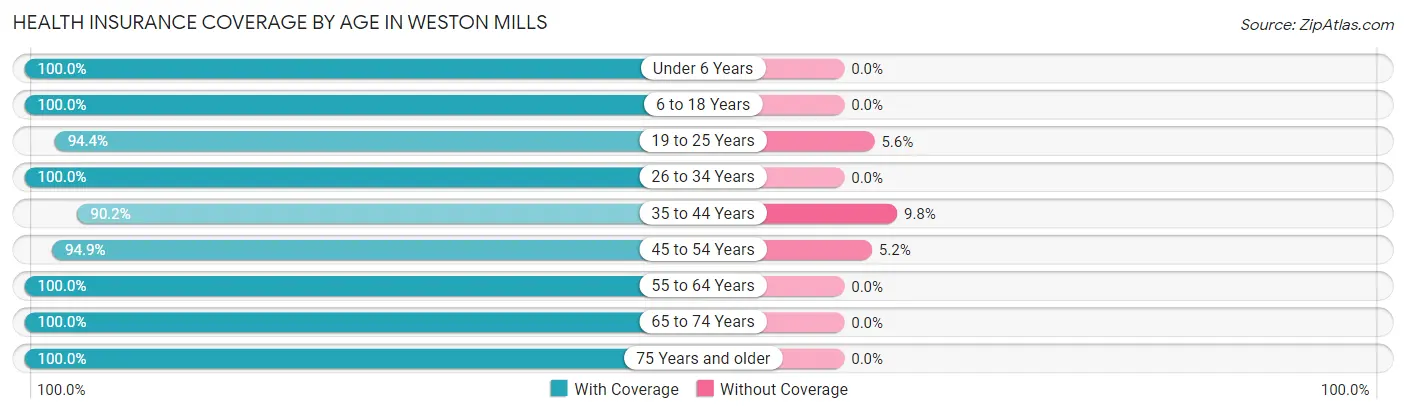
Health Insurance Coverage by Age in Weston Mills
| Age Bracket | With Coverage | Without Coverage |
| Under 6 Years | 51 (100.0%) | 0 (0.0%) |
| 6 to 18 Years | 133 (100.0%) | 0 (0.0%) |
| 19 to 25 Years | 84 (94.4%) | 5 (5.6%) |
| 26 to 34 Years | 65 (100.0%) | 0 (0.0%) |
| 35 to 44 Years | 55 (90.2%) | 6 (9.8%) |
| 45 to 54 Years | 184 (94.9%) | 10 (5.1%) |
| 55 to 64 Years | 203 (100.0%) | 0 (0.0%) |
| 65 to 74 Years | 252 (100.0%) | 0 (0.0%) |
| 75 Years and older | 186 (100.0%) | 0 (0.0%) |
| Total | 1,213 (98.3%) | 21 (1.7%) |
Health Insurance Coverage by Citizenship Status in Weston Mills
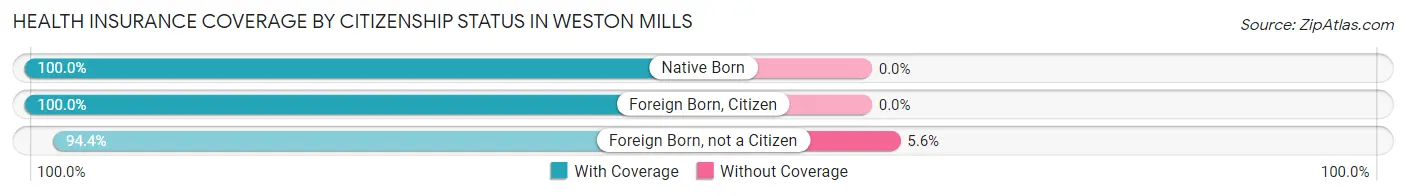
| Citizenship Status | With Coverage | Without Coverage |
| Native Born | 51 (100.0%) | 0 (0.0%) |
| Foreign Born, Citizen | 133 (100.0%) | 0 (0.0%) |
| Foreign Born, not a Citizen | 84 (94.4%) | 5 (5.6%) |
Health Insurance Coverage by Household Income in Weston Mills
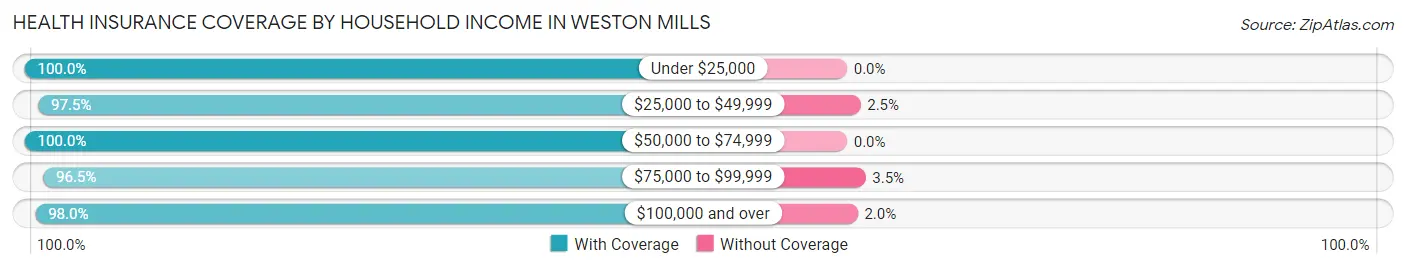
| Household Income | With Coverage | Without Coverage |
| Under $25,000 | 117 (100.0%) | 0 (0.0%) |
| $25,000 to $49,999 | 231 (97.5%) | 6 (2.5%) |
| $50,000 to $74,999 | 238 (100.0%) | 0 (0.0%) |
| $75,000 to $99,999 | 167 (96.5%) | 6 (3.5%) |
| $100,000 and over | 442 (98.0%) | 9 (2.0%) |
Public vs Private Health Insurance Coverage by Age in Weston Mills
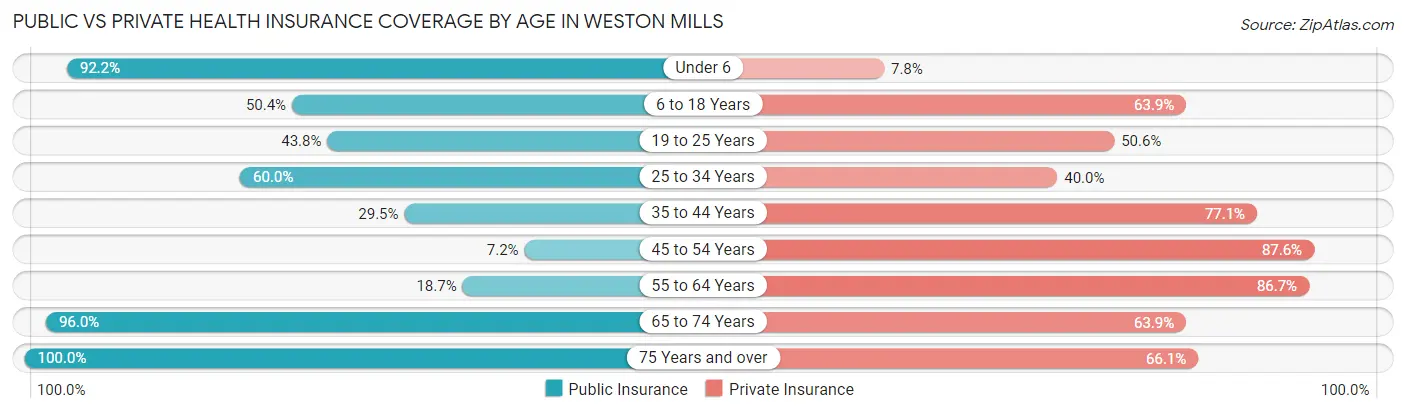
| Age Bracket | Public Insurance | Private Insurance |
| Under 6 | 47 (92.2%) | 4 (7.8%) |
| 6 to 18 Years | 67 (50.4%) | 85 (63.9%) |
| 19 to 25 Years | 39 (43.8%) | 45 (50.6%) |
| 25 to 34 Years | 39 (60.0%) | 26 (40.0%) |
| 35 to 44 Years | 18 (29.5%) | 47 (77.0%) |
| 45 to 54 Years | 14 (7.2%) | 170 (87.6%) |
| 55 to 64 Years | 38 (18.7%) | 176 (86.7%) |
| 65 to 74 Years | 242 (96.0%) | 161 (63.9%) |
| 75 Years and over | 186 (100.0%) | 123 (66.1%) |
| Total | 690 (55.9%) | 837 (67.8%) |
Disability Status by Sex by Age in Weston Mills
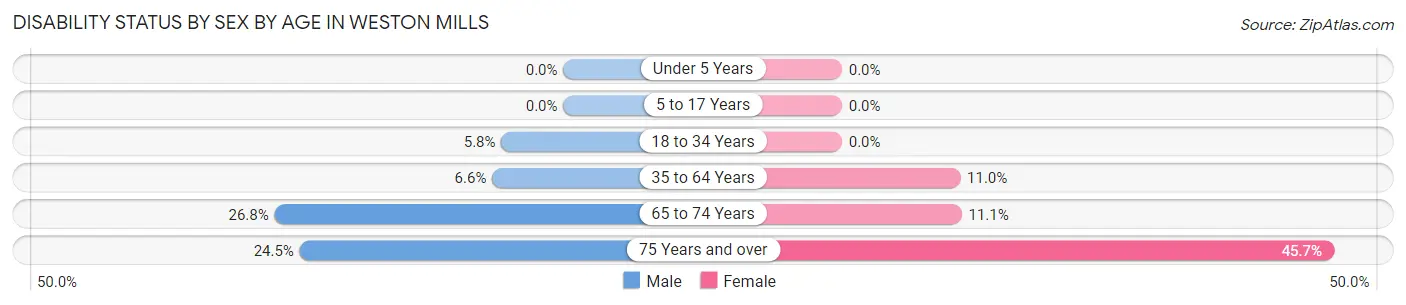
| Age Bracket | Male | Female |
| Under 5 Years | 0 (0.0%) | 0 (0.0%) |
| 5 to 17 Years | 0 (0.0%) | 0 (0.0%) |
| 18 to 34 Years | 5 (5.8%) | 0 (0.0%) |
| 35 to 64 Years | 14 (6.6%) | 27 (11.0%) |
| 65 to 74 Years | 41 (26.8%) | 11 (11.1%) |
| 75 Years and over | 23 (24.5%) | 42 (45.7%) |
Disability Class by Sex by Age in Weston Mills
Disability Class: Hearing Difficulty
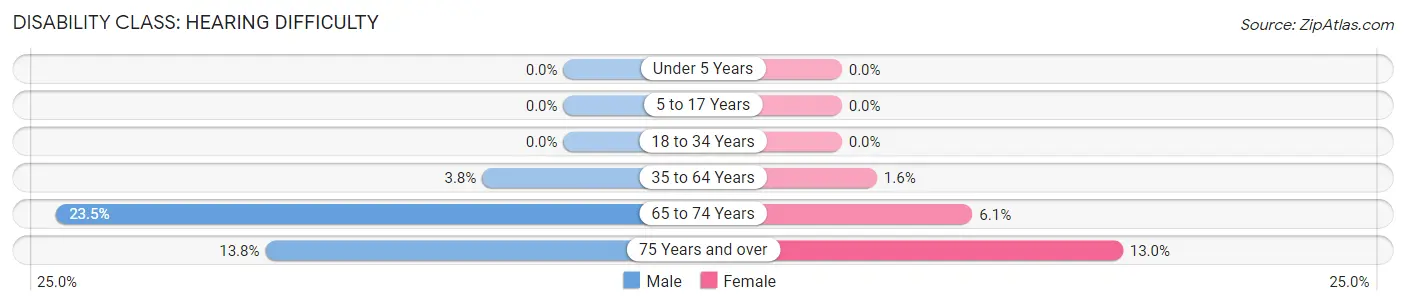
| Age Bracket | Male | Female |
| Under 5 Years | 0 (0.0%) | 0 (0.0%) |
| 5 to 17 Years | 0 (0.0%) | 0 (0.0%) |
| 18 to 34 Years | 0 (0.0%) | 0 (0.0%) |
| 35 to 64 Years | 8 (3.8%) | 4 (1.6%) |
| 65 to 74 Years | 36 (23.5%) | 6 (6.1%) |
| 75 Years and over | 13 (13.8%) | 12 (13.0%) |
Disability Class: Vision Difficulty
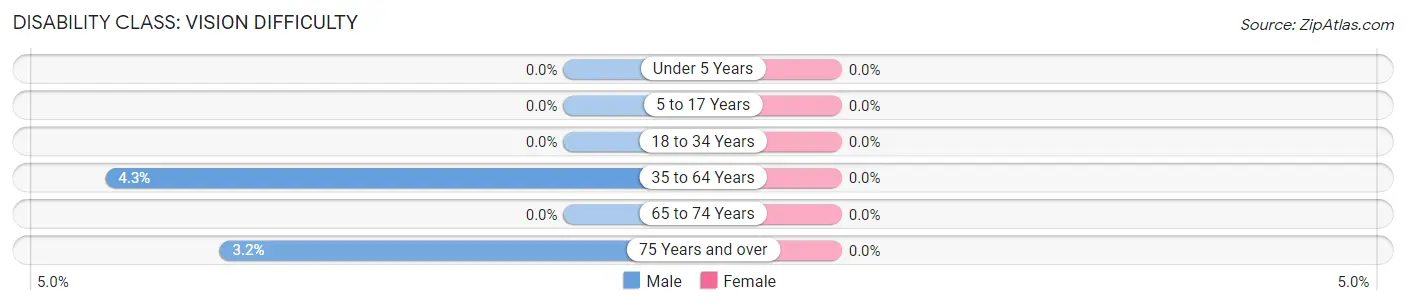
| Age Bracket | Male | Female |
| Under 5 Years | 0 (0.0%) | 0 (0.0%) |
| 5 to 17 Years | 0 (0.0%) | 0 (0.0%) |
| 18 to 34 Years | 0 (0.0%) | 0 (0.0%) |
| 35 to 64 Years | 9 (4.3%) | 0 (0.0%) |
| 65 to 74 Years | 0 (0.0%) | 0 (0.0%) |
| 75 Years and over | 3 (3.2%) | 0 (0.0%) |
Disability Class: Cognitive Difficulty
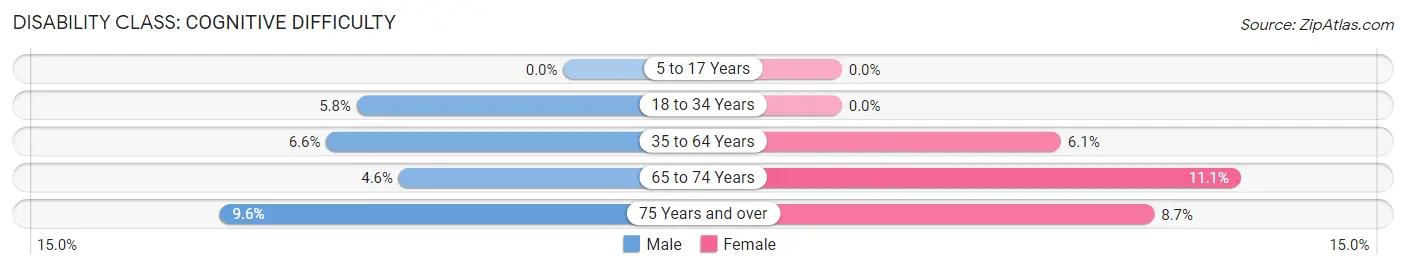
| Age Bracket | Male | Female |
| 5 to 17 Years | 0 (0.0%) | 0 (0.0%) |
| 18 to 34 Years | 5 (5.8%) | 0 (0.0%) |
| 35 to 64 Years | 14 (6.6%) | 15 (6.1%) |
| 65 to 74 Years | 7 (4.6%) | 11 (11.1%) |
| 75 Years and over | 9 (9.6%) | 8 (8.7%) |
Disability Class: Ambulatory Difficulty
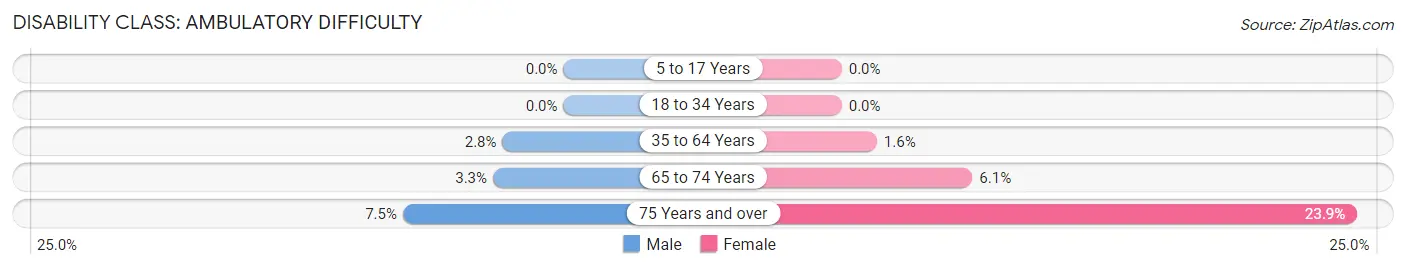
| Age Bracket | Male | Female |
| 5 to 17 Years | 0 (0.0%) | 0 (0.0%) |
| 18 to 34 Years | 0 (0.0%) | 0 (0.0%) |
| 35 to 64 Years | 6 (2.8%) | 4 (1.6%) |
| 65 to 74 Years | 5 (3.3%) | 6 (6.1%) |
| 75 Years and over | 7 (7.4%) | 22 (23.9%) |
Disability Class: Self-Care Difficulty
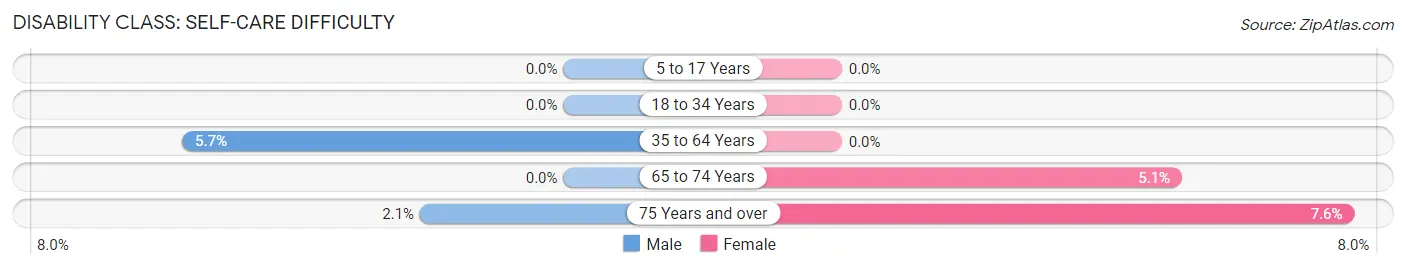
| Age Bracket | Male | Female |
| 5 to 17 Years | 0 (0.0%) | 0 (0.0%) |
| 18 to 34 Years | 0 (0.0%) | 0 (0.0%) |
| 35 to 64 Years | 12 (5.7%) | 0 (0.0%) |
| 65 to 74 Years | 0 (0.0%) | 5 (5.1%) |
| 75 Years and over | 2 (2.1%) | 7 (7.6%) |
Technology Access in Weston Mills
Computing Device Access in Weston Mills
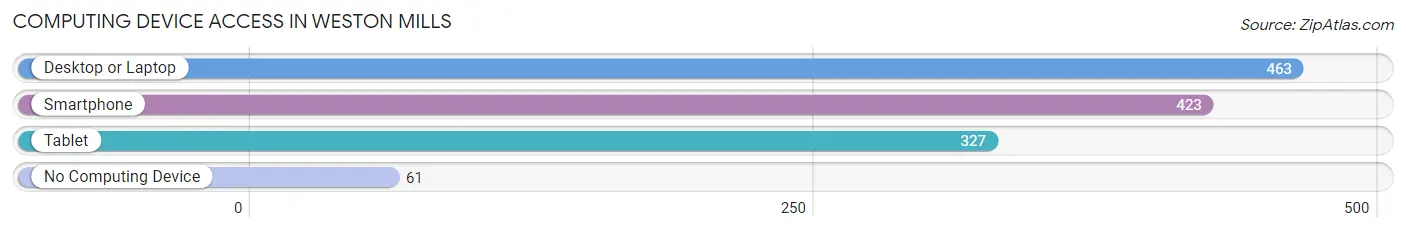
| Device Type | # Households | % Households |
| Desktop or Laptop | 463 | 79.8% |
| Smartphone | 423 | 72.9% |
| Tablet | 327 | 56.4% |
| No Computing Device | 61 | 10.5% |
| Total | 580 | 100.0% |
Internet Access in Weston Mills
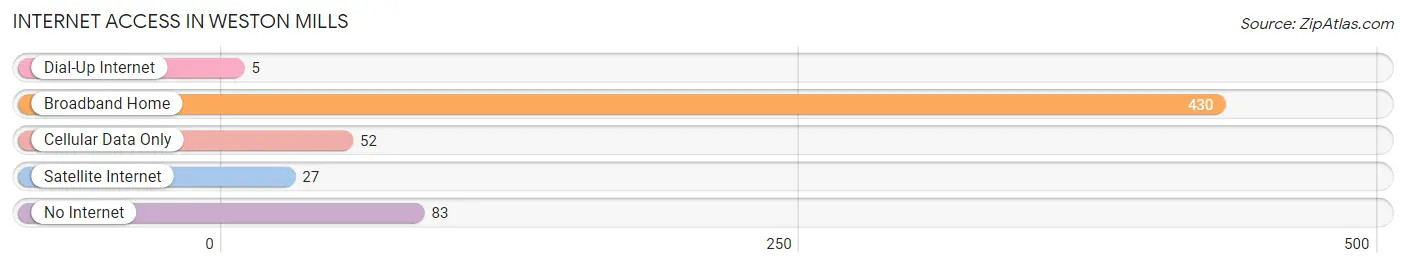
| Internet Type | # Households | % Households |
| Dial-Up Internet | 5 | 0.9% |
| Broadband Home | 430 | 74.1% |
| Cellular Data Only | 52 | 9.0% |
| Satellite Internet | 27 | 4.7% |
| No Internet | 83 | 14.3% |
| Total | 580 | 100.0% |
Weston Mills Summary
Weston Mills is a small hamlet located in the town of Carroll in Chautauqua County, New York. It is situated on the banks of the Chadakoin River, about 10 miles south of Jamestown. The hamlet was first settled in the early 1800s and was originally known as “Weston’s Mills” after the first settler, William Weston. The hamlet was later renamed “Weston Mills” in 1845.
Geography
Weston Mills is located in the southwestern corner of Chautauqua County, New York. It is situated on the banks of the Chadakoin River, about 10 miles south of Jamestown. The hamlet is surrounded by rolling hills and farmland, and is bordered by the towns of Carroll, Ellington, and Gerry. The terrain is mostly flat, with some small hills and valleys. The climate is generally mild, with cold winters and warm summers.
History
Weston Mills was first settled in the early 1800s by William Weston, who built a sawmill and gristmill on the banks of the Chadakoin River. The hamlet was originally known as “Weston’s Mills”, but was later renamed “Weston Mills” in 1845. The hamlet grew slowly over the years, and by the late 1800s it had become a small village with a population of about 500 people.
The hamlet was home to several businesses, including a general store, a blacksmith shop, a hotel, and a post office. The Weston Mills Post Office was established in 1845 and is still in operation today. The hamlet also had a school, which was built in 1876 and is now a private residence.
Economy
Weston Mills is a small, rural community with a population of about 500 people. The economy is largely based on agriculture, with many of the residents working in the farming and dairy industries. There are also several small businesses in the hamlet, including a general store, a blacksmith shop, and a post office.
Demographics
As of the 2010 census, the population of Weston Mills was 498 people. The racial makeup of the hamlet was 97.2% White, 0.2% African American, 0.2% Native American, 0.4% Asian, 0.2% from other races, and 1.9% from two or more races. Hispanic or Latino of any race were 0.8% of the population.
The median household income in Weston Mills was $45,000, and the median family income was $50,000. The per capita income was $20,000. About 8.3% of families and 10.2% of the population were below the poverty line, including 14.3% of those under age 18 and none of those age 65 or over.
Conclusion
Weston Mills is a small hamlet located in the town of Carroll in Chautauqua County, New York. It is situated on the banks of the Chadakoin River, about 10 miles south of Jamestown. The hamlet was first settled in the early 1800s and was originally known as “Weston’s Mills” after the first settler, William Weston. The hamlet was later renamed “Weston Mills” in 1845. The economy of Weston Mills is largely based on agriculture, with many of the residents working in the farming and dairy industries. The population of Weston Mills was 498 people as of the 2010 census, with a median household income of $45,000 and a median family income of $50,000.
Common Questions
What is Per Capita Income in Weston Mills?
Per Capita income in Weston Mills is $51,907.
What is the Median Family Income in Weston Mills?
Median Family Income in Weston Mills is $77,208.
What is the Median Household income in Weston Mills?
Median Household Income in Weston Mills is $73,300.
What is Income or Wage Gap in Weston Mills?
Income or Wage Gap in Weston Mills is 27.6%.
Women in Weston Mills earn 72.4 cents for every dollar earned by a man.
What is Inequality or Gini Index in Weston Mills?
Inequality or Gini Index in Weston Mills is 0.51.
What is the Total Population of Weston Mills?
Total Population of Weston Mills is 1,259.
What is the Total Male Population of Weston Mills?
Total Male Population of Weston Mills is 635.
What is the Total Female Population of Weston Mills?
Total Female Population of Weston Mills is 624.
What is the Ratio of Males per 100 Females in Weston Mills?
There are 101.76 Males per 100 Females in Weston Mills.
What is the Ratio of Females per 100 Males in Weston Mills?
There are 98.27 Females per 100 Males in Weston Mills.
What is the Median Population Age in Weston Mills?
Median Population Age in Weston Mills is 55.4 Years.
What is the Average Family Size in Weston Mills
Average Family Size in Weston Mills is 2.5 People.
What is the Average Household Size in Weston Mills
Average Household Size in Weston Mills is 2.1 People.
How Large is the Labor Force in Weston Mills?
There are 607 People in the Labor Forcein in Weston Mills.
What is the Percentage of People in the Labor Force in Weston Mills?
54.3% of People are in the Labor Force in Weston Mills.
What is the Unemployment Rate in Weston Mills?
Unemployment Rate in Weston Mills is 11.6%.