La Fargeville, NY Map & Demographics
La Fargeville Map
La Fargeville Overview
$16,058
PER CAPITA INCOME
70.8%
WAGE / INCOME GAP [ % ]
29.2¢/ $1
WAGE / INCOME GAP [ $ ]
0.50
INEQUALITY / GINI INDEX
530
TOTAL POPULATION
223
MALE POPULATION
307
FEMALE POPULATION
72.64
MALES / 100 FEMALES
137.67
FEMALES / 100 MALES
28.5
MEDIAN AGE
3.1
AVG FAMILY SIZE
2.5
AVG HOUSEHOLD SIZE
218
LABOR FORCE [ PEOPLE ]
68.8%
PERCENT IN LABOR FORCE
5.9%
UNEMPLOYMENT RATE
La Fargeville Zip Codes
La Fargeville Area Codes
Income in La Fargeville
Income Overview in La Fargeville
| Characteristic | Number | Measure |
| Per Capita Income | 530 | $16,058 |
| Median Family Income | 145 | $0 |
| Mean Family Income | 145 | $45,244 |
| Median Household Income | 211 | $0 |
| Mean Household Income | 211 | $39,112 |
| Income Deficit | 145 | $0 |
| Wage / Income Gap (%) | 530 | 70.84% |
| Wage / Income Gap ($) | 530 | 29.16¢ per $1 |
| Gini / Inequality Index | 530 | 0.50 |
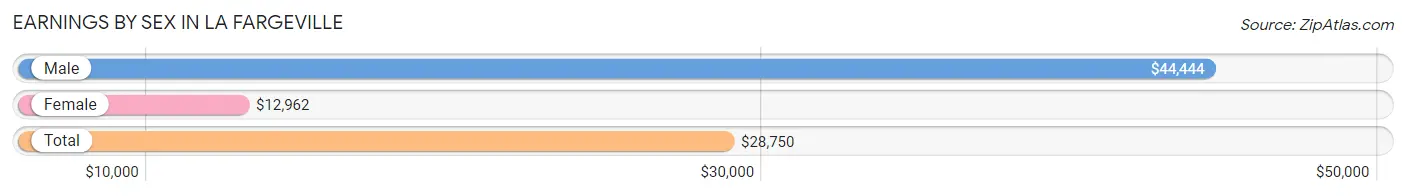
Earnings by Sex in La Fargeville
Average Earnings in La Fargeville are $28,750, $44,444 for men and $12,962 for women, a difference of 70.8%.
| Sex | Number | Average Earnings |
| Male | 90 (41.1%) | $44,444 |
| Female | 129 (58.9%) | $12,962 |
| Total | 219 (100.0%) | $28,750 |
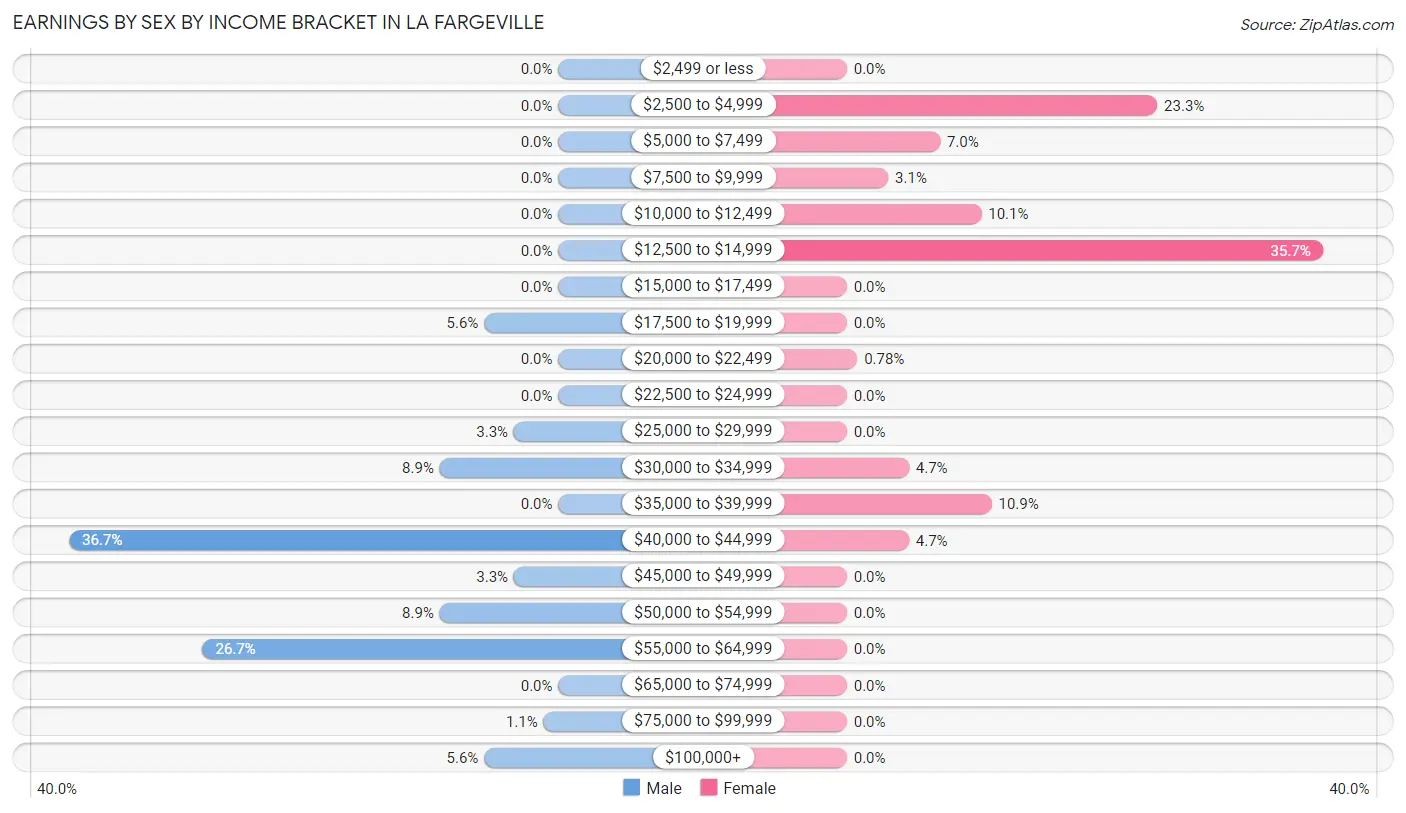
Earnings by Sex by Income Bracket in La Fargeville
The most common earnings brackets in La Fargeville are $40,000 to $44,999 for men (33 | 36.7%) and $12,500 to $14,999 for women (46 | 35.7%).
| Income | Male | Female |
| $2,499 or less | 0 (0.0%) | 0 (0.0%) |
| $2,500 to $4,999 | 0 (0.0%) | 30 (23.3%) |
| $5,000 to $7,499 | 0 (0.0%) | 9 (7.0%) |
| $7,500 to $9,999 | 0 (0.0%) | 4 (3.1%) |
| $10,000 to $12,499 | 0 (0.0%) | 13 (10.1%) |
| $12,500 to $14,999 | 0 (0.0%) | 46 (35.7%) |
| $15,000 to $17,499 | 0 (0.0%) | 0 (0.0%) |
| $17,500 to $19,999 | 5 (5.6%) | 0 (0.0%) |
| $20,000 to $22,499 | 0 (0.0%) | 1 (0.8%) |
| $22,500 to $24,999 | 0 (0.0%) | 0 (0.0%) |
| $25,000 to $29,999 | 3 (3.3%) | 0 (0.0%) |
| $30,000 to $34,999 | 8 (8.9%) | 6 (4.6%) |
| $35,000 to $39,999 | 0 (0.0%) | 14 (10.8%) |
| $40,000 to $44,999 | 33 (36.7%) | 6 (4.6%) |
| $45,000 to $49,999 | 3 (3.3%) | 0 (0.0%) |
| $50,000 to $54,999 | 8 (8.9%) | 0 (0.0%) |
| $55,000 to $64,999 | 24 (26.7%) | 0 (0.0%) |
| $65,000 to $74,999 | 0 (0.0%) | 0 (0.0%) |
| $75,000 to $99,999 | 1 (1.1%) | 0 (0.0%) |
| $100,000+ | 5 (5.6%) | 0 (0.0%) |
| Total | 90 (100.0%) | 129 (100.0%) |
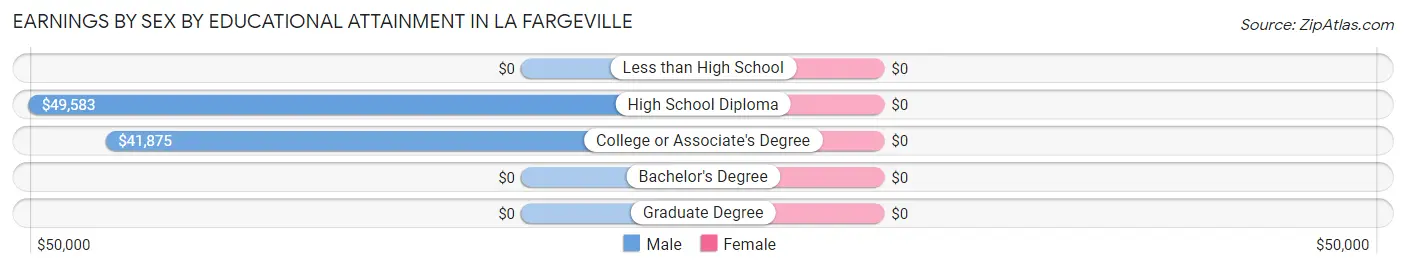
Earnings by Sex by Educational Attainment in La Fargeville
| Educational Attainment | Male Income | Female Income |
| Less than High School | - | - |
| High School Diploma | $49,583 | $0 |
| College or Associate's Degree | $41,875 | $0 |
| Bachelor's Degree | - | - |
| Graduate Degree | - | - |
| Total | $43,889 | $13,424 |
Family Income in La Fargeville
Family Income Brackets in La Fargeville
According to the La Fargeville family income data, there are 55 families falling into the $15,000 to $24,999 income range, which is the most common income bracket and makes up 37.9% of all families.
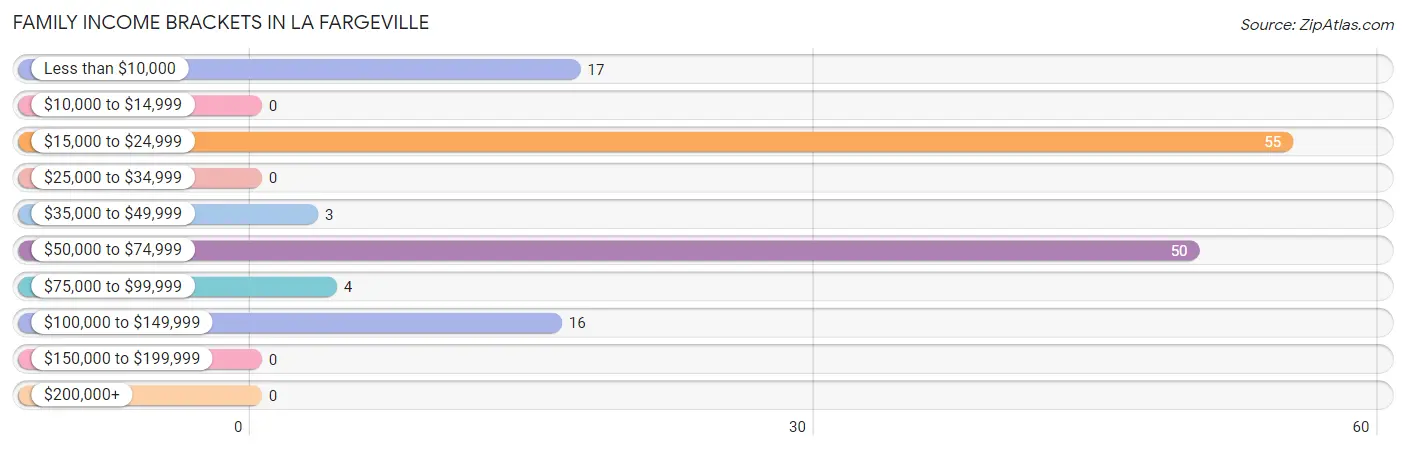
| Income Bracket | # Families | % Families |
| Less than $10,000 | 17 | 11.7% |
| $10,000 to $14,999 | 0 | 0.0% |
| $15,000 to $24,999 | 55 | 37.9% |
| $25,000 to $34,999 | 0 | 0.0% |
| $35,000 to $49,999 | 3 | 2.1% |
| $50,000 to $74,999 | 50 | 34.5% |
| $75,000 to $99,999 | 4 | 2.8% |
| $100,000 to $149,999 | 16 | 11.0% |
| $150,000 to $199,999 | 0 | 0.0% |
| $200,000+ | 0 | 0.0% |
Family Income by Famaliy Size in La Fargeville
| Income Bracket | # Families | Median Income |
| 2-Person Families | 59 (40.7%) | $0 |
| 3-Person Families | 61 (42.1%) | $0 |
| 4-Person Families | 10 (6.9%) | $0 |
| 5-Person Families | 2 (1.4%) | $0 |
| 6-Person Families | 13 (9.0%) | $0 |
| 7+ Person Families | 0 (0.0%) | $0 |
| Total | 145 (100.0%) | $0 |
Family Income by Number of Earners in La Fargeville
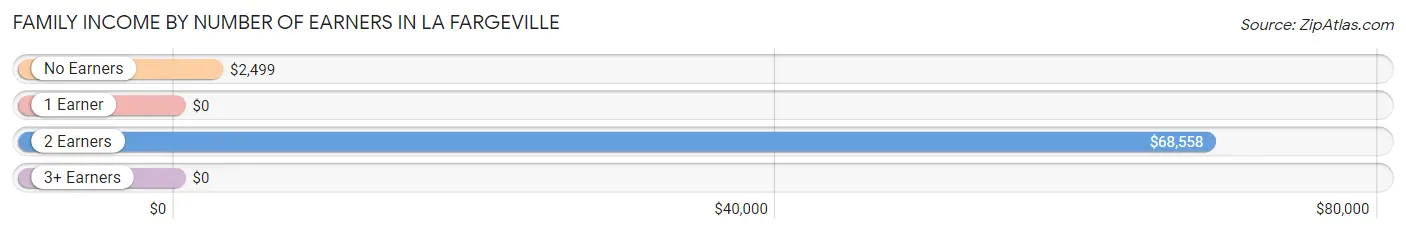
| Number of Earners | # Families | Median Income |
| No Earners | 25 (17.2%) | $2,499 |
| 1 Earner | 84 (57.9%) | $0 |
| 2 Earners | 29 (20.0%) | $68,558 |
| 3+ Earners | 7 (4.8%) | $0 |
| Total | 145 (100.0%) | $0 |
Household Income in La Fargeville
Household Income Brackets in La Fargeville
With 65 households falling in the category, the $15,000 to $24,999 income range is the most frequent in La Fargeville, accounting for 30.8% of all households.
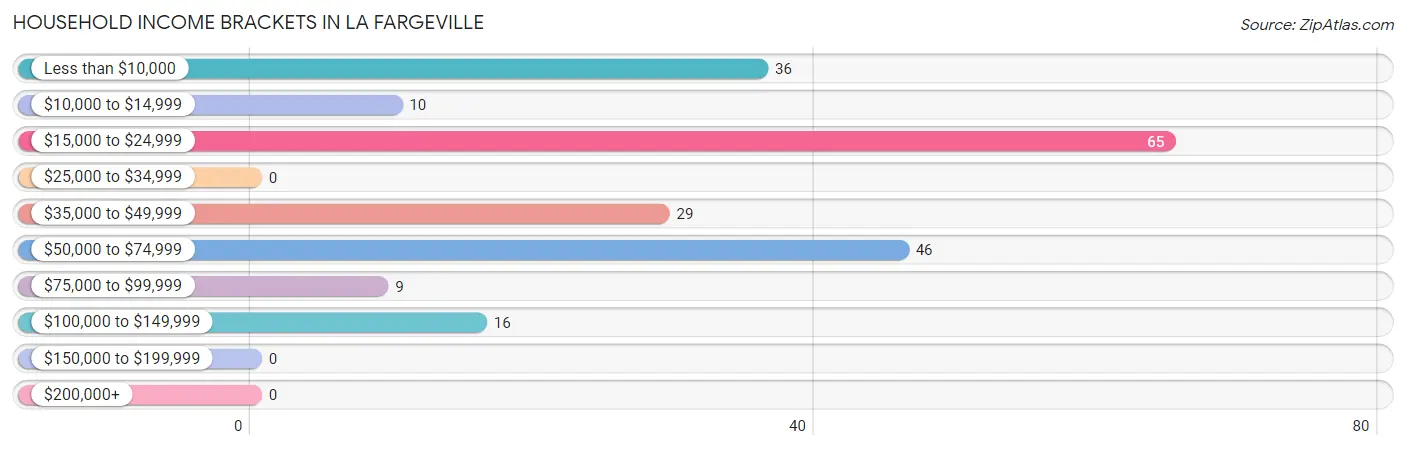
| Income Bracket | # Households | % Households |
| Less than $10,000 | 36 | 17.1% |
| $10,000 to $14,999 | 10 | 4.7% |
| $15,000 to $24,999 | 65 | 30.8% |
| $25,000 to $34,999 | 0 | 0.0% |
| $35,000 to $49,999 | 29 | 13.7% |
| $50,000 to $74,999 | 46 | 21.8% |
| $75,000 to $99,999 | 9 | 4.3% |
| $100,000 to $149,999 | 16 | 7.6% |
| $150,000 to $199,999 | 0 | 0.0% |
| $200,000+ | 0 | 0.0% |
Household Income by Householder Age in La Fargeville
| Income Bracket | # Households | Median Income |
| 15 to 24 Years | 8 (3.8%) | $0 |
| 25 to 44 Years | 110 (52.1%) | $0 |
| 45 to 64 Years | 58 (27.5%) | $0 |
| 65+ Years | 35 (16.6%) | $0 |
| Total | 211 (100.0%) | $0 |
Poverty in La Fargeville
Income Below Poverty by Sex and Age in La Fargeville
With 38.1% poverty level for males and 51.8% for females among the residents of La Fargeville, 5 year old males and 16 and 17 year old females are the most vulnerable to poverty, with 66 males (100.0%) and 9 females (100.0%) in their respective age groups living below the poverty level.
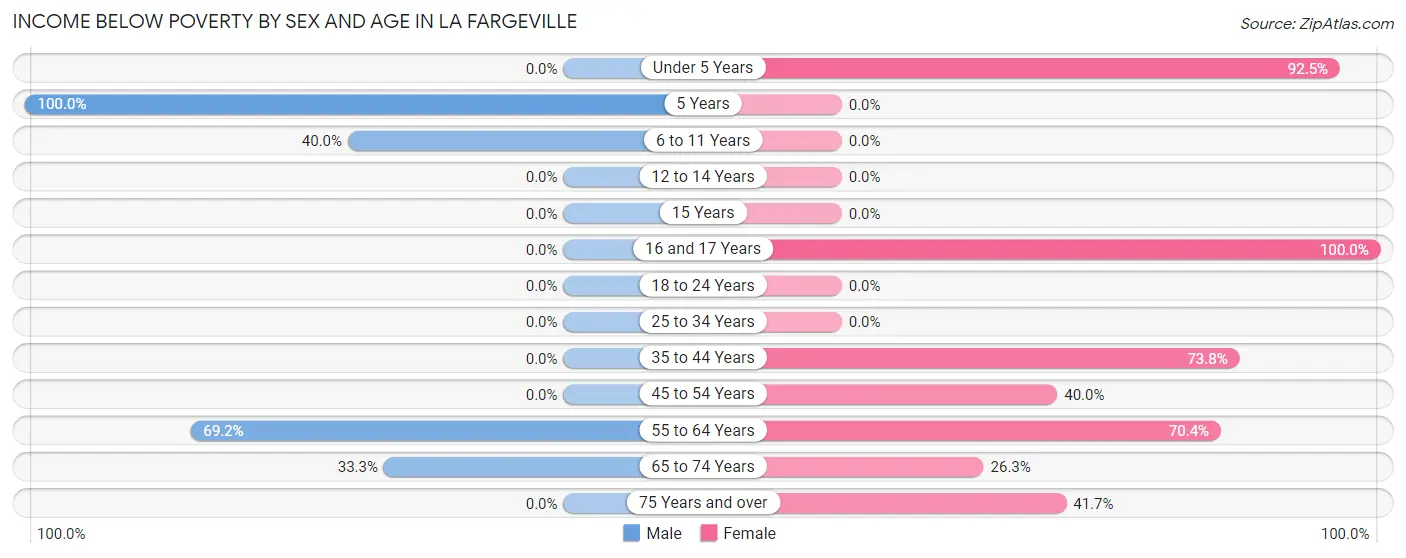
| Age Bracket | Male | Female |
| Under 5 Years | 0 (0.0%) | 49 (92.4%) |
| 5 Years | 66 (100.0%) | 0 (0.0%) |
| 6 to 11 Years | 8 (40.0%) | 0 (0.0%) |
| 12 to 14 Years | 0 (0.0%) | 0 (0.0%) |
| 15 Years | 0 (0.0%) | 0 (0.0%) |
| 16 and 17 Years | 0 (0.0%) | 9 (100.0%) |
| 18 to 24 Years | 0 (0.0%) | 0 (0.0%) |
| 25 to 34 Years | 0 (0.0%) | 0 (0.0%) |
| 35 to 44 Years | 0 (0.0%) | 62 (73.8%) |
| 45 to 54 Years | 0 (0.0%) | 10 (40.0%) |
| 55 to 64 Years | 9 (69.2%) | 19 (70.4%) |
| 65 to 74 Years | 2 (33.3%) | 5 (26.3%) |
| 75 Years and over | 0 (0.0%) | 5 (41.7%) |
| Total | 85 (38.1%) | 159 (51.8%) |
Income Above Poverty by Sex and Age in La Fargeville
According to the poverty statistics in La Fargeville, males aged under 5 years and females aged 5 years are the age groups that are most secure financially, with 100.0% of males and 100.0% of females in these age groups living above the poverty line.
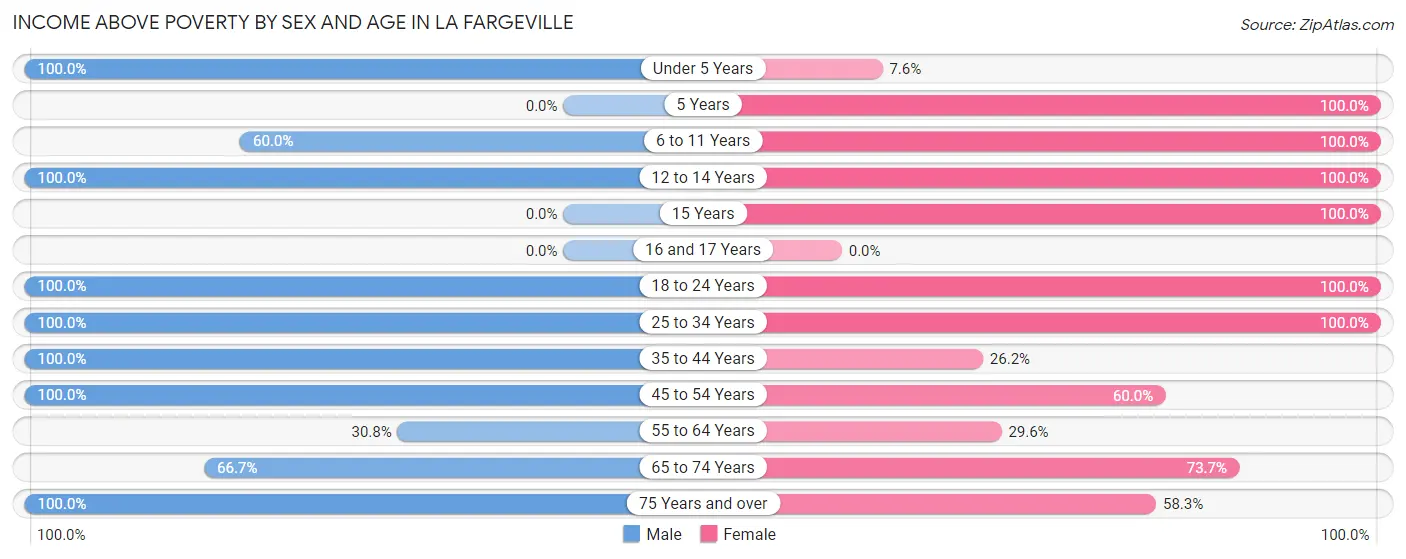
| Age Bracket | Male | Female |
| Under 5 Years | 4 (100.0%) | 4 (7.5%) |
| 5 Years | 0 (0.0%) | 5 (100.0%) |
| 6 to 11 Years | 12 (60.0%) | 44 (100.0%) |
| 12 to 14 Years | 13 (100.0%) | 7 (100.0%) |
| 15 Years | 0 (0.0%) | 1 (100.0%) |
| 16 and 17 Years | 0 (0.0%) | 0 (0.0%) |
| 18 to 24 Years | 8 (100.0%) | 15 (100.0%) |
| 25 to 34 Years | 26 (100.0%) | 6 (100.0%) |
| 35 to 44 Years | 33 (100.0%) | 22 (26.2%) |
| 45 to 54 Years | 21 (100.0%) | 15 (60.0%) |
| 55 to 64 Years | 4 (30.8%) | 8 (29.6%) |
| 65 to 74 Years | 4 (66.7%) | 14 (73.7%) |
| 75 Years and over | 13 (100.0%) | 7 (58.3%) |
| Total | 138 (61.9%) | 148 (48.2%) |
Income Below Poverty Among Married-Couple Families in La Fargeville
The poverty statistics for married-couple families in La Fargeville show that 13.7% or 10 of the total 73 families live below the poverty line. Families with no children have the highest poverty rate of 21.3%, comprising of 10 families. On the other hand, families with 1 or 2 children have the lowest poverty rate of 0.0%, which includes 0 families.
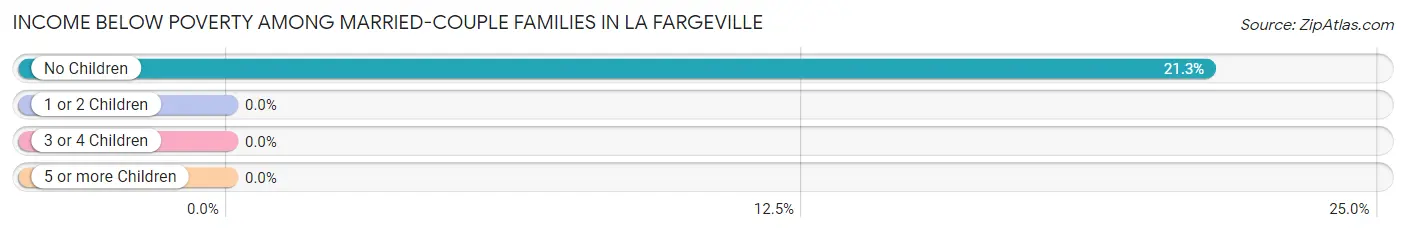
| Children | Above Poverty | Below Poverty |
| No Children | 37 (78.7%) | 10 (21.3%) |
| 1 or 2 Children | 11 (100.0%) | 0 (0.0%) |
| 3 or 4 Children | 15 (100.0%) | 0 (0.0%) |
| 5 or more Children | 0 (0.0%) | 0 (0.0%) |
| Total | 63 (86.3%) | 10 (13.7%) |
Income Below Poverty Among Single-Parent Households in La Fargeville
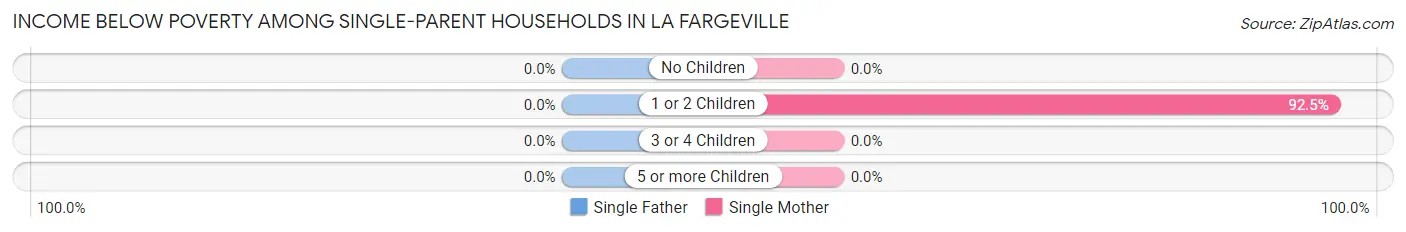
| Children | Single Father | Single Mother |
| No Children | 0 (0.0%) | 0 (0.0%) |
| 1 or 2 Children | 0 (0.0%) | 62 (92.5%) |
| 3 or 4 Children | 0 (0.0%) | 0 (0.0%) |
| 5 or more Children | 0 (0.0%) | 0 (0.0%) |
| Total | 0 (0.0%) | 62 (86.1%) |
Income Below Poverty Among Married-Couple vs Single-Parent Households in La Fargeville
The poverty data for La Fargeville shows that 10 of the married-couple family households (13.7%) and 62 of the single-parent households (86.1%) are living below the poverty level. Within the married-couple family households, those with no children have the highest poverty rate, with 10 households (21.3%) falling below the poverty line. Among the single-parent households, those with 1 or 2 children have the highest poverty rate, with 62 household (92.5%) living below poverty.
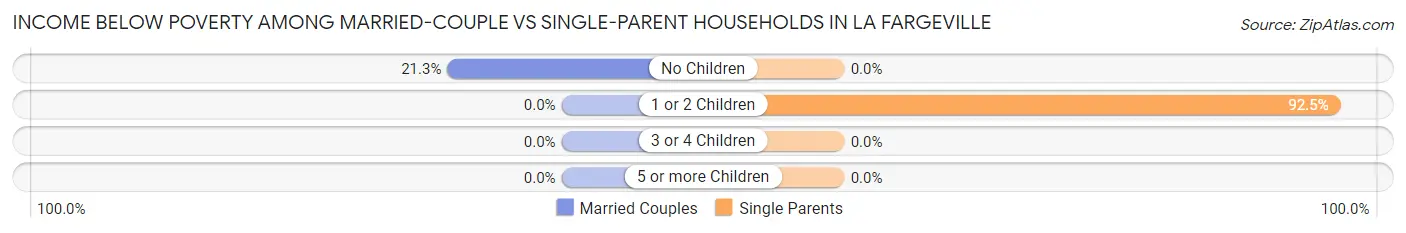
| Children | Married-Couple Families | Single-Parent Households |
| No Children | 10 (21.3%) | 0 (0.0%) |
| 1 or 2 Children | 0 (0.0%) | 62 (92.5%) |
| 3 or 4 Children | 0 (0.0%) | 0 (0.0%) |
| 5 or more Children | 0 (0.0%) | 0 (0.0%) |
| Total | 10 (13.7%) | 62 (86.1%) |
Race in La Fargeville
The most populous races in La Fargeville are White / Caucasian (411 | 77.5%), Black / African American (115 | 21.7%), and Hispanic or Latino (12 | 2.3%).
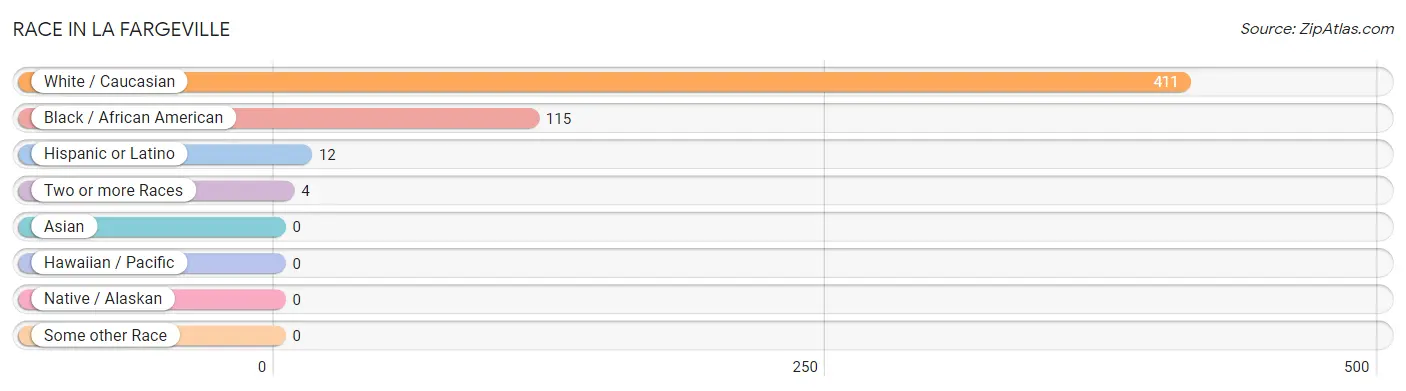
| Race | # Population | % Population |
| Asian | 0 | 0.0% |
| Black / African American | 115 | 21.7% |
| Hawaiian / Pacific | 0 | 0.0% |
| Hispanic or Latino | 12 | 2.3% |
| Native / Alaskan | 0 | 0.0% |
| White / Caucasian | 411 | 77.5% |
| Two or more Races | 4 | 0.7% |
| Some other Race | 0 | 0.0% |
| Total | 530 | 100.0% |
Ancestry in La Fargeville
The most populous ancestries reported in La Fargeville are English (115 | 21.7%), German (105 | 19.8%), Irish (89 | 16.8%), Italian (31 | 5.9%), and French Canadian (25 | 4.7%), together accounting for 68.9% of all La Fargeville residents.
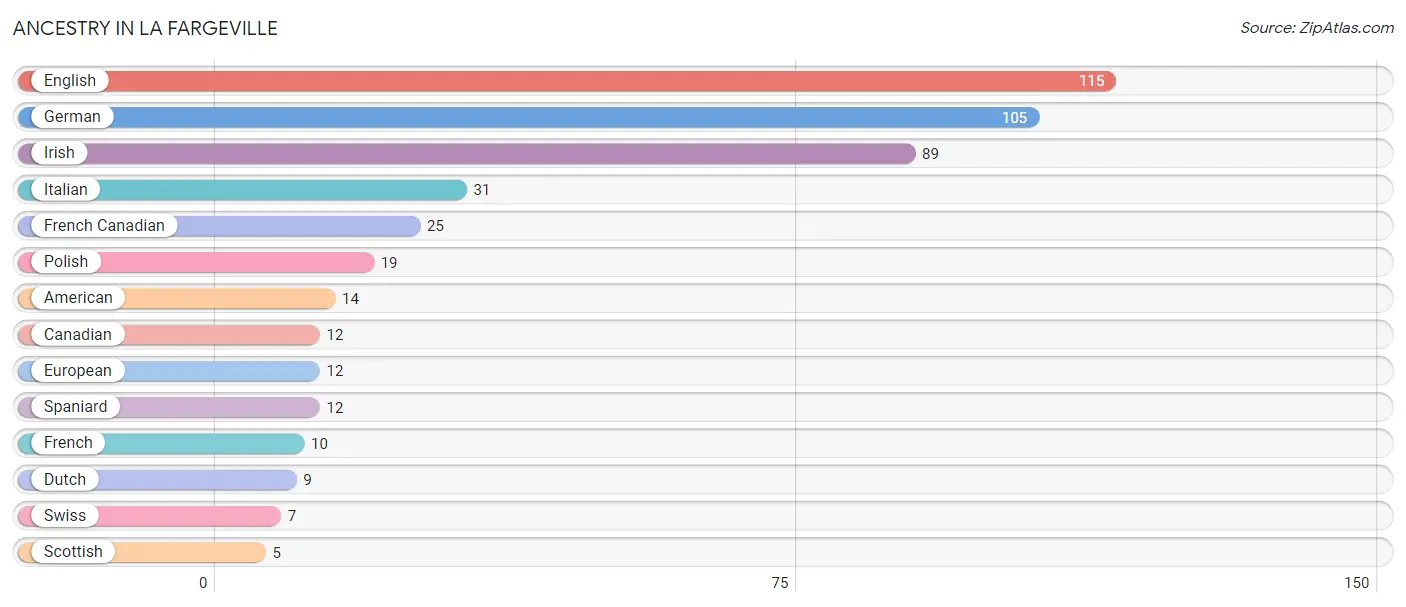
| Ancestry | # Population | % Population |
| American | 14 | 2.6% |
| Canadian | 12 | 2.3% |
| Dutch | 9 | 1.7% |
| English | 115 | 21.7% |
| European | 12 | 2.3% |
| French | 10 | 1.9% |
| French Canadian | 25 | 4.7% |
| German | 105 | 19.8% |
| Irish | 89 | 16.8% |
| Italian | 31 | 5.9% |
| Polish | 19 | 3.6% |
| Scottish | 5 | 0.9% |
| Spaniard | 12 | 2.3% |
| Swiss | 7 | 1.3% | View All 14 Rows |
Immigrants in La Fargeville

| Immigration Origin | # Population | % Population | View All 0 Rows |
Sex and Age in La Fargeville
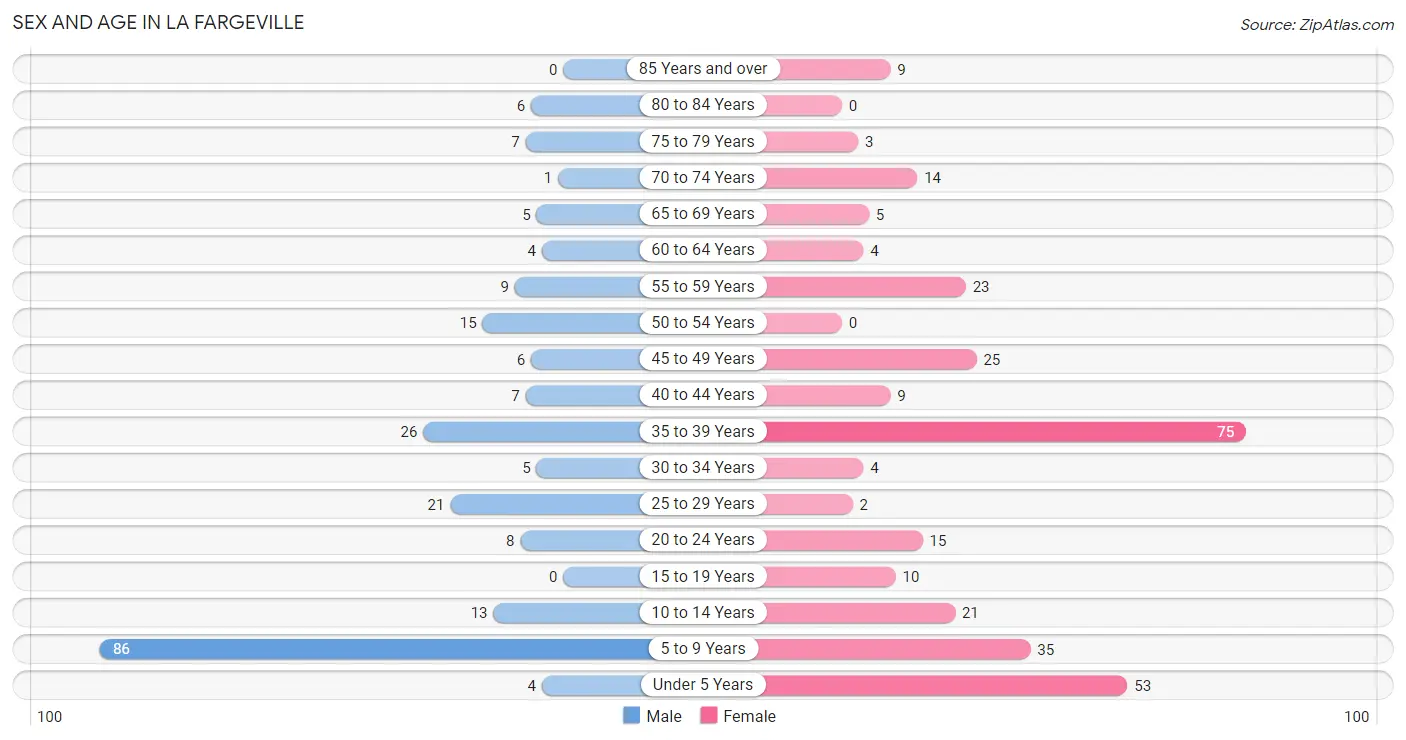
Sex and Age in La Fargeville
The most populous age groups in La Fargeville are 5 to 9 Years (86 | 38.6%) for men and 35 to 39 Years (75 | 24.4%) for women.
| Age Bracket | Male | Female |
| Under 5 Years | 4 (1.8%) | 53 (17.3%) |
| 5 to 9 Years | 86 (38.6%) | 35 (11.4%) |
| 10 to 14 Years | 13 (5.8%) | 21 (6.8%) |
| 15 to 19 Years | 0 (0.0%) | 10 (3.3%) |
| 20 to 24 Years | 8 (3.6%) | 15 (4.9%) |
| 25 to 29 Years | 21 (9.4%) | 2 (0.6%) |
| 30 to 34 Years | 5 (2.2%) | 4 (1.3%) |
| 35 to 39 Years | 26 (11.7%) | 75 (24.4%) |
| 40 to 44 Years | 7 (3.1%) | 9 (2.9%) |
| 45 to 49 Years | 6 (2.7%) | 25 (8.1%) |
| 50 to 54 Years | 15 (6.7%) | 0 (0.0%) |
| 55 to 59 Years | 9 (4.0%) | 23 (7.5%) |
| 60 to 64 Years | 4 (1.8%) | 4 (1.3%) |
| 65 to 69 Years | 5 (2.2%) | 5 (1.6%) |
| 70 to 74 Years | 1 (0.4%) | 14 (4.6%) |
| 75 to 79 Years | 7 (3.1%) | 3 (1.0%) |
| 80 to 84 Years | 6 (2.7%) | 0 (0.0%) |
| 85 Years and over | 0 (0.0%) | 9 (2.9%) |
| Total | 223 (100.0%) | 307 (100.0%) |
Families and Households in La Fargeville
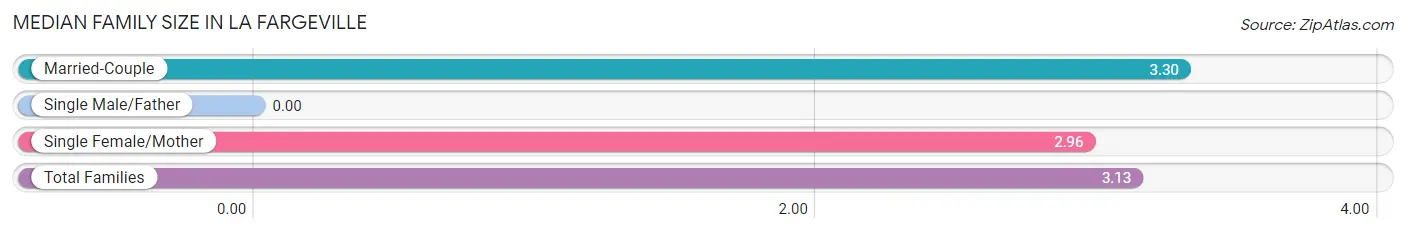
Median Family Size in La Fargeville
| Family Type | # Families | Family Size |
| Married-Couple | 73 (50.3%) | 3.30 |
| Single Male/Father | 0 (0.0%) | - |
| Single Female/Mother | 72 (49.7%) | 2.96 |
| Total Families | 145 (100.0%) | 3.13 |
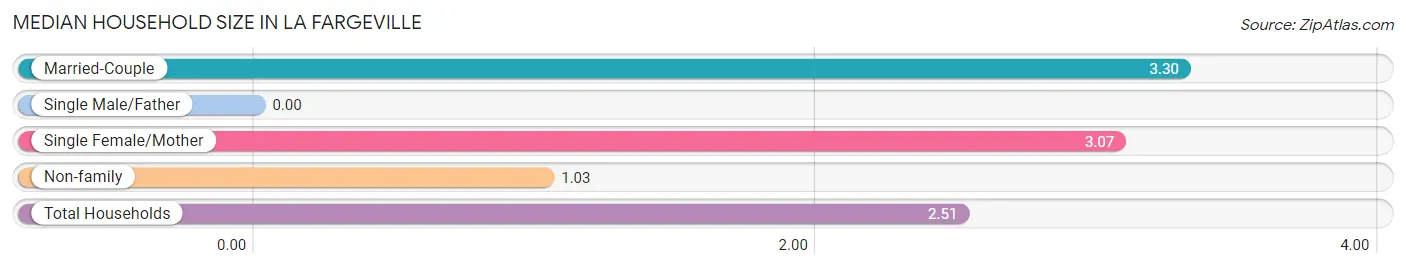
Median Household Size in La Fargeville
| Household Type | # Households | Household Size |
| Married-Couple | 73 (34.6%) | 3.30 |
| Single Male/Father | 0 (0.0%) | - |
| Single Female/Mother | 72 (34.1%) | 3.07 |
| Non-family | 66 (31.3%) | 1.03 |
| Total Households | 211 (100.0%) | 2.51 |
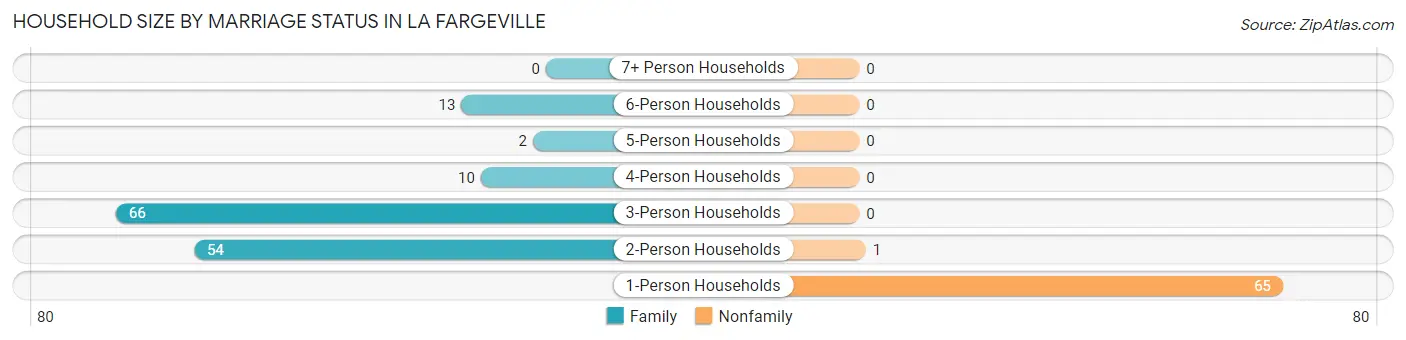
Household Size by Marriage Status in La Fargeville
Out of a total of 211 households in La Fargeville, 145 (68.7%) are family households, while 66 (31.3%) are nonfamily households. The most numerous type of family households are 3-person households, comprising 66, and the most common type of nonfamily households are 1-person households, comprising 65.
| Household Size | Family Households | Nonfamily Households |
| 1-Person Households | - | 65 (30.8%) |
| 2-Person Households | 54 (25.6%) | 1 (0.5%) |
| 3-Person Households | 66 (31.3%) | 0 (0.0%) |
| 4-Person Households | 10 (4.7%) | 0 (0.0%) |
| 5-Person Households | 2 (0.9%) | 0 (0.0%) |
| 6-Person Households | 13 (6.2%) | 0 (0.0%) |
| 7+ Person Households | 0 (0.0%) | 0 (0.0%) |
| Total | 145 (68.7%) | 66 (31.3%) |
Female Fertility in La Fargeville
Fertility by Age in La Fargeville
Average fertility rate in La Fargeville is 14.0 births per 1,000 women. Women in the age bracket of 20 to 34 years have the highest fertility rate with 95.0 births per 1,000 women. Women in the age bracket of 20 to 34 years acount for 100.0% of all women with births.
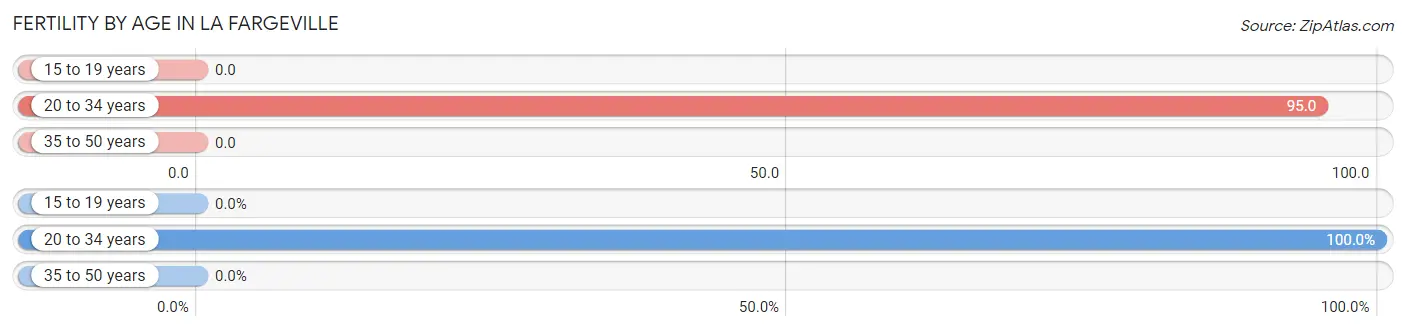
| Age Bracket | Women with Births | Births / 1,000 Women |
| 15 to 19 years | 0 (0.0%) | 0.0 |
| 20 to 34 years | 2 (100.0%) | 95.0 |
| 35 to 50 years | 0 (0.0%) | 0.0 |
| Total | 2 (100.0%) | 14.0 |
Fertility by Age by Marriage Status in La Fargeville
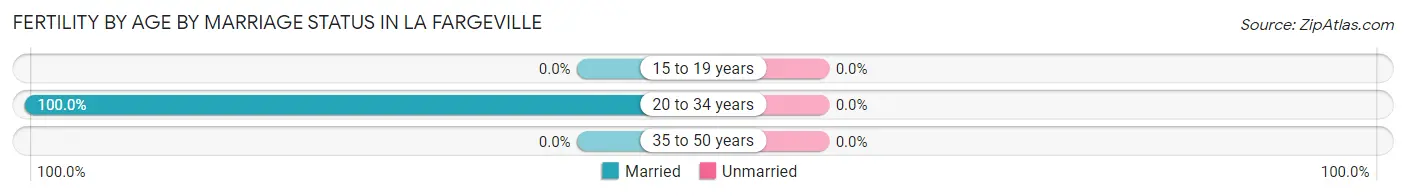
| Age Bracket | Married | Unmarried |
| 15 to 19 years | 0 (0.0%) | 0 (0.0%) |
| 20 to 34 years | 2 (100.0%) | 0 (0.0%) |
| 35 to 50 years | 0 (0.0%) | 0 (0.0%) |
| Total | 2 (100.0%) | 0 (0.0%) |
Fertility by Education in La Fargeville
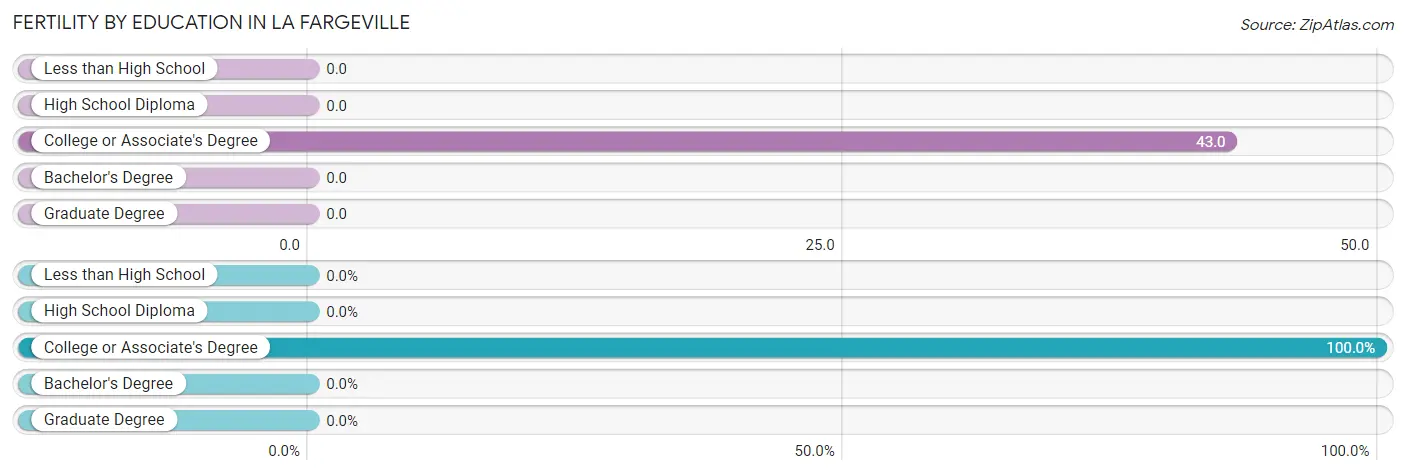
| Educational Attainment | Women with Births | Births / 1,000 Women |
| Less than High School | 0 (0.0%) | 0.0 |
| High School Diploma | 0 (0.0%) | 0.0 |
| College or Associate's Degree | 2 (100.0%) | 43.0 |
| Bachelor's Degree | 0 (0.0%) | 0.0 |
| Graduate Degree | 0 (0.0%) | 0.0 |
| Total | 2 (100.0%) | 14.0 |
Fertility by Education by Marriage Status in La Fargeville
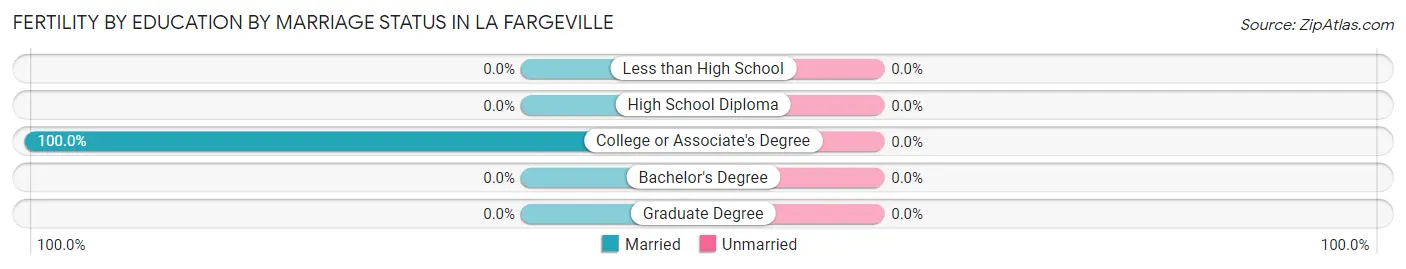
| Educational Attainment | Married | Unmarried |
| Less than High School | 0 (0.0%) | 0 (0.0%) |
| High School Diploma | 0 (0.0%) | 0 (0.0%) |
| College or Associate's Degree | 2 (100.0%) | 0 (0.0%) |
| Bachelor's Degree | 0 (0.0%) | 0 (0.0%) |
| Graduate Degree | 0 (0.0%) | 0 (0.0%) |
| Total | 2 (100.0%) | 0 (0.0%) |
Employment Characteristics in La Fargeville
Employment by Class of Employer in La Fargeville
Among the 206 employed individuals in La Fargeville, private company employees (125 | 60.7%), self-employed (not incorporated) (27 | 13.1%), and federal government employees (25 | 12.1%) make up the most common classes of employment.
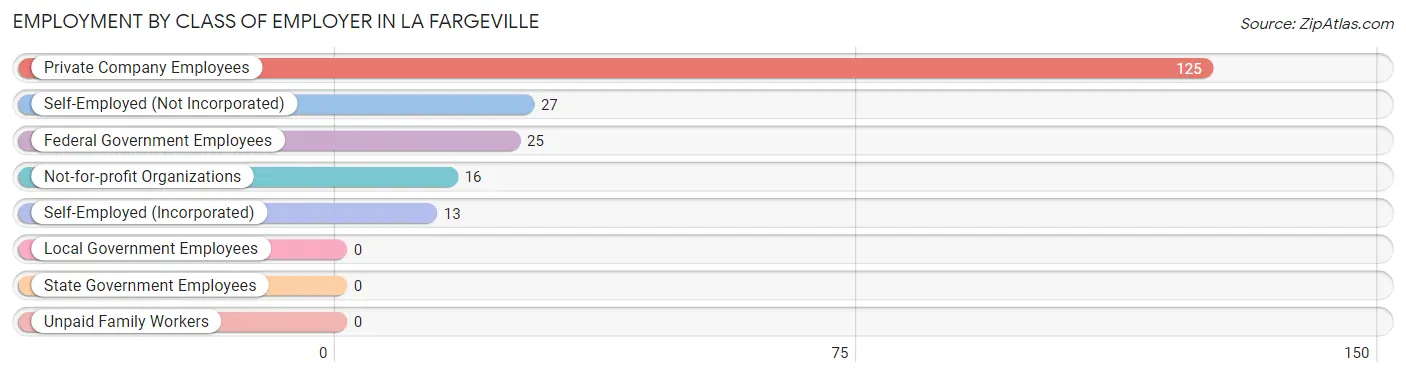
| Employer Class | # Employees | % Employees |
| Private Company Employees | 125 | 60.7% |
| Self-Employed (Incorporated) | 13 | 6.3% |
| Self-Employed (Not Incorporated) | 27 | 13.1% |
| Not-for-profit Organizations | 16 | 7.8% |
| Local Government Employees | 0 | 0.0% |
| State Government Employees | 0 | 0.0% |
| Federal Government Employees | 25 | 12.1% |
| Unpaid Family Workers | 0 | 0.0% |
| Total | 206 | 100.0% |
Employment Status by Age in La Fargeville
According to the labor force statistics for La Fargeville, out of the total population over 16 years of age (317), 68.8% or 218 individuals are in the labor force, with 5.9% or 13 of them unemployed. The age group with the highest labor force participation rate is 16 to 19 years, with 100.0% or 9 individuals in the labor force. Within the labor force, the 55 to 59 years age range has the highest percentage of unemployed individuals, with 17.4% or 4 of them being unemployed.
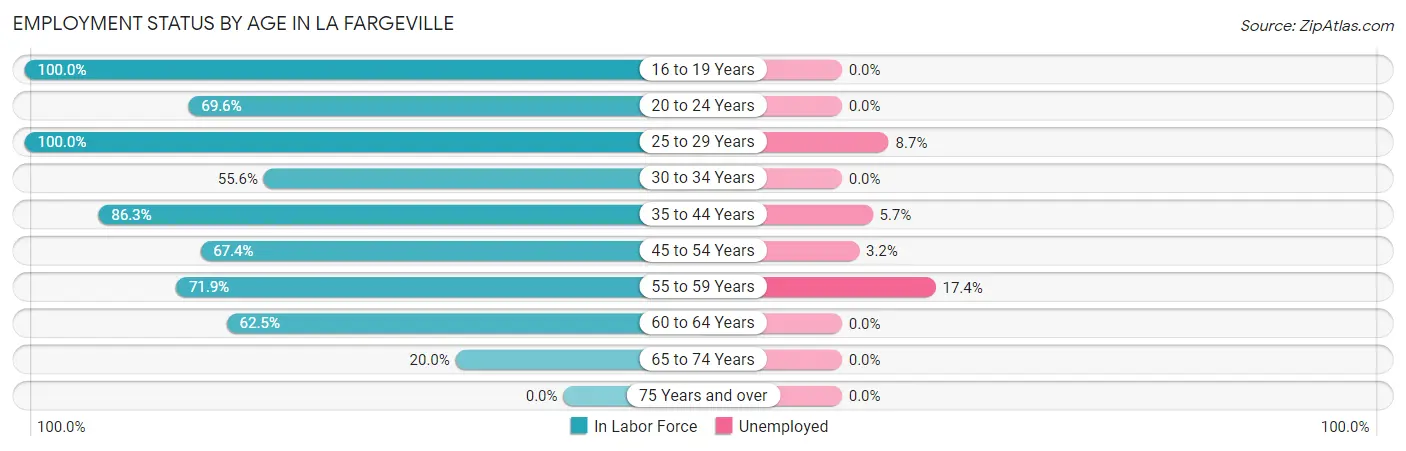
| Age Bracket | In Labor Force | Unemployed |
| 16 to 19 Years | 9 (100.0%) | 0 (0.0%) |
| 20 to 24 Years | 16 (69.6%) | 0 (0.0%) |
| 25 to 29 Years | 23 (100.0%) | 2 (8.7%) |
| 30 to 34 Years | 5 (55.6%) | 0 (0.0%) |
| 35 to 44 Years | 101 (86.3%) | 6 (5.7%) |
| 45 to 54 Years | 31 (67.4%) | 1 (3.2%) |
| 55 to 59 Years | 23 (71.9%) | 4 (17.4%) |
| 60 to 64 Years | 5 (62.5%) | 0 (0.0%) |
| 65 to 74 Years | 5 (20.0%) | 0 (0.0%) |
| 75 Years and over | 0 (0.0%) | 0 (0.0%) |
| Total | 218 (68.8%) | 13 (5.9%) |
Employment Status by Educational Attainment in La Fargeville
According to labor force statistics for La Fargeville, 80.0% of individuals (188) out of the total population between 25 and 64 years of age (235) are in the labor force, with 6.9% or 13 of them being unemployed. The group with the highest labor force participation rate are those with the educational attainment of bachelor's degree or higher, with 87.5% or 28 individuals in the labor force. Within the labor force, individuals with college / associate degree education have the highest percentage of unemployment, with 15.2% or 7 of them being unemployed.
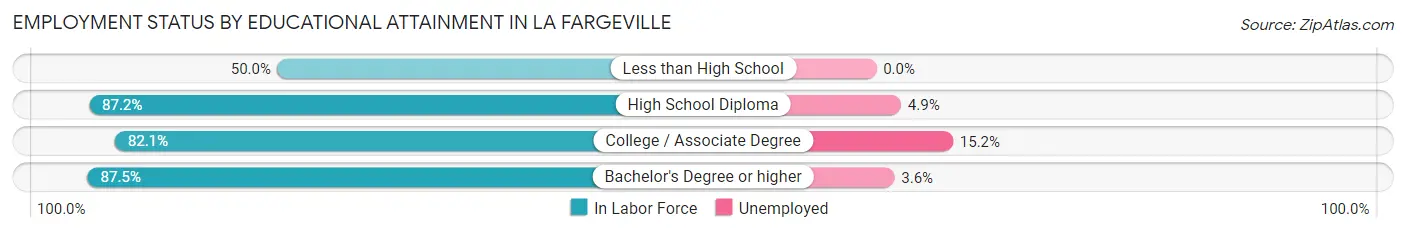
| Educational Attainment | In Labor Force | Unemployed |
| Less than High School | 19 (50.0%) | 0 (0.0%) |
| High School Diploma | 95 (87.2%) | 5 (4.9%) |
| College / Associate Degree | 46 (82.1%) | 9 (15.2%) |
| Bachelor's Degree or higher | 28 (87.5%) | 1 (3.6%) |
| Total | 188 (80.0%) | 16 (6.9%) |
Employment Occupations by Sex in La Fargeville
Management, Business, Science and Arts Occupations
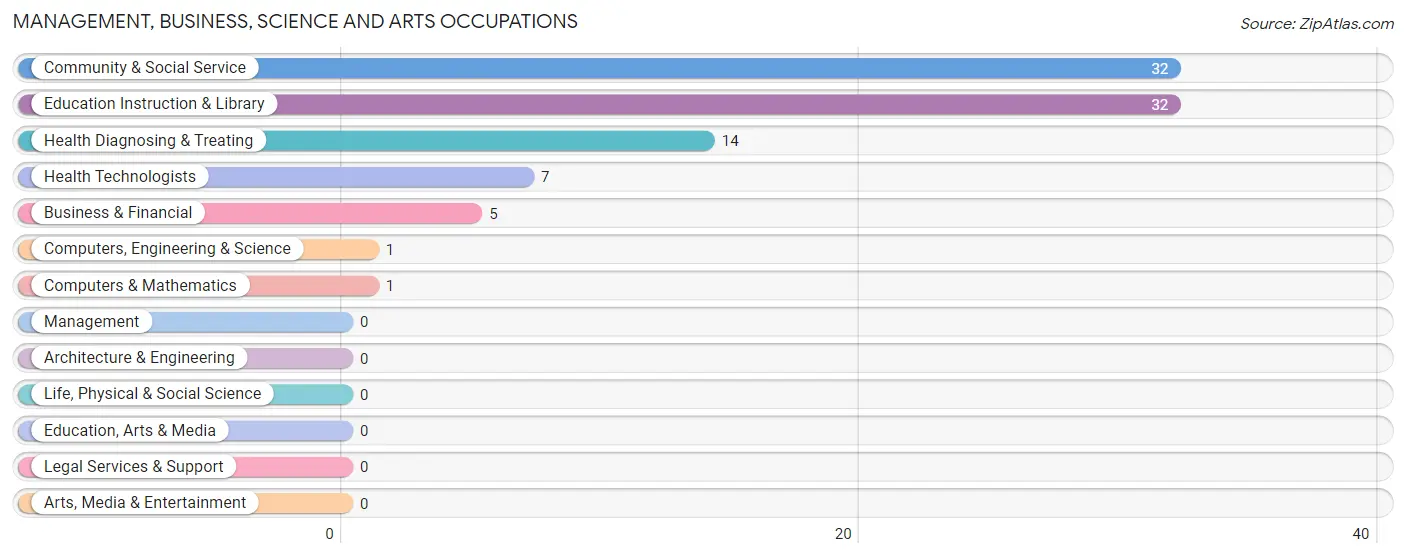
The most common Management, Business, Science and Arts occupations in La Fargeville are Community & Social Service (32 | 16.6%), Education Instruction & Library (32 | 16.6%), Health Diagnosing & Treating (14 | 7.2%), Health Technologists (7 | 3.6%), and Business & Financial (5 | 2.6%).
Management, Business, Science and Arts Occupations by Sex
Within the Management, Business, Science and Arts occupations in La Fargeville, the most male-oriented occupations are Business & Financial (100.0%), Computers, Engineering & Science (100.0%), and Computers & Mathematics (100.0%), while the most female-oriented occupations are Community & Social Service (100.0%), Education Instruction & Library (100.0%), and Health Diagnosing & Treating (50.0%).
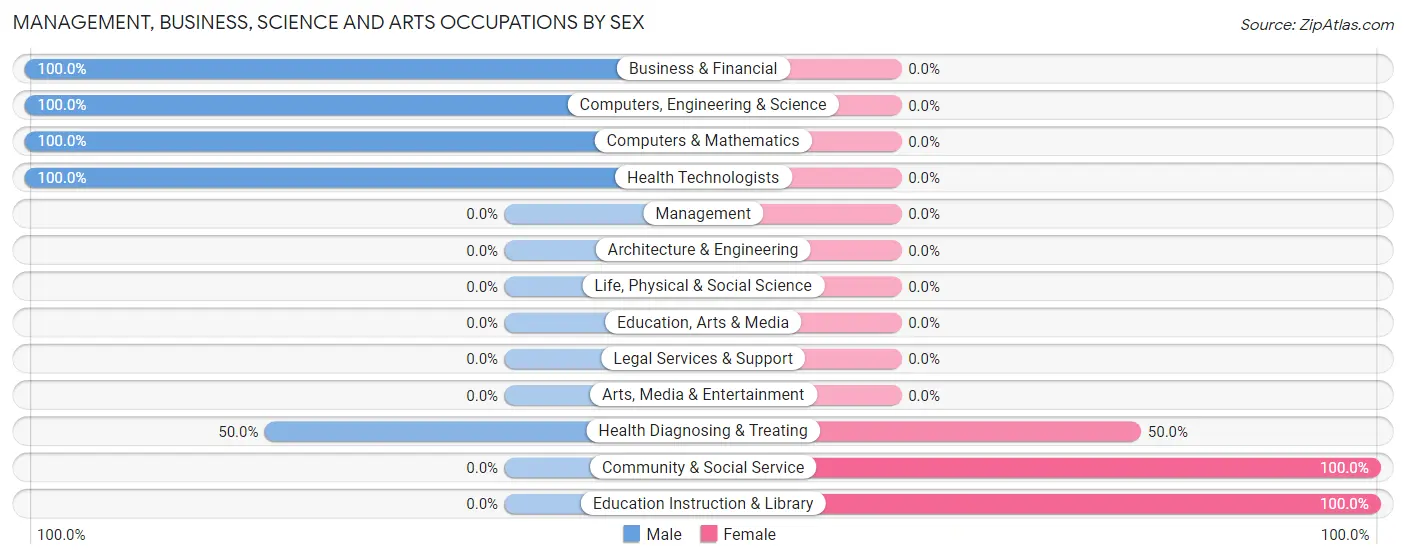
| Occupation | Male | Female |
| Management | 0 (0.0%) | 0 (0.0%) |
| Business & Financial | 5 (100.0%) | 0 (0.0%) |
| Computers, Engineering & Science | 1 (100.0%) | 0 (0.0%) |
| Computers & Mathematics | 1 (100.0%) | 0 (0.0%) |
| Architecture & Engineering | 0 (0.0%) | 0 (0.0%) |
| Life, Physical & Social Science | 0 (0.0%) | 0 (0.0%) |
| Community & Social Service | 0 (0.0%) | 32 (100.0%) |
| Education, Arts & Media | 0 (0.0%) | 0 (0.0%) |
| Legal Services & Support | 0 (0.0%) | 0 (0.0%) |
| Education Instruction & Library | 0 (0.0%) | 32 (100.0%) |
| Arts, Media & Entertainment | 0 (0.0%) | 0 (0.0%) |
| Health Diagnosing & Treating | 7 (50.0%) | 7 (50.0%) |
| Health Technologists | 7 (100.0%) | 0 (0.0%) |
| Total (Category) | 13 (25.0%) | 39 (75.0%) |
| Total (Overall) | 74 (38.3%) | 119 (61.7%) |
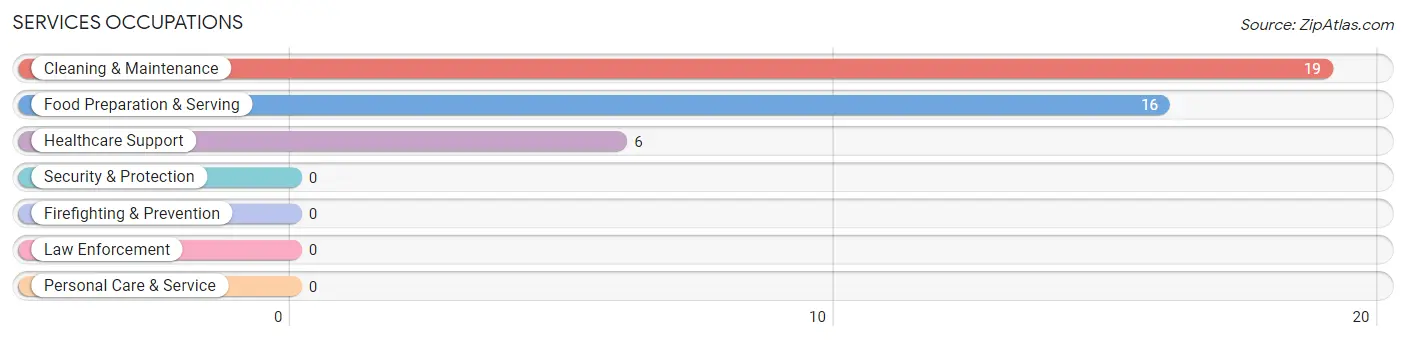
Services Occupations
The most common Services occupations in La Fargeville are Cleaning & Maintenance (19 | 9.8%), Food Preparation & Serving (16 | 8.3%), and Healthcare Support (6 | 3.1%).
Services Occupations by Sex
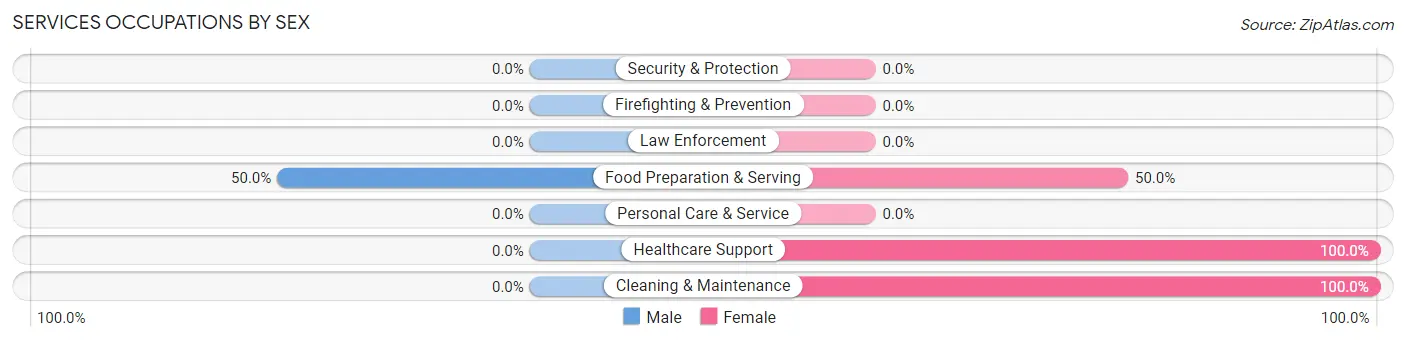
| Occupation | Male | Female |
| Healthcare Support | 0 (0.0%) | 6 (100.0%) |
| Security & Protection | 0 (0.0%) | 0 (0.0%) |
| Firefighting & Prevention | 0 (0.0%) | 0 (0.0%) |
| Law Enforcement | 0 (0.0%) | 0 (0.0%) |
| Food Preparation & Serving | 8 (50.0%) | 8 (50.0%) |
| Cleaning & Maintenance | 0 (0.0%) | 19 (100.0%) |
| Personal Care & Service | 0 (0.0%) | 0 (0.0%) |
| Total (Category) | 8 (19.5%) | 33 (80.5%) |
| Total (Overall) | 74 (38.3%) | 119 (61.7%) |
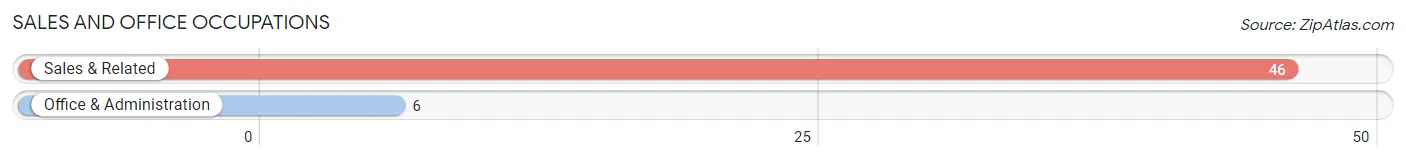
Sales and Office Occupations
The most common Sales and Office occupations in La Fargeville are Sales & Related (46 | 23.8%), and Office & Administration (6 | 3.1%).
Sales and Office Occupations by Sex
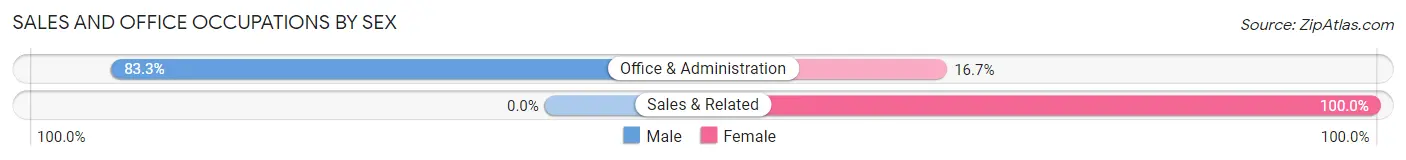
| Occupation | Male | Female |
| Sales & Related | 0 (0.0%) | 46 (100.0%) |
| Office & Administration | 5 (83.3%) | 1 (16.7%) |
| Total (Category) | 5 (9.6%) | 47 (90.4%) |
| Total (Overall) | 74 (38.3%) | 119 (61.7%) |
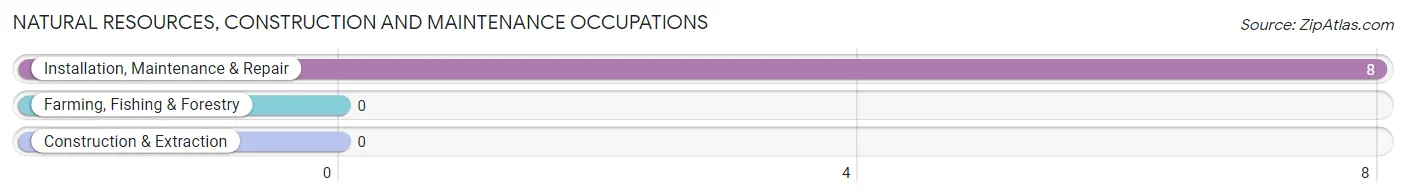
Natural Resources, Construction and Maintenance Occupations
The most common Natural Resources, Construction and Maintenance occupations in La Fargeville are , and Installation, Maintenance & Repair (8 | 4.2%).
Natural Resources, Construction and Maintenance Occupations by Sex
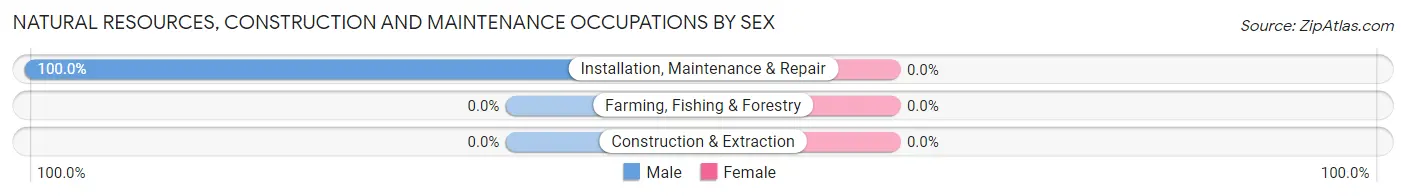
| Occupation | Male | Female |
| Farming, Fishing & Forestry | 0 (0.0%) | 0 (0.0%) |
| Construction & Extraction | 0 (0.0%) | 0 (0.0%) |
| Installation, Maintenance & Repair | 8 (100.0%) | 0 (0.0%) |
| Total (Category) | 8 (100.0%) | 0 (0.0%) |
| Total (Overall) | 74 (38.3%) | 119 (61.7%) |
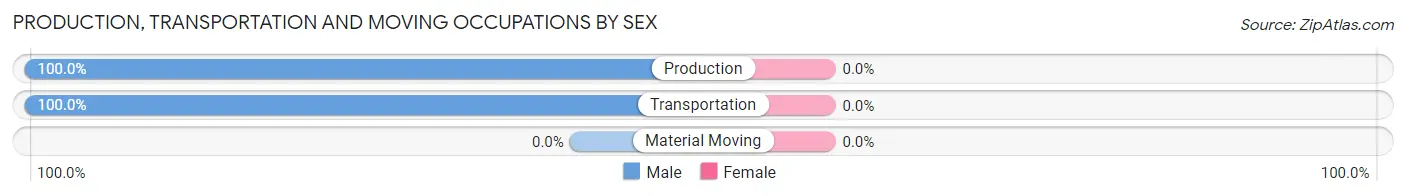
Production, Transportation and Moving Occupations
The most common Production, Transportation and Moving occupations in La Fargeville are Production (33 | 17.1%), and Transportation (7 | 3.6%).
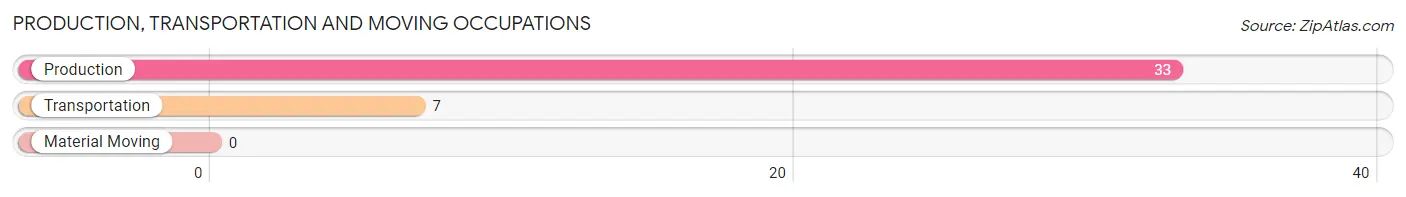
Production, Transportation and Moving Occupations by Sex
| Occupation | Male | Female |
| Production | 33 (100.0%) | 0 (0.0%) |
| Transportation | 7 (100.0%) | 0 (0.0%) |
| Material Moving | 0 (0.0%) | 0 (0.0%) |
| Total (Category) | 40 (100.0%) | 0 (0.0%) |
| Total (Overall) | 74 (38.3%) | 119 (61.7%) |
Employment Industries by Sex in La Fargeville
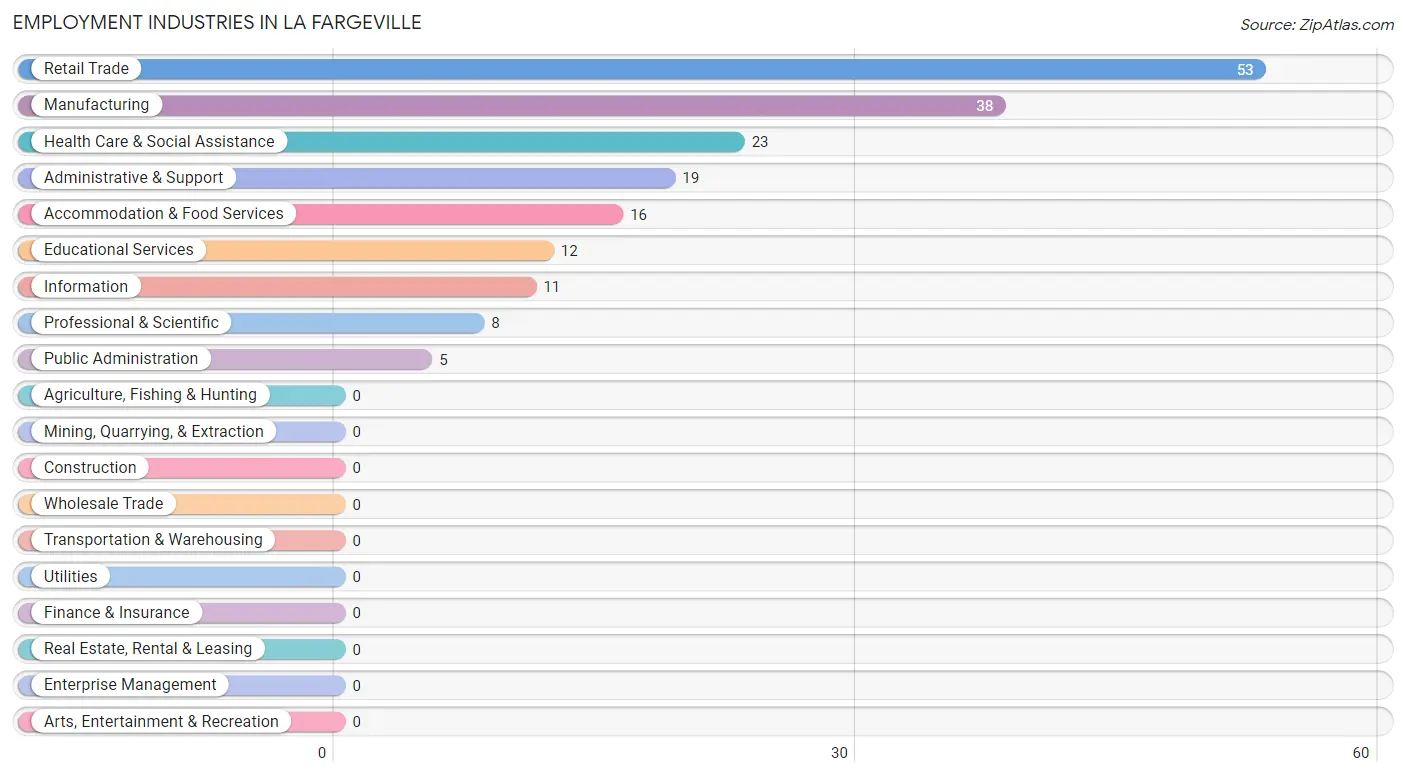
Employment Industries in La Fargeville
The major employment industries in La Fargeville include Retail Trade (53 | 27.5%), Manufacturing (38 | 19.7%), Health Care & Social Assistance (23 | 11.9%), Administrative & Support (19 | 9.8%), and Accommodation & Food Services (16 | 8.3%).
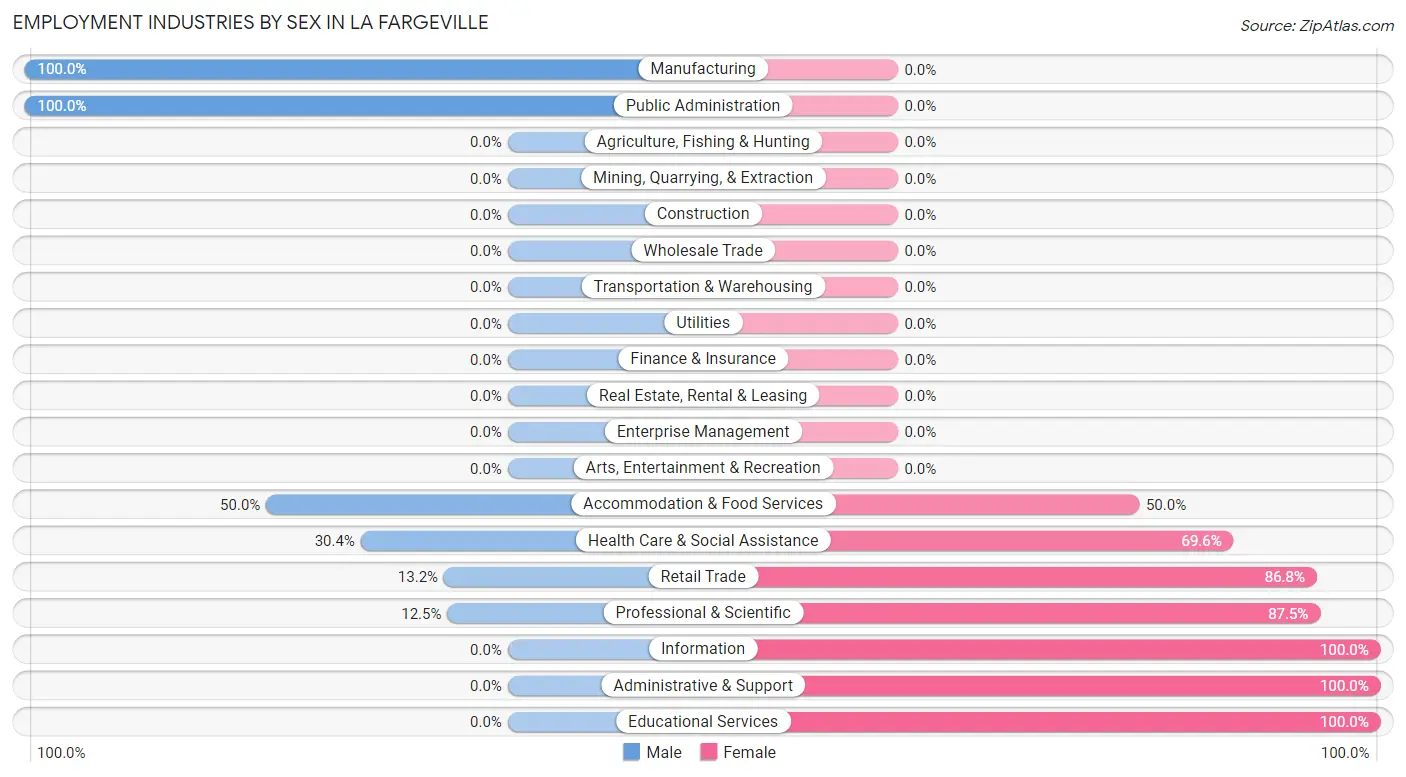
Employment Industries by Sex in La Fargeville
The La Fargeville industries that see more men than women are Manufacturing (100.0%), Public Administration (100.0%), and Accommodation & Food Services (50.0%), whereas the industries that tend to have a higher number of women are Information (100.0%), Administrative & Support (100.0%), and Educational Services (100.0%).
| Industry | Male | Female |
| Agriculture, Fishing & Hunting | 0 (0.0%) | 0 (0.0%) |
| Mining, Quarrying, & Extraction | 0 (0.0%) | 0 (0.0%) |
| Construction | 0 (0.0%) | 0 (0.0%) |
| Manufacturing | 38 (100.0%) | 0 (0.0%) |
| Wholesale Trade | 0 (0.0%) | 0 (0.0%) |
| Retail Trade | 7 (13.2%) | 46 (86.8%) |
| Transportation & Warehousing | 0 (0.0%) | 0 (0.0%) |
| Utilities | 0 (0.0%) | 0 (0.0%) |
| Information | 0 (0.0%) | 11 (100.0%) |
| Finance & Insurance | 0 (0.0%) | 0 (0.0%) |
| Real Estate, Rental & Leasing | 0 (0.0%) | 0 (0.0%) |
| Professional & Scientific | 1 (12.5%) | 7 (87.5%) |
| Enterprise Management | 0 (0.0%) | 0 (0.0%) |
| Administrative & Support | 0 (0.0%) | 19 (100.0%) |
| Educational Services | 0 (0.0%) | 12 (100.0%) |
| Health Care & Social Assistance | 7 (30.4%) | 16 (69.6%) |
| Arts, Entertainment & Recreation | 0 (0.0%) | 0 (0.0%) |
| Accommodation & Food Services | 8 (50.0%) | 8 (50.0%) |
| Public Administration | 5 (100.0%) | 0 (0.0%) |
| Total | 74 (38.3%) | 119 (61.7%) |
Education in La Fargeville
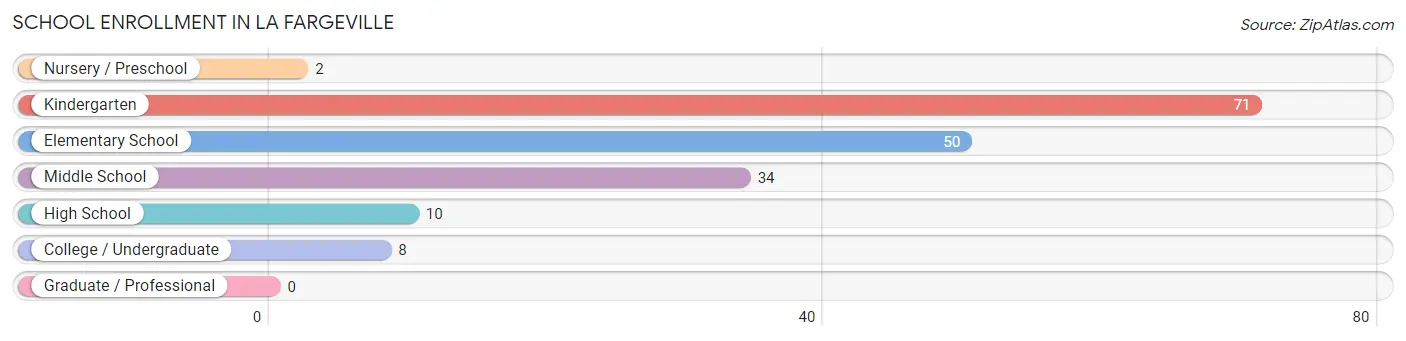
School Enrollment in La Fargeville
The most common levels of schooling among the 175 students in La Fargeville are kindergarten (71 | 40.6%), elementary school (50 | 28.6%), and middle school (34 | 19.4%).
| School Level | # Students | % Students |
| Nursery / Preschool | 2 | 1.1% |
| Kindergarten | 71 | 40.6% |
| Elementary School | 50 | 28.6% |
| Middle School | 34 | 19.4% |
| High School | 10 | 5.7% |
| College / Undergraduate | 8 | 4.6% |
| Graduate / Professional | 0 | 0.0% |
| Total | 175 | 100.0% |
School Enrollment by Age by Funding Source in La Fargeville
Out of a total of 175 students who are enrolled in schools in La Fargeville, 55 (31.4%) attend a private institution, while the remaining 120 (68.6%) are enrolled in public schools. The age group of 10 to 14 year olds has the highest likelihood of being enrolled in private schools, with 27 (79.4% in the age bracket) enrolled. Conversely, the age group of 3 to 4 year olds has the lowest likelihood of being enrolled in a private school, with 2 (100.0% in the age bracket) attending a public institution.
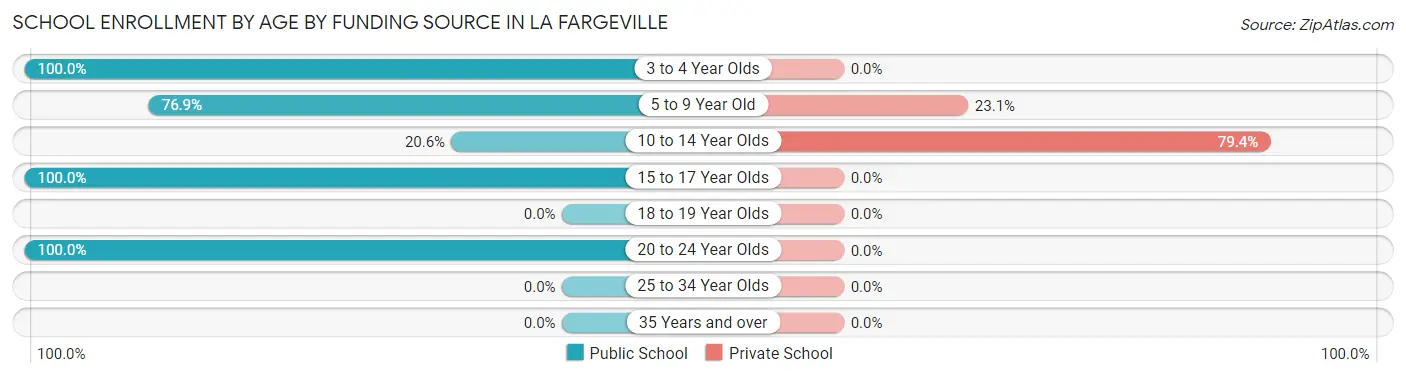
| Age Bracket | Public School | Private School |
| 3 to 4 Year Olds | 2 (100.0%) | 0 (0.0%) |
| 5 to 9 Year Old | 93 (76.9%) | 28 (23.1%) |
| 10 to 14 Year Olds | 7 (20.6%) | 27 (79.4%) |
| 15 to 17 Year Olds | 10 (100.0%) | 0 (0.0%) |
| 18 to 19 Year Olds | 0 (0.0%) | 0 (0.0%) |
| 20 to 24 Year Olds | 8 (100.0%) | 0 (0.0%) |
| 25 to 34 Year Olds | 0 (0.0%) | 0 (0.0%) |
| 35 Years and over | 0 (0.0%) | 0 (0.0%) |
| Total | 120 (68.6%) | 55 (31.4%) |
Educational Attainment by Field of Study in La Fargeville
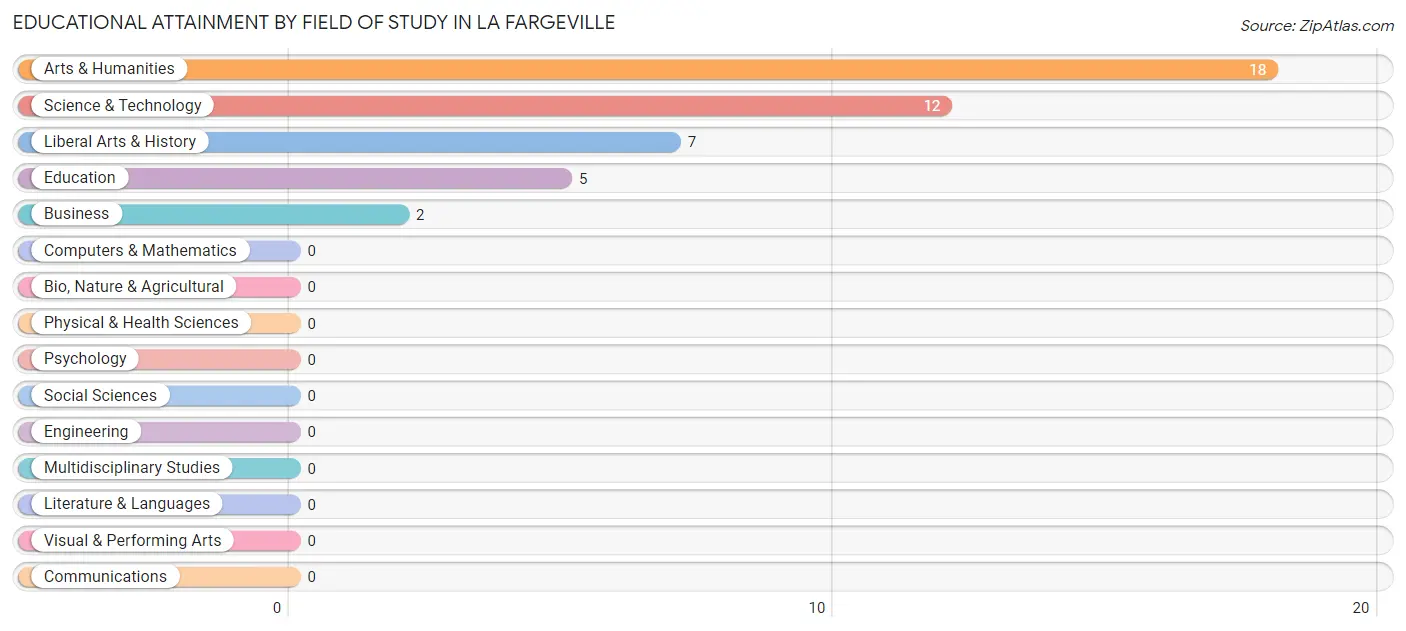
Arts & humanities (18 | 40.9%), science & technology (12 | 27.3%), liberal arts & history (7 | 15.9%), education (5 | 11.4%), and business (2 | 4.5%) are the most common fields of study among 44 individuals in La Fargeville who have obtained a bachelor's degree or higher.
| Field of Study | # Graduates | % Graduates |
| Computers & Mathematics | 0 | 0.0% |
| Bio, Nature & Agricultural | 0 | 0.0% |
| Physical & Health Sciences | 0 | 0.0% |
| Psychology | 0 | 0.0% |
| Social Sciences | 0 | 0.0% |
| Engineering | 0 | 0.0% |
| Multidisciplinary Studies | 0 | 0.0% |
| Science & Technology | 12 | 27.3% |
| Business | 2 | 4.5% |
| Education | 5 | 11.4% |
| Literature & Languages | 0 | 0.0% |
| Liberal Arts & History | 7 | 15.9% |
| Visual & Performing Arts | 0 | 0.0% |
| Communications | 0 | 0.0% |
| Arts & Humanities | 18 | 40.9% |
| Total | 44 | 100.0% |
Transportation & Commute in La Fargeville
Vehicle Availability by Sex in La Fargeville
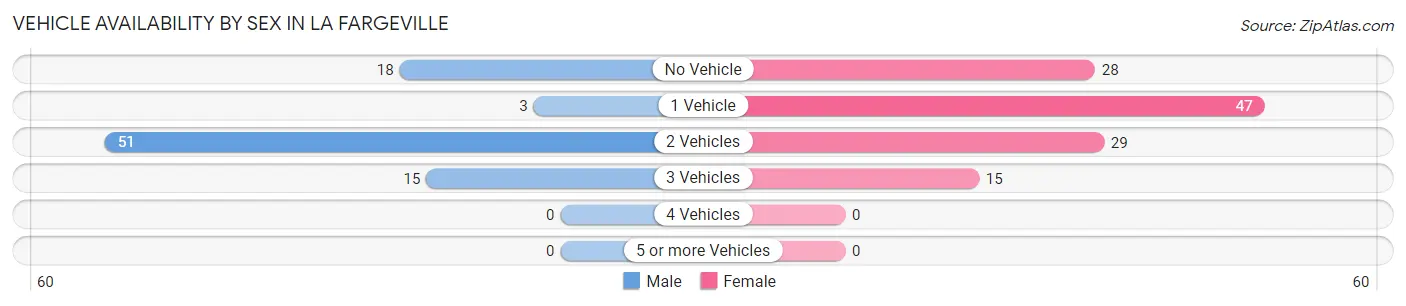
The most prevalent vehicle ownership categories in La Fargeville are males with 2 vehicles (51, accounting for 58.6%) and females with 2 vehicles (29, making up 42.9%).
| Vehicles Available | Male | Female |
| No Vehicle | 18 (20.7%) | 28 (23.5%) |
| 1 Vehicle | 3 (3.5%) | 47 (39.5%) |
| 2 Vehicles | 51 (58.6%) | 29 (24.4%) |
| 3 Vehicles | 15 (17.2%) | 15 (12.6%) |
| 4 Vehicles | 0 (0.0%) | 0 (0.0%) |
| 5 or more Vehicles | 0 (0.0%) | 0 (0.0%) |
| Total | 87 (100.0%) | 119 (100.0%) |
Commute Time in La Fargeville
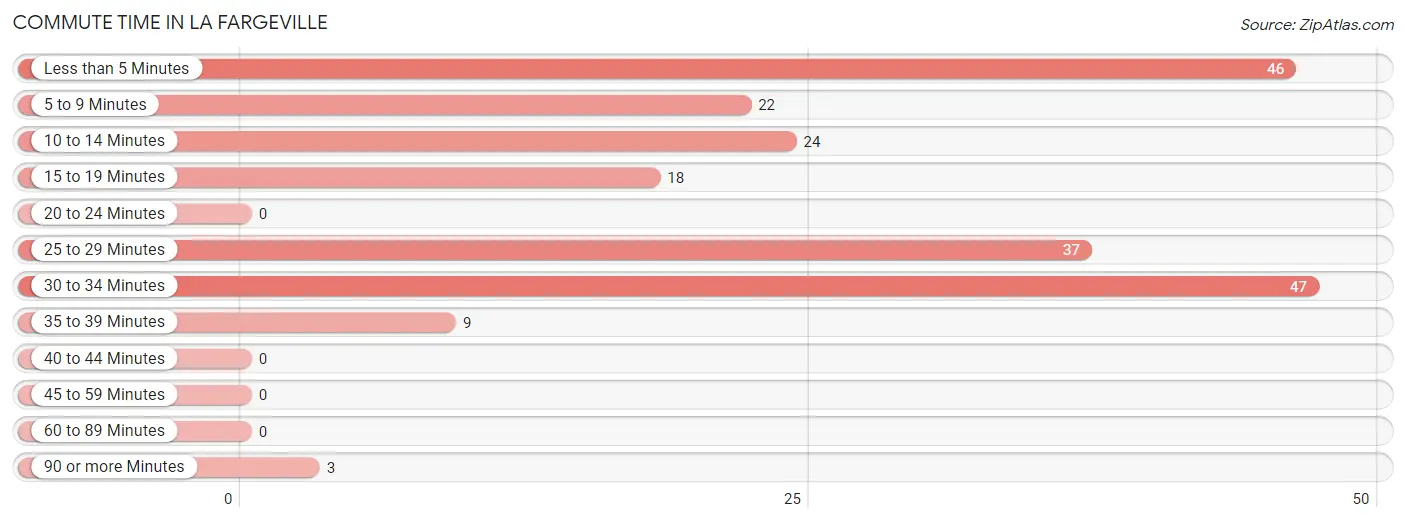
The most frequently occuring commute durations in La Fargeville are 30 to 34 minutes (47 commuters, 22.8%), less than 5 minutes (46 commuters, 22.3%), and 25 to 29 minutes (37 commuters, 18.0%).
| Commute Time | # Commuters | % Commuters |
| Less than 5 Minutes | 46 | 22.3% |
| 5 to 9 Minutes | 22 | 10.7% |
| 10 to 14 Minutes | 24 | 11.7% |
| 15 to 19 Minutes | 18 | 8.7% |
| 20 to 24 Minutes | 0 | 0.0% |
| 25 to 29 Minutes | 37 | 18.0% |
| 30 to 34 Minutes | 47 | 22.8% |
| 35 to 39 Minutes | 9 | 4.4% |
| 40 to 44 Minutes | 0 | 0.0% |
| 45 to 59 Minutes | 0 | 0.0% |
| 60 to 89 Minutes | 0 | 0.0% |
| 90 or more Minutes | 3 | 1.5% |
Commute Time by Sex in La Fargeville
The most common commute times in La Fargeville are 5 to 9 minutes (22 commuters, 25.3%) for males and less than 5 minutes (46 commuters, 38.7%) for females.
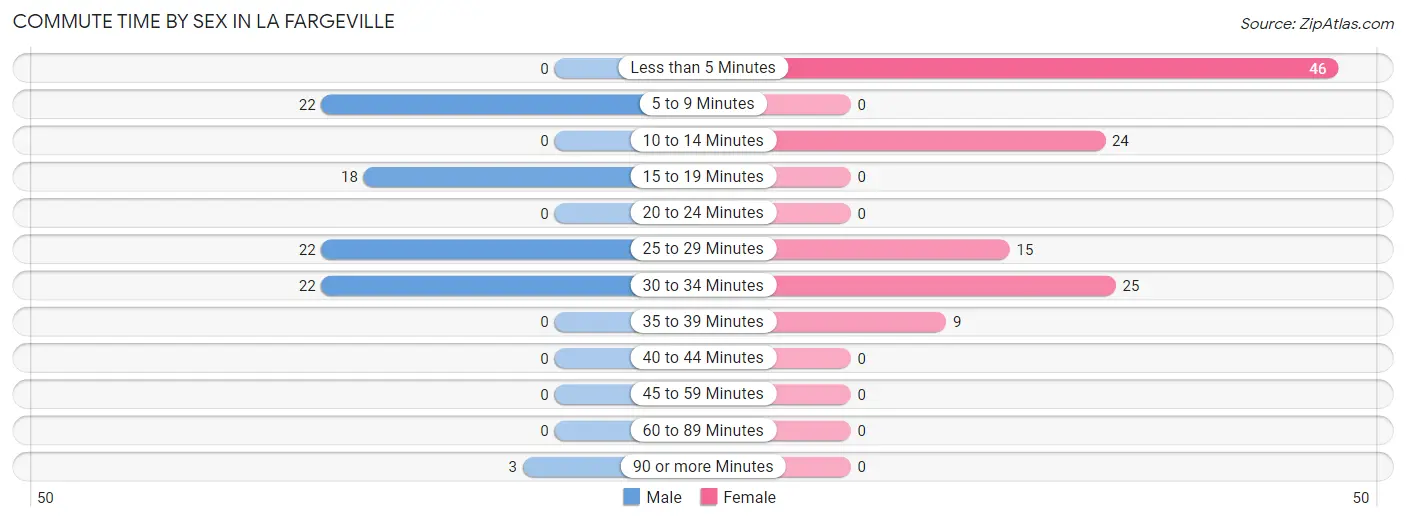
| Commute Time | Male | Female |
| Less than 5 Minutes | 0 (0.0%) | 46 (38.7%) |
| 5 to 9 Minutes | 22 (25.3%) | 0 (0.0%) |
| 10 to 14 Minutes | 0 (0.0%) | 24 (20.2%) |
| 15 to 19 Minutes | 18 (20.7%) | 0 (0.0%) |
| 20 to 24 Minutes | 0 (0.0%) | 0 (0.0%) |
| 25 to 29 Minutes | 22 (25.3%) | 15 (12.6%) |
| 30 to 34 Minutes | 22 (25.3%) | 25 (21.0%) |
| 35 to 39 Minutes | 0 (0.0%) | 9 (7.6%) |
| 40 to 44 Minutes | 0 (0.0%) | 0 (0.0%) |
| 45 to 59 Minutes | 0 (0.0%) | 0 (0.0%) |
| 60 to 89 Minutes | 0 (0.0%) | 0 (0.0%) |
| 90 or more Minutes | 3 (3.5%) | 0 (0.0%) |
Time of Departure to Work by Sex in La Fargeville
The most frequent times of departure to work in La Fargeville are 4:00 PM to 11:59 PM (23, 26.4%) for males and 6:00 AM to 6:29 AM (46, 38.7%) for females.
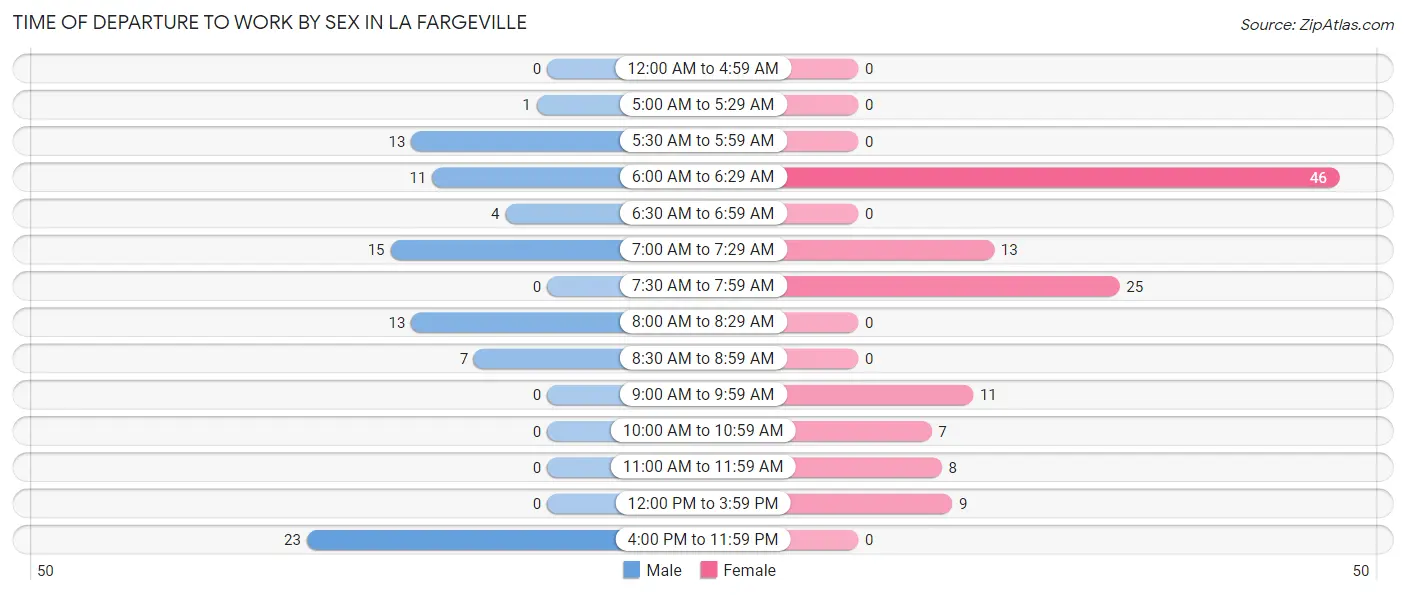
| Time of Departure | Male | Female |
| 12:00 AM to 4:59 AM | 0 (0.0%) | 0 (0.0%) |
| 5:00 AM to 5:29 AM | 1 (1.1%) | 0 (0.0%) |
| 5:30 AM to 5:59 AM | 13 (14.9%) | 0 (0.0%) |
| 6:00 AM to 6:29 AM | 11 (12.6%) | 46 (38.7%) |
| 6:30 AM to 6:59 AM | 4 (4.6%) | 0 (0.0%) |
| 7:00 AM to 7:29 AM | 15 (17.2%) | 13 (10.9%) |
| 7:30 AM to 7:59 AM | 0 (0.0%) | 25 (21.0%) |
| 8:00 AM to 8:29 AM | 13 (14.9%) | 0 (0.0%) |
| 8:30 AM to 8:59 AM | 7 (8.1%) | 0 (0.0%) |
| 9:00 AM to 9:59 AM | 0 (0.0%) | 11 (9.2%) |
| 10:00 AM to 10:59 AM | 0 (0.0%) | 7 (5.9%) |
| 11:00 AM to 11:59 AM | 0 (0.0%) | 8 (6.7%) |
| 12:00 PM to 3:59 PM | 0 (0.0%) | 9 (7.6%) |
| 4:00 PM to 11:59 PM | 23 (26.4%) | 0 (0.0%) |
| Total | 87 (100.0%) | 119 (100.0%) |
Housing Occupancy in La Fargeville
Occupancy by Ownership in La Fargeville
Of the total 211 dwellings in La Fargeville, owner-occupied units account for 82 (38.9%), while renter-occupied units make up 129 (61.1%).
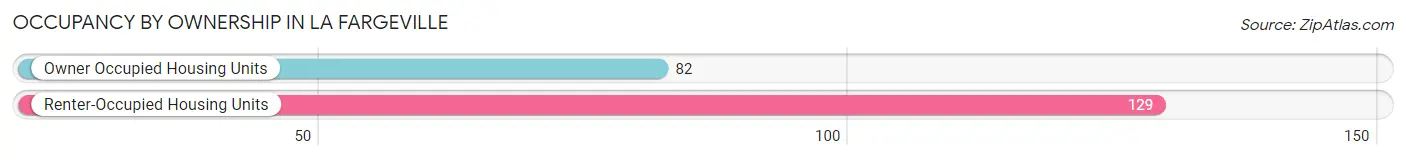
| Occupancy | # Housing Units | % Housing Units |
| Owner Occupied Housing Units | 82 | 38.9% |
| Renter-Occupied Housing Units | 129 | 61.1% |
| Total Occupied Housing Units | 211 | 100.0% |
Occupancy by Household Size in La Fargeville
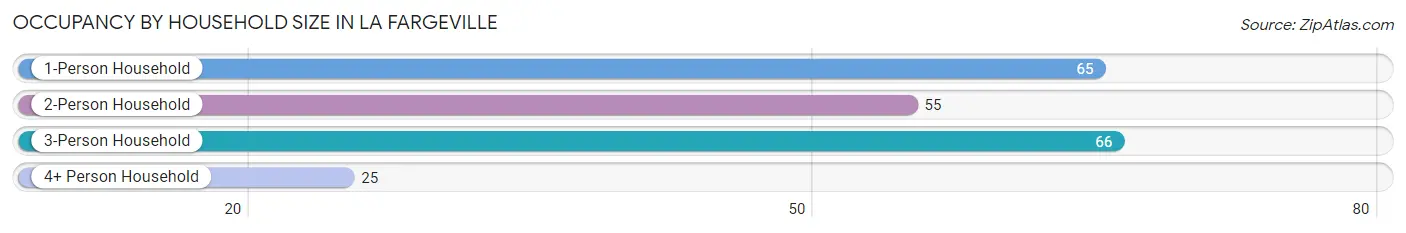
| Household Size | # Housing Units | % Housing Units |
| 1-Person Household | 65 | 30.8% |
| 2-Person Household | 55 | 26.1% |
| 3-Person Household | 66 | 31.3% |
| 4+ Person Household | 25 | 11.8% |
| Total Housing Units | 211 | 100.0% |
Occupancy by Ownership by Household Size in La Fargeville
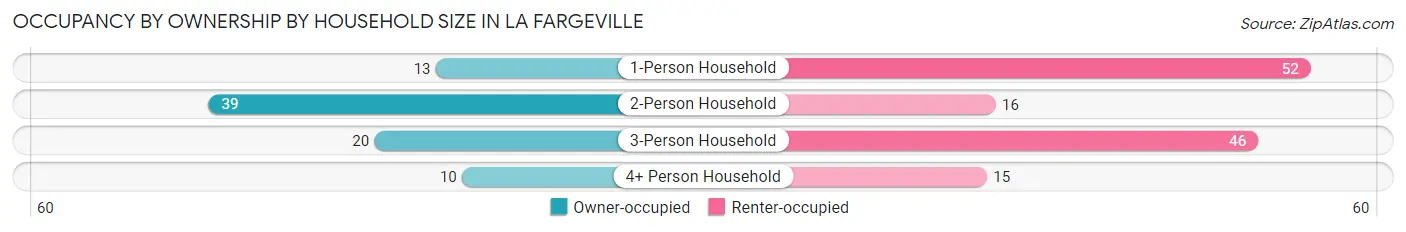
| Household Size | Owner-occupied | Renter-occupied |
| 1-Person Household | 13 (20.0%) | 52 (80.0%) |
| 2-Person Household | 39 (70.9%) | 16 (29.1%) |
| 3-Person Household | 20 (30.3%) | 46 (69.7%) |
| 4+ Person Household | 10 (40.0%) | 15 (60.0%) |
| Total Housing Units | 82 (38.9%) | 129 (61.1%) |
Occupancy by Educational Attainment in La Fargeville
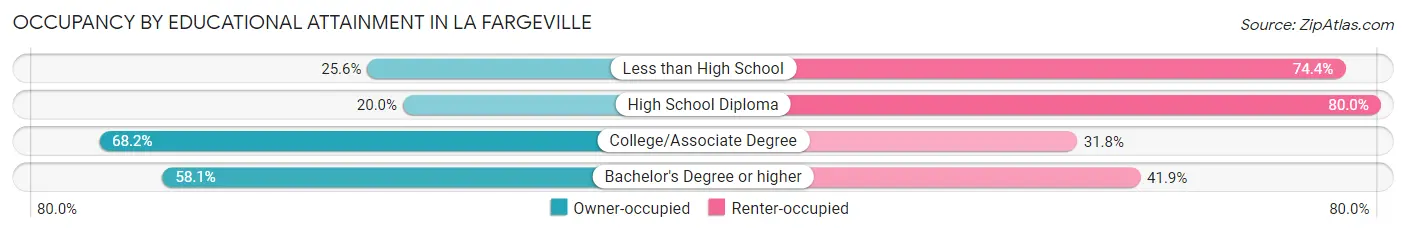
| Household Size | Owner-occupied | Renter-occupied |
| Less than High School | 10 (25.6%) | 29 (74.4%) |
| High School Diploma | 17 (20.0%) | 68 (80.0%) |
| College/Associate Degree | 30 (68.2%) | 14 (31.8%) |
| Bachelor's Degree or higher | 25 (58.1%) | 18 (41.9%) |
Occupancy by Age of Householder in La Fargeville
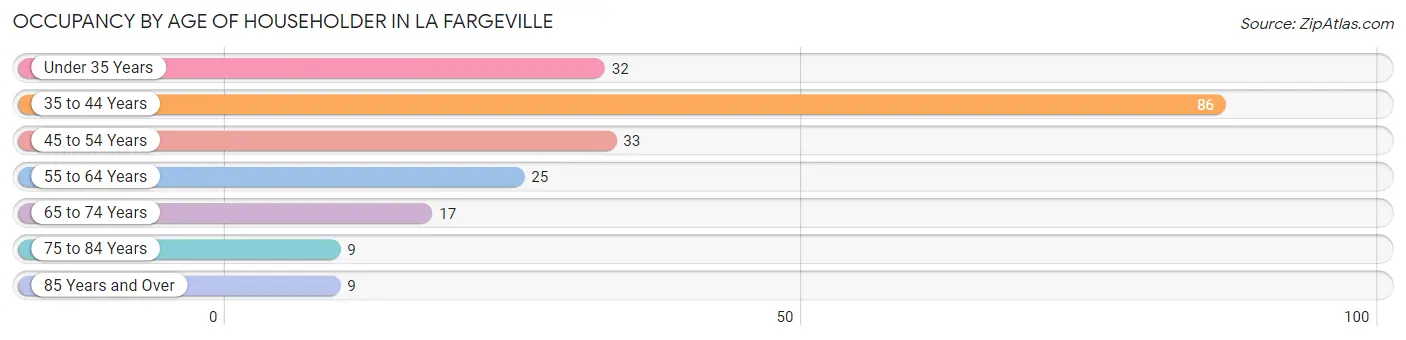
| Age Bracket | # Households | % Households |
| Under 35 Years | 32 | 15.2% |
| 35 to 44 Years | 86 | 40.8% |
| 45 to 54 Years | 33 | 15.6% |
| 55 to 64 Years | 25 | 11.8% |
| 65 to 74 Years | 17 | 8.1% |
| 75 to 84 Years | 9 | 4.3% |
| 85 Years and Over | 9 | 4.3% |
| Total | 211 | 100.0% |
Housing Finances in La Fargeville
Median Income by Occupancy in La Fargeville
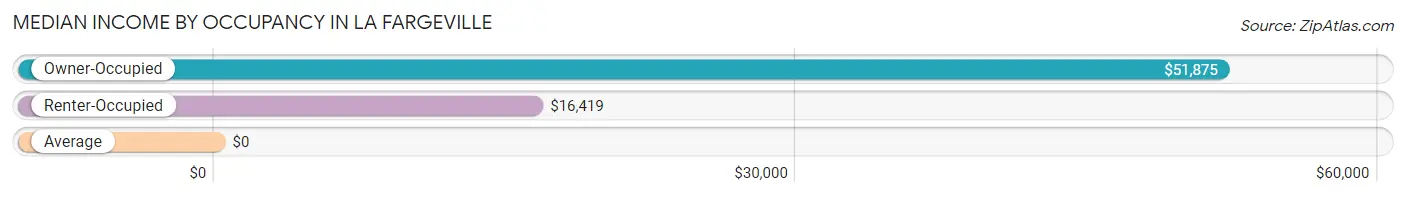
| Occupancy Type | # Households | Median Income |
| Owner-Occupied | 82 (38.9%) | $51,875 |
| Renter-Occupied | 129 (61.1%) | $16,419 |
| Average | 211 (100.0%) | $0 |
Occupancy by Householder Income Bracket in La Fargeville
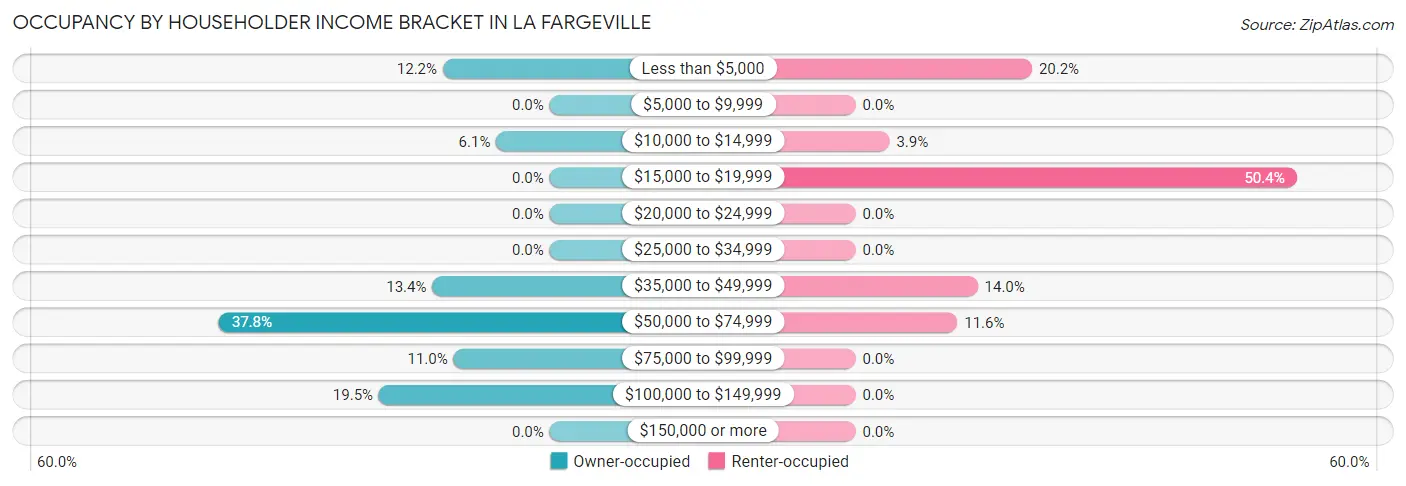
| Income Bracket | Owner-occupied | Renter-occupied |
| Less than $5,000 | 10 (12.2%) | 26 (20.2%) |
| $5,000 to $9,999 | 0 (0.0%) | 0 (0.0%) |
| $10,000 to $14,999 | 5 (6.1%) | 5 (3.9%) |
| $15,000 to $19,999 | 0 (0.0%) | 65 (50.4%) |
| $20,000 to $24,999 | 0 (0.0%) | 0 (0.0%) |
| $25,000 to $34,999 | 0 (0.0%) | 0 (0.0%) |
| $35,000 to $49,999 | 11 (13.4%) | 18 (14.0%) |
| $50,000 to $74,999 | 31 (37.8%) | 15 (11.6%) |
| $75,000 to $99,999 | 9 (11.0%) | 0 (0.0%) |
| $100,000 to $149,999 | 16 (19.5%) | 0 (0.0%) |
| $150,000 or more | 0 (0.0%) | 0 (0.0%) |
| Total | 82 (100.0%) | 129 (100.0%) |
Monthly Housing Cost Tiers in La Fargeville
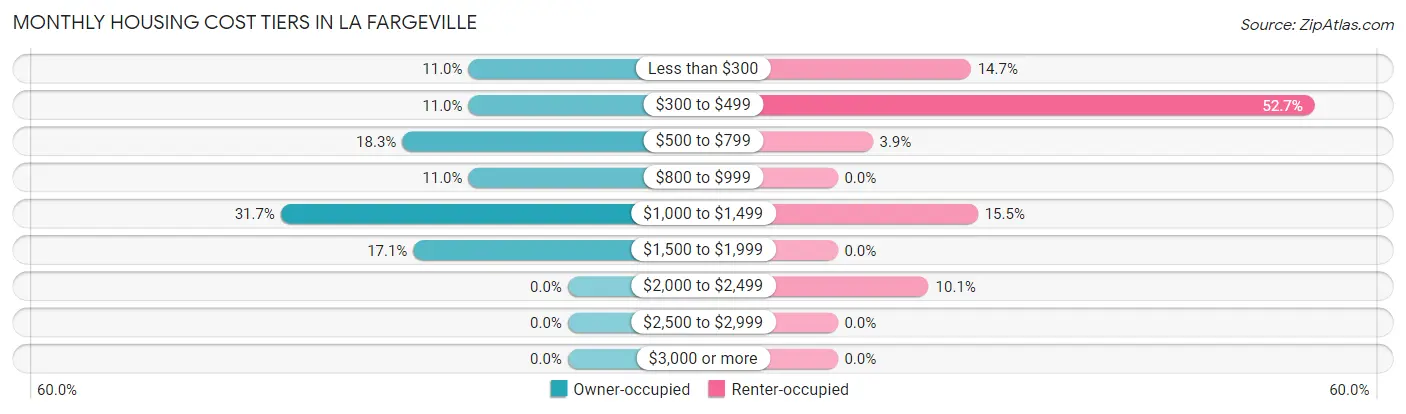
| Monthly Cost | Owner-occupied | Renter-occupied |
| Less than $300 | 9 (11.0%) | 19 (14.7%) |
| $300 to $499 | 9 (11.0%) | 68 (52.7%) |
| $500 to $799 | 15 (18.3%) | 5 (3.9%) |
| $800 to $999 | 9 (11.0%) | 0 (0.0%) |
| $1,000 to $1,499 | 26 (31.7%) | 20 (15.5%) |
| $1,500 to $1,999 | 14 (17.1%) | 0 (0.0%) |
| $2,000 to $2,499 | 0 (0.0%) | 13 (10.1%) |
| $2,500 to $2,999 | 0 (0.0%) | 0 (0.0%) |
| $3,000 or more | 0 (0.0%) | 0 (0.0%) |
| Total | 82 (100.0%) | 129 (100.0%) |
Physical Housing Characteristics in La Fargeville
Housing Structures in La Fargeville
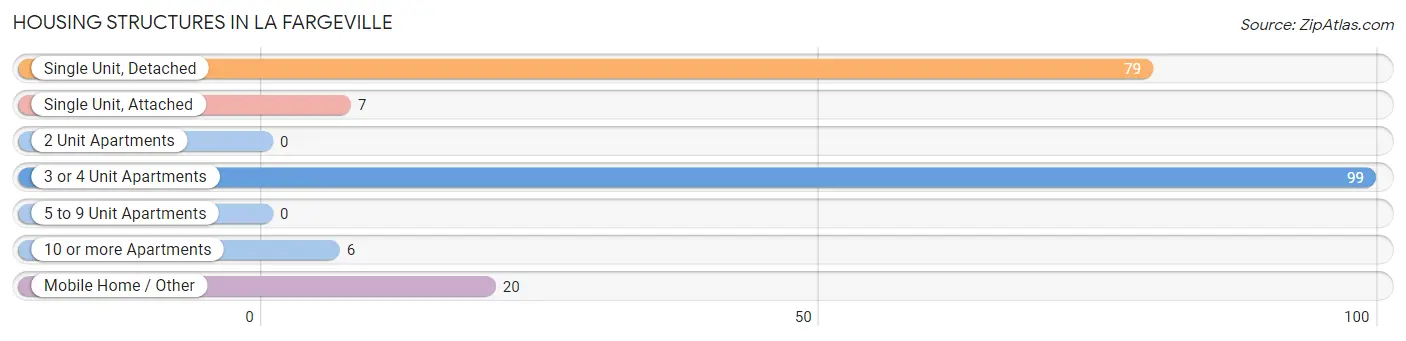
| Structure Type | # Housing Units | % Housing Units |
| Single Unit, Detached | 79 | 37.4% |
| Single Unit, Attached | 7 | 3.3% |
| 2 Unit Apartments | 0 | 0.0% |
| 3 or 4 Unit Apartments | 99 | 46.9% |
| 5 to 9 Unit Apartments | 0 | 0.0% |
| 10 or more Apartments | 6 | 2.8% |
| Mobile Home / Other | 20 | 9.5% |
| Total | 211 | 100.0% |
Housing Structures by Occupancy in La Fargeville
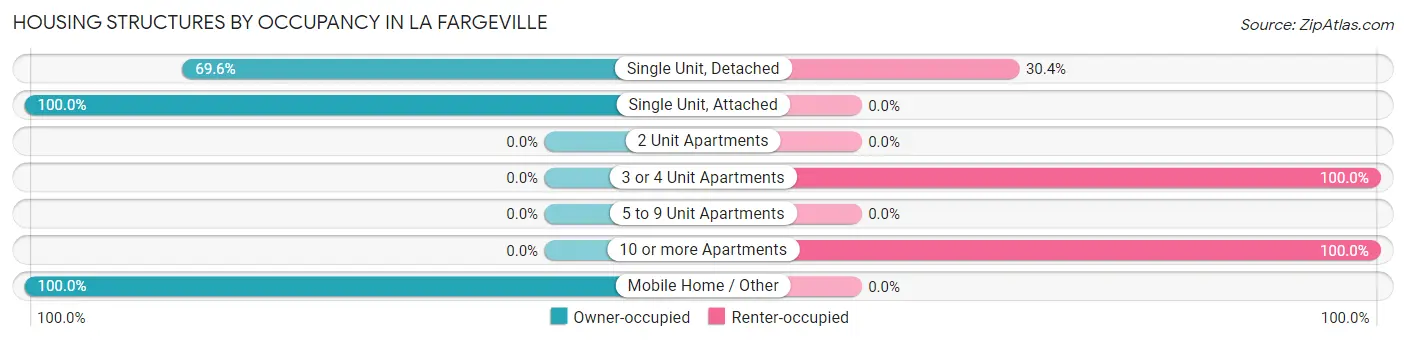
| Structure Type | Owner-occupied | Renter-occupied |
| Single Unit, Detached | 55 (69.6%) | 24 (30.4%) |
| Single Unit, Attached | 7 (100.0%) | 0 (0.0%) |
| 2 Unit Apartments | 0 (0.0%) | 0 (0.0%) |
| 3 or 4 Unit Apartments | 0 (0.0%) | 99 (100.0%) |
| 5 to 9 Unit Apartments | 0 (0.0%) | 0 (0.0%) |
| 10 or more Apartments | 0 (0.0%) | 6 (100.0%) |
| Mobile Home / Other | 20 (100.0%) | 0 (0.0%) |
| Total | 82 (38.9%) | 129 (61.1%) |
Housing Structures by Number of Rooms in La Fargeville
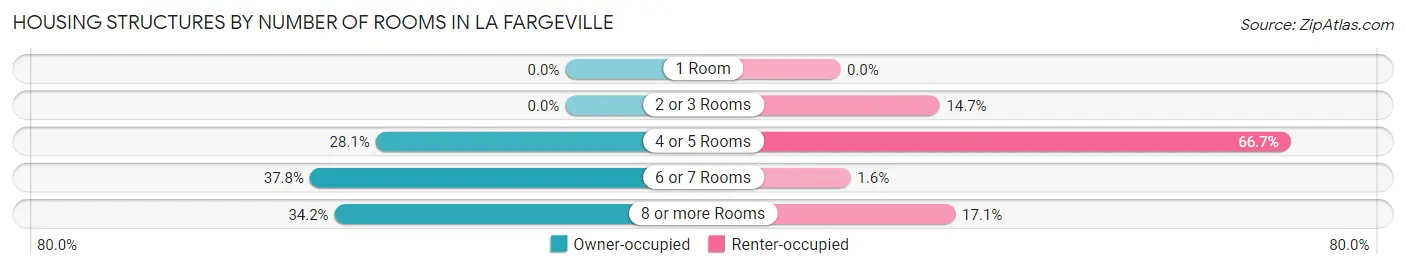
| Number of Rooms | Owner-occupied | Renter-occupied |
| 1 Room | 0 (0.0%) | 0 (0.0%) |
| 2 or 3 Rooms | 0 (0.0%) | 19 (14.7%) |
| 4 or 5 Rooms | 23 (28.1%) | 86 (66.7%) |
| 6 or 7 Rooms | 31 (37.8%) | 2 (1.5%) |
| 8 or more Rooms | 28 (34.2%) | 22 (17.1%) |
| Total | 82 (100.0%) | 129 (100.0%) |
Housing Structure by Heating Type in La Fargeville
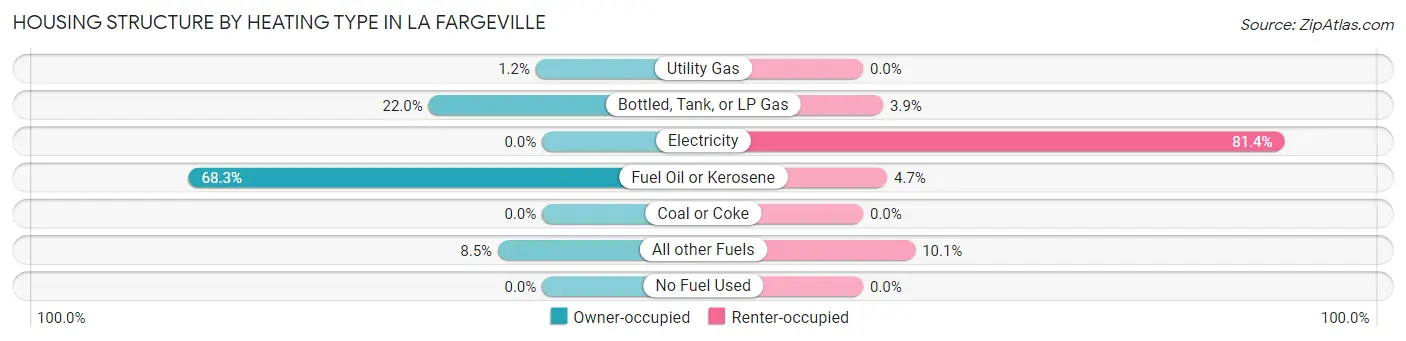
| Heating Type | Owner-occupied | Renter-occupied |
| Utility Gas | 1 (1.2%) | 0 (0.0%) |
| Bottled, Tank, or LP Gas | 18 (22.0%) | 5 (3.9%) |
| Electricity | 0 (0.0%) | 105 (81.4%) |
| Fuel Oil or Kerosene | 56 (68.3%) | 6 (4.6%) |
| Coal or Coke | 0 (0.0%) | 0 (0.0%) |
| All other Fuels | 7 (8.5%) | 13 (10.1%) |
| No Fuel Used | 0 (0.0%) | 0 (0.0%) |
| Total | 82 (100.0%) | 129 (100.0%) |
Household Vehicle Usage in La Fargeville
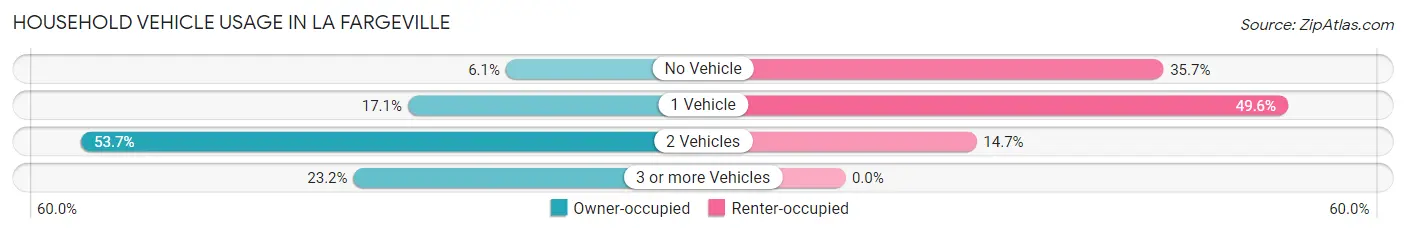
| Vehicles per Household | Owner-occupied | Renter-occupied |
| No Vehicle | 5 (6.1%) | 46 (35.7%) |
| 1 Vehicle | 14 (17.1%) | 64 (49.6%) |
| 2 Vehicles | 44 (53.7%) | 19 (14.7%) |
| 3 or more Vehicles | 19 (23.2%) | 0 (0.0%) |
| Total | 82 (100.0%) | 129 (100.0%) |
Real Estate & Mortgages in La Fargeville
Real Estate and Mortgage Overview in La Fargeville
| Characteristic | Without Mortgage | With Mortgage |
| Housing Units | 40 | 42 |
| Median Property Value | $108,300 | $167,900 |
| Median Household Income | $51,250 | $0 |
| Monthly Housing Costs | $533 | $0 |
| Real Estate Taxes | $1,482 | $7 |
Property Value by Mortgage Status in La Fargeville
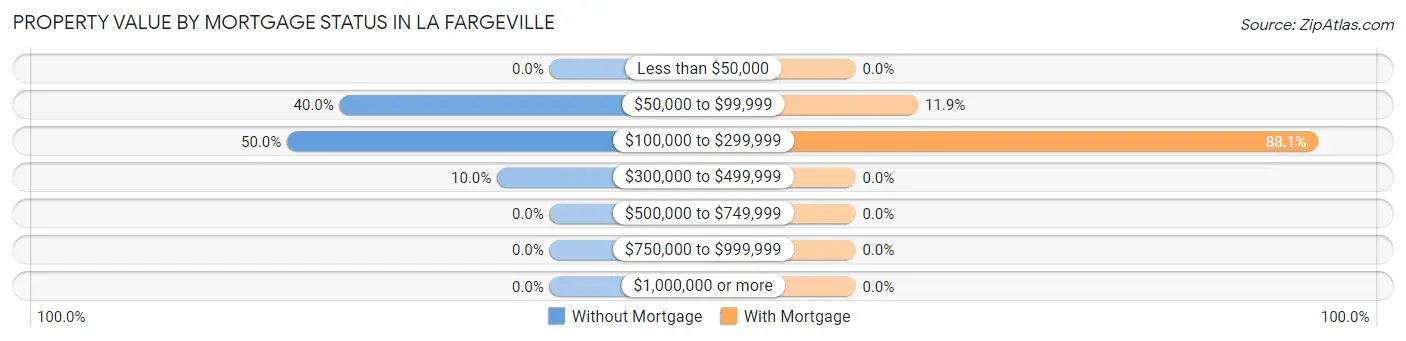
| Property Value | Without Mortgage | With Mortgage |
| Less than $50,000 | 0 (0.0%) | 0 (0.0%) |
| $50,000 to $99,999 | 16 (40.0%) | 5 (11.9%) |
| $100,000 to $299,999 | 20 (50.0%) | 37 (88.1%) |
| $300,000 to $499,999 | 4 (10.0%) | 0 (0.0%) |
| $500,000 to $749,999 | 0 (0.0%) | 0 (0.0%) |
| $750,000 to $999,999 | 0 (0.0%) | 0 (0.0%) |
| $1,000,000 or more | 0 (0.0%) | 0 (0.0%) |
| Total | 40 (100.0%) | 42 (100.0%) |
Household Income by Mortgage Status in La Fargeville
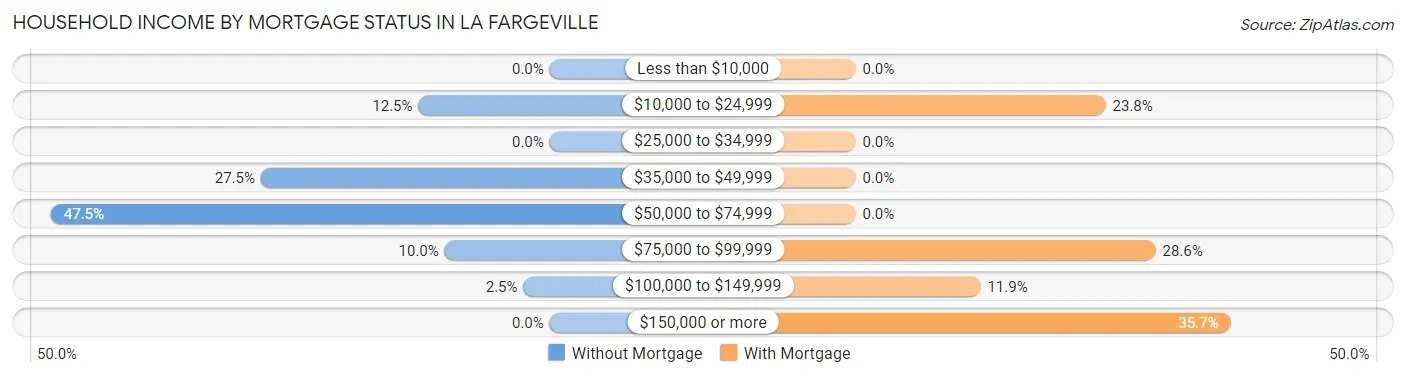
| Household Income | Without Mortgage | With Mortgage |
| Less than $10,000 | 0 (0.0%) | 0 (0.0%) |
| $10,000 to $24,999 | 5 (12.5%) | 10 (23.8%) |
| $25,000 to $34,999 | 0 (0.0%) | 0 (0.0%) |
| $35,000 to $49,999 | 11 (27.5%) | 0 (0.0%) |
| $50,000 to $74,999 | 19 (47.5%) | 0 (0.0%) |
| $75,000 to $99,999 | 4 (10.0%) | 12 (28.6%) |
| $100,000 to $149,999 | 1 (2.5%) | 5 (11.9%) |
| $150,000 or more | 0 (0.0%) | 15 (35.7%) |
| Total | 40 (100.0%) | 42 (100.0%) |
Property Value to Household Income Ratio in La Fargeville
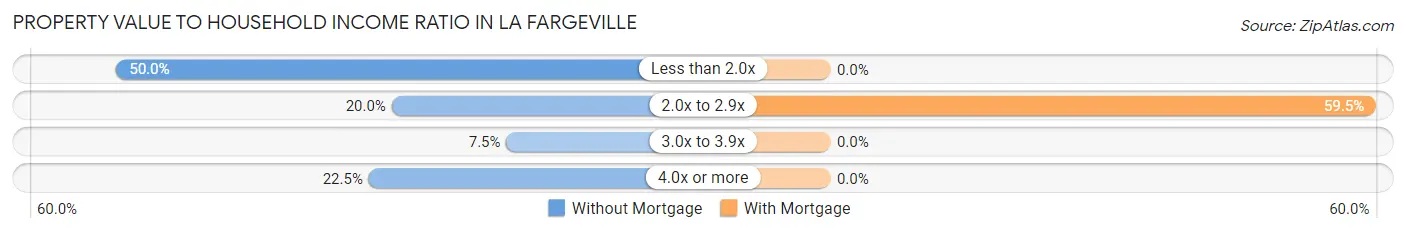
| Value-to-Income Ratio | Without Mortgage | With Mortgage |
| Less than 2.0x | 20 (50.0%) | 0 (0.0%) |
| 2.0x to 2.9x | 8 (20.0%) | 25 (59.5%) |
| 3.0x to 3.9x | 3 (7.5%) | 0 (0.0%) |
| 4.0x or more | 9 (22.5%) | 0 (0.0%) |
| Total | 40 (100.0%) | 42 (100.0%) |
Real Estate Taxes by Mortgage Status in La Fargeville
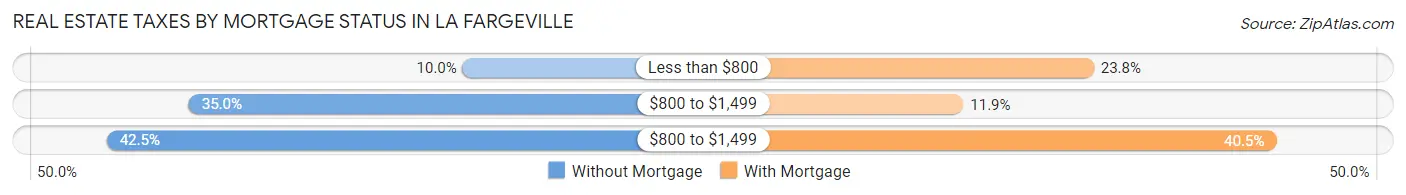
| Property Taxes | Without Mortgage | With Mortgage |
| Less than $800 | 4 (10.0%) | 10 (23.8%) |
| $800 to $1,499 | 14 (35.0%) | 5 (11.9%) |
| $800 to $1,499 | 17 (42.5%) | 17 (40.5%) |
| Total | 40 (100.0%) | 42 (100.0%) |
Health & Disability in La Fargeville
Health Insurance Coverage by Age in La Fargeville
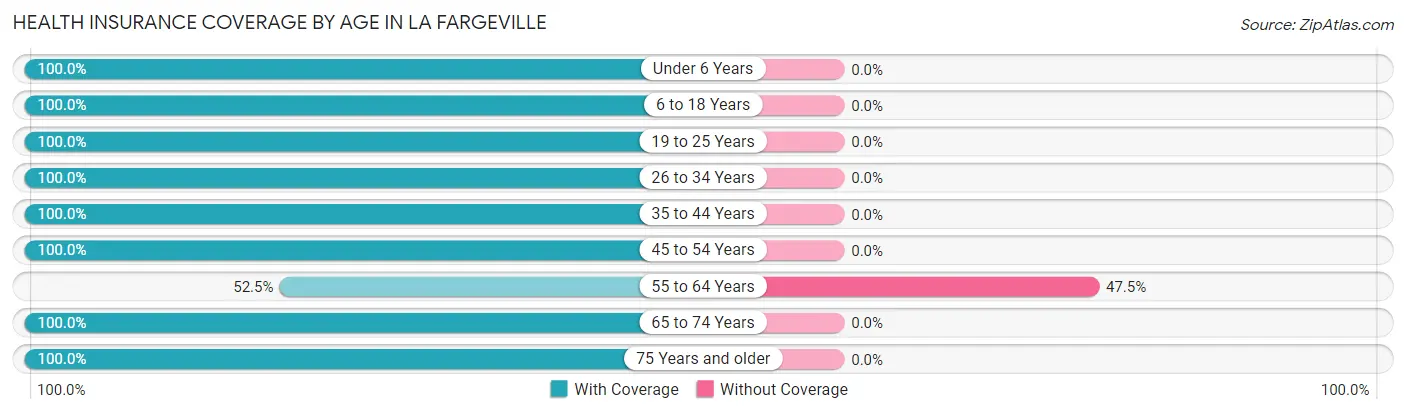
| Age Bracket | With Coverage | Without Coverage |
| Under 6 Years | 128 (100.0%) | 0 (0.0%) |
| 6 to 18 Years | 94 (100.0%) | 0 (0.0%) |
| 19 to 25 Years | 41 (100.0%) | 0 (0.0%) |
| 26 to 34 Years | 14 (100.0%) | 0 (0.0%) |
| 35 to 44 Years | 104 (100.0%) | 0 (0.0%) |
| 45 to 54 Years | 46 (100.0%) | 0 (0.0%) |
| 55 to 64 Years | 21 (52.5%) | 19 (47.5%) |
| 65 to 74 Years | 25 (100.0%) | 0 (0.0%) |
| 75 Years and older | 25 (100.0%) | 0 (0.0%) |
| Total | 498 (96.3%) | 19 (3.7%) |
Health Insurance Coverage by Citizenship Status in La Fargeville
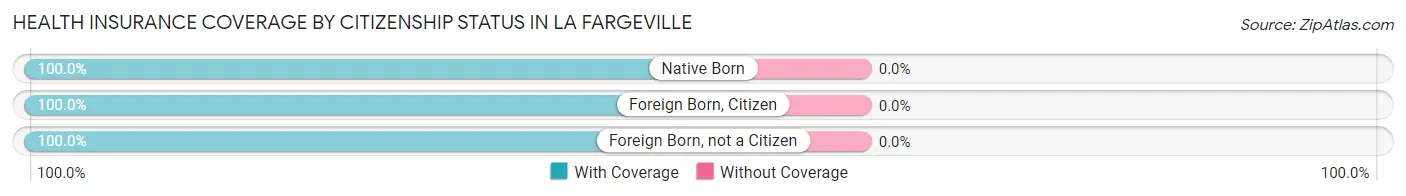
| Citizenship Status | With Coverage | Without Coverage |
| Native Born | 128 (100.0%) | 0 (0.0%) |
| Foreign Born, Citizen | 94 (100.0%) | 0 (0.0%) |
| Foreign Born, not a Citizen | 41 (100.0%) | 0 (0.0%) |
Health Insurance Coverage by Household Income in La Fargeville
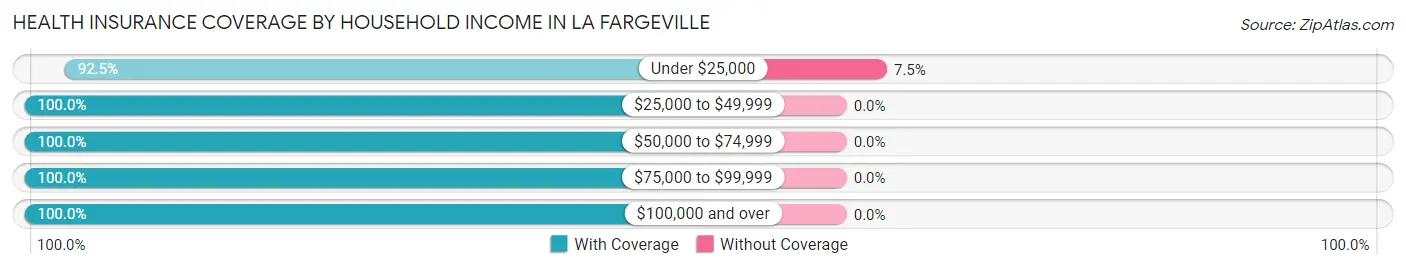
| Household Income | With Coverage | Without Coverage |
| Under $25,000 | 233 (92.5%) | 19 (7.5%) |
| $25,000 to $49,999 | 32 (100.0%) | 0 (0.0%) |
| $50,000 to $74,999 | 157 (100.0%) | 0 (0.0%) |
| $75,000 to $99,999 | 25 (100.0%) | 0 (0.0%) |
| $100,000 and over | 51 (100.0%) | 0 (0.0%) |
Public vs Private Health Insurance Coverage by Age in La Fargeville
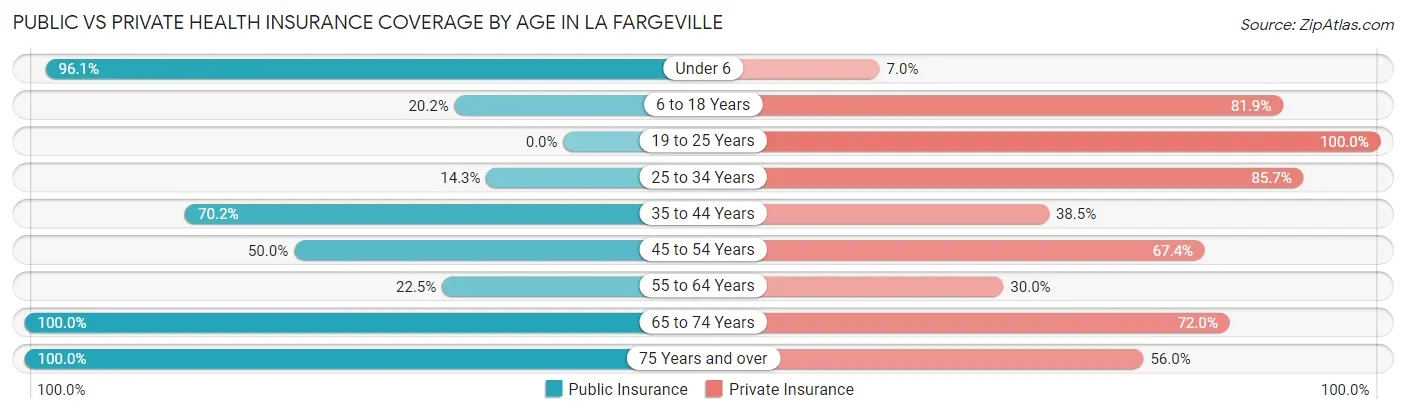
| Age Bracket | Public Insurance | Private Insurance |
| Under 6 | 123 (96.1%) | 9 (7.0%) |
| 6 to 18 Years | 19 (20.2%) | 77 (81.9%) |
| 19 to 25 Years | 0 (0.0%) | 41 (100.0%) |
| 25 to 34 Years | 2 (14.3%) | 12 (85.7%) |
| 35 to 44 Years | 73 (70.2%) | 40 (38.5%) |
| 45 to 54 Years | 23 (50.0%) | 31 (67.4%) |
| 55 to 64 Years | 9 (22.5%) | 12 (30.0%) |
| 65 to 74 Years | 25 (100.0%) | 18 (72.0%) |
| 75 Years and over | 25 (100.0%) | 14 (56.0%) |
| Total | 299 (57.8%) | 254 (49.1%) |
Disability Status by Sex by Age in La Fargeville
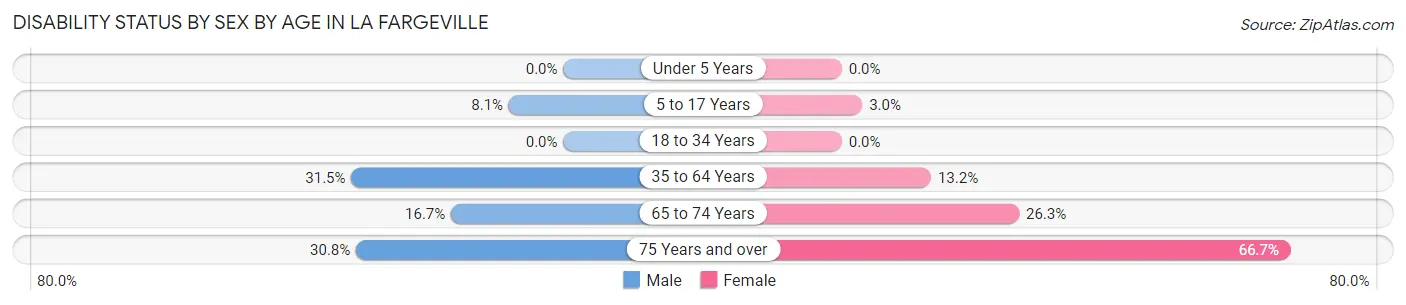
| Age Bracket | Male | Female |
| Under 5 Years | 0 (0.0%) | 0 (0.0%) |
| 5 to 17 Years | 8 (8.1%) | 2 (3.0%) |
| 18 to 34 Years | 0 (0.0%) | 0 (0.0%) |
| 35 to 64 Years | 17 (31.5%) | 18 (13.2%) |
| 65 to 74 Years | 1 (16.7%) | 5 (26.3%) |
| 75 Years and over | 4 (30.8%) | 8 (66.7%) |
Disability Class by Sex by Age in La Fargeville
Disability Class: Hearing Difficulty
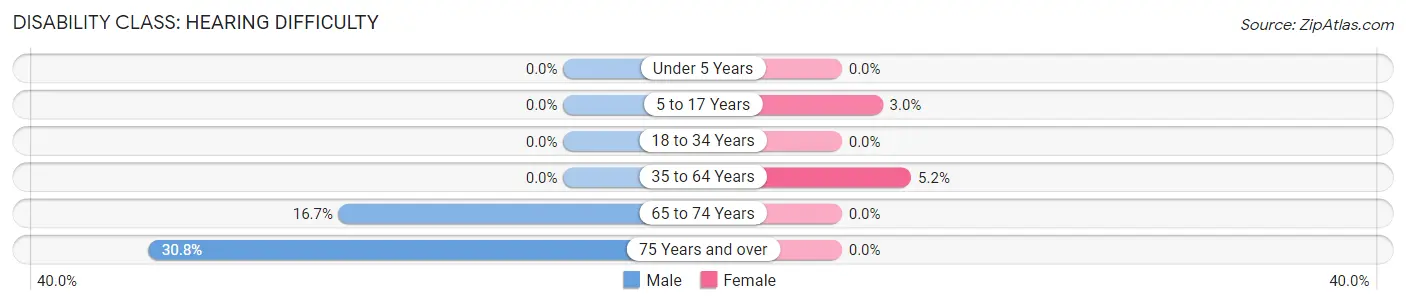
| Age Bracket | Male | Female |
| Under 5 Years | 0 (0.0%) | 0 (0.0%) |
| 5 to 17 Years | 0 (0.0%) | 2 (3.0%) |
| 18 to 34 Years | 0 (0.0%) | 0 (0.0%) |
| 35 to 64 Years | 0 (0.0%) | 7 (5.1%) |
| 65 to 74 Years | 1 (16.7%) | 0 (0.0%) |
| 75 Years and over | 4 (30.8%) | 0 (0.0%) |
Disability Class: Vision Difficulty
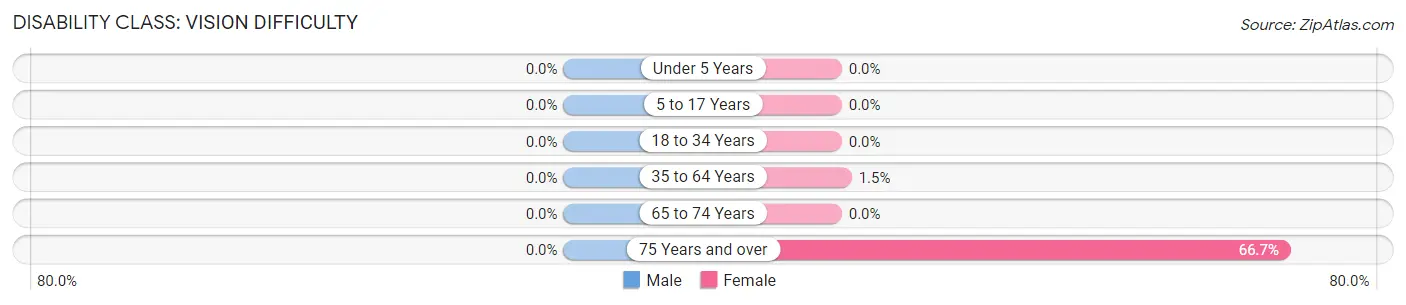
| Age Bracket | Male | Female |
| Under 5 Years | 0 (0.0%) | 0 (0.0%) |
| 5 to 17 Years | 0 (0.0%) | 0 (0.0%) |
| 18 to 34 Years | 0 (0.0%) | 0 (0.0%) |
| 35 to 64 Years | 0 (0.0%) | 2 (1.5%) |
| 65 to 74 Years | 0 (0.0%) | 0 (0.0%) |
| 75 Years and over | 0 (0.0%) | 8 (66.7%) |
Disability Class: Cognitive Difficulty
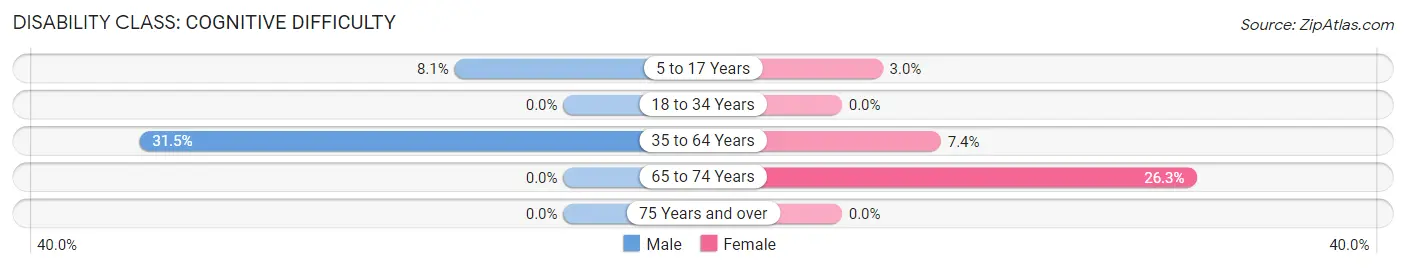
| Age Bracket | Male | Female |
| 5 to 17 Years | 8 (8.1%) | 2 (3.0%) |
| 18 to 34 Years | 0 (0.0%) | 0 (0.0%) |
| 35 to 64 Years | 17 (31.5%) | 10 (7.3%) |
| 65 to 74 Years | 0 (0.0%) | 5 (26.3%) |
| 75 Years and over | 0 (0.0%) | 0 (0.0%) |
Disability Class: Ambulatory Difficulty
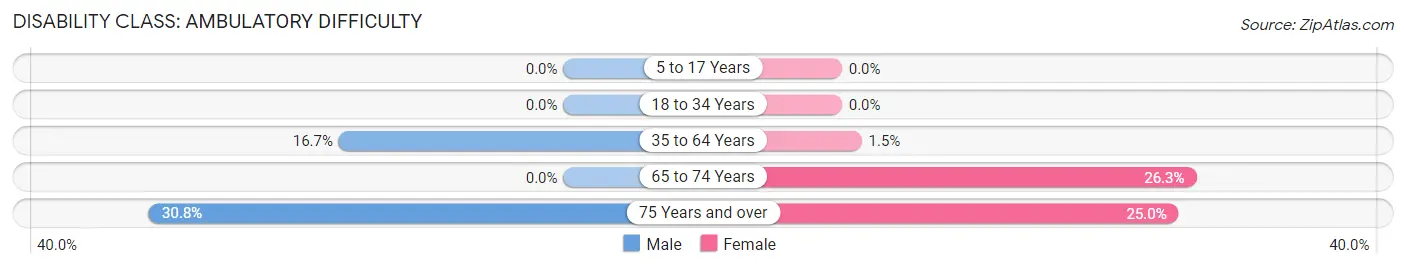
| Age Bracket | Male | Female |
| 5 to 17 Years | 0 (0.0%) | 0 (0.0%) |
| 18 to 34 Years | 0 (0.0%) | 0 (0.0%) |
| 35 to 64 Years | 9 (16.7%) | 2 (1.5%) |
| 65 to 74 Years | 0 (0.0%) | 5 (26.3%) |
| 75 Years and over | 4 (30.8%) | 3 (25.0%) |
Disability Class: Self-Care Difficulty
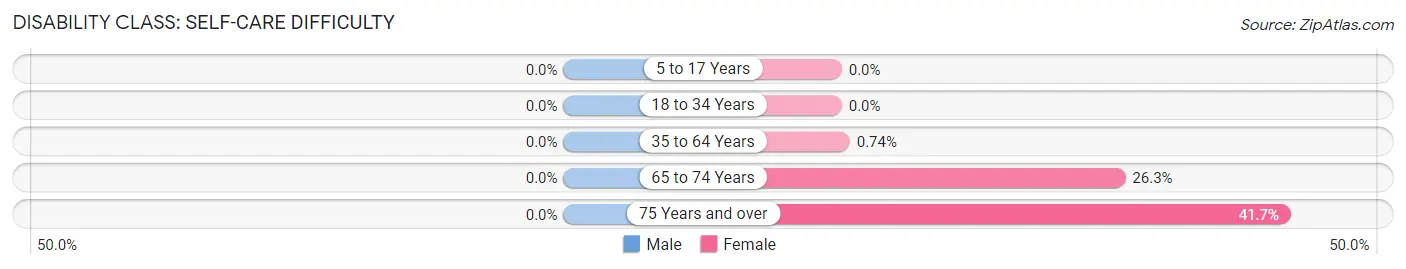
| Age Bracket | Male | Female |
| 5 to 17 Years | 0 (0.0%) | 0 (0.0%) |
| 18 to 34 Years | 0 (0.0%) | 0 (0.0%) |
| 35 to 64 Years | 0 (0.0%) | 1 (0.7%) |
| 65 to 74 Years | 0 (0.0%) | 5 (26.3%) |
| 75 Years and over | 0 (0.0%) | 5 (41.7%) |
Technology Access in La Fargeville
Computing Device Access in La Fargeville
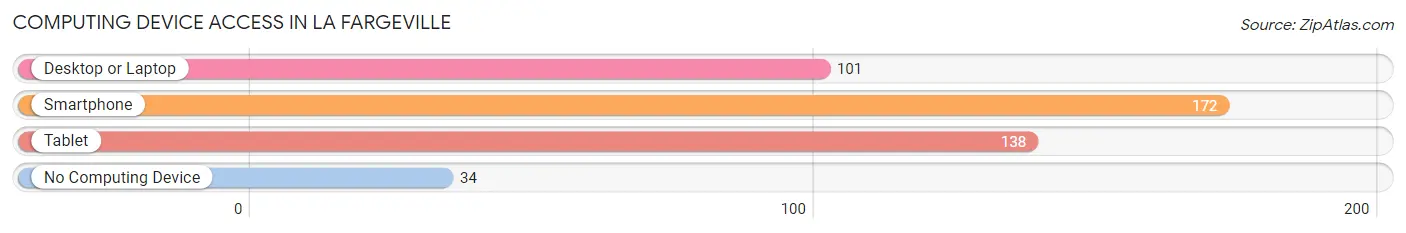
| Device Type | # Households | % Households |
| Desktop or Laptop | 101 | 47.9% |
| Smartphone | 172 | 81.5% |
| Tablet | 138 | 65.4% |
| No Computing Device | 34 | 16.1% |
| Total | 211 | 100.0% |
Internet Access in La Fargeville
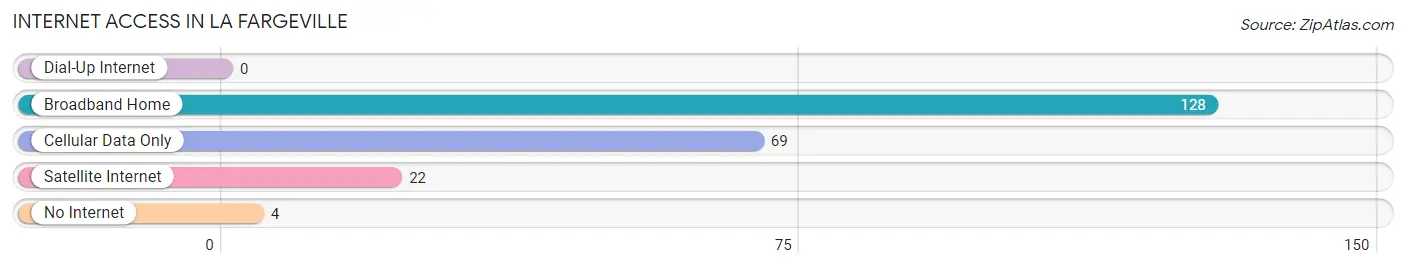
| Internet Type | # Households | % Households |
| Dial-Up Internet | 0 | 0.0% |
| Broadband Home | 128 | 60.7% |
| Cellular Data Only | 69 | 32.7% |
| Satellite Internet | 22 | 10.4% |
| No Internet | 4 | 1.9% |
| Total | 211 | 100.0% |
La Fargeville Summary
Founded in 1802, the small hamlet of La Fargeville, New York is located in the Town of Orleans in Jefferson County. It is situated on the banks of the Black River, which is a tributary of Lake Ontario. La Fargeville is a rural community with a population of approximately 500 people.
Geography
La Fargeville is located in the northern part of Jefferson County, New York, approximately 30 miles north of Watertown. It is situated on the banks of the Black River, which is a tributary of Lake Ontario. The hamlet is surrounded by rolling hills and farmland, and is bordered by the towns of Clayton, Orleans, and Alexandria. La Fargeville is located in the Central New York region, which is known for its agricultural production and outdoor recreation.
The climate in La Fargeville is typical of the Central New York region, with cold winters and warm summers. The average annual temperature is around 50 degrees Fahrenheit, with an average high of around 70 degrees in the summer and an average low of around 30 degrees in the winter. The area receives an average of 40 inches of precipitation per year, with most of it falling in the form of snow.
Economy
The economy of La Fargeville is largely based on agriculture and tourism. The area is known for its dairy farms, which produce milk, cheese, and other dairy products. The hamlet is also home to several small businesses, including a grocery store, a hardware store, and a few restaurants.
Tourism is an important part of the local economy, as the area is known for its outdoor recreation opportunities. The Black River is a popular destination for fishing, boating, and swimming. The nearby Thousand Islands region is also a popular destination for tourists, as it offers a variety of activities such as camping, hiking, and sightseeing.
Demographics
As of the 2010 census, the population of La Fargeville was 498 people. The racial makeup of the hamlet was 97.2% White, 0.6% African American, 0.2% Native American, 0.2% Asian, 0.2% from other races, and 1.8% from two or more races. Hispanic or Latino of any race were 1.2% of the population.
The median household income in La Fargeville was $41,250, and the median family income was $45,000. The per capita income was $19,845. About 11.2% of families and 13.2% of the population were below the poverty line, including 16.7% of those under age 18 and 8.3% of those age 65 or over.
Conclusion
La Fargeville is a small hamlet located in the Town of Orleans in Jefferson County, New York. It is situated on the banks of the Black River, which is a tributary of Lake Ontario. The hamlet is surrounded by rolling hills and farmland, and is bordered by the towns of Clayton, Orleans, and Alexandria. The economy of La Fargeville is largely based on agriculture and tourism, and the area is known for its outdoor recreation opportunities. As of the 2010 census, the population of La Fargeville was 498 people. The median household income in La Fargeville was $41,250, and the median family income was $45,000.
Common Questions
What is Per Capita Income in La Fargeville?
Per Capita income in La Fargeville is $16,058.
What is Income or Wage Gap in La Fargeville?
Income or Wage Gap in La Fargeville is 70.8%.
Women in La Fargeville earn 29.2 cents for every dollar earned by a man.
What is Inequality or Gini Index in La Fargeville?
Inequality or Gini Index in La Fargeville is 0.50.
What is the Total Population of La Fargeville?
Total Population of La Fargeville is 530.
What is the Total Male Population of La Fargeville?
Total Male Population of La Fargeville is 223.
What is the Total Female Population of La Fargeville?
Total Female Population of La Fargeville is 307.
What is the Ratio of Males per 100 Females in La Fargeville?
There are 72.64 Males per 100 Females in La Fargeville.
What is the Ratio of Females per 100 Males in La Fargeville?
There are 137.67 Females per 100 Males in La Fargeville.
What is the Median Population Age in La Fargeville?
Median Population Age in La Fargeville is 28.5 Years.
What is the Average Family Size in La Fargeville
Average Family Size in La Fargeville is 3.1 People.
What is the Average Household Size in La Fargeville
Average Household Size in La Fargeville is 2.5 People.
How Large is the Labor Force in La Fargeville?
There are 218 People in the Labor Forcein in La Fargeville.
What is the Percentage of People in the Labor Force in La Fargeville?
68.8% of People are in the Labor Force in La Fargeville.
What is the Unemployment Rate in La Fargeville?
Unemployment Rate in La Fargeville is 5.9%.