Ellicottville, NY Map & Demographics
Ellicottville Map
Ellicottville Overview
$49,733
PER CAPITA INCOME
$93,750
AVG FAMILY INCOME
$88,646
AVG HOUSEHOLD INCOME
25.0%
WAGE / INCOME GAP [ % ]
75.0¢/ $1
WAGE / INCOME GAP [ $ ]
0.35
INEQUALITY / GINI INDEX
374
TOTAL POPULATION
210
MALE POPULATION
164
FEMALE POPULATION
128.05
MALES / 100 FEMALES
78.10
FEMALES / 100 MALES
41.7
MEDIAN AGE
2.6
AVG FAMILY SIZE
2.3
AVG HOUSEHOLD SIZE
208
LABOR FORCE [ PEOPLE ]
67.3%
PERCENT IN LABOR FORCE
8.7%
UNEMPLOYMENT RATE
Ellicottville Zip Codes
Ellicottville Area Codes
Income in Ellicottville
Income Overview in Ellicottville
Per Capita Income in Ellicottville is $49,733, while median incomes of families and households are $93,750 and $88,646 respectively.
| Characteristic | Number | Measure |
| Per Capita Income | 374 | $49,733 |
| Median Family Income | 123 | $93,750 |
| Mean Family Income | 123 | $122,500 |
| Median Household Income | 163 | $88,646 |
| Mean Household Income | 163 | $113,083 |
| Income Deficit | 123 | $0 |
| Wage / Income Gap (%) | 374 | 24.97% |
| Wage / Income Gap ($) | 374 | 75.03¢ per $1 |
| Gini / Inequality Index | 374 | 0.35 |
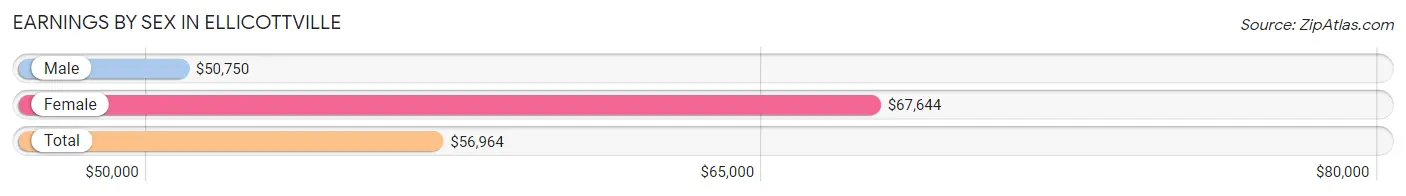
Earnings by Sex in Ellicottville
Average Earnings in Ellicottville are $56,964, $50,750 for men and $67,644 for women, a difference of 25.0%.
| Sex | Number | Average Earnings |
| Male | 124 (57.1%) | $50,750 |
| Female | 93 (42.9%) | $67,644 |
| Total | 217 (100.0%) | $56,964 |
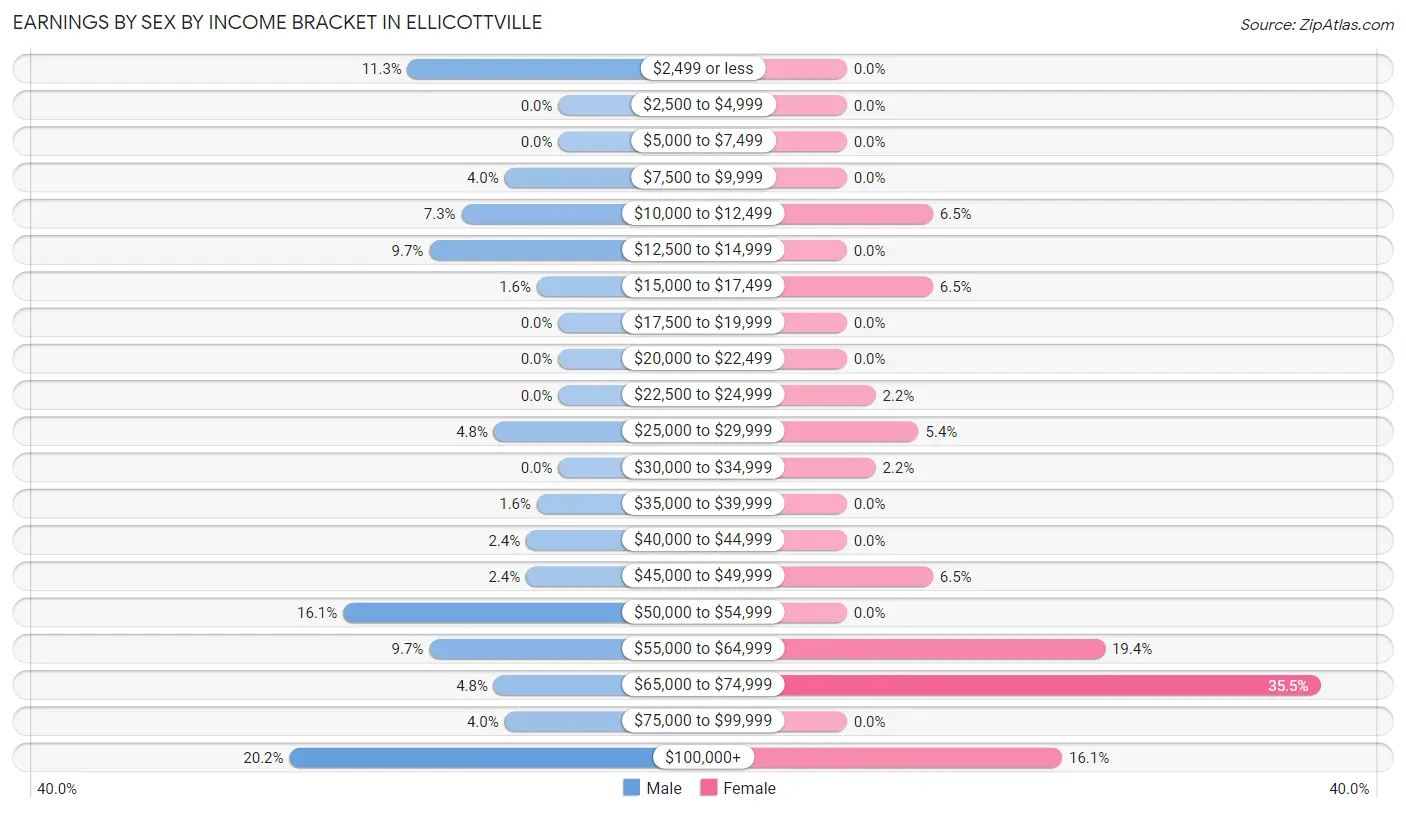
Earnings by Sex by Income Bracket in Ellicottville
The most common earnings brackets in Ellicottville are $100,000+ for men (25 | 20.2%) and $65,000 to $74,999 for women (33 | 35.5%).
| Income | Male | Female |
| $2,499 or less | 14 (11.3%) | 0 (0.0%) |
| $2,500 to $4,999 | 0 (0.0%) | 0 (0.0%) |
| $5,000 to $7,499 | 0 (0.0%) | 0 (0.0%) |
| $7,500 to $9,999 | 5 (4.0%) | 0 (0.0%) |
| $10,000 to $12,499 | 9 (7.3%) | 6 (6.5%) |
| $12,500 to $14,999 | 12 (9.7%) | 0 (0.0%) |
| $15,000 to $17,499 | 2 (1.6%) | 6 (6.5%) |
| $17,500 to $19,999 | 0 (0.0%) | 0 (0.0%) |
| $20,000 to $22,499 | 0 (0.0%) | 0 (0.0%) |
| $22,500 to $24,999 | 0 (0.0%) | 2 (2.1%) |
| $25,000 to $29,999 | 6 (4.8%) | 5 (5.4%) |
| $30,000 to $34,999 | 0 (0.0%) | 2 (2.1%) |
| $35,000 to $39,999 | 2 (1.6%) | 0 (0.0%) |
| $40,000 to $44,999 | 3 (2.4%) | 0 (0.0%) |
| $45,000 to $49,999 | 3 (2.4%) | 6 (6.5%) |
| $50,000 to $54,999 | 20 (16.1%) | 0 (0.0%) |
| $55,000 to $64,999 | 12 (9.7%) | 18 (19.4%) |
| $65,000 to $74,999 | 6 (4.8%) | 33 (35.5%) |
| $75,000 to $99,999 | 5 (4.0%) | 0 (0.0%) |
| $100,000+ | 25 (20.2%) | 15 (16.1%) |
| Total | 124 (100.0%) | 93 (100.0%) |
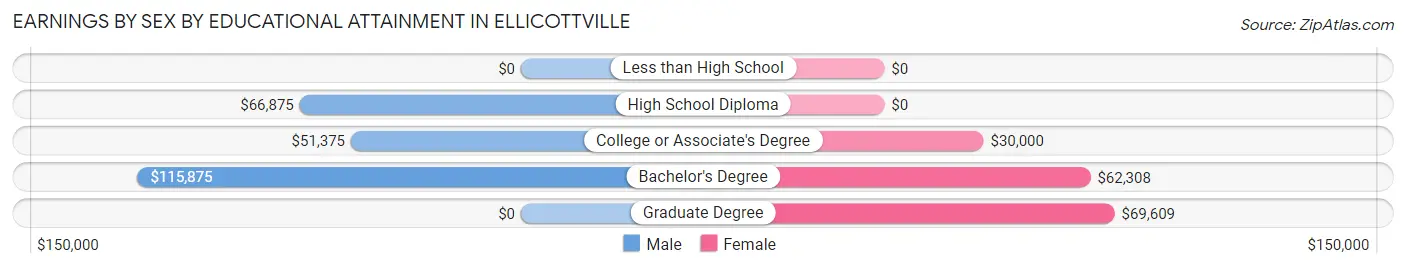
Earnings by Sex by Educational Attainment in Ellicottville
Average earnings in Ellicottville are $52,313 for men and $67,644 for women, a difference of 22.7%. Men with an educational attainment of bachelor's degree enjoy the highest average annual earnings of $115,875, while those with college or associate's degree education earn the least with $51,375. Women with an educational attainment of graduate degree earn the most with the average annual earnings of $69,609, while those with college or associate's degree education have the smallest earnings of $30,000.
| Educational Attainment | Male Income | Female Income |
| Less than High School | - | - |
| High School Diploma | $66,875 | $0 |
| College or Associate's Degree | $51,375 | $30,000 |
| Bachelor's Degree | $115,875 | $62,308 |
| Graduate Degree | - | - |
| Total | $52,313 | $67,644 |
Family Income in Ellicottville
Family Income Brackets in Ellicottville
According to the Ellicottville family income data, there are 25 families falling into the $100,000 to $149,999 income range, which is the most common income bracket and makes up 20.3% of all families.
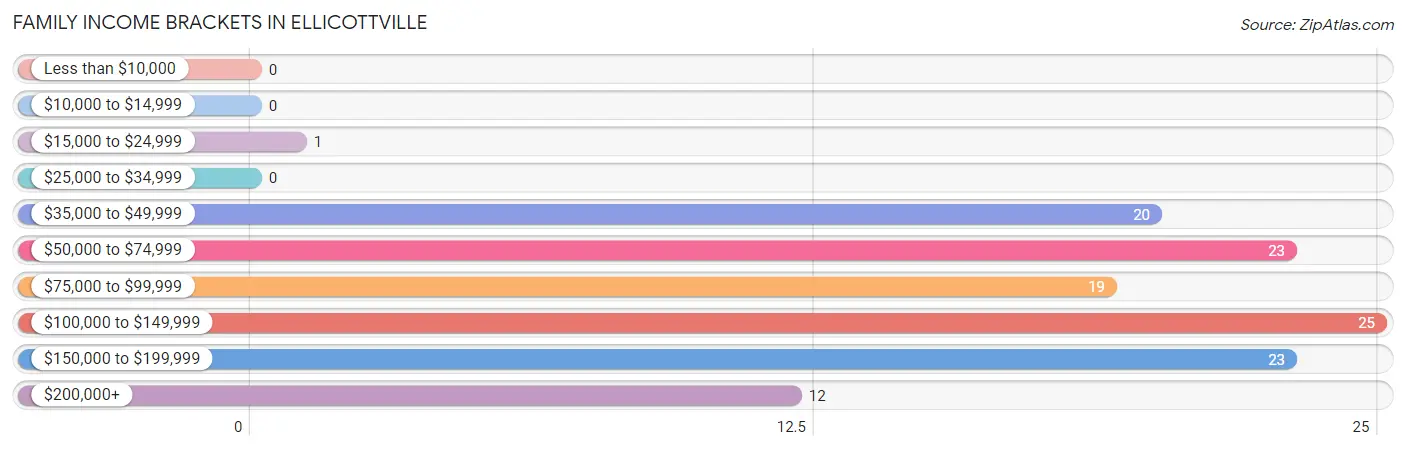
| Income Bracket | # Families | % Families |
| Less than $10,000 | 0 | 0.0% |
| $10,000 to $14,999 | 0 | 0.0% |
| $15,000 to $24,999 | 1 | 0.8% |
| $25,000 to $34,999 | 0 | 0.0% |
| $35,000 to $49,999 | 20 | 16.3% |
| $50,000 to $74,999 | 23 | 18.7% |
| $75,000 to $99,999 | 19 | 15.4% |
| $100,000 to $149,999 | 25 | 20.3% |
| $150,000 to $199,999 | 23 | 18.7% |
| $200,000+ | 12 | 9.8% |
Family Income by Famaliy Size in Ellicottville
4-person families (25 | 20.3%) account for the highest median family income in Ellicottville with $119,141 per family, while 4-person families (25 | 20.3%) have the highest median income of $29,785 per family member.
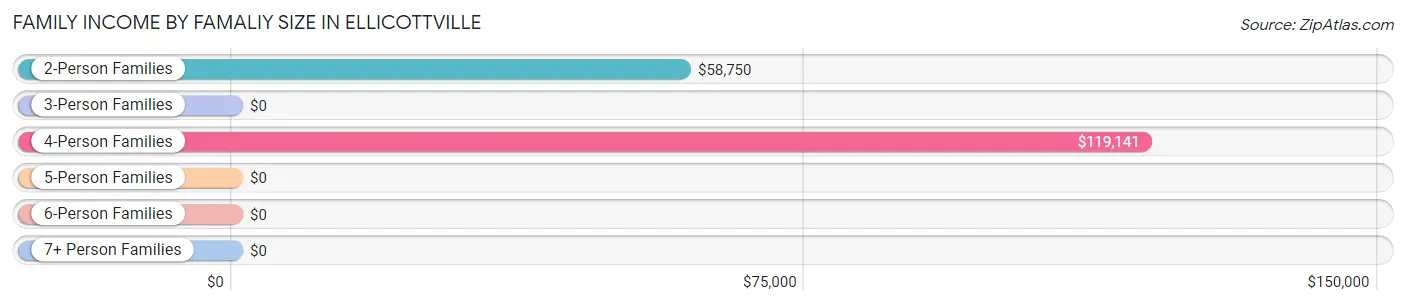
| Income Bracket | # Families | Median Income |
| 2-Person Families | 66 (53.7%) | $58,750 |
| 3-Person Families | 32 (26.0%) | $0 |
| 4-Person Families | 25 (20.3%) | $119,141 |
| 5-Person Families | 0 (0.0%) | $0 |
| 6-Person Families | 0 (0.0%) | $0 |
| 7+ Person Families | 0 (0.0%) | $0 |
| Total | 123 (100.0%) | $93,750 |
Family Income by Number of Earners in Ellicottville
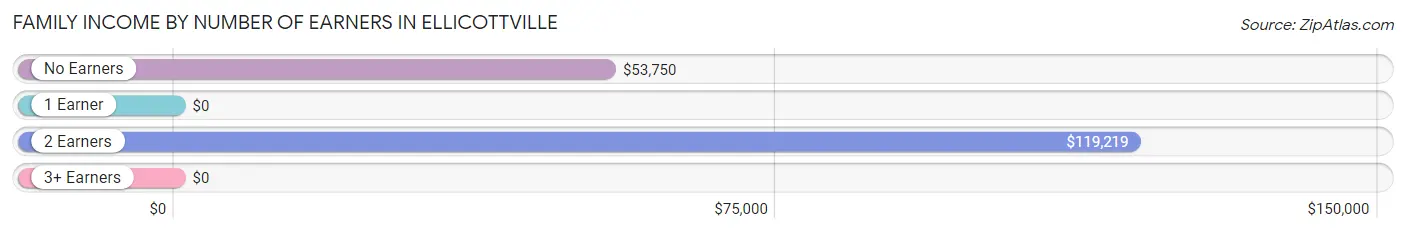
| Number of Earners | # Families | Median Income |
| No Earners | 21 (17.1%) | $53,750 |
| 1 Earner | 42 (34.2%) | $0 |
| 2 Earners | 56 (45.5%) | $119,219 |
| 3+ Earners | 4 (3.3%) | $0 |
| Total | 123 (100.0%) | $93,750 |
Household Income in Ellicottville
Household Income Brackets in Ellicottville
With 36 households falling in the category, the $75,000 to $99,999 income range is the most frequent in Ellicottville, accounting for 22.1% of all households.
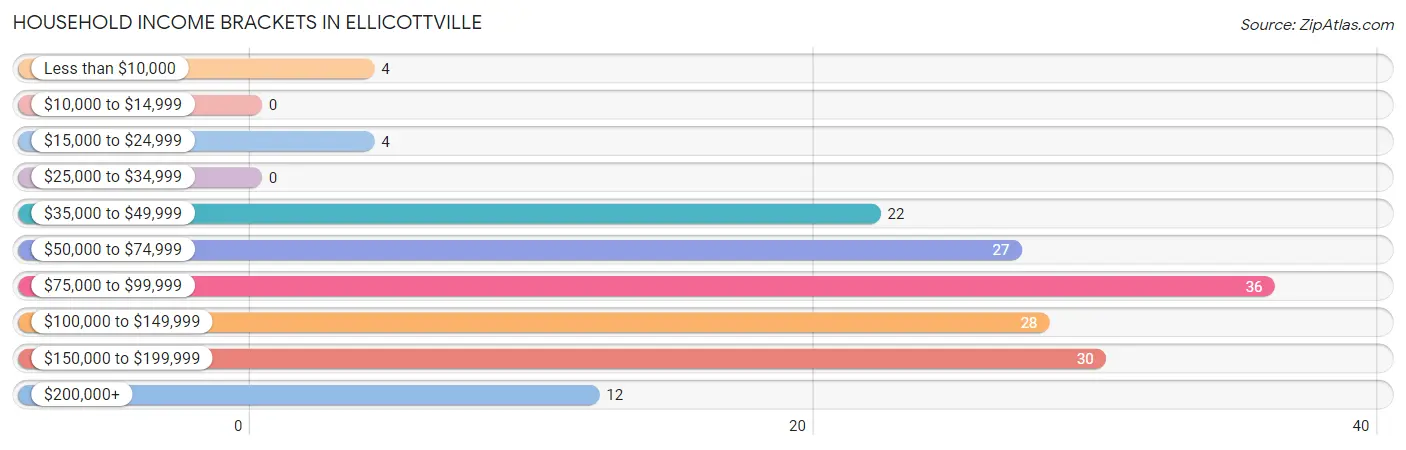
| Income Bracket | # Households | % Households |
| Less than $10,000 | 4 | 2.5% |
| $10,000 to $14,999 | 0 | 0.0% |
| $15,000 to $24,999 | 4 | 2.5% |
| $25,000 to $34,999 | 0 | 0.0% |
| $35,000 to $49,999 | 22 | 13.5% |
| $50,000 to $74,999 | 27 | 16.6% |
| $75,000 to $99,999 | 36 | 22.1% |
| $100,000 to $149,999 | 28 | 17.2% |
| $150,000 to $199,999 | 30 | 18.4% |
| $200,000+ | 12 | 7.4% |
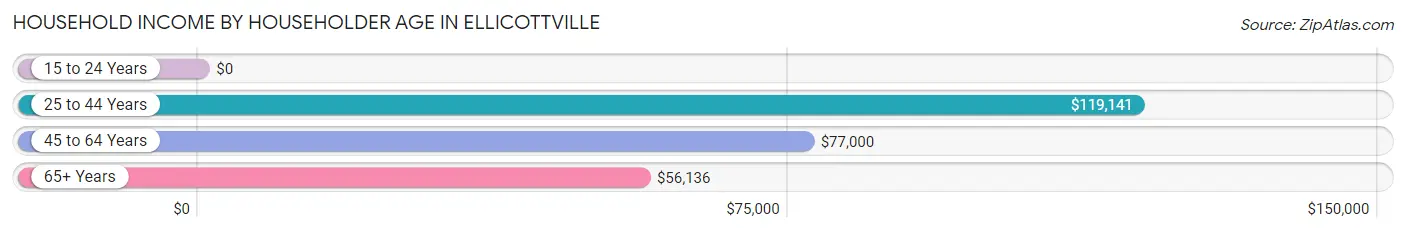
Household Income by Householder Age in Ellicottville
The median household income in Ellicottville is $88,646, with the highest median household income of $119,141 found in the 25 to 44 years age bracket for the primary householder. A total of 55 households (33.7%) fall into this category. Meanwhile, the 15 to 24 years age bracket for the primary householder has the lowest median household income of $0, with 2 households (1.2%) in this group.
| Income Bracket | # Households | Median Income |
| 15 to 24 Years | 2 (1.2%) | $0 |
| 25 to 44 Years | 55 (33.7%) | $119,141 |
| 45 to 64 Years | 42 (25.8%) | $77,000 |
| 65+ Years | 64 (39.3%) | $56,136 |
| Total | 163 (100.0%) | $88,646 |
Poverty in Ellicottville
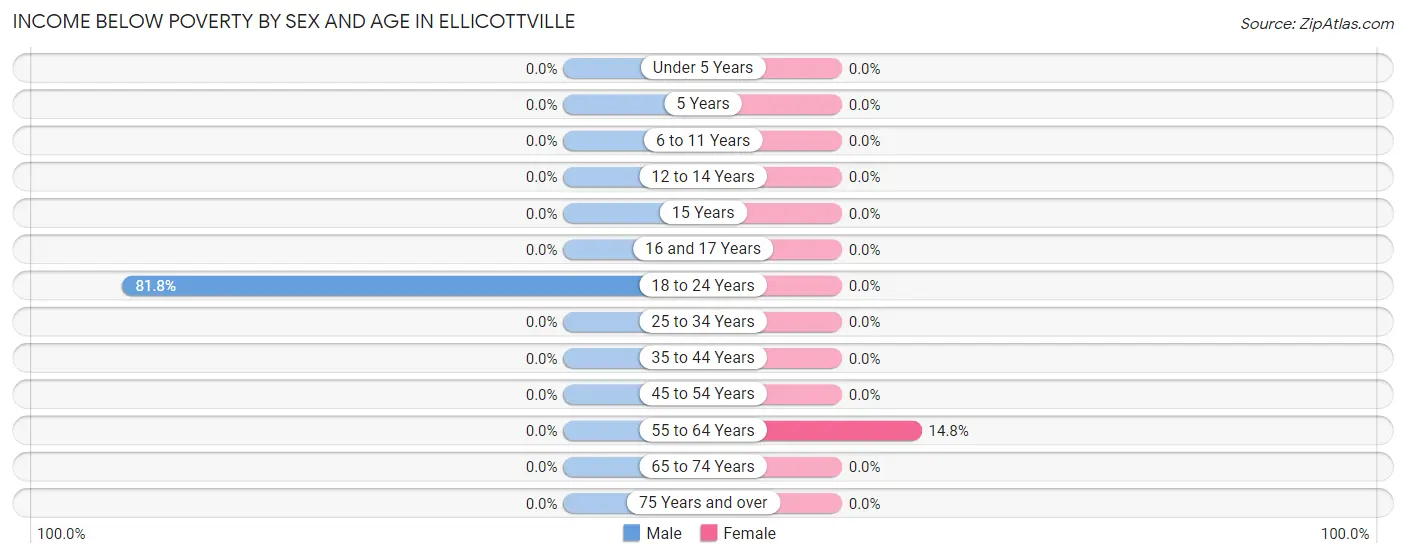
Income Below Poverty by Sex and Age in Ellicottville
With 4.3% poverty level for males and 2.4% for females among the residents of Ellicottville, 18 to 24 year old males and 55 to 64 year old females are the most vulnerable to poverty, with 9 males (81.8%) and 4 females (14.8%) in their respective age groups living below the poverty level.
| Age Bracket | Male | Female |
| Under 5 Years | 0 (0.0%) | 0 (0.0%) |
| 5 Years | 0 (0.0%) | 0 (0.0%) |
| 6 to 11 Years | 0 (0.0%) | 0 (0.0%) |
| 12 to 14 Years | 0 (0.0%) | 0 (0.0%) |
| 15 Years | 0 (0.0%) | 0 (0.0%) |
| 16 and 17 Years | 0 (0.0%) | 0 (0.0%) |
| 18 to 24 Years | 9 (81.8%) | 0 (0.0%) |
| 25 to 34 Years | 0 (0.0%) | 0 (0.0%) |
| 35 to 44 Years | 0 (0.0%) | 0 (0.0%) |
| 45 to 54 Years | 0 (0.0%) | 0 (0.0%) |
| 55 to 64 Years | 0 (0.0%) | 4 (14.8%) |
| 65 to 74 Years | 0 (0.0%) | 0 (0.0%) |
| 75 Years and over | 0 (0.0%) | 0 (0.0%) |
| Total | 9 (4.3%) | 4 (2.4%) |
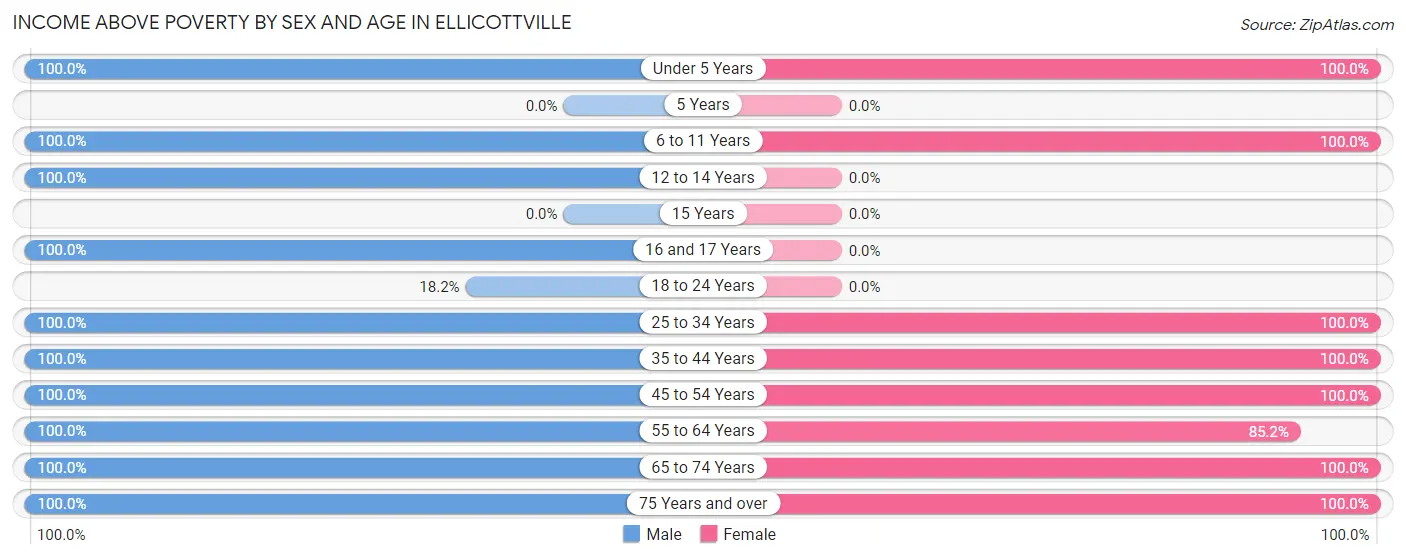
Income Above Poverty by Sex and Age in Ellicottville
According to the poverty statistics in Ellicottville, males aged under 5 years and females aged under 5 years are the age groups that are most secure financially, with 100.0% of males and 100.0% of females in these age groups living above the poverty line.
| Age Bracket | Male | Female |
| Under 5 Years | 33 (100.0%) | 7 (100.0%) |
| 5 Years | 0 (0.0%) | 0 (0.0%) |
| 6 to 11 Years | 12 (100.0%) | 2 (100.0%) |
| 12 to 14 Years | 11 (100.0%) | 0 (0.0%) |
| 15 Years | 0 (0.0%) | 0 (0.0%) |
| 16 and 17 Years | 14 (100.0%) | 0 (0.0%) |
| 18 to 24 Years | 2 (18.2%) | 0 (0.0%) |
| 25 to 34 Years | 15 (100.0%) | 17 (100.0%) |
| 35 to 44 Years | 32 (100.0%) | 35 (100.0%) |
| 45 to 54 Years | 11 (100.0%) | 17 (100.0%) |
| 55 to 64 Years | 13 (100.0%) | 23 (85.2%) |
| 65 to 74 Years | 43 (100.0%) | 50 (100.0%) |
| 75 Years and over | 15 (100.0%) | 9 (100.0%) |
| Total | 201 (95.7%) | 160 (97.6%) |
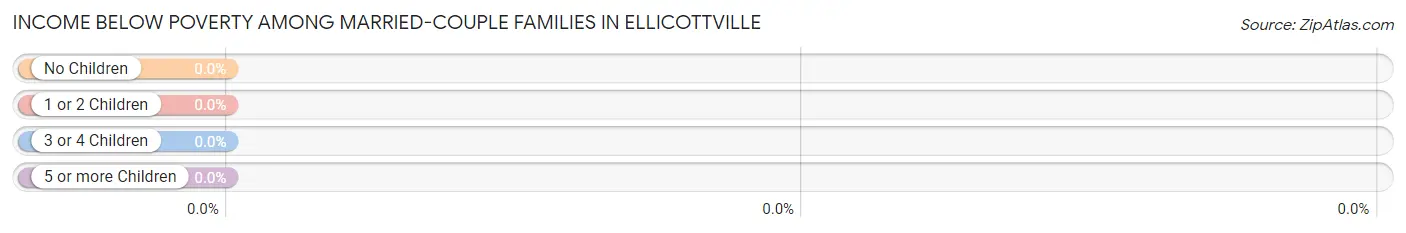
Income Below Poverty Among Married-Couple Families in Ellicottville
| Children | Above Poverty | Below Poverty |
| No Children | 66 (100.0%) | 0 (0.0%) |
| 1 or 2 Children | 37 (100.0%) | 0 (0.0%) |
| 3 or 4 Children | 0 (0.0%) | 0 (0.0%) |
| 5 or more Children | 0 (0.0%) | 0 (0.0%) |
| Total | 103 (100.0%) | 0 (0.0%) |
Income Below Poverty Among Single-Parent Households in Ellicottville
| Children | Single Father | Single Mother |
| No Children | 0 (0.0%) | 0 (0.0%) |
| 1 or 2 Children | 0 (0.0%) | 0 (0.0%) |
| 3 or 4 Children | 0 (0.0%) | 0 (0.0%) |
| 5 or more Children | 0 (0.0%) | 0 (0.0%) |
| Total | 0 (0.0%) | 0 (0.0%) |
Income Below Poverty Among Married-Couple vs Single-Parent Households in Ellicottville
| Children | Married-Couple Families | Single-Parent Households |
| No Children | 0 (0.0%) | 0 (0.0%) |
| 1 or 2 Children | 0 (0.0%) | 0 (0.0%) |
| 3 or 4 Children | 0 (0.0%) | 0 (0.0%) |
| 5 or more Children | 0 (0.0%) | 0 (0.0%) |
| Total | 0 (0.0%) | 0 (0.0%) |
Race in Ellicottville
The most populous races in Ellicottville are , and White / Caucasian (374 | 100.0%).
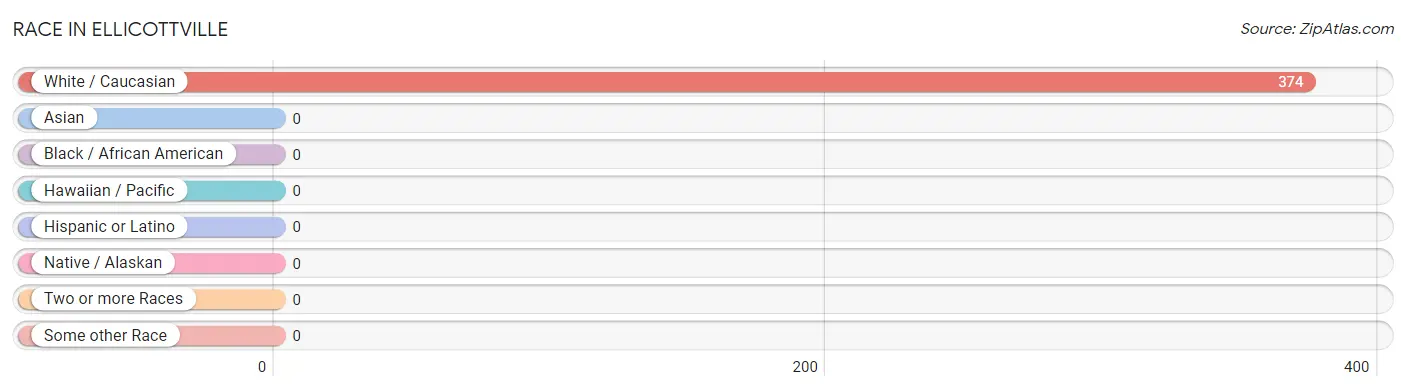
| Race | # Population | % Population |
| Asian | 0 | 0.0% |
| Black / African American | 0 | 0.0% |
| Hawaiian / Pacific | 0 | 0.0% |
| Hispanic or Latino | 0 | 0.0% |
| Native / Alaskan | 0 | 0.0% |
| White / Caucasian | 374 | 100.0% |
| Two or more Races | 0 | 0.0% |
| Some other Race | 0 | 0.0% |
| Total | 374 | 100.0% |
Ancestry in Ellicottville
The most populous ancestries reported in Ellicottville are German (175 | 46.8%), Irish (156 | 41.7%), Italian (71 | 19.0%), English (67 | 17.9%), and Polish (12 | 3.2%), together accounting for 128.6% of all Ellicottville residents.
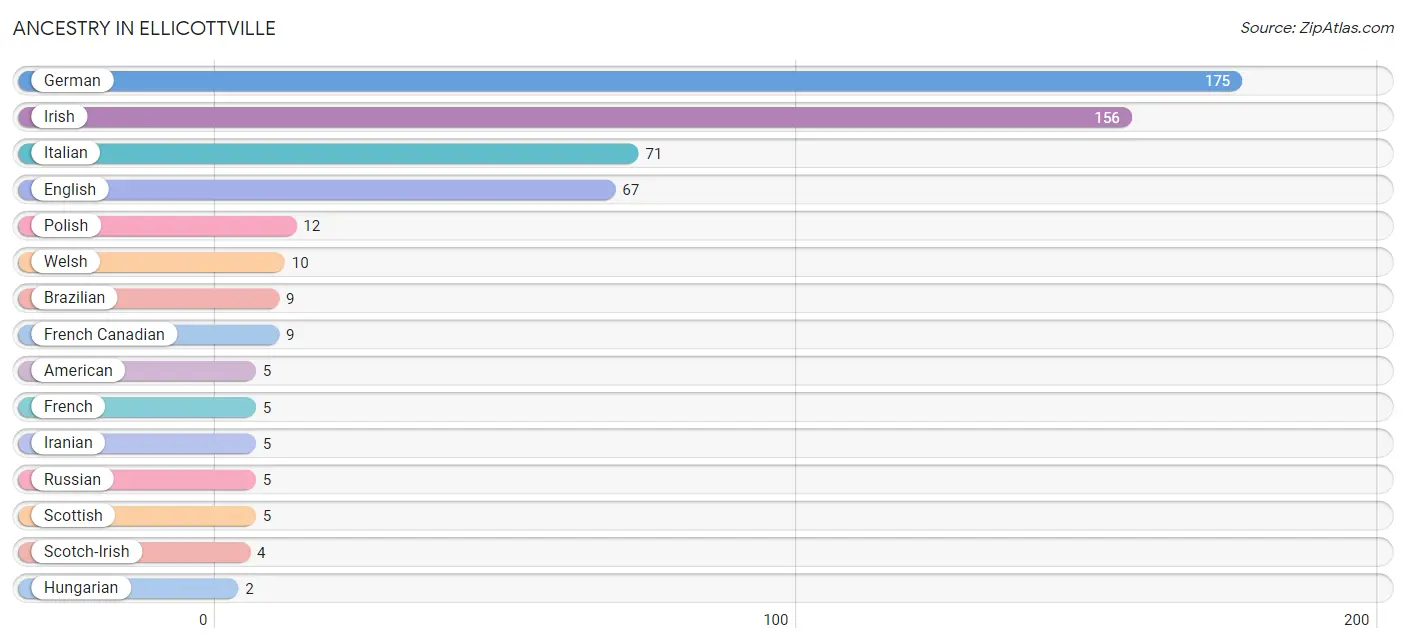
| Ancestry | # Population | % Population |
| American | 5 | 1.3% |
| Brazilian | 9 | 2.4% |
| English | 67 | 17.9% |
| French | 5 | 1.3% |
| French Canadian | 9 | 2.4% |
| German | 175 | 46.8% |
| Hungarian | 2 | 0.5% |
| Iranian | 5 | 1.3% |
| Irish | 156 | 41.7% |
| Italian | 71 | 19.0% |
| Polish | 12 | 3.2% |
| Russian | 5 | 1.3% |
| Scotch-Irish | 4 | 1.1% |
| Scottish | 5 | 1.3% |
| Swedish | 1 | 0.3% |
| Welsh | 10 | 2.7% | View All 16 Rows |
Immigrants in Ellicottville
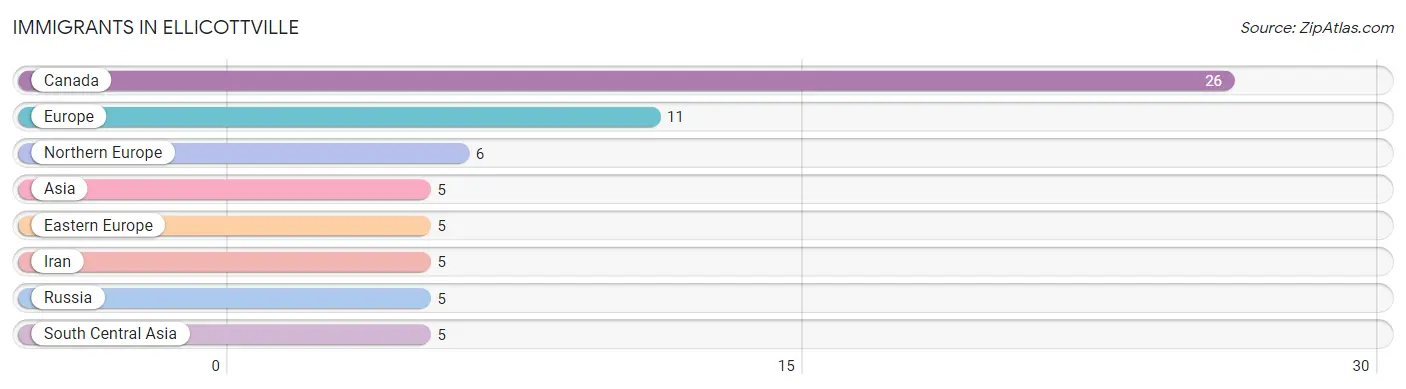
The most numerous immigrant groups reported in Ellicottville came from Canada (26 | 7.0%), Europe (11 | 2.9%), Northern Europe (6 | 1.6%), Asia (5 | 1.3%), and Eastern Europe (5 | 1.3%), together accounting for 14.2% of all Ellicottville residents.
| Immigration Origin | # Population | % Population |
| Asia | 5 | 1.3% |
| Canada | 26 | 7.0% |
| Eastern Europe | 5 | 1.3% |
| Europe | 11 | 2.9% |
| Iran | 5 | 1.3% |
| Northern Europe | 6 | 1.6% |
| Russia | 5 | 1.3% |
| South Central Asia | 5 | 1.3% | View All 8 Rows |
Sex and Age in Ellicottville
Sex and Age in Ellicottville
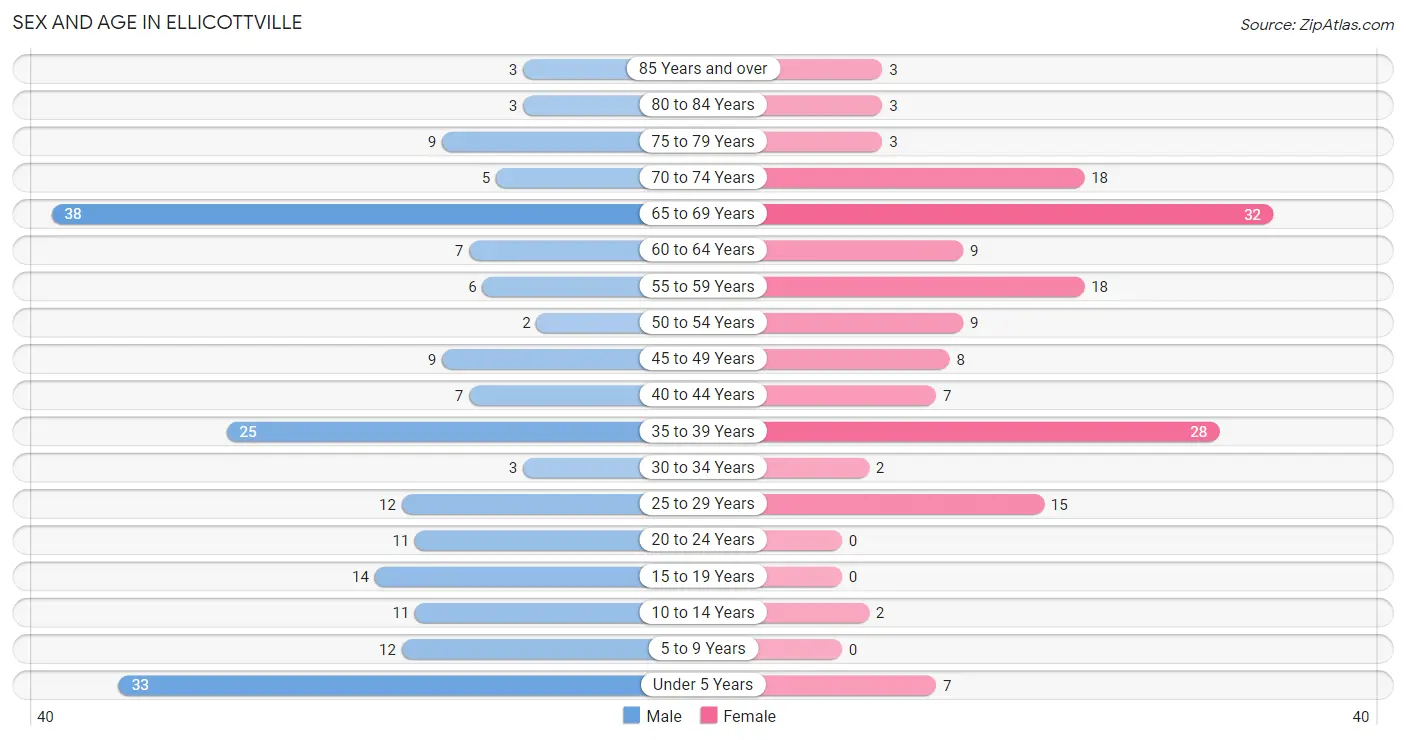
The most populous age groups in Ellicottville are 65 to 69 Years (38 | 18.1%) for men and 65 to 69 Years (32 | 19.5%) for women.
| Age Bracket | Male | Female |
| Under 5 Years | 33 (15.7%) | 7 (4.3%) |
| 5 to 9 Years | 12 (5.7%) | 0 (0.0%) |
| 10 to 14 Years | 11 (5.2%) | 2 (1.2%) |
| 15 to 19 Years | 14 (6.7%) | 0 (0.0%) |
| 20 to 24 Years | 11 (5.2%) | 0 (0.0%) |
| 25 to 29 Years | 12 (5.7%) | 15 (9.1%) |
| 30 to 34 Years | 3 (1.4%) | 2 (1.2%) |
| 35 to 39 Years | 25 (11.9%) | 28 (17.1%) |
| 40 to 44 Years | 7 (3.3%) | 7 (4.3%) |
| 45 to 49 Years | 9 (4.3%) | 8 (4.9%) |
| 50 to 54 Years | 2 (0.9%) | 9 (5.5%) |
| 55 to 59 Years | 6 (2.9%) | 18 (11.0%) |
| 60 to 64 Years | 7 (3.3%) | 9 (5.5%) |
| 65 to 69 Years | 38 (18.1%) | 32 (19.5%) |
| 70 to 74 Years | 5 (2.4%) | 18 (11.0%) |
| 75 to 79 Years | 9 (4.3%) | 3 (1.8%) |
| 80 to 84 Years | 3 (1.4%) | 3 (1.8%) |
| 85 Years and over | 3 (1.4%) | 3 (1.8%) |
| Total | 210 (100.0%) | 164 (100.0%) |
Families and Households in Ellicottville
Median Family Size in Ellicottville
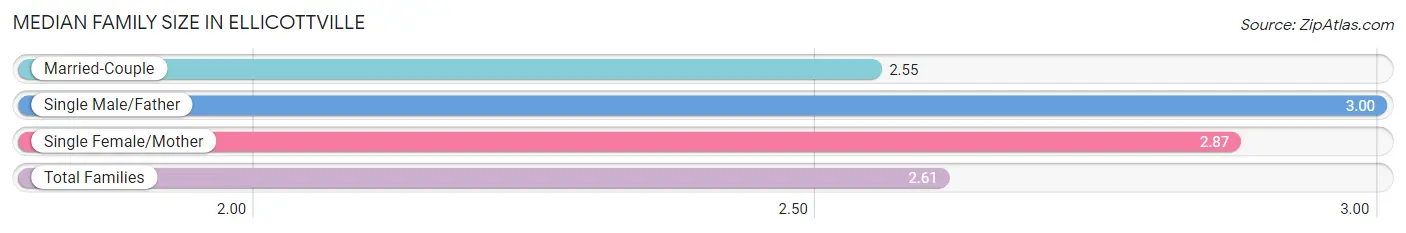
The median family size in Ellicottville is 2.61 persons per family, with single male/father families (5 | 4.1%) accounting for the largest median family size of 3 persons per family. On the other hand, married-couple families (103 | 83.7%) represent the smallest median family size with 2.55 persons per family.
| Family Type | # Families | Family Size |
| Married-Couple | 103 (83.7%) | 2.55 |
| Single Male/Father | 5 (4.1%) | 3.00 |
| Single Female/Mother | 15 (12.2%) | 2.87 |
| Total Families | 123 (100.0%) | 2.61 |
Median Household Size in Ellicottville
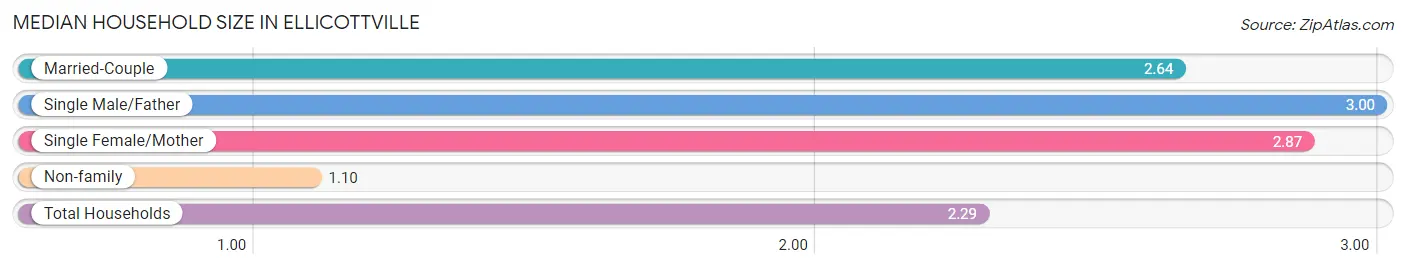
The median household size in Ellicottville is 2.29 persons per household, with single male/father households (5 | 3.1%) accounting for the largest median household size of 3 persons per household. non-family households (40 | 24.5%) represent the smallest median household size with 1.10 persons per household.
| Household Type | # Households | Household Size |
| Married-Couple | 103 (63.2%) | 2.64 |
| Single Male/Father | 5 (3.1%) | 3.00 |
| Single Female/Mother | 15 (9.2%) | 2.87 |
| Non-family | 40 (24.5%) | 1.10 |
| Total Households | 163 (100.0%) | 2.29 |
Household Size by Marriage Status in Ellicottville
Out of a total of 163 households in Ellicottville, 123 (75.5%) are family households, while 40 (24.5%) are nonfamily households. The most numerous type of family households are 2-person households, comprising 66, and the most common type of nonfamily households are 1-person households, comprising 35.
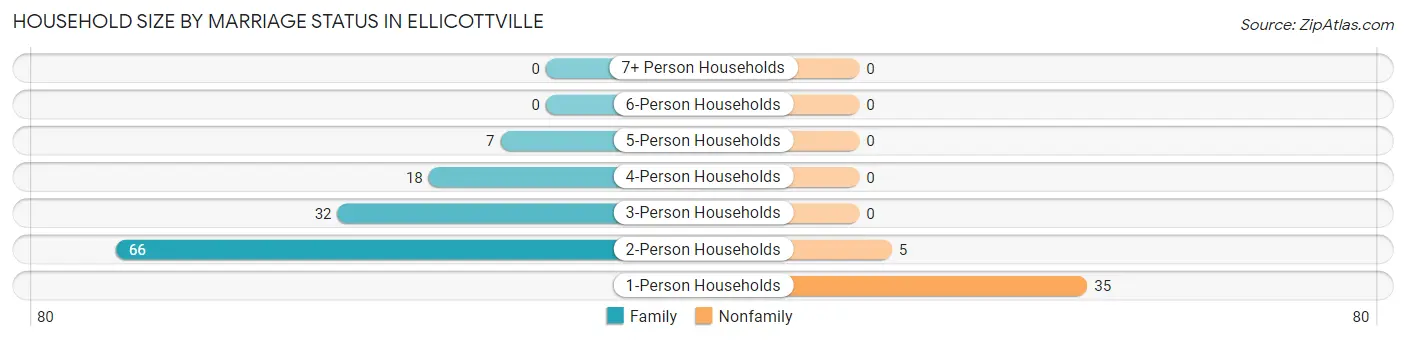
| Household Size | Family Households | Nonfamily Households |
| 1-Person Households | - | 35 (21.5%) |
| 2-Person Households | 66 (40.5%) | 5 (3.1%) |
| 3-Person Households | 32 (19.6%) | 0 (0.0%) |
| 4-Person Households | 18 (11.0%) | 0 (0.0%) |
| 5-Person Households | 7 (4.3%) | 0 (0.0%) |
| 6-Person Households | 0 (0.0%) | 0 (0.0%) |
| 7+ Person Households | 0 (0.0%) | 0 (0.0%) |
| Total | 123 (75.5%) | 40 (24.5%) |
Female Fertility in Ellicottville
Fertility by Age in Ellicottville
Average fertility rate in Ellicottville is 48.0 births per 1,000 women. Women in the age bracket of 20 to 34 years have the highest fertility rate with 176.0 births per 1,000 women. Women in the age bracket of 20 to 34 years acount for 100.0% of all women with births.
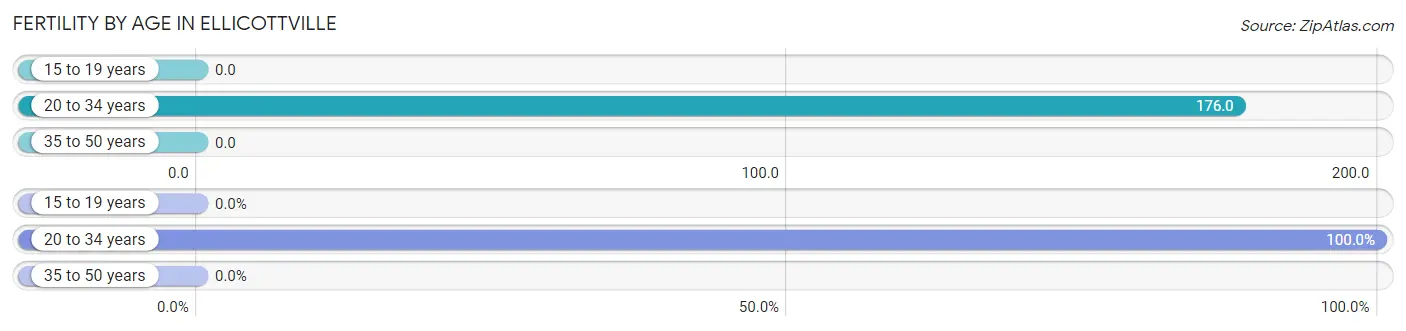
| Age Bracket | Women with Births | Births / 1,000 Women |
| 15 to 19 years | 0 (0.0%) | 0.0 |
| 20 to 34 years | 3 (100.0%) | 176.0 |
| 35 to 50 years | 0 (0.0%) | 0.0 |
| Total | 3 (100.0%) | 48.0 |
Fertility by Age by Marriage Status in Ellicottville
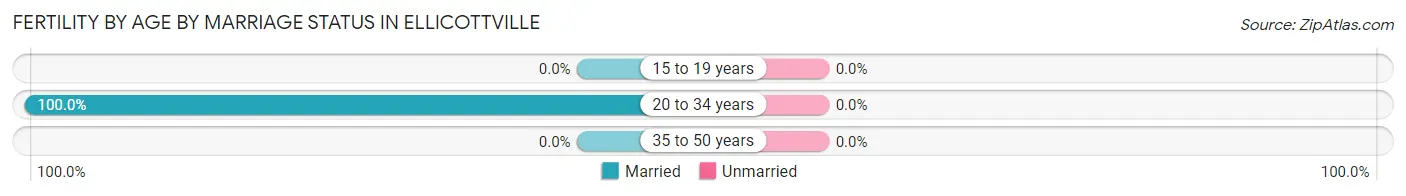
| Age Bracket | Married | Unmarried |
| 15 to 19 years | 0 (0.0%) | 0 (0.0%) |
| 20 to 34 years | 3 (100.0%) | 0 (0.0%) |
| 35 to 50 years | 0 (0.0%) | 0 (0.0%) |
| Total | 3 (100.0%) | 0 (0.0%) |
Fertility by Education in Ellicottville
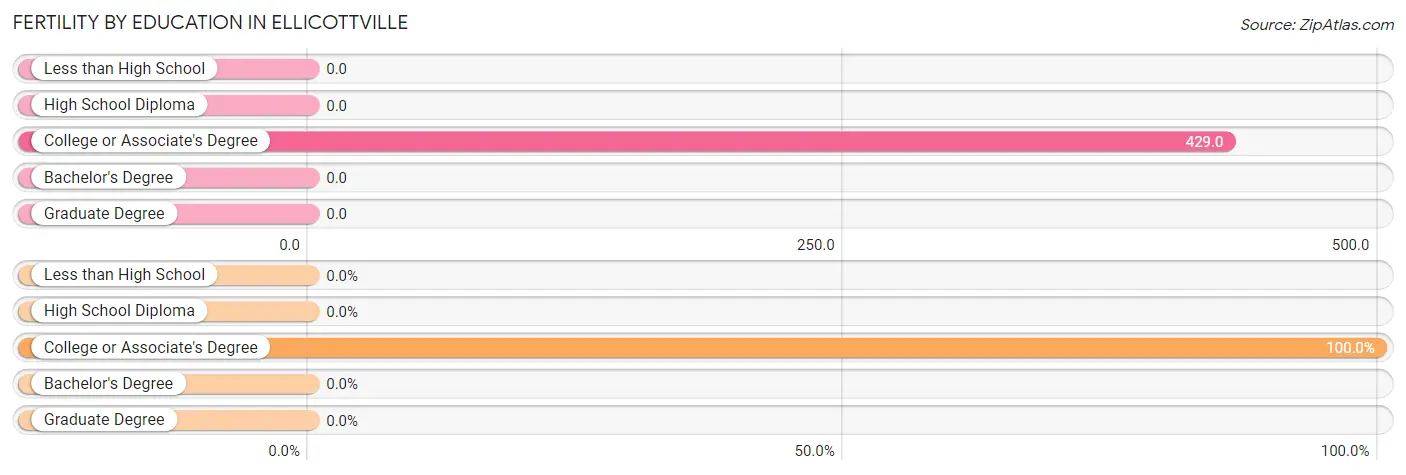
| Educational Attainment | Women with Births | Births / 1,000 Women |
| Less than High School | 0 (0.0%) | 0.0 |
| High School Diploma | 0 (0.0%) | 0.0 |
| College or Associate's Degree | 3 (100.0%) | 429.0 |
| Bachelor's Degree | 0 (0.0%) | 0.0 |
| Graduate Degree | 0 (0.0%) | 0.0 |
| Total | 3 (100.0%) | 48.0 |
Fertility by Education by Marriage Status in Ellicottville
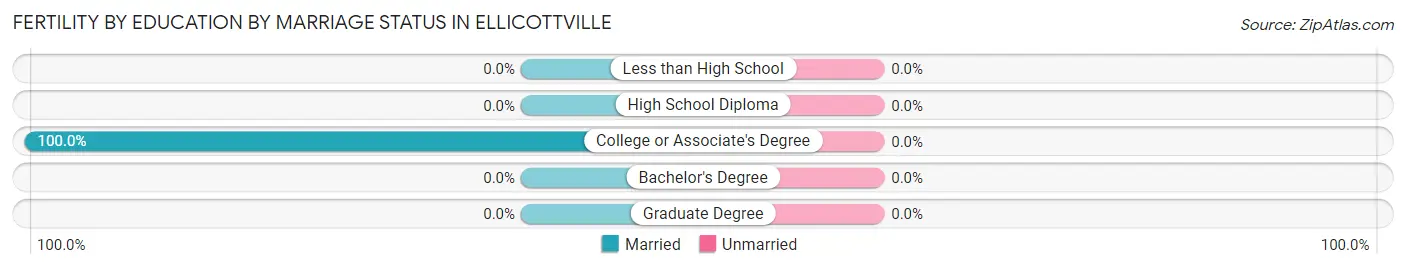
| Educational Attainment | Married | Unmarried |
| Less than High School | 0 (0.0%) | 0 (0.0%) |
| High School Diploma | 0 (0.0%) | 0 (0.0%) |
| College or Associate's Degree | 3 (100.0%) | 0 (0.0%) |
| Bachelor's Degree | 0 (0.0%) | 0 (0.0%) |
| Graduate Degree | 0 (0.0%) | 0 (0.0%) |
| Total | 3 (100.0%) | 0 (0.0%) |
Employment Characteristics in Ellicottville
Employment by Class of Employer in Ellicottville
Among the 187 employed individuals in Ellicottville, private company employees (120 | 64.2%), local government employees (38 | 20.3%), and self-employed (incorporated) (14 | 7.5%) make up the most common classes of employment.
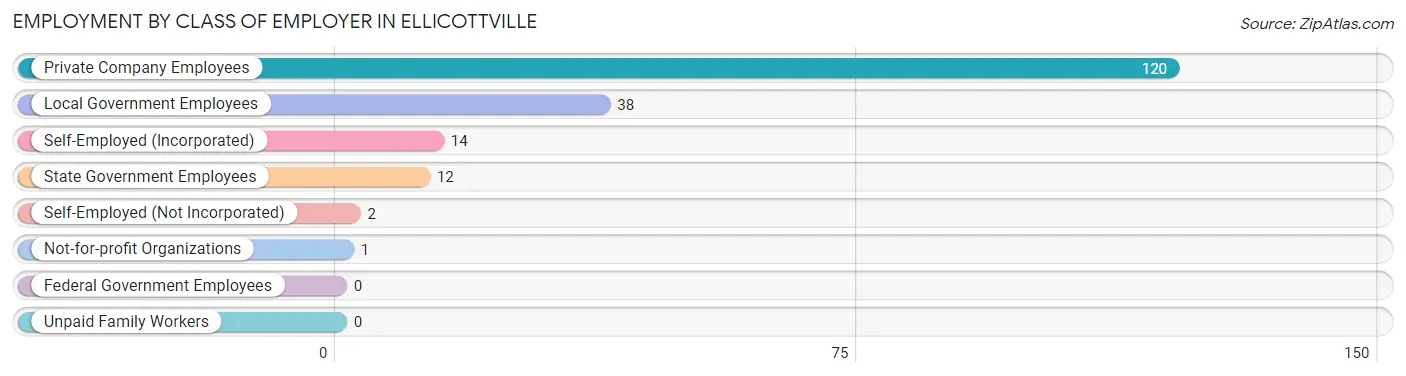
| Employer Class | # Employees | % Employees |
| Private Company Employees | 120 | 64.2% |
| Self-Employed (Incorporated) | 14 | 7.5% |
| Self-Employed (Not Incorporated) | 2 | 1.1% |
| Not-for-profit Organizations | 1 | 0.5% |
| Local Government Employees | 38 | 20.3% |
| State Government Employees | 12 | 6.4% |
| Federal Government Employees | 0 | 0.0% |
| Unpaid Family Workers | 0 | 0.0% |
| Total | 187 | 100.0% |
Employment Status by Age in Ellicottville
According to the labor force statistics for Ellicottville, out of the total population over 16 years of age (309), 67.3% or 208 individuals are in the labor force, with 8.7% or 18 of them unemployed. The age group with the highest labor force participation rate is 20 to 24 years, with 100.0% or 11 individuals in the labor force. Within the labor force, the 16 to 19 years age range has the highest percentage of unemployed individuals, with 100.0% or 11 of them being unemployed.
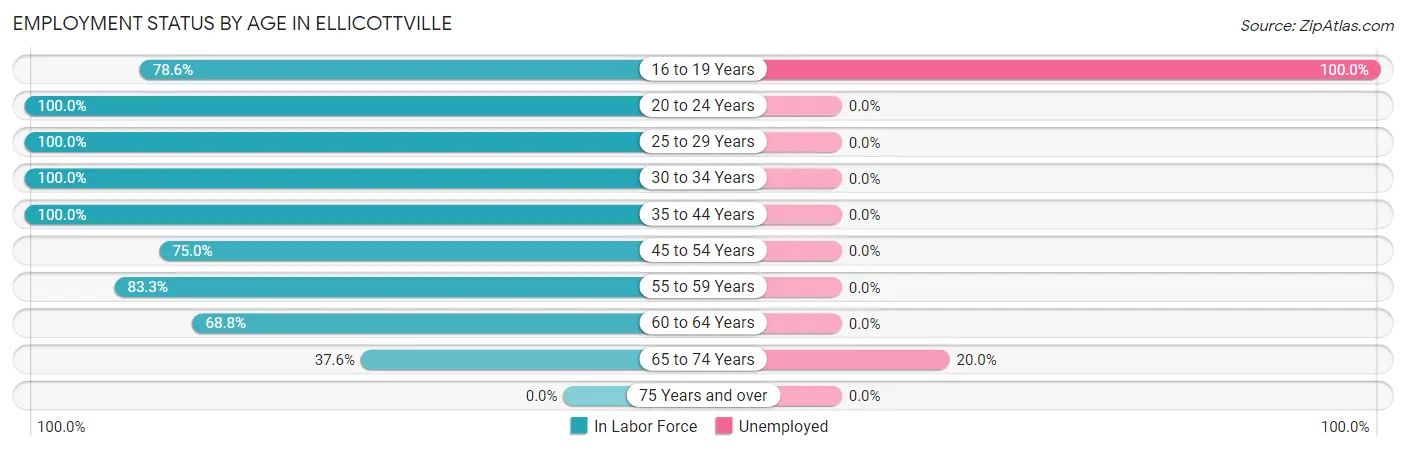
| Age Bracket | In Labor Force | Unemployed |
| 16 to 19 Years | 11 (78.6%) | 11 (100.0%) |
| 20 to 24 Years | 11 (100.0%) | 0 (0.0%) |
| 25 to 29 Years | 27 (100.0%) | 0 (0.0%) |
| 30 to 34 Years | 5 (100.0%) | 0 (0.0%) |
| 35 to 44 Years | 67 (100.0%) | 0 (0.0%) |
| 45 to 54 Years | 21 (75.0%) | 0 (0.0%) |
| 55 to 59 Years | 20 (83.3%) | 0 (0.0%) |
| 60 to 64 Years | 11 (68.8%) | 0 (0.0%) |
| 65 to 74 Years | 35 (37.6%) | 7 (20.0%) |
| 75 Years and over | 0 (0.0%) | 0 (0.0%) |
| Total | 208 (67.3%) | 18 (8.7%) |
Employment Status by Educational Attainment in Ellicottville
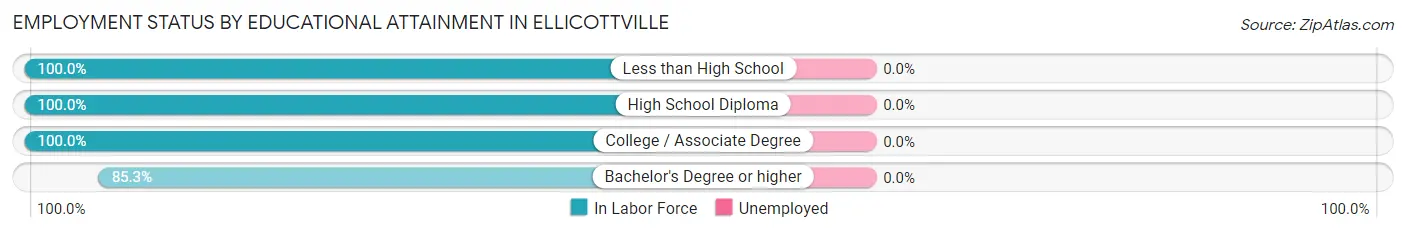
| Educational Attainment | In Labor Force | Unemployed |
| Less than High School | 2 (100.0%) | 0 (0.0%) |
| High School Diploma | 21 (100.0%) | 0 (0.0%) |
| College / Associate Degree | 35 (100.0%) | 0 (0.0%) |
| Bachelor's Degree or higher | 93 (85.3%) | 0 (0.0%) |
| Total | 151 (90.4%) | 0 (0.0%) |
Employment Occupations by Sex in Ellicottville
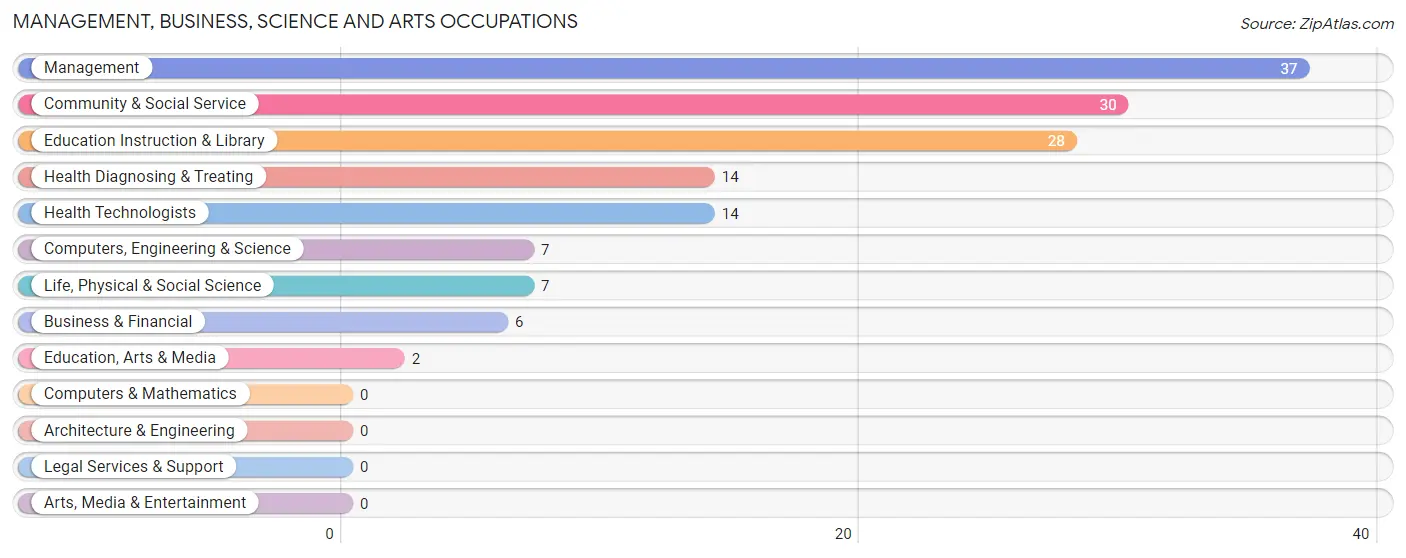
Management, Business, Science and Arts Occupations
The most common Management, Business, Science and Arts occupations in Ellicottville are Management (37 | 19.5%), Community & Social Service (30 | 15.8%), Education Instruction & Library (28 | 14.7%), Health Diagnosing & Treating (14 | 7.4%), and Health Technologists (14 | 7.4%).
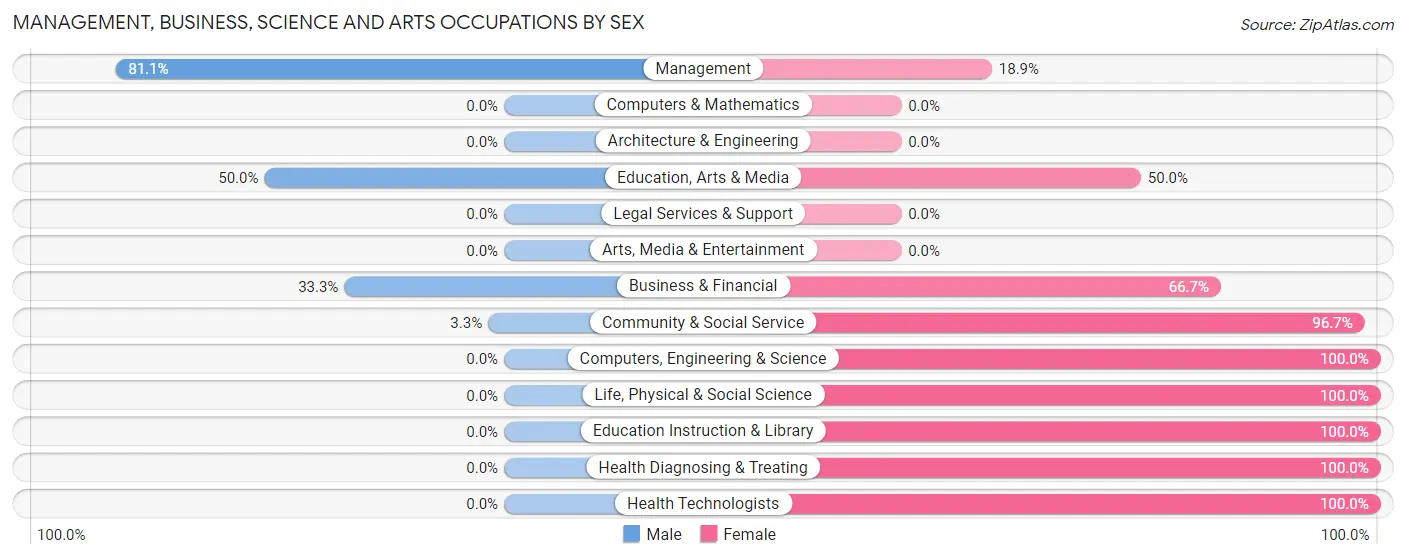
Management, Business, Science and Arts Occupations by Sex
Within the Management, Business, Science and Arts occupations in Ellicottville, the most male-oriented occupations are Management (81.1%), Education, Arts & Media (50.0%), and Business & Financial (33.3%), while the most female-oriented occupations are Computers, Engineering & Science (100.0%), Life, Physical & Social Science (100.0%), and Education Instruction & Library (100.0%).
| Occupation | Male | Female |
| Management | 30 (81.1%) | 7 (18.9%) |
| Business & Financial | 2 (33.3%) | 4 (66.7%) |
| Computers, Engineering & Science | 0 (0.0%) | 7 (100.0%) |
| Computers & Mathematics | 0 (0.0%) | 0 (0.0%) |
| Architecture & Engineering | 0 (0.0%) | 0 (0.0%) |
| Life, Physical & Social Science | 0 (0.0%) | 7 (100.0%) |
| Community & Social Service | 1 (3.3%) | 29 (96.7%) |
| Education, Arts & Media | 1 (50.0%) | 1 (50.0%) |
| Legal Services & Support | 0 (0.0%) | 0 (0.0%) |
| Education Instruction & Library | 0 (0.0%) | 28 (100.0%) |
| Arts, Media & Entertainment | 0 (0.0%) | 0 (0.0%) |
| Health Diagnosing & Treating | 0 (0.0%) | 14 (100.0%) |
| Health Technologists | 0 (0.0%) | 14 (100.0%) |
| Total (Category) | 33 (35.1%) | 61 (64.9%) |
| Total (Overall) | 97 (51.0%) | 93 (48.9%) |
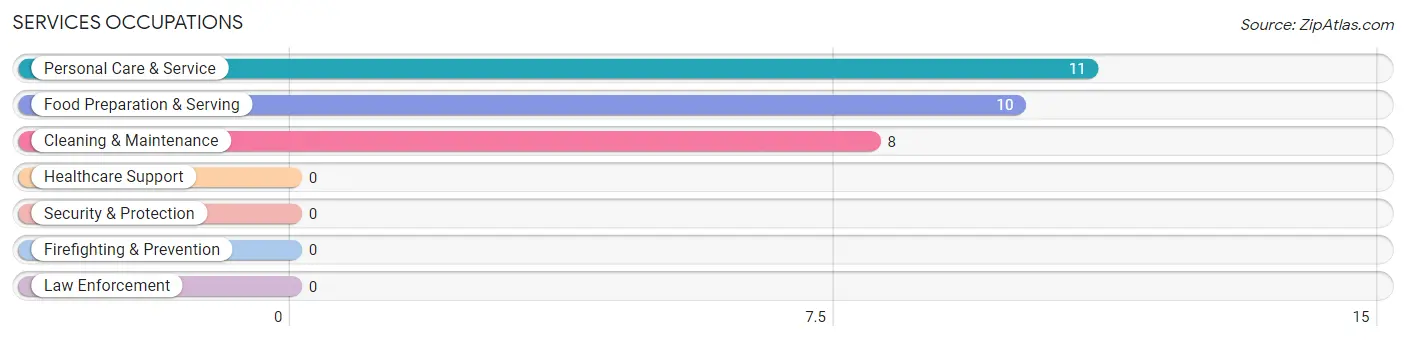
Services Occupations
The most common Services occupations in Ellicottville are Personal Care & Service (11 | 5.8%), Food Preparation & Serving (10 | 5.3%), and Cleaning & Maintenance (8 | 4.2%).
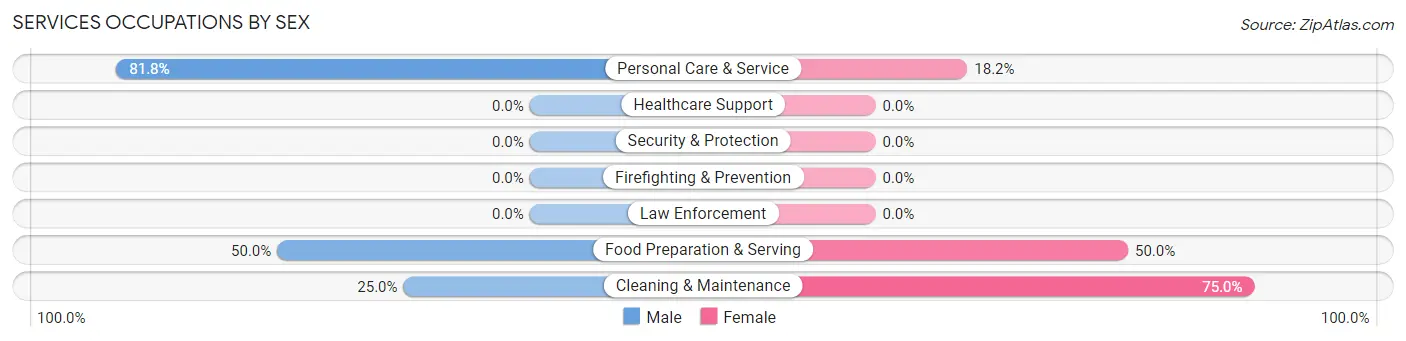
Services Occupations by Sex
Within the Services occupations in Ellicottville, the most male-oriented occupations are Personal Care & Service (81.8%), Food Preparation & Serving (50.0%), and Cleaning & Maintenance (25.0%), while the most female-oriented occupations are Cleaning & Maintenance (75.0%), Food Preparation & Serving (50.0%), and Personal Care & Service (18.2%).
| Occupation | Male | Female |
| Healthcare Support | 0 (0.0%) | 0 (0.0%) |
| Security & Protection | 0 (0.0%) | 0 (0.0%) |
| Firefighting & Prevention | 0 (0.0%) | 0 (0.0%) |
| Law Enforcement | 0 (0.0%) | 0 (0.0%) |
| Food Preparation & Serving | 5 (50.0%) | 5 (50.0%) |
| Cleaning & Maintenance | 2 (25.0%) | 6 (75.0%) |
| Personal Care & Service | 9 (81.8%) | 2 (18.2%) |
| Total (Category) | 16 (55.2%) | 13 (44.8%) |
| Total (Overall) | 97 (51.0%) | 93 (48.9%) |
Sales and Office Occupations
The most common Sales and Office occupations in Ellicottville are Sales & Related (40 | 21.0%), and Office & Administration (16 | 8.4%).
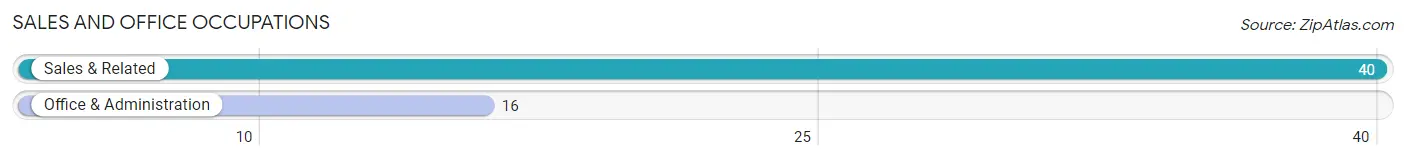
Sales and Office Occupations by Sex
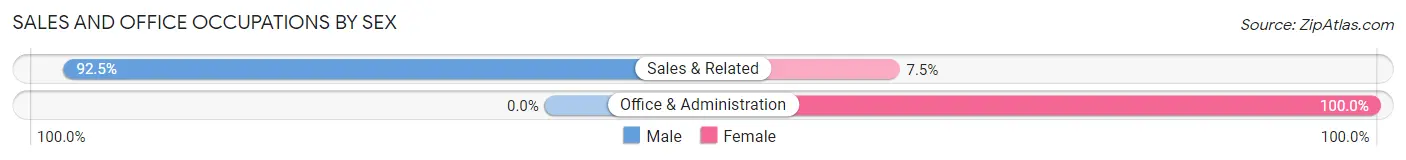
| Occupation | Male | Female |
| Sales & Related | 37 (92.5%) | 3 (7.5%) |
| Office & Administration | 0 (0.0%) | 16 (100.0%) |
| Total (Category) | 37 (66.1%) | 19 (33.9%) |
| Total (Overall) | 97 (51.0%) | 93 (48.9%) |
Natural Resources, Construction and Maintenance Occupations
The most common Natural Resources, Construction and Maintenance occupations in Ellicottville are Construction & Extraction (7 | 3.7%), and Installation, Maintenance & Repair (2 | 1.1%).
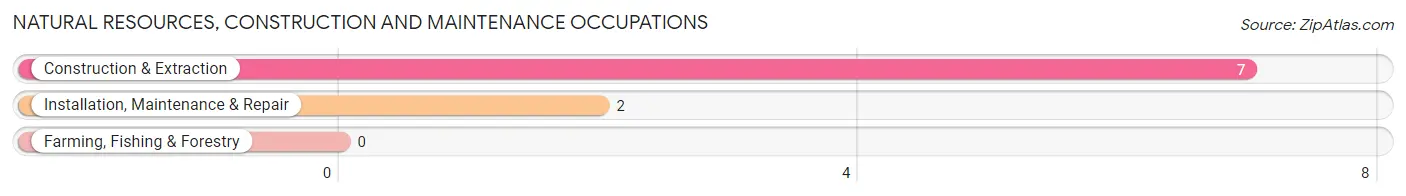
Natural Resources, Construction and Maintenance Occupations by Sex
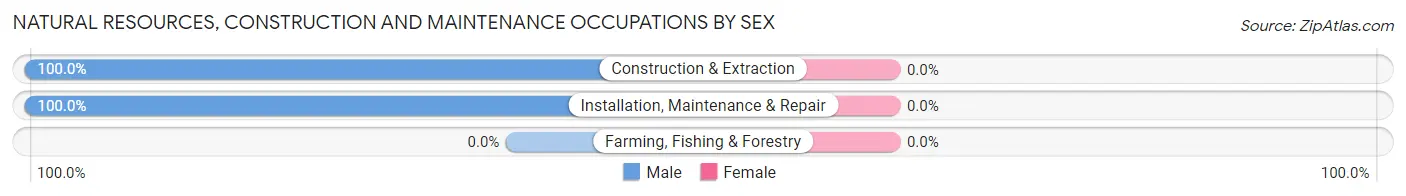
| Occupation | Male | Female |
| Farming, Fishing & Forestry | 0 (0.0%) | 0 (0.0%) |
| Construction & Extraction | 7 (100.0%) | 0 (0.0%) |
| Installation, Maintenance & Repair | 2 (100.0%) | 0 (0.0%) |
| Total (Category) | 9 (100.0%) | 0 (0.0%) |
| Total (Overall) | 97 (51.0%) | 93 (48.9%) |
Production, Transportation and Moving Occupations
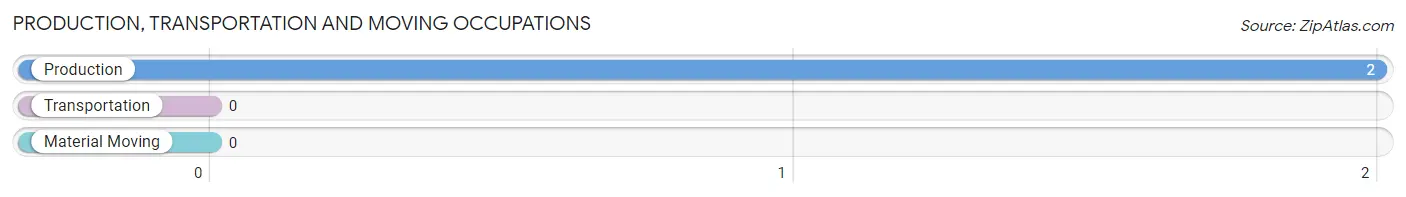
The most common Production, Transportation and Moving occupations in Ellicottville are , and Production (2 | 1.1%).
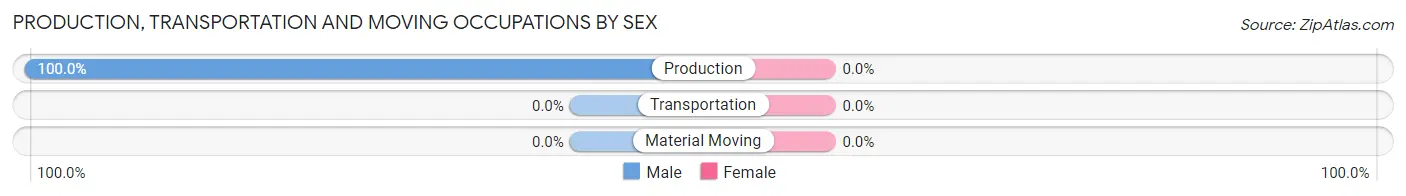
Production, Transportation and Moving Occupations by Sex
| Occupation | Male | Female |
| Production | 2 (100.0%) | 0 (0.0%) |
| Transportation | 0 (0.0%) | 0 (0.0%) |
| Material Moving | 0 (0.0%) | 0 (0.0%) |
| Total (Category) | 2 (100.0%) | 0 (0.0%) |
| Total (Overall) | 97 (51.0%) | 93 (48.9%) |
Employment Industries by Sex in Ellicottville
Employment Industries in Ellicottville
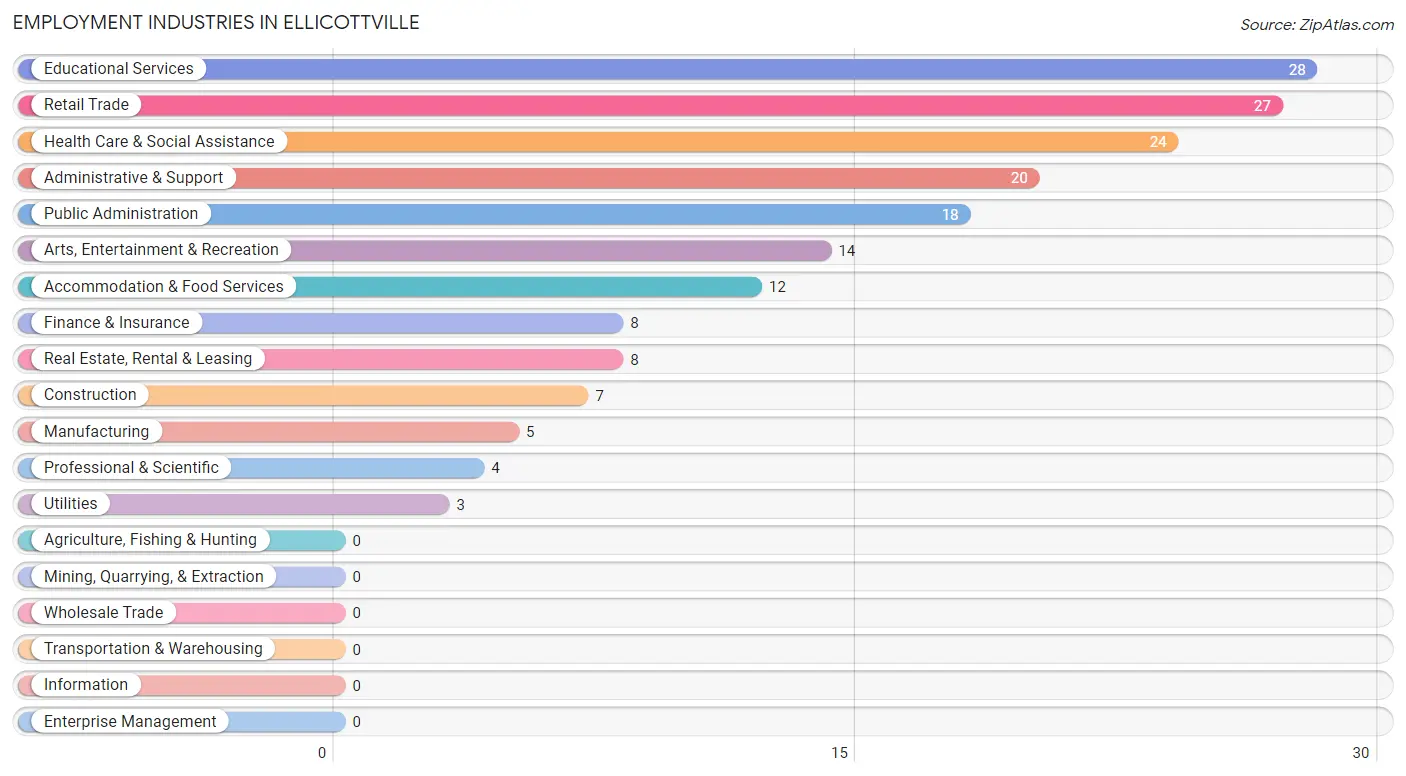
The major employment industries in Ellicottville include Educational Services (28 | 14.7%), Retail Trade (27 | 14.2%), Health Care & Social Assistance (24 | 12.6%), Administrative & Support (20 | 10.5%), and Public Administration (18 | 9.5%).
Employment Industries by Sex in Ellicottville
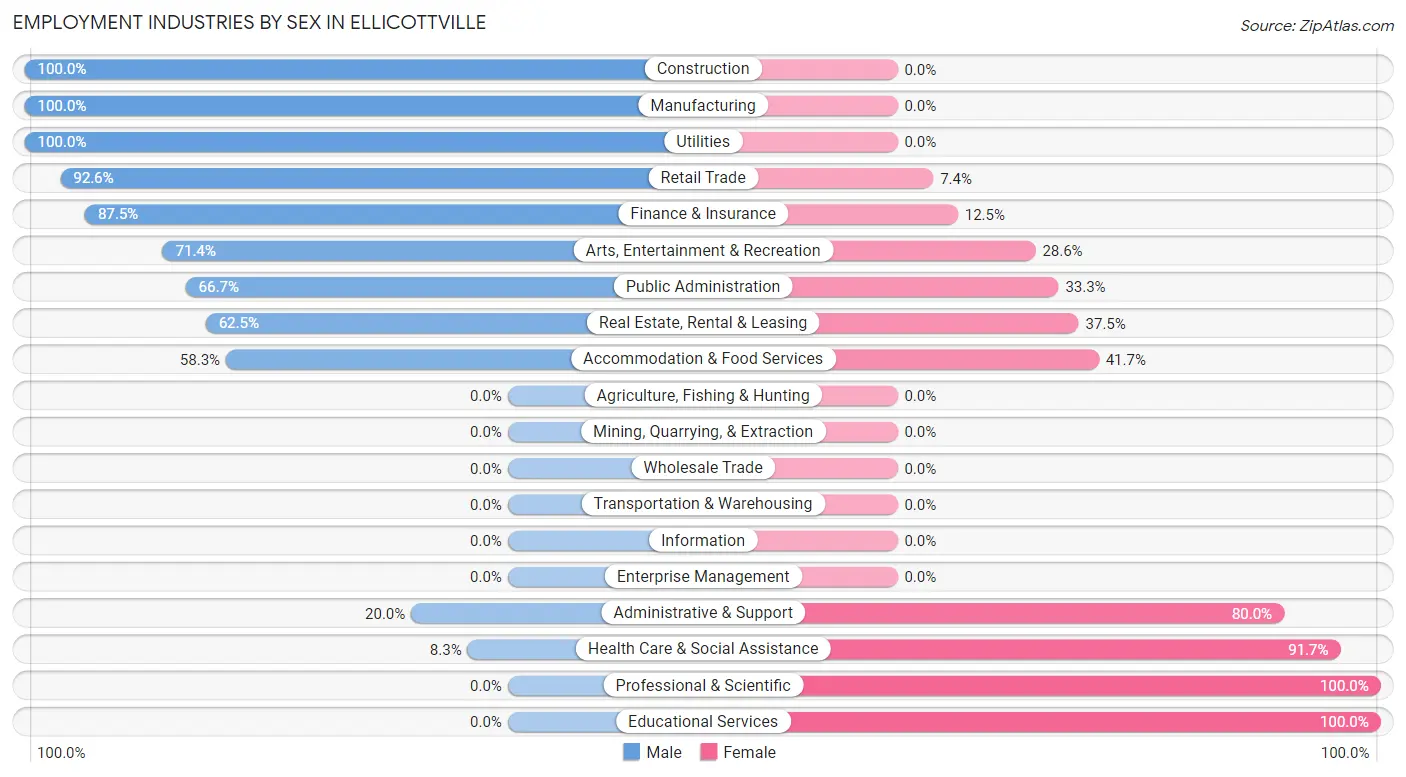
The Ellicottville industries that see more men than women are Construction (100.0%), Manufacturing (100.0%), and Utilities (100.0%), whereas the industries that tend to have a higher number of women are Professional & Scientific (100.0%), Educational Services (100.0%), and Health Care & Social Assistance (91.7%).
| Industry | Male | Female |
| Agriculture, Fishing & Hunting | 0 (0.0%) | 0 (0.0%) |
| Mining, Quarrying, & Extraction | 0 (0.0%) | 0 (0.0%) |
| Construction | 7 (100.0%) | 0 (0.0%) |
| Manufacturing | 5 (100.0%) | 0 (0.0%) |
| Wholesale Trade | 0 (0.0%) | 0 (0.0%) |
| Retail Trade | 25 (92.6%) | 2 (7.4%) |
| Transportation & Warehousing | 0 (0.0%) | 0 (0.0%) |
| Utilities | 3 (100.0%) | 0 (0.0%) |
| Information | 0 (0.0%) | 0 (0.0%) |
| Finance & Insurance | 7 (87.5%) | 1 (12.5%) |
| Real Estate, Rental & Leasing | 5 (62.5%) | 3 (37.5%) |
| Professional & Scientific | 0 (0.0%) | 4 (100.0%) |
| Enterprise Management | 0 (0.0%) | 0 (0.0%) |
| Administrative & Support | 4 (20.0%) | 16 (80.0%) |
| Educational Services | 0 (0.0%) | 28 (100.0%) |
| Health Care & Social Assistance | 2 (8.3%) | 22 (91.7%) |
| Arts, Entertainment & Recreation | 10 (71.4%) | 4 (28.6%) |
| Accommodation & Food Services | 7 (58.3%) | 5 (41.7%) |
| Public Administration | 12 (66.7%) | 6 (33.3%) |
| Total | 97 (51.0%) | 93 (48.9%) |
Education in Ellicottville
School Enrollment in Ellicottville
The most common levels of schooling among the 86 students in Ellicottville are nursery / preschool (26 | 30.2%), graduate / professional (21 | 24.4%), and high school (14 | 16.3%).
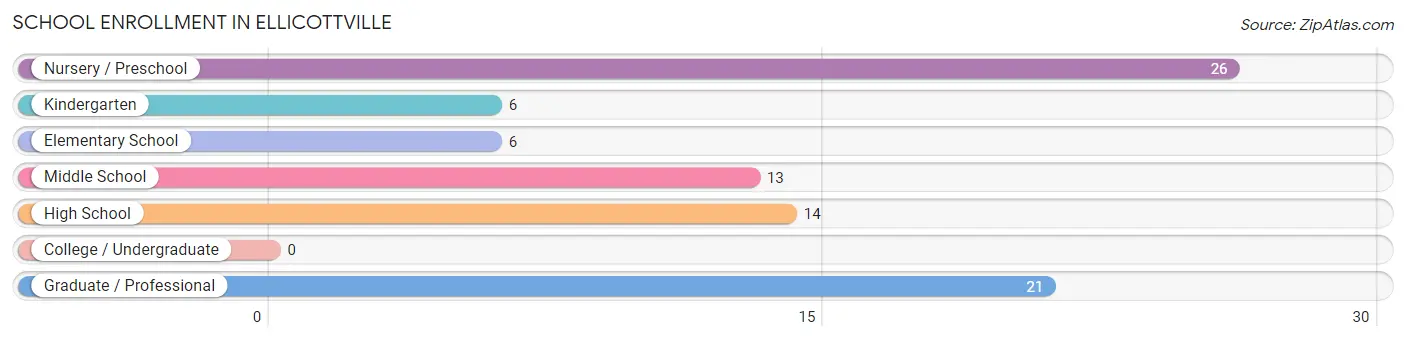
| School Level | # Students | % Students |
| Nursery / Preschool | 26 | 30.2% |
| Kindergarten | 6 | 7.0% |
| Elementary School | 6 | 7.0% |
| Middle School | 13 | 15.1% |
| High School | 14 | 16.3% |
| College / Undergraduate | 0 | 0.0% |
| Graduate / Professional | 21 | 24.4% |
| Total | 86 | 100.0% |
School Enrollment by Age by Funding Source in Ellicottville
Out of a total of 86 students who are enrolled in schools in Ellicottville, 34 (39.5%) attend a private institution, while the remaining 52 (60.5%) are enrolled in public schools. The age group of 20 to 24 year olds has the highest likelihood of being enrolled in private schools, with 9 (100.0% in the age bracket) enrolled. Conversely, the age group of 10 to 14 year olds has the lowest likelihood of being enrolled in a private school, with 13 (100.0% in the age bracket) attending a public institution.
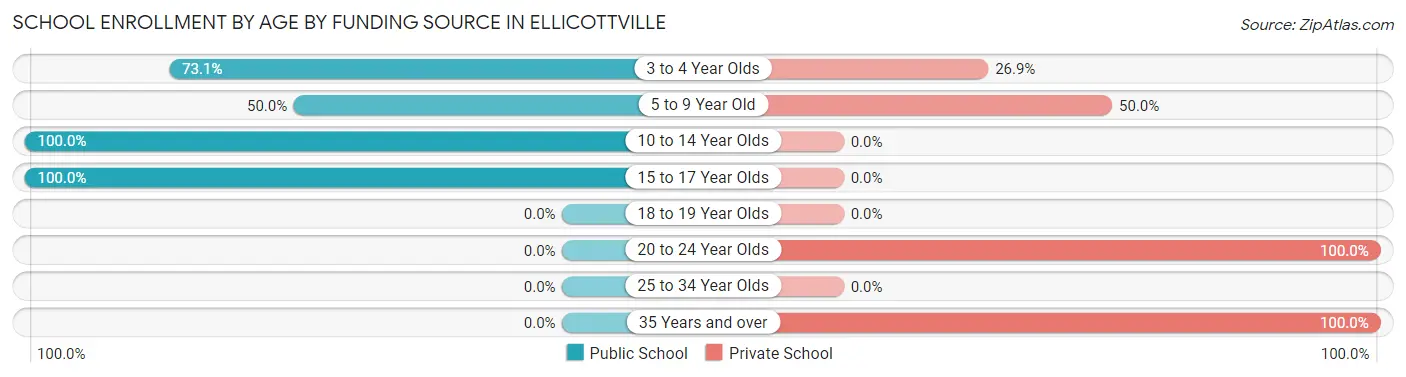
| Age Bracket | Public School | Private School |
| 3 to 4 Year Olds | 19 (73.1%) | 7 (26.9%) |
| 5 to 9 Year Old | 6 (50.0%) | 6 (50.0%) |
| 10 to 14 Year Olds | 13 (100.0%) | 0 (0.0%) |
| 15 to 17 Year Olds | 14 (100.0%) | 0 (0.0%) |
| 18 to 19 Year Olds | 0 (0.0%) | 0 (0.0%) |
| 20 to 24 Year Olds | 0 (0.0%) | 9 (100.0%) |
| 25 to 34 Year Olds | 0 (0.0%) | 0 (0.0%) |
| 35 Years and over | 0 (0.0%) | 12 (100.0%) |
| Total | 52 (60.5%) | 34 (39.5%) |
Educational Attainment by Field of Study in Ellicottville
Education (67 | 36.0%), science & technology (34 | 18.3%), social sciences (20 | 10.7%), business (20 | 10.7%), and arts & humanities (12 | 6.5%) are the most common fields of study among 186 individuals in Ellicottville who have obtained a bachelor's degree or higher.
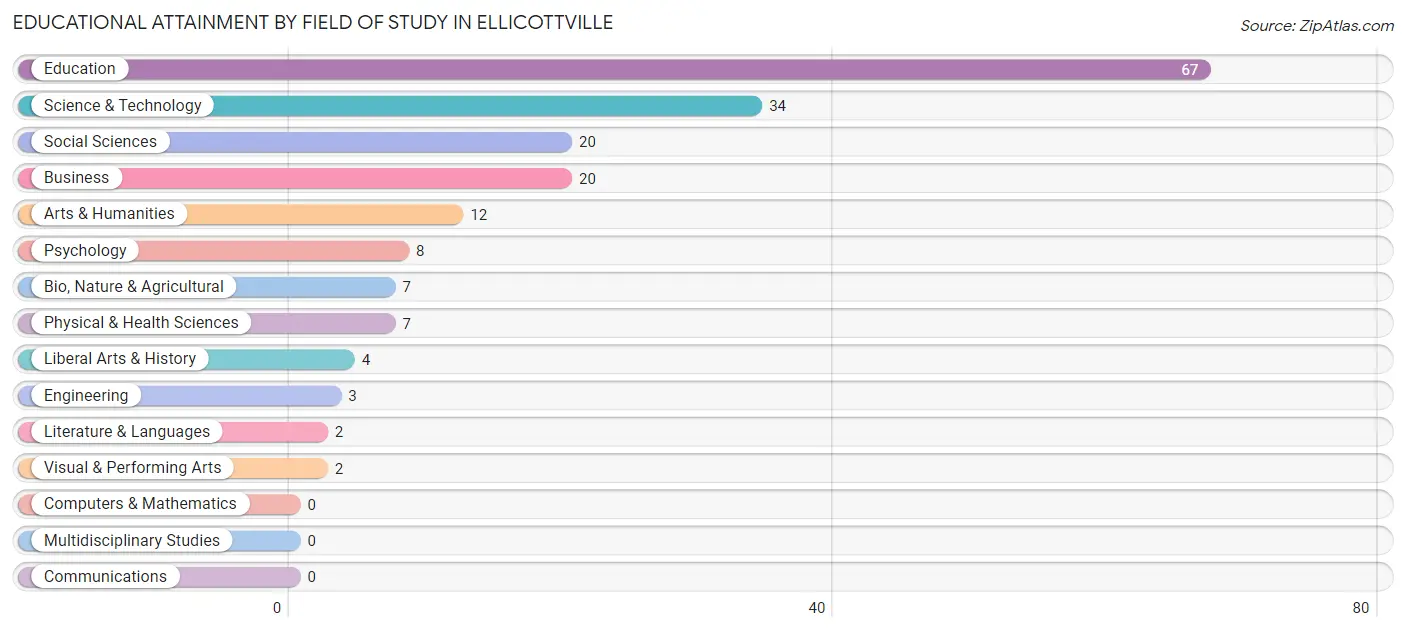
| Field of Study | # Graduates | % Graduates |
| Computers & Mathematics | 0 | 0.0% |
| Bio, Nature & Agricultural | 7 | 3.8% |
| Physical & Health Sciences | 7 | 3.8% |
| Psychology | 8 | 4.3% |
| Social Sciences | 20 | 10.7% |
| Engineering | 3 | 1.6% |
| Multidisciplinary Studies | 0 | 0.0% |
| Science & Technology | 34 | 18.3% |
| Business | 20 | 10.7% |
| Education | 67 | 36.0% |
| Literature & Languages | 2 | 1.1% |
| Liberal Arts & History | 4 | 2.1% |
| Visual & Performing Arts | 2 | 1.1% |
| Communications | 0 | 0.0% |
| Arts & Humanities | 12 | 6.5% |
| Total | 186 | 100.0% |
Transportation & Commute in Ellicottville
Vehicle Availability by Sex in Ellicottville
The most prevalent vehicle ownership categories in Ellicottville are males with 2 vehicles (62, accounting for 63.9%) and females with 2 vehicles (42, making up 68.9%).
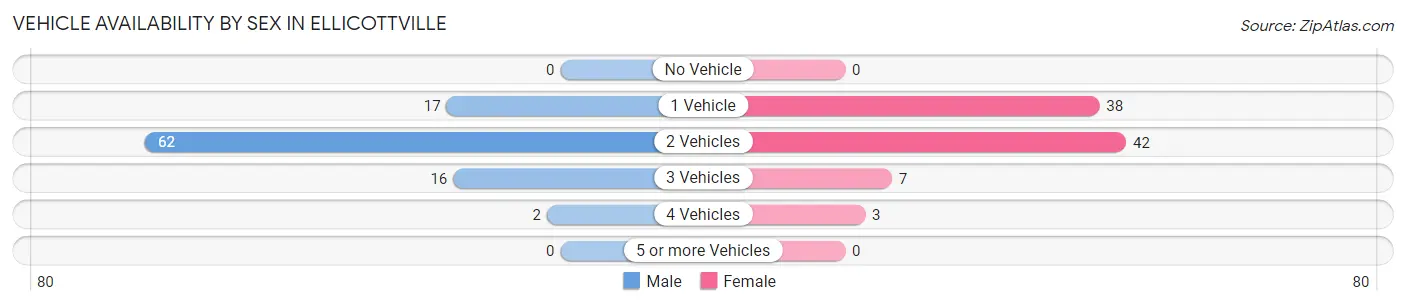
| Vehicles Available | Male | Female |
| No Vehicle | 0 (0.0%) | 0 (0.0%) |
| 1 Vehicle | 17 (17.5%) | 38 (42.2%) |
| 2 Vehicles | 62 (63.9%) | 42 (46.7%) |
| 3 Vehicles | 16 (16.5%) | 7 (7.8%) |
| 4 Vehicles | 2 (2.1%) | 3 (3.3%) |
| 5 or more Vehicles | 0 (0.0%) | 0 (0.0%) |
| Total | 97 (100.0%) | 90 (100.0%) |
Commute Time in Ellicottville
The most frequently occuring commute durations in Ellicottville are less than 5 minutes (43 commuters, 27.0%), 5 to 9 minutes (28 commuters, 17.6%), and 15 to 19 minutes (27 commuters, 17.0%).
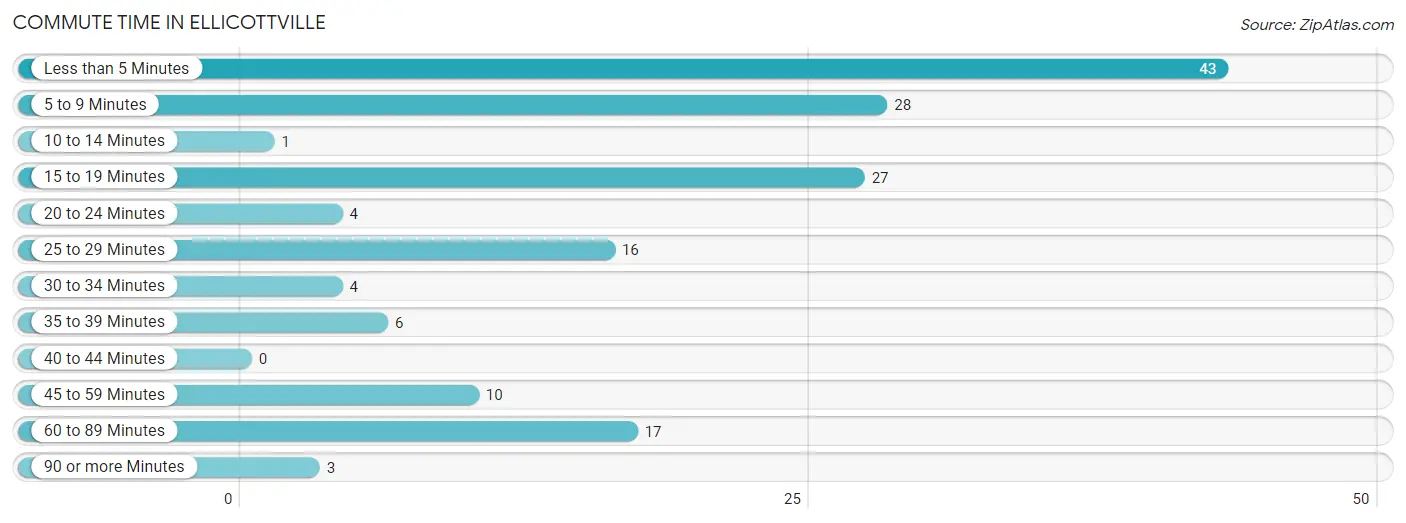
| Commute Time | # Commuters | % Commuters |
| Less than 5 Minutes | 43 | 27.0% |
| 5 to 9 Minutes | 28 | 17.6% |
| 10 to 14 Minutes | 1 | 0.6% |
| 15 to 19 Minutes | 27 | 17.0% |
| 20 to 24 Minutes | 4 | 2.5% |
| 25 to 29 Minutes | 16 | 10.1% |
| 30 to 34 Minutes | 4 | 2.5% |
| 35 to 39 Minutes | 6 | 3.8% |
| 40 to 44 Minutes | 0 | 0.0% |
| 45 to 59 Minutes | 10 | 6.3% |
| 60 to 89 Minutes | 17 | 10.7% |
| 90 or more Minutes | 3 | 1.9% |
Commute Time by Sex in Ellicottville
The most common commute times in Ellicottville are less than 5 minutes (41 commuters, 47.7%) for males and 15 to 19 minutes (17 commuters, 23.3%) for females.
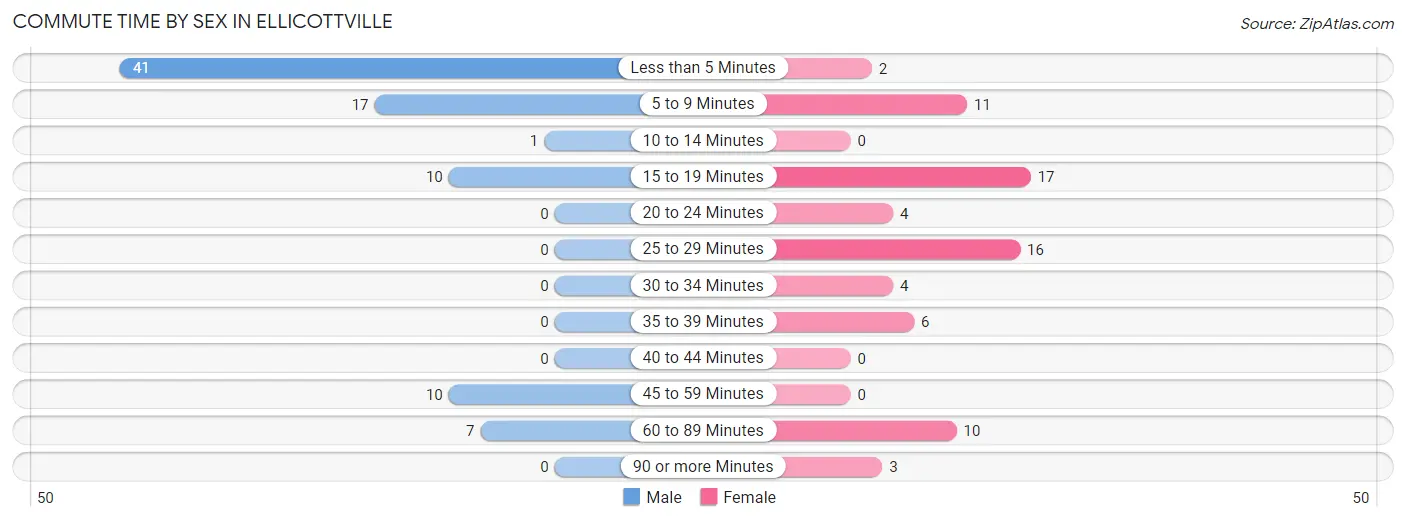
| Commute Time | Male | Female |
| Less than 5 Minutes | 41 (47.7%) | 2 (2.7%) |
| 5 to 9 Minutes | 17 (19.8%) | 11 (15.1%) |
| 10 to 14 Minutes | 1 (1.2%) | 0 (0.0%) |
| 15 to 19 Minutes | 10 (11.6%) | 17 (23.3%) |
| 20 to 24 Minutes | 0 (0.0%) | 4 (5.5%) |
| 25 to 29 Minutes | 0 (0.0%) | 16 (21.9%) |
| 30 to 34 Minutes | 0 (0.0%) | 4 (5.5%) |
| 35 to 39 Minutes | 0 (0.0%) | 6 (8.2%) |
| 40 to 44 Minutes | 0 (0.0%) | 0 (0.0%) |
| 45 to 59 Minutes | 10 (11.6%) | 0 (0.0%) |
| 60 to 89 Minutes | 7 (8.1%) | 10 (13.7%) |
| 90 or more Minutes | 0 (0.0%) | 3 (4.1%) |
Time of Departure to Work by Sex in Ellicottville
The most frequent times of departure to work in Ellicottville are 10:00 AM to 10:59 AM (20, 23.3%) for males and 7:00 AM to 7:29 AM (19, 26.0%) for females.
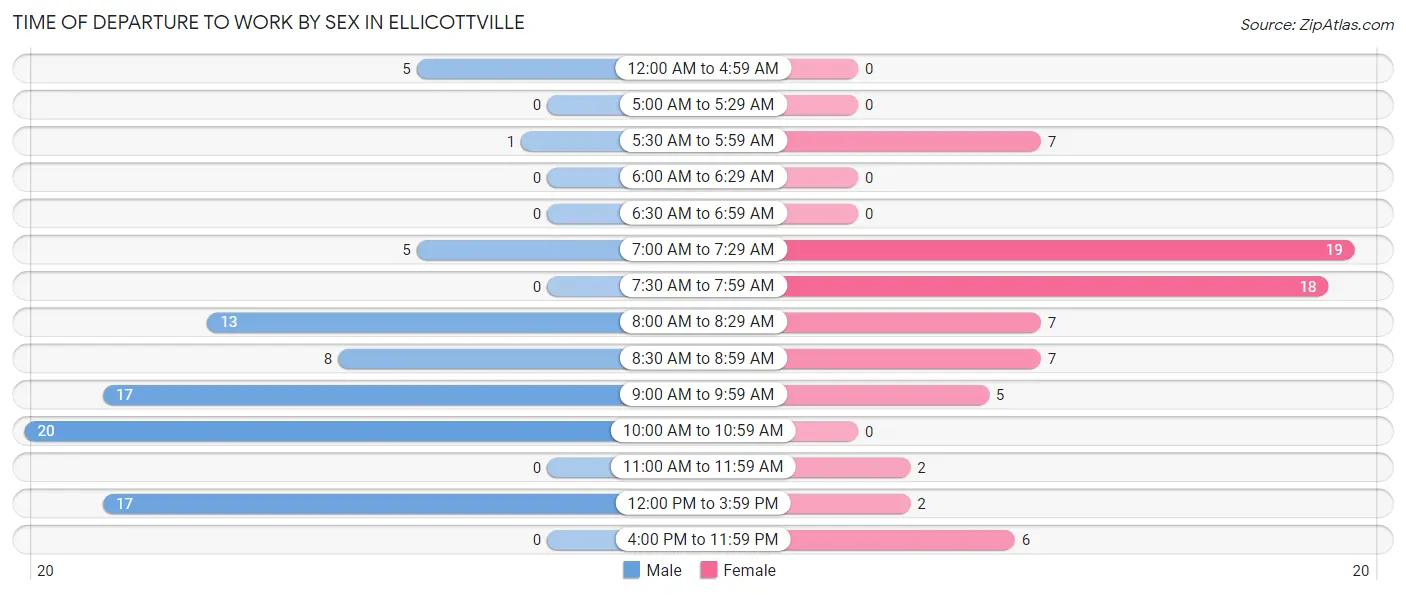
| Time of Departure | Male | Female |
| 12:00 AM to 4:59 AM | 5 (5.8%) | 0 (0.0%) |
| 5:00 AM to 5:29 AM | 0 (0.0%) | 0 (0.0%) |
| 5:30 AM to 5:59 AM | 1 (1.2%) | 7 (9.6%) |
| 6:00 AM to 6:29 AM | 0 (0.0%) | 0 (0.0%) |
| 6:30 AM to 6:59 AM | 0 (0.0%) | 0 (0.0%) |
| 7:00 AM to 7:29 AM | 5 (5.8%) | 19 (26.0%) |
| 7:30 AM to 7:59 AM | 0 (0.0%) | 18 (24.7%) |
| 8:00 AM to 8:29 AM | 13 (15.1%) | 7 (9.6%) |
| 8:30 AM to 8:59 AM | 8 (9.3%) | 7 (9.6%) |
| 9:00 AM to 9:59 AM | 17 (19.8%) | 5 (6.9%) |
| 10:00 AM to 10:59 AM | 20 (23.3%) | 0 (0.0%) |
| 11:00 AM to 11:59 AM | 0 (0.0%) | 2 (2.7%) |
| 12:00 PM to 3:59 PM | 17 (19.8%) | 2 (2.7%) |
| 4:00 PM to 11:59 PM | 0 (0.0%) | 6 (8.2%) |
| Total | 86 (100.0%) | 73 (100.0%) |
Housing Occupancy in Ellicottville
Occupancy by Ownership in Ellicottville
Of the total 163 dwellings in Ellicottville, owner-occupied units account for 134 (82.2%), while renter-occupied units make up 29 (17.8%).
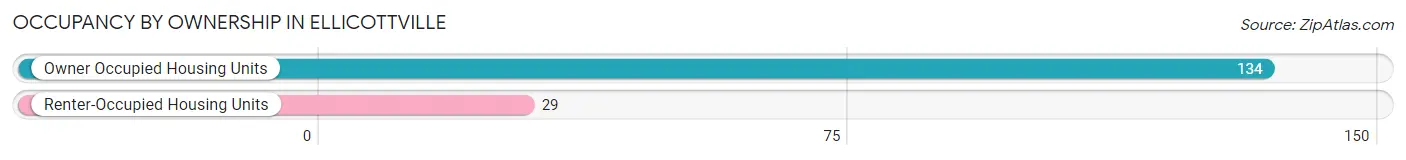
| Occupancy | # Housing Units | % Housing Units |
| Owner Occupied Housing Units | 134 | 82.2% |
| Renter-Occupied Housing Units | 29 | 17.8% |
| Total Occupied Housing Units | 163 | 100.0% |
Occupancy by Household Size in Ellicottville
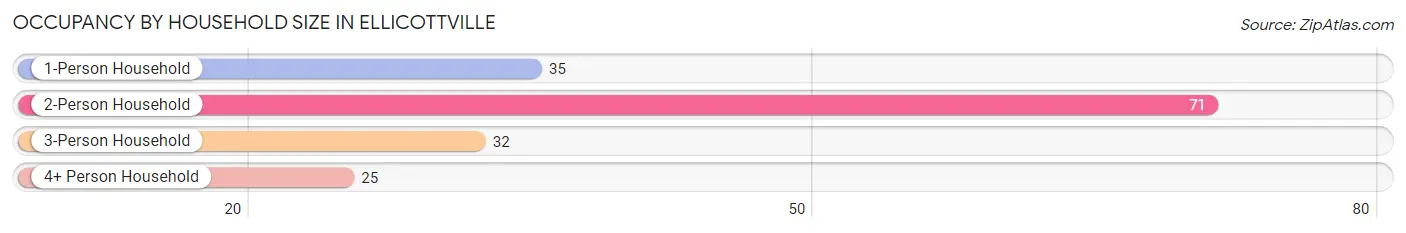
| Household Size | # Housing Units | % Housing Units |
| 1-Person Household | 35 | 21.5% |
| 2-Person Household | 71 | 43.6% |
| 3-Person Household | 32 | 19.6% |
| 4+ Person Household | 25 | 15.3% |
| Total Housing Units | 163 | 100.0% |
Occupancy by Ownership by Household Size in Ellicottville
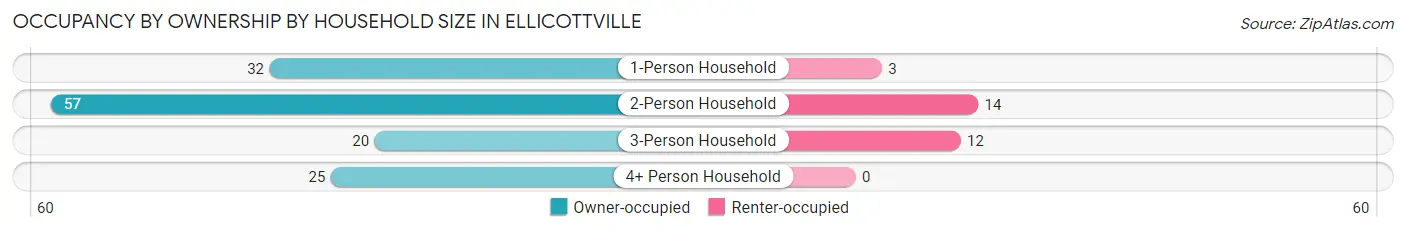
| Household Size | Owner-occupied | Renter-occupied |
| 1-Person Household | 32 (91.4%) | 3 (8.6%) |
| 2-Person Household | 57 (80.3%) | 14 (19.7%) |
| 3-Person Household | 20 (62.5%) | 12 (37.5%) |
| 4+ Person Household | 25 (100.0%) | 0 (0.0%) |
| Total Housing Units | 134 (82.2%) | 29 (17.8%) |
Occupancy by Educational Attainment in Ellicottville
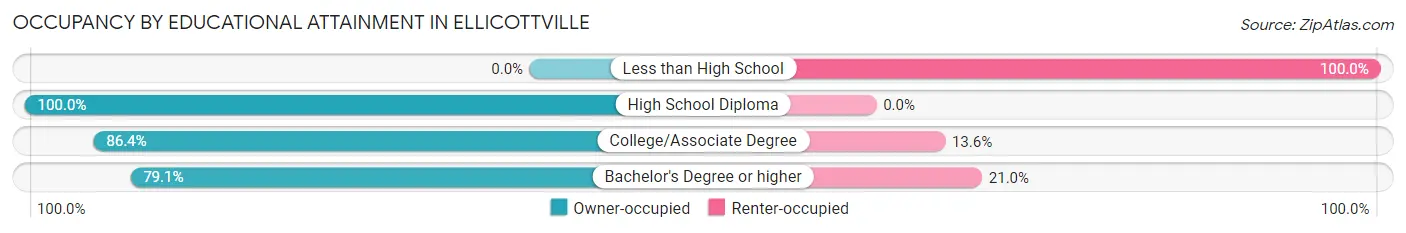
| Household Size | Owner-occupied | Renter-occupied |
| Less than High School | 0 (0.0%) | 4 (100.0%) |
| High School Diploma | 32 (100.0%) | 0 (0.0%) |
| College/Associate Degree | 19 (86.4%) | 3 (13.6%) |
| Bachelor's Degree or higher | 83 (79.0%) | 22 (20.9%) |
Occupancy by Age of Householder in Ellicottville
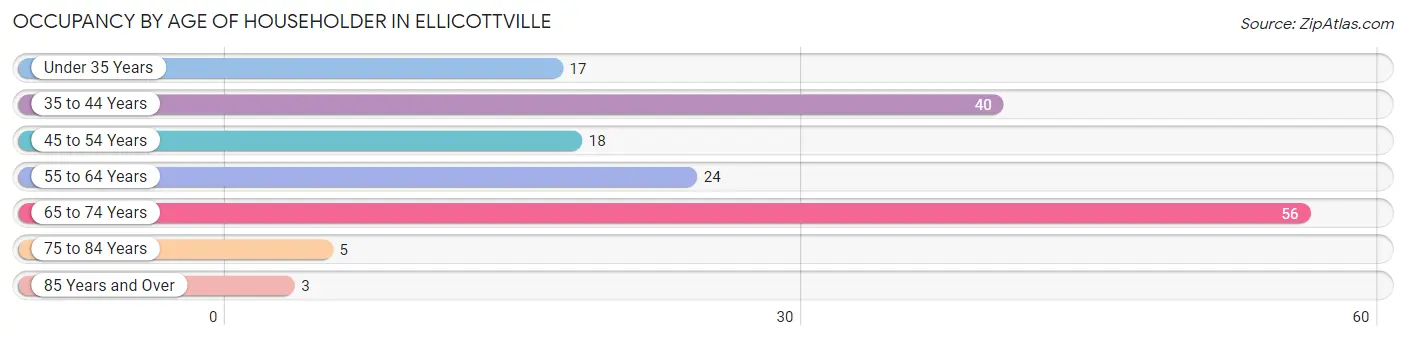
| Age Bracket | # Households | % Households |
| Under 35 Years | 17 | 10.4% |
| 35 to 44 Years | 40 | 24.5% |
| 45 to 54 Years | 18 | 11.0% |
| 55 to 64 Years | 24 | 14.7% |
| 65 to 74 Years | 56 | 34.4% |
| 75 to 84 Years | 5 | 3.1% |
| 85 Years and Over | 3 | 1.8% |
| Total | 163 | 100.0% |
Housing Finances in Ellicottville
Median Income by Occupancy in Ellicottville
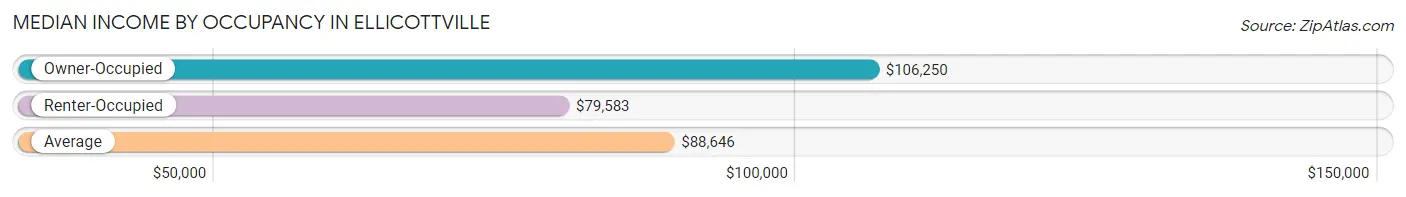
| Occupancy Type | # Households | Median Income |
| Owner-Occupied | 134 (82.2%) | $106,250 |
| Renter-Occupied | 29 (17.8%) | $79,583 |
| Average | 163 (100.0%) | $88,646 |
Occupancy by Householder Income Bracket in Ellicottville
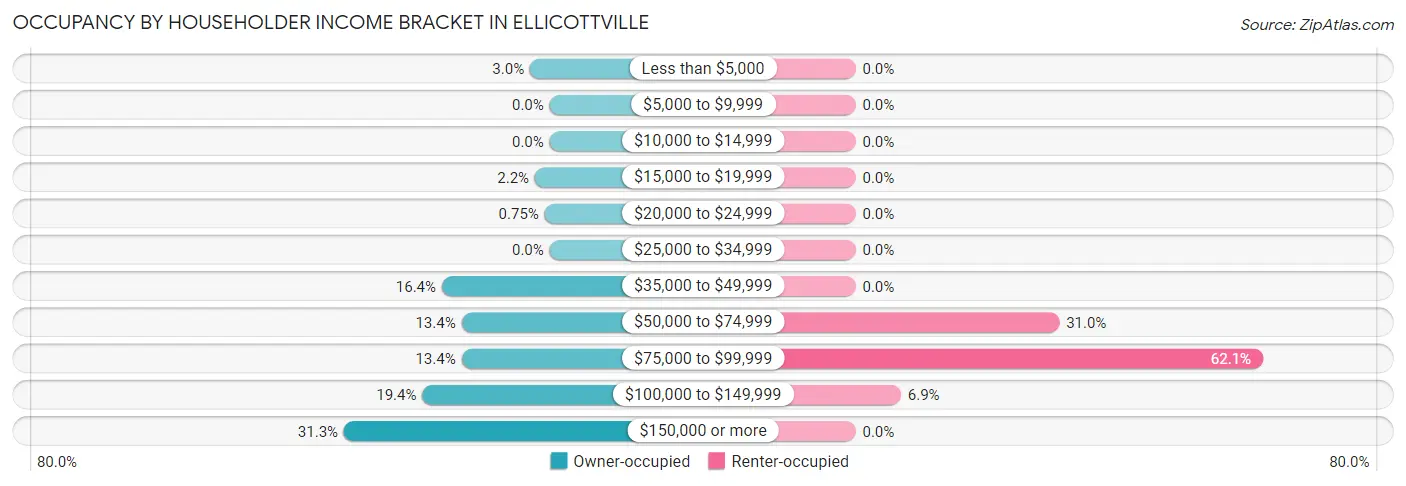
| Income Bracket | Owner-occupied | Renter-occupied |
| Less than $5,000 | 4 (3.0%) | 0 (0.0%) |
| $5,000 to $9,999 | 0 (0.0%) | 0 (0.0%) |
| $10,000 to $14,999 | 0 (0.0%) | 0 (0.0%) |
| $15,000 to $19,999 | 3 (2.2%) | 0 (0.0%) |
| $20,000 to $24,999 | 1 (0.7%) | 0 (0.0%) |
| $25,000 to $34,999 | 0 (0.0%) | 0 (0.0%) |
| $35,000 to $49,999 | 22 (16.4%) | 0 (0.0%) |
| $50,000 to $74,999 | 18 (13.4%) | 9 (31.0%) |
| $75,000 to $99,999 | 18 (13.4%) | 18 (62.1%) |
| $100,000 to $149,999 | 26 (19.4%) | 2 (6.9%) |
| $150,000 or more | 42 (31.3%) | 0 (0.0%) |
| Total | 134 (100.0%) | 29 (100.0%) |
Monthly Housing Cost Tiers in Ellicottville
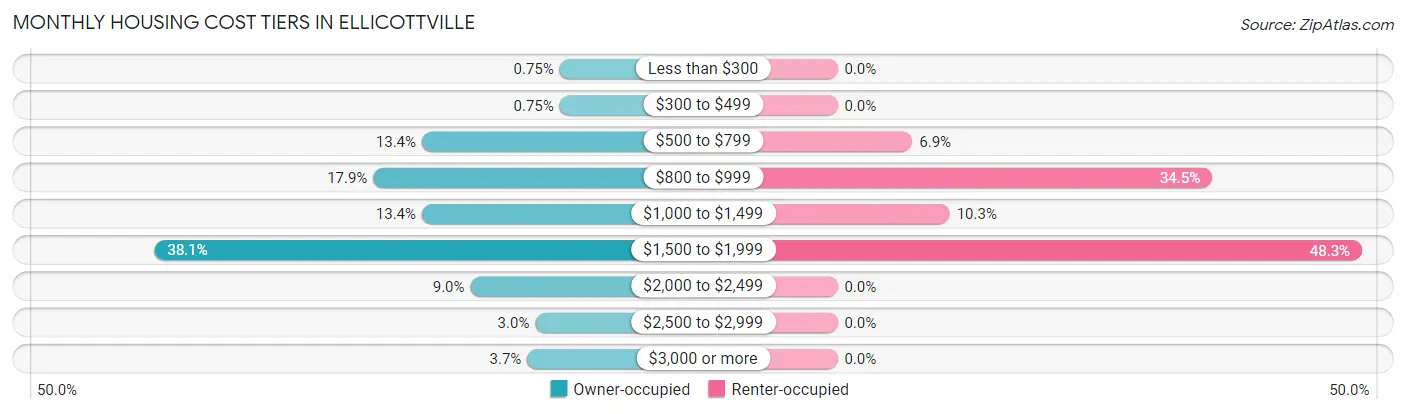
| Monthly Cost | Owner-occupied | Renter-occupied |
| Less than $300 | 1 (0.7%) | 0 (0.0%) |
| $300 to $499 | 1 (0.7%) | 0 (0.0%) |
| $500 to $799 | 18 (13.4%) | 2 (6.9%) |
| $800 to $999 | 24 (17.9%) | 10 (34.5%) |
| $1,000 to $1,499 | 18 (13.4%) | 3 (10.3%) |
| $1,500 to $1,999 | 51 (38.1%) | 14 (48.3%) |
| $2,000 to $2,499 | 12 (9.0%) | 0 (0.0%) |
| $2,500 to $2,999 | 4 (3.0%) | 0 (0.0%) |
| $3,000 or more | 5 (3.7%) | 0 (0.0%) |
| Total | 134 (100.0%) | 29 (100.0%) |
Physical Housing Characteristics in Ellicottville
Housing Structures in Ellicottville
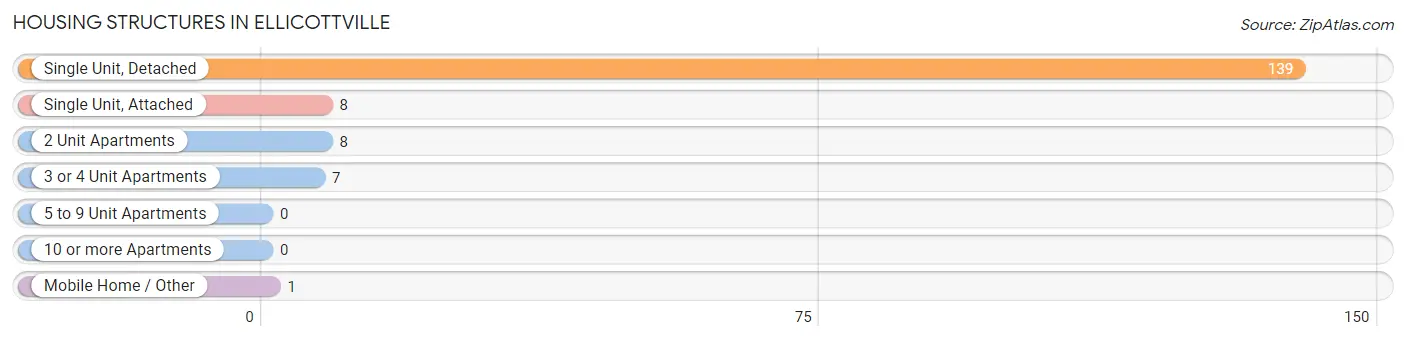
| Structure Type | # Housing Units | % Housing Units |
| Single Unit, Detached | 139 | 85.3% |
| Single Unit, Attached | 8 | 4.9% |
| 2 Unit Apartments | 8 | 4.9% |
| 3 or 4 Unit Apartments | 7 | 4.3% |
| 5 to 9 Unit Apartments | 0 | 0.0% |
| 10 or more Apartments | 0 | 0.0% |
| Mobile Home / Other | 1 | 0.6% |
| Total | 163 | 100.0% |
Housing Structures by Occupancy in Ellicottville
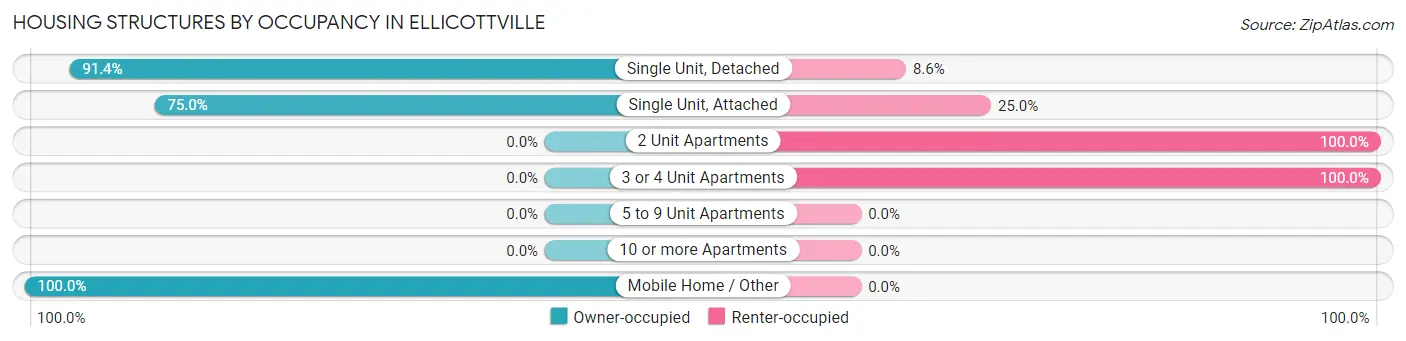
| Structure Type | Owner-occupied | Renter-occupied |
| Single Unit, Detached | 127 (91.4%) | 12 (8.6%) |
| Single Unit, Attached | 6 (75.0%) | 2 (25.0%) |
| 2 Unit Apartments | 0 (0.0%) | 8 (100.0%) |
| 3 or 4 Unit Apartments | 0 (0.0%) | 7 (100.0%) |
| 5 to 9 Unit Apartments | 0 (0.0%) | 0 (0.0%) |
| 10 or more Apartments | 0 (0.0%) | 0 (0.0%) |
| Mobile Home / Other | 1 (100.0%) | 0 (0.0%) |
| Total | 134 (82.2%) | 29 (17.8%) |
Housing Structures by Number of Rooms in Ellicottville
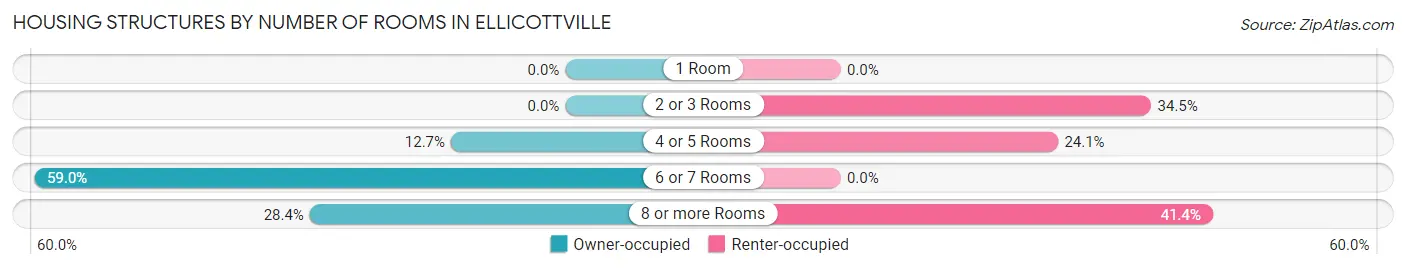
| Number of Rooms | Owner-occupied | Renter-occupied |
| 1 Room | 0 (0.0%) | 0 (0.0%) |
| 2 or 3 Rooms | 0 (0.0%) | 10 (34.5%) |
| 4 or 5 Rooms | 17 (12.7%) | 7 (24.1%) |
| 6 or 7 Rooms | 79 (59.0%) | 0 (0.0%) |
| 8 or more Rooms | 38 (28.4%) | 12 (41.4%) |
| Total | 134 (100.0%) | 29 (100.0%) |
Housing Structure by Heating Type in Ellicottville
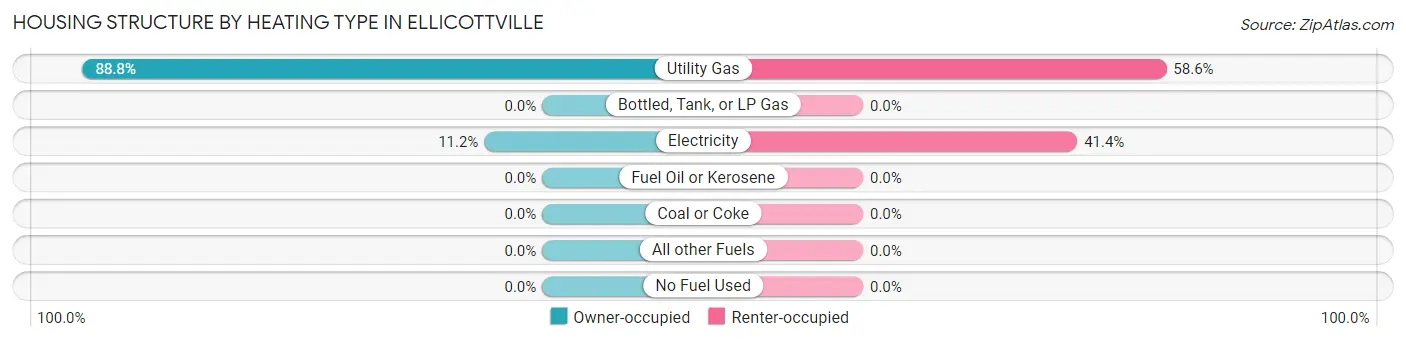
| Heating Type | Owner-occupied | Renter-occupied |
| Utility Gas | 119 (88.8%) | 17 (58.6%) |
| Bottled, Tank, or LP Gas | 0 (0.0%) | 0 (0.0%) |
| Electricity | 15 (11.2%) | 12 (41.4%) |
| Fuel Oil or Kerosene | 0 (0.0%) | 0 (0.0%) |
| Coal or Coke | 0 (0.0%) | 0 (0.0%) |
| All other Fuels | 0 (0.0%) | 0 (0.0%) |
| No Fuel Used | 0 (0.0%) | 0 (0.0%) |
| Total | 134 (100.0%) | 29 (100.0%) |
Household Vehicle Usage in Ellicottville
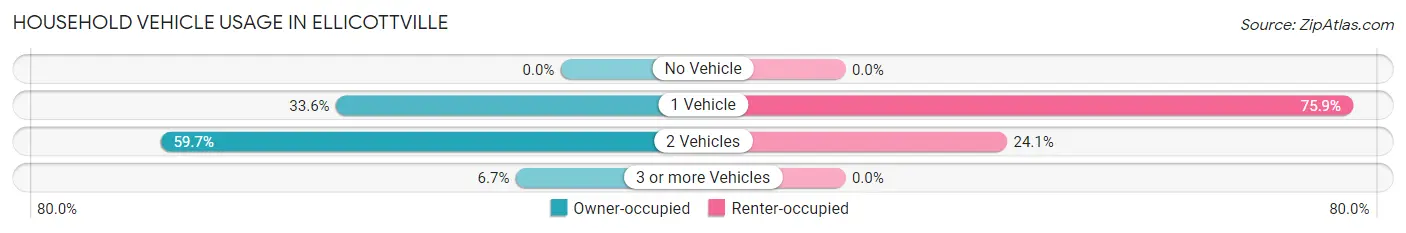
| Vehicles per Household | Owner-occupied | Renter-occupied |
| No Vehicle | 0 (0.0%) | 0 (0.0%) |
| 1 Vehicle | 45 (33.6%) | 22 (75.9%) |
| 2 Vehicles | 80 (59.7%) | 7 (24.1%) |
| 3 or more Vehicles | 9 (6.7%) | 0 (0.0%) |
| Total | 134 (100.0%) | 29 (100.0%) |
Real Estate & Mortgages in Ellicottville
Real Estate and Mortgage Overview in Ellicottville
| Characteristic | Without Mortgage | With Mortgage |
| Housing Units | 64 | 70 |
| Median Property Value | $300,000 | $271,700 |
| Median Household Income | - | - |
| Monthly Housing Costs | $929 | $0 |
| Real Estate Taxes | $6,602 | $0 |
Property Value by Mortgage Status in Ellicottville
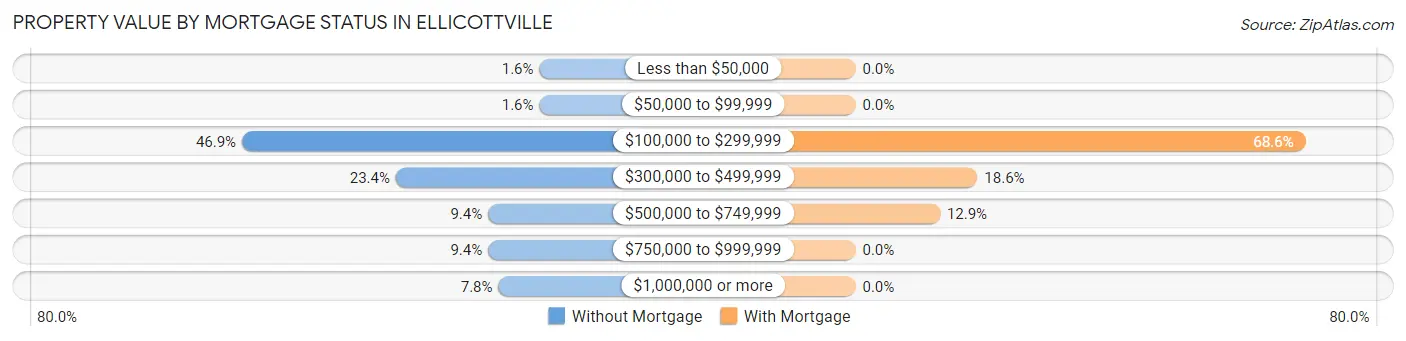
| Property Value | Without Mortgage | With Mortgage |
| Less than $50,000 | 1 (1.6%) | 0 (0.0%) |
| $50,000 to $99,999 | 1 (1.6%) | 0 (0.0%) |
| $100,000 to $299,999 | 30 (46.9%) | 48 (68.6%) |
| $300,000 to $499,999 | 15 (23.4%) | 13 (18.6%) |
| $500,000 to $749,999 | 6 (9.4%) | 9 (12.9%) |
| $750,000 to $999,999 | 6 (9.4%) | 0 (0.0%) |
| $1,000,000 or more | 5 (7.8%) | 0 (0.0%) |
| Total | 64 (100.0%) | 70 (100.0%) |
Household Income by Mortgage Status in Ellicottville
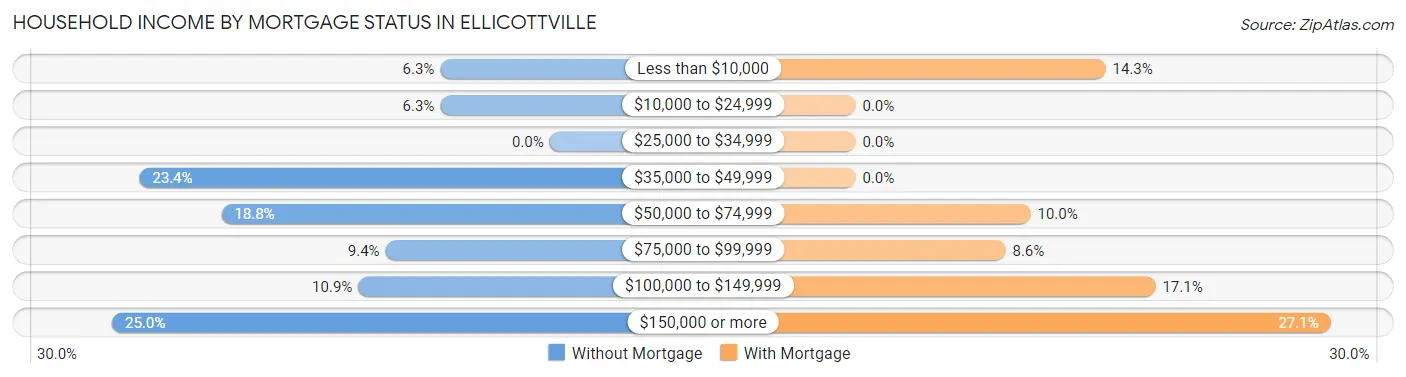
| Household Income | Without Mortgage | With Mortgage |
| Less than $10,000 | 4 (6.2%) | 10 (14.3%) |
| $10,000 to $24,999 | 4 (6.2%) | 0 (0.0%) |
| $25,000 to $34,999 | 0 (0.0%) | 0 (0.0%) |
| $35,000 to $49,999 | 15 (23.4%) | 0 (0.0%) |
| $50,000 to $74,999 | 12 (18.8%) | 7 (10.0%) |
| $75,000 to $99,999 | 6 (9.4%) | 6 (8.6%) |
| $100,000 to $149,999 | 7 (10.9%) | 12 (17.1%) |
| $150,000 or more | 16 (25.0%) | 19 (27.1%) |
| Total | 64 (100.0%) | 70 (100.0%) |
Property Value to Household Income Ratio in Ellicottville
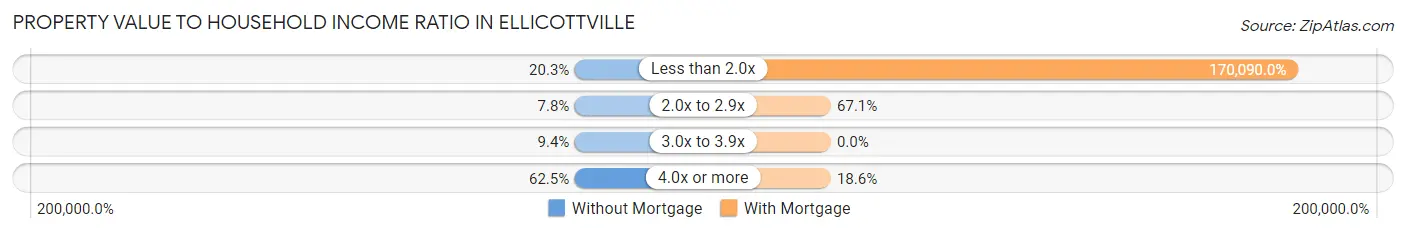
| Value-to-Income Ratio | Without Mortgage | With Mortgage |
| Less than 2.0x | 13 (20.3%) | 119,063 (170,090.0%) |
| 2.0x to 2.9x | 5 (7.8%) | 47 (67.1%) |
| 3.0x to 3.9x | 6 (9.4%) | 0 (0.0%) |
| 4.0x or more | 40 (62.5%) | 13 (18.6%) |
| Total | 64 (100.0%) | 70 (100.0%) |
Real Estate Taxes by Mortgage Status in Ellicottville
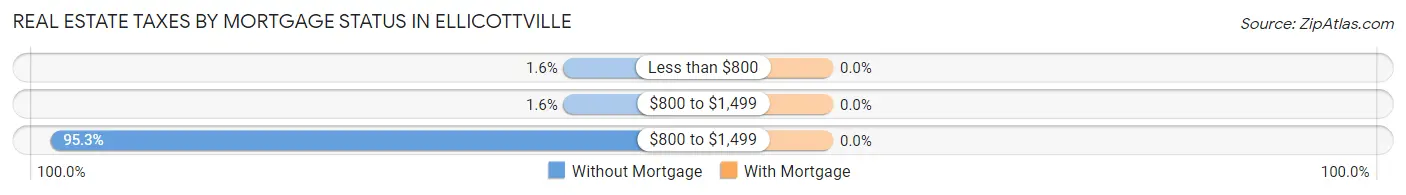
| Property Taxes | Without Mortgage | With Mortgage |
| Less than $800 | 1 (1.6%) | 0 (0.0%) |
| $800 to $1,499 | 1 (1.6%) | 0 (0.0%) |
| $800 to $1,499 | 61 (95.3%) | 0 (0.0%) |
| Total | 64 (100.0%) | 70 (100.0%) |
Health & Disability in Ellicottville
Health Insurance Coverage by Age in Ellicottville
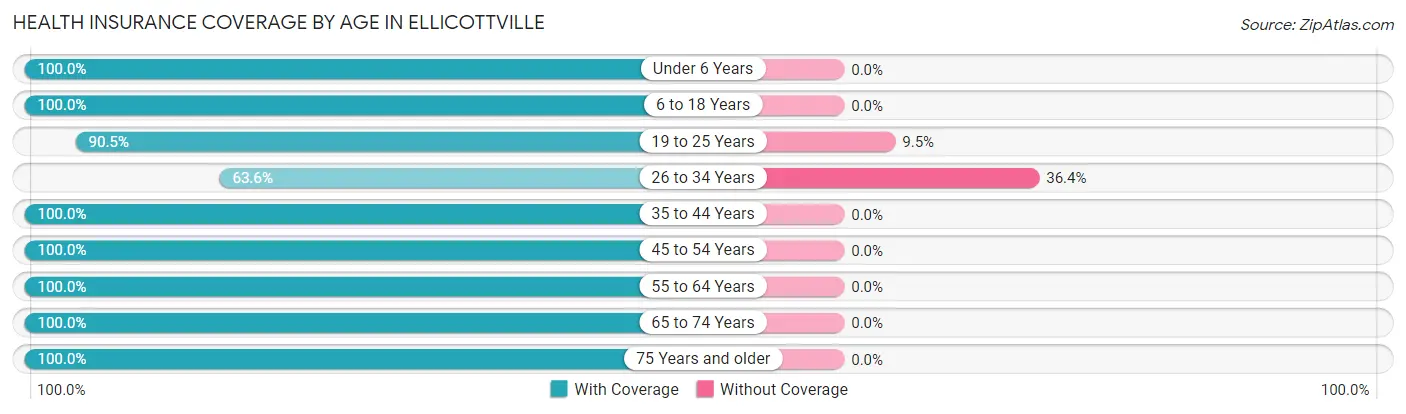
| Age Bracket | With Coverage | Without Coverage |
| Under 6 Years | 40 (100.0%) | 0 (0.0%) |
| 6 to 18 Years | 39 (100.0%) | 0 (0.0%) |
| 19 to 25 Years | 19 (90.5%) | 2 (9.5%) |
| 26 to 34 Years | 14 (63.6%) | 8 (36.4%) |
| 35 to 44 Years | 67 (100.0%) | 0 (0.0%) |
| 45 to 54 Years | 28 (100.0%) | 0 (0.0%) |
| 55 to 64 Years | 40 (100.0%) | 0 (0.0%) |
| 65 to 74 Years | 93 (100.0%) | 0 (0.0%) |
| 75 Years and older | 24 (100.0%) | 0 (0.0%) |
| Total | 364 (97.3%) | 10 (2.7%) |
Health Insurance Coverage by Citizenship Status in Ellicottville
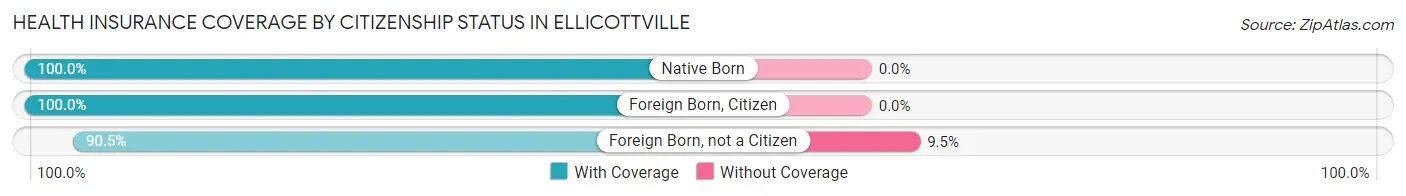
| Citizenship Status | With Coverage | Without Coverage |
| Native Born | 40 (100.0%) | 0 (0.0%) |
| Foreign Born, Citizen | 39 (100.0%) | 0 (0.0%) |
| Foreign Born, not a Citizen | 19 (90.5%) | 2 (9.5%) |
Health Insurance Coverage by Household Income in Ellicottville
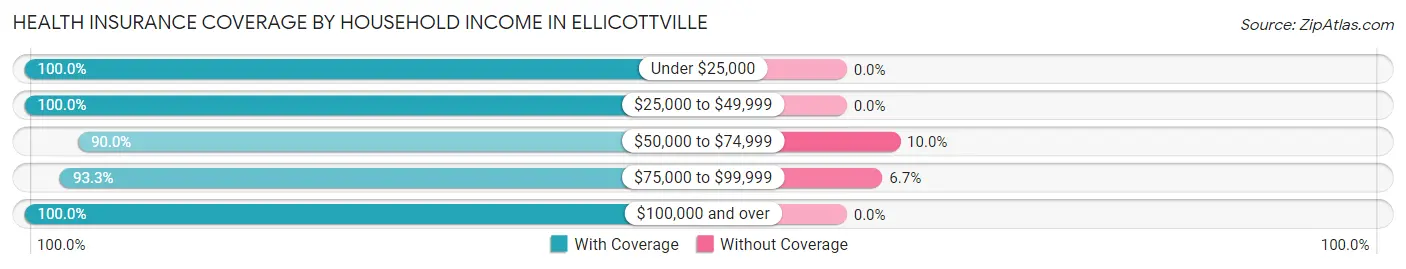
| Household Income | With Coverage | Without Coverage |
| Under $25,000 | 10 (100.0%) | 0 (0.0%) |
| $25,000 to $49,999 | 42 (100.0%) | 0 (0.0%) |
| $50,000 to $74,999 | 45 (90.0%) | 5 (10.0%) |
| $75,000 to $99,999 | 70 (93.3%) | 5 (6.7%) |
| $100,000 and over | 197 (100.0%) | 0 (0.0%) |
Public vs Private Health Insurance Coverage by Age in Ellicottville
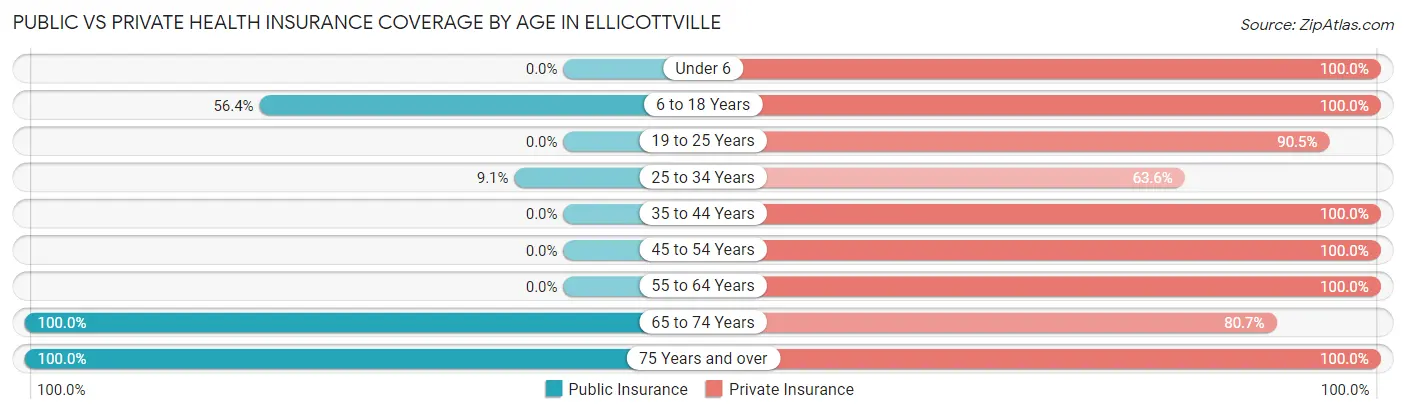
| Age Bracket | Public Insurance | Private Insurance |
| Under 6 | 0 (0.0%) | 40 (100.0%) |
| 6 to 18 Years | 22 (56.4%) | 39 (100.0%) |
| 19 to 25 Years | 0 (0.0%) | 19 (90.5%) |
| 25 to 34 Years | 2 (9.1%) | 14 (63.6%) |
| 35 to 44 Years | 0 (0.0%) | 67 (100.0%) |
| 45 to 54 Years | 0 (0.0%) | 28 (100.0%) |
| 55 to 64 Years | 0 (0.0%) | 40 (100.0%) |
| 65 to 74 Years | 93 (100.0%) | 75 (80.6%) |
| 75 Years and over | 24 (100.0%) | 24 (100.0%) |
| Total | 141 (37.7%) | 346 (92.5%) |
Disability Status by Sex by Age in Ellicottville
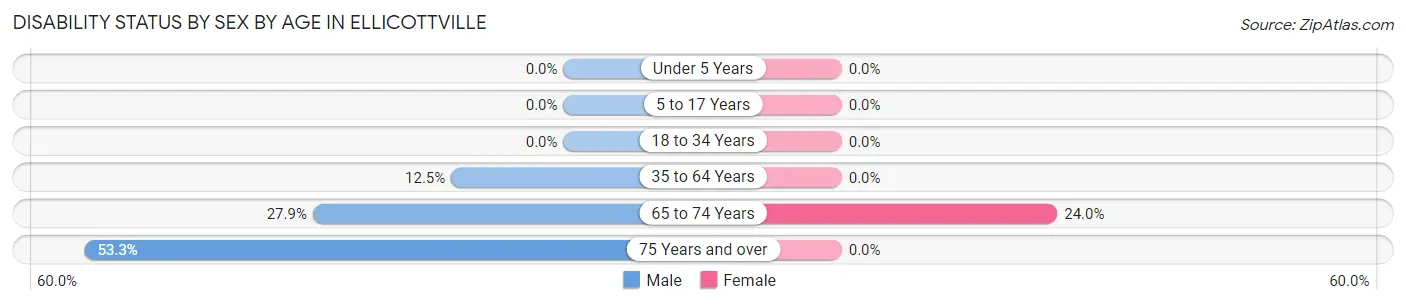
| Age Bracket | Male | Female |
| Under 5 Years | 0 (0.0%) | 0 (0.0%) |
| 5 to 17 Years | 0 (0.0%) | 0 (0.0%) |
| 18 to 34 Years | 0 (0.0%) | 0 (0.0%) |
| 35 to 64 Years | 7 (12.5%) | 0 (0.0%) |
| 65 to 74 Years | 12 (27.9%) | 12 (24.0%) |
| 75 Years and over | 8 (53.3%) | 0 (0.0%) |
Disability Class by Sex by Age in Ellicottville
Disability Class: Hearing Difficulty
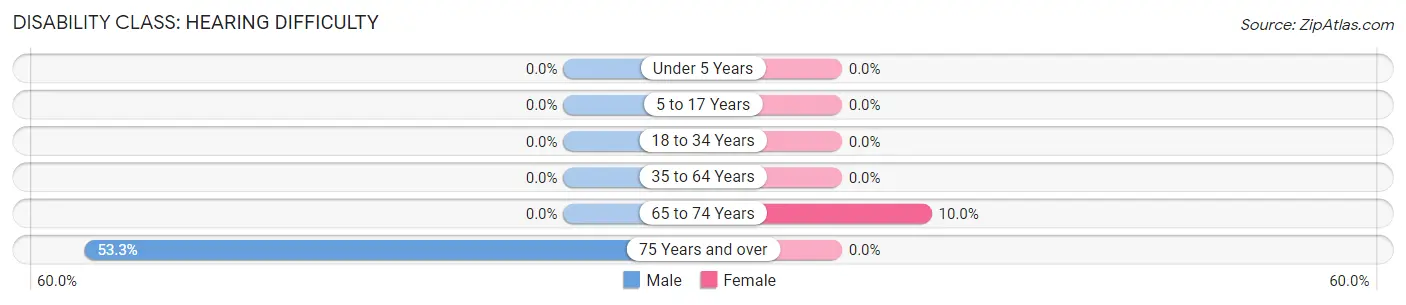
| Age Bracket | Male | Female |
| Under 5 Years | 0 (0.0%) | 0 (0.0%) |
| 5 to 17 Years | 0 (0.0%) | 0 (0.0%) |
| 18 to 34 Years | 0 (0.0%) | 0 (0.0%) |
| 35 to 64 Years | 0 (0.0%) | 0 (0.0%) |
| 65 to 74 Years | 0 (0.0%) | 5 (10.0%) |
| 75 Years and over | 8 (53.3%) | 0 (0.0%) |
Disability Class: Vision Difficulty
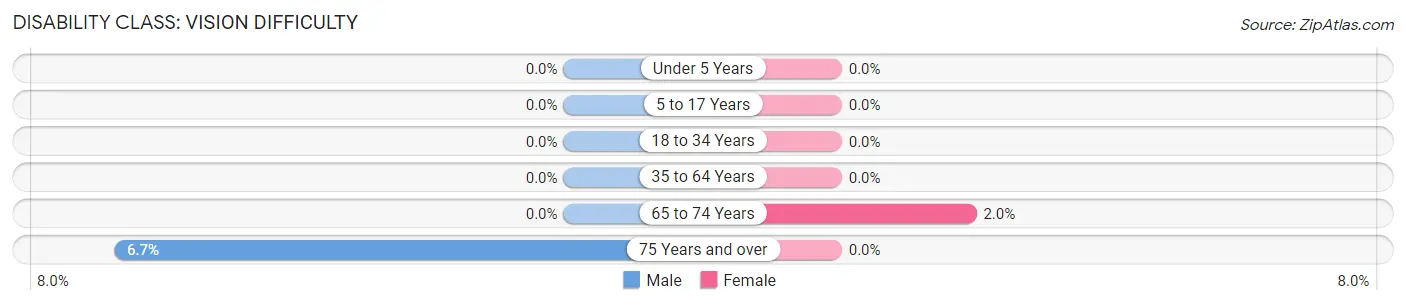
| Age Bracket | Male | Female |
| Under 5 Years | 0 (0.0%) | 0 (0.0%) |
| 5 to 17 Years | 0 (0.0%) | 0 (0.0%) |
| 18 to 34 Years | 0 (0.0%) | 0 (0.0%) |
| 35 to 64 Years | 0 (0.0%) | 0 (0.0%) |
| 65 to 74 Years | 0 (0.0%) | 1 (2.0%) |
| 75 Years and over | 1 (6.7%) | 0 (0.0%) |
Disability Class: Cognitive Difficulty
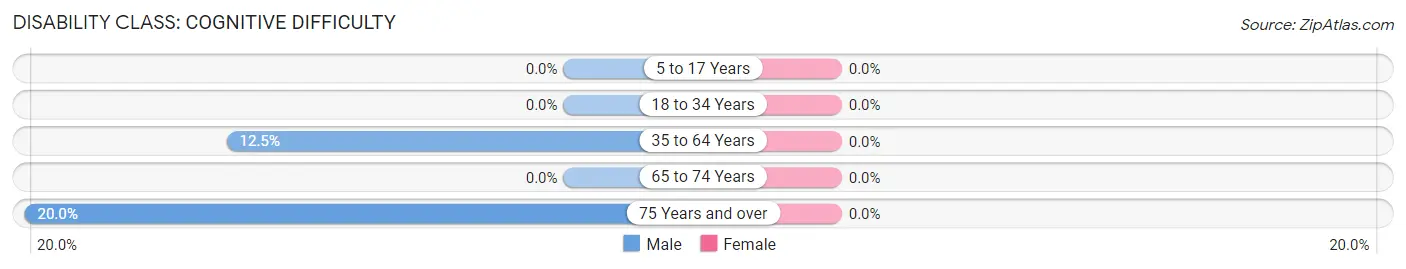
| Age Bracket | Male | Female |
| 5 to 17 Years | 0 (0.0%) | 0 (0.0%) |
| 18 to 34 Years | 0 (0.0%) | 0 (0.0%) |
| 35 to 64 Years | 7 (12.5%) | 0 (0.0%) |
| 65 to 74 Years | 0 (0.0%) | 0 (0.0%) |
| 75 Years and over | 3 (20.0%) | 0 (0.0%) |
Disability Class: Ambulatory Difficulty
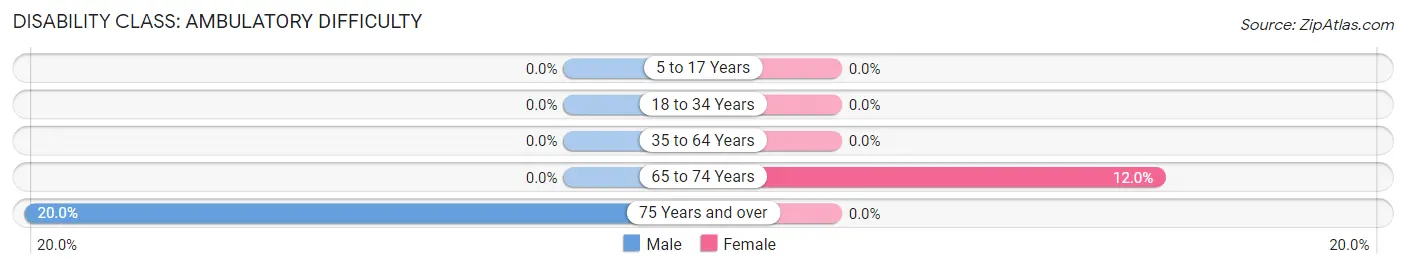
| Age Bracket | Male | Female |
| 5 to 17 Years | 0 (0.0%) | 0 (0.0%) |
| 18 to 34 Years | 0 (0.0%) | 0 (0.0%) |
| 35 to 64 Years | 0 (0.0%) | 0 (0.0%) |
| 65 to 74 Years | 0 (0.0%) | 6 (12.0%) |
| 75 Years and over | 3 (20.0%) | 0 (0.0%) |
Disability Class: Self-Care Difficulty
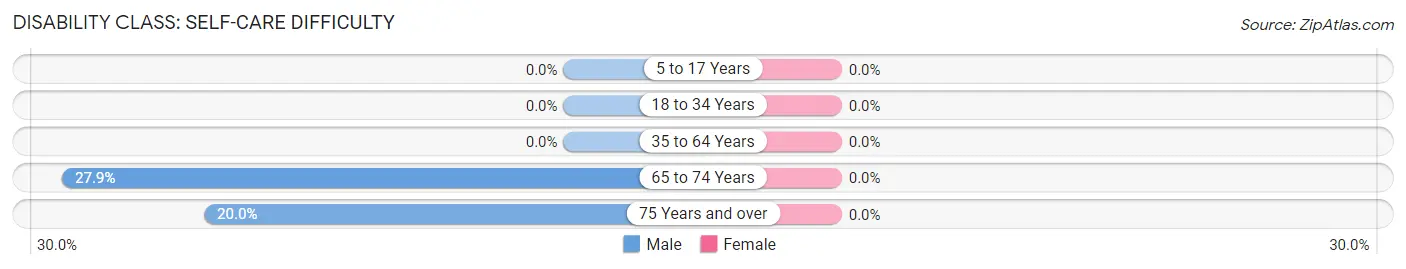
| Age Bracket | Male | Female |
| 5 to 17 Years | 0 (0.0%) | 0 (0.0%) |
| 18 to 34 Years | 0 (0.0%) | 0 (0.0%) |
| 35 to 64 Years | 0 (0.0%) | 0 (0.0%) |
| 65 to 74 Years | 12 (27.9%) | 0 (0.0%) |
| 75 Years and over | 3 (20.0%) | 0 (0.0%) |
Technology Access in Ellicottville
Computing Device Access in Ellicottville
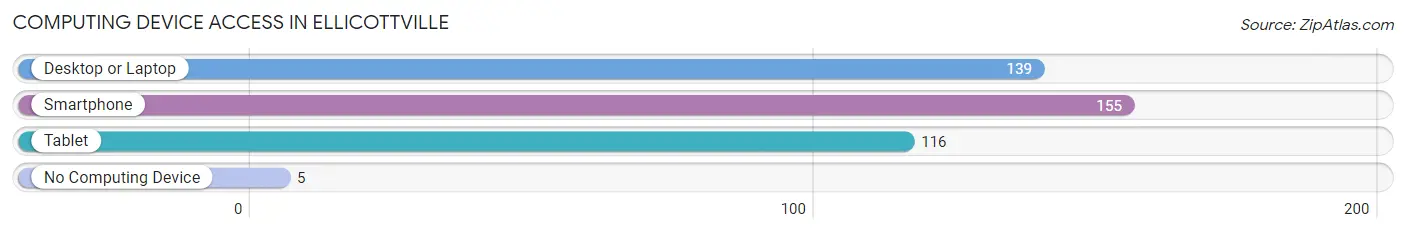
| Device Type | # Households | % Households |
| Desktop or Laptop | 139 | 85.3% |
| Smartphone | 155 | 95.1% |
| Tablet | 116 | 71.2% |
| No Computing Device | 5 | 3.1% |
| Total | 163 | 100.0% |
Internet Access in Ellicottville
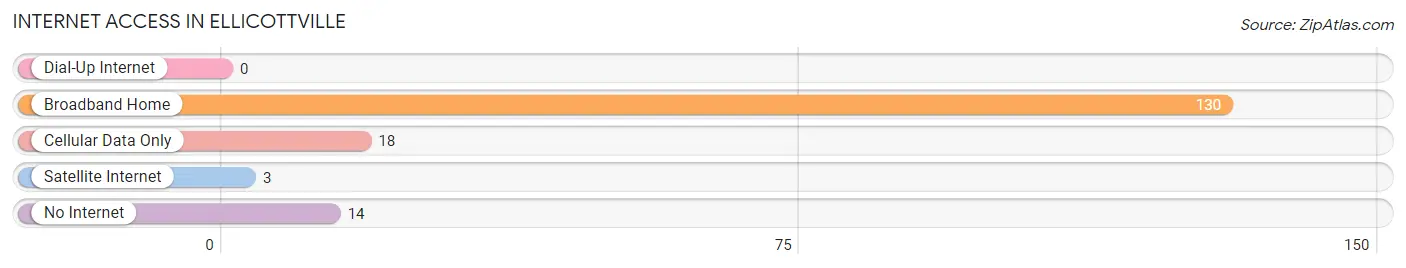
| Internet Type | # Households | % Households |
| Dial-Up Internet | 0 | 0.0% |
| Broadband Home | 130 | 79.7% |
| Cellular Data Only | 18 | 11.0% |
| Satellite Internet | 3 | 1.8% |
| No Internet | 14 | 8.6% |
| Total | 163 | 100.0% |
Ellicottville Summary
Ellicottville, NY is a small village located in the western part of New York State, in Cattaraugus County. It is situated in the foothills of the Allegheny Mountains, and is a popular tourist destination for skiing, snowboarding, and other outdoor activities. The village has a population of 1,541 as of the 2010 census, and is the county seat of Cattaraugus County.
History
The area that is now Ellicottville was first settled in 1806 by Joseph Ellicott, a surveyor for the Holland Land Company. Ellicott had been sent to survey the area and to lay out a village, which he named Ellicottville. The village was incorporated in 1832, and the first post office was established in 1837.
In the late 19th century, Ellicottville became a popular tourist destination, due to its proximity to the Allegheny Mountains and its natural beauty. The village was home to several resorts, including the Ellicottville Inn, which was built in 1845. The Ellicottville Inn was a popular destination for wealthy New Yorkers, who would come to the village to escape the summer heat.
In the early 20th century, Ellicottville became a popular ski destination. The first ski lift was built in the village in 1936, and the first ski resort, Holiday Valley, opened in 1966. Today, Ellicottville is a popular destination for skiing, snowboarding, and other outdoor activities.
Geography
Ellicottville is located in the western part of New York State, in Cattaraugus County. It is situated in the foothills of the Allegheny Mountains, and is bordered by the towns of Mansfield, Great Valley, and Franklinville. The village is located at an elevation of 1,845 feet (562 m), and has a total area of 1.2 square miles (3.2 km2).
Economy
Ellicottville’s economy is largely based on tourism. The village is a popular destination for skiing, snowboarding, and other outdoor activities. The village is also home to several restaurants, bars, and shops, which cater to tourists and locals alike.
The village is also home to several manufacturing companies, including Ellicottville Brewing Company, which produces craft beer, and Ellicottville Woodworking, which produces furniture and other wood products.
Demographics
As of the 2010 census, Ellicottville had a population of 1,541. The racial makeup of the village was 97.2% White, 0.7% African American, 0.3% Native American, 0.3% Asian, 0.2% from other races, and 1.5% from two or more races. Hispanic or Latino of any race were 1.2% of the population.
The median income for a household in the village was $41,250, and the median income for a family was $50,000. The per capita income for the village was $22,845. About 8.2% of families and 11.2% of the population were below the poverty line, including 16.2% of those under age 18 and 5.2% of those age 65 or over.
Common Questions
What is Per Capita Income in Ellicottville?
Per Capita income in Ellicottville is $49,733.
What is the Median Family Income in Ellicottville?
Median Family Income in Ellicottville is $93,750.
What is the Median Household income in Ellicottville?
Median Household Income in Ellicottville is $88,646.
What is Income or Wage Gap in Ellicottville?
Income or Wage Gap in Ellicottville is 25.0%.
Women in Ellicottville earn 75.0 cents for every dollar earned by a man.
What is Inequality or Gini Index in Ellicottville?
Inequality or Gini Index in Ellicottville is 0.35.
What is the Total Population of Ellicottville?
Total Population of Ellicottville is 374.
What is the Total Male Population of Ellicottville?
Total Male Population of Ellicottville is 210.
What is the Total Female Population of Ellicottville?
Total Female Population of Ellicottville is 164.
What is the Ratio of Males per 100 Females in Ellicottville?
There are 128.05 Males per 100 Females in Ellicottville.
What is the Ratio of Females per 100 Males in Ellicottville?
There are 78.10 Females per 100 Males in Ellicottville.
What is the Median Population Age in Ellicottville?
Median Population Age in Ellicottville is 41.7 Years.
What is the Average Family Size in Ellicottville
Average Family Size in Ellicottville is 2.6 People.
What is the Average Household Size in Ellicottville
Average Household Size in Ellicottville is 2.3 People.
How Large is the Labor Force in Ellicottville?
There are 208 People in the Labor Forcein in Ellicottville.
What is the Percentage of People in the Labor Force in Ellicottville?
67.3% of People are in the Labor Force in Ellicottville.
What is the Unemployment Rate in Ellicottville?
Unemployment Rate in Ellicottville is 8.7%.